Relationship between Pine Wilt Disease Outbreaks and Climatic Variables in the Three Gorges Reservoir Region

1
Department of Forest Conservation, College of Forestry, Shanxi Agricultural University, Taigu 030801, China
2
Shanxi Dangerous Forest Pest Inspection and Identification Center, Taigu 030801, China
3
Beijing Key Laboratory for Forest Pest Control, College of Forestry, Beijing Forestry University, Beijing 100083, China
*
Author to whom correspondence should be addressed.
Forests 2019, 10(9), 816; https://doi.org/10.3390/f10090816
Submission received: 16 August 2019
/
Revised: 6 September 2019
/
Accepted: 18 September 2019
/
Published: 19 September 2019
(This article belongs to the Special Issue Forest Health: Fungal and Insect Ecology)
Abstract
:Outbreaks of pine wilt disease (PWD, caused by the pinewood nematode Bursaphelenchus xylophilus), have caused mass mortality of the genus Pinus in Eurasia. Climate change may greatly influence the distribution and population dynamics of longhorn beetles of the genus Monochamus (the main vector of B. xylophilus), the survival and development of B. xylophilus, and the resistance of pines. The aim of this study was to investigate the effect of climatic variables associated with extensive PWD outbreaks in Masson pine (Pinus massoniana Lamb.) forest across the eastern part of the Three Gorges Reservoir region. Since its discovery in 2006, the most serious PWD outbreak occurred from 2014 to 2018; the most striking characteristic of this outbreak is the consistent increase in Masson pine mortality and extent of the affected areas. Moreover, 28 out of 46 PWD biological relevant climatic variables were selected and used for redundancy analysis. The ordination biplots reflect the complicated quantitative relationship between the PWD epidemic variables and the biologically relevant climatic variables of temperature, precipitation, relative humidity, and wind speed. The results will be useful for understanding the role climatic variables play in PWD outbreaks, for predicting the spread and pattern of PWD outbreaks, and for the advance preparation of management strategies with the purpose of preventing future PWD outbreaks.
1. Introduction
Climate change has gradually become one of the most serious challenges facing the sustainable development of human society. According to the scenario of the Intergovernmental Panel on Climate Change (IPCC), average global temperatures have increased by 0.85 °C in the past few decades and the mean global temperature is predicted to rise 1.1–6.4 °C at the end of the twenty-first century [1]. Climate changes have altered the distribution pattern of major forest insects and diseases worldwide and have increased the extent of damage to forest resources [2,3,4]. Insects are typically ectothermic species and quite sensitive to changes in climatic factors, especially temperature and precipitation, which influence almost all aspects of insect history and population processes [5,6,7,8,9]. Meanwhile, the fluctuations and increases of temperature in the context of global warming would directly affect the development rate, metabolic rate, survival, range, and other life activities of complicated vector-borne disease systems [8,10,11]. Additionally, it has also been suggested that climate change may have a negative impact on the growth of host trees [4,12,13]. Higher temperatures and water stress associated with drought conditions may negatively affect the physiological processes and defense systems of trees, leading to increased mortality rates [14,15,16]. However, as climate change becomes more and more serious, it is difficult to predict the effect of non-native pests on forests [17]. Therefore, understanding and managing the effects of climate change on important invasive forest insects and diseases are major challenges [18].
Pine wilt disease (PWD), which is caused by the pinewood nematode Bursaphelenchus xylophilus (Steiner and Bhrer) Nickle (Nematoda: Aphelenchoididae), is one of the most devastating insect vector-borne diseases of trees in the world. The main vector of B. xylophilus are longhorn beetles of the genus Monochamus (Coleoptera, Cerambycidae) [19]. B. xylophilus is an eruptive and landscape altering invasive alien species that is responsible for the mass mortality of the genus Pinus in Eurasia, mainly including China, Japan, Korea, Spain, and Portugal [20,21]. However, it has not been identified as a major forest threat and has not led to widespread mortality in pine forests within its native range in North America (from Canada to Mexico) [22,23,24]. In China, PWD was first discovered in forty 30 to 60 year-old Japanese black pine (Pinus thunbergii Parl.) trees in 1982 at Sun Yat-sen’s Mausoleum in Nanjing [20]. Since then, there has been a rapid expansion in the occurrence of PWD in China. The continuous occurrence, spread, and damage caused since PWD was discovered in China has led to B. xylophilus being identified as a leading forest pest in China [25,26]. Unfortunately, up to the beginning of 2019, B. xylophilus had spread to 18 provinces and 588 counties across China; outbreaks in 78 counties were reported in 2017, and in 283 new counties in 2018 [27].
Temperature is the most important climatic factor affecting the complicated PWD system [10,20,28]. Widespread transmission of B. xylophilus usually occurs in the summer dry season; maximum growth rates of B. xylophilus occur at temperatures of around 28–29 °C, and growth rates are very low when the mean temperature is lower than 10 °C [13,29,30]. The distribution of the vector Monochamus species is also affected by temperature, especially by low winter temperatures that control the survival rate of the overwintering fifth-instar larvae [10]. The pine sawyer beetle (PSB; Monochamus alternatus) is a particularly important vector of B. xylophilus. In China, the optimum temperature range for PSB hatching is between 19–28 °C and at least 1200 degree-days are required for the development of PSB eggs to adults. At least 350 degree-days are required throughout the growing season for 50% egg hatch [20].
Few studies have reported the direct or indirect effects of other climatic variables (including precipitation, relative humidity, and wind speed) on the process of the PWD system. Cumulative precipitation is an important factor affecting growth and the physiological and biochemical activities of host trees, especially in arid and semi-arid conditions [13,31,32,33]. Excessive precipitation significantly affects the flight performance and feeding capacity of the vector insects [10,11,20]. Relative humidity increases from March to May and is positively correlated with PWD outbreaks [10]. The flight capacity of PSB can also be significantly affected by wind speed; higher mean monthly wind speeds facilitate the spread and diffusion of the vector insect over long distances [20].
Previous studies have used temperature (such as isotherm approaches and primary temperature-related variables) to estimate and forecast the risk and distribution of PWD in different regions [4,10,13,34,35]. Using the average monthly mean temperatures of the warmest three months, the MaxEnt model was applied to evaluate the risk of PWD expression at a global scale [4]. There is a crucial need to understand the association between PWD outbreak epidemic variables and not only the temperature, but also the precipitation, relative humidity, and wind speed. Moreover, identifying the quantitative relationship between climatic variables and PWD epidemic variables is essential to estimate the potential risk of PWD under future climate changes.
To address these issues, a study of the patterns of the PWD outbreak (2006–2018) variables and primary biologically relevant climatic variables was conducted in the eastern part of the Three Gorges Reservoir region of China. First, the patterns of the PWD epidemic variables were analyzed during outbreaks. Then, we refined the possible association of short-term variability of several PWD biological-relevant climatic variables with the occurrence of PWD outbreak.
2. Materials and Methods
2.1. Study Location
An area of approximately 342,400 ha (latitude 30°32′–31°28′ N, longitude 110°51′–111°39′ E) was selected in the eastern part of the Three Gorges Reservoir region containing the demarcation point of the upper and middle reaches of the Yangtze River. Masson pine (Pinus massoniana Lamb.) is a primary host of B. xylophilus, and is distributed widely in the study area. Before the invasion of B. xylophilus, Masson pine was the dominant species in the tree layer [26]. In this area, B. xylophilus was first detected in Masson pine in 2006; since then, this pest has spread rapidly and is now present throughout the region.
2.2. Pine Wilt Disease Datasets
Four PWD epidemic variables including the number of PWD damaged blocks (DB, range 50–200 ha), the number of PWD damaged sites (DS, range 1–5 ha), total area with PWD damage (DA), and mortality, measured as the number of Masson pines killed by PWD (Mor), for the period from 2006 to 2018 were selected and obtained from the Station of Pest and Disease Control and Quarantine of Yiling district, Hubei Province. The four epidemic variables quantified the progression of PWD outbreak from lower to higher levels of B. xylophilus activity in each year.
2.3. Climatic Datasets
A set of climate variables, assumed to be biologically important for the outbreak of PWD and representing temperature, precipitation, relative humidity, and wind speed, were selected to assess their association with the incidence of PWD outbreaks in the study area from 2006 to 2018 (Table 1). The climatic data were obtained from the China National Meteorological Information Center (CNMIC).
2.4. Data Analysis
Pearson’s correlation coefficient was used to analyze the correlation of different PWD epidemic variables in outbreak years (2006–2018) using SPSS 22.0 software (IBM, Armonk, NY, USA). Principal component analysis (PCA) was conducted using CANOCO 5.0 (Microcomputer Power, Ithaca, NY, USA) to determine the importance of different PWD epidemic variables in each year from 2006 to 2018.
The ordination of PWD epidemic variables along a series of biologically relevant climatic variables from 2006 to 2018 were analyzed using redundancy analysis (RDA), which is a constrained linear form of PCA based on Euclidean distance; the analysis was performed using CANOCO 5.0 [44]. The PWD epidemic variables from 2006 to 2018 data were used as individual response variables and subjected to logarithm transitions before the ordination of RDA [26]. Based on a Monte Carlo permutation test with 499 iterations, 28 out of 46 biologically relevant climatic variables were selected through the forward selection procedure in CANOCO 5.0. Results for the selected variables were plotted on a graph using CANOCO 5.0.
3. Results
3.1. Overview of Pine Wilt Disease Outbreak
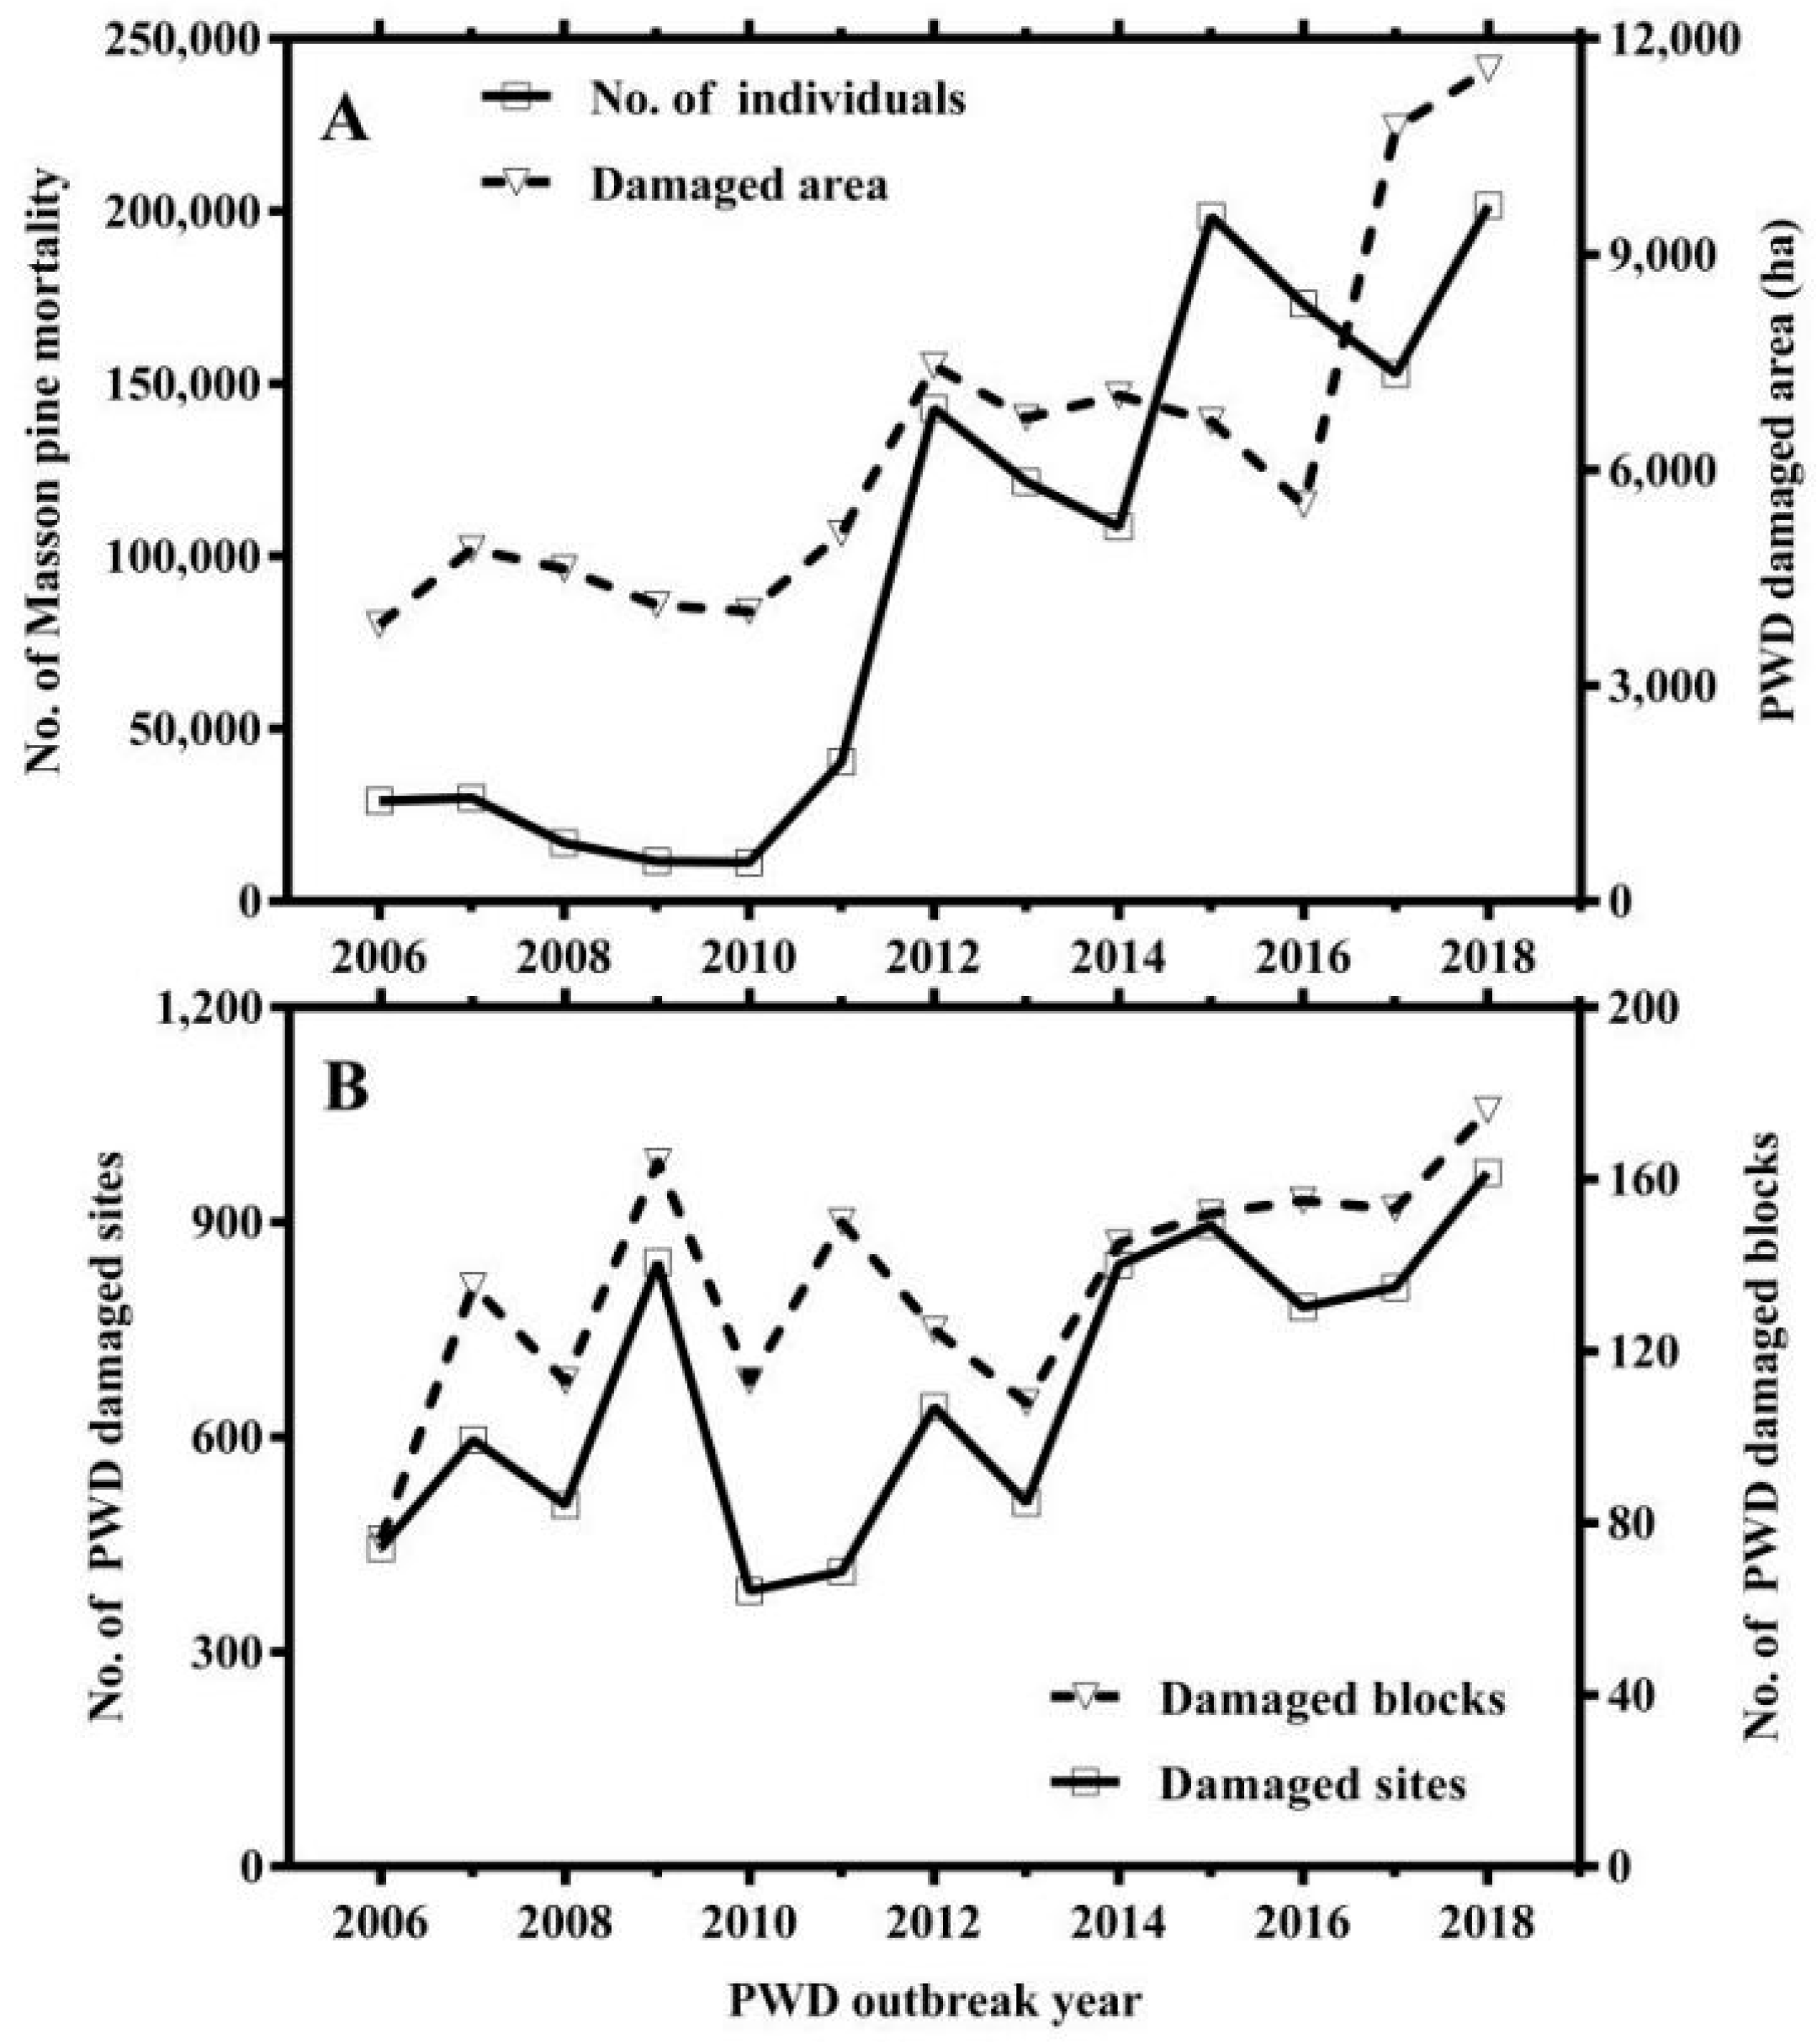
Overall, the mortality rates and damaged areas of Masson pine continuously increased during the period from 2006 to 2018, but there was no significant change in the number of damaged blocks and damaged sites (Figure 1). The mortality rates were positively correlated with the PWD outbreak area; PWD damaged blocks more strongly correlated with PWD damaged sites (Table 2). The correlation between other PWD epidemic variables was not significant. The PCA ordination biplot of four PWD epidemic variables from 2006 to 2018 are shown in Figure 2. All of the epidemic variables showed higher values and were positively associated with the year from 2014 to 2018, but were negatively associated with the years 2007, 2008, 2010, and 2011.
3.2. Ordination of PWD Variables and Climatic Variables
The RDA ordination biplot for the temperature variables is presented in Figure 3. MTautumn, MTsummer, MTOpt, T10–15, and TOpt were found to contribute significantly to the distribution, while the other seven temperature variables were not significantly related with this ordination (Table 3). Nearly all variation (sum of all canonical eigenvalues, Table 4) can be explained through the ordination by the 12 selected temperature variables. According to the RDA ordination, MTOpt, TOpt, and MT19–28 are positively correlated with the PWD epidemic variables. Min temp, MTsummer, MTautumn, TUnfav, T28, and T0 were negatively correlated with the extent of Masson pine mortality and damaged area. In addition, the quantity of damaged blocks and damaged sites expressed a clear separate group, which revealed a significant positive correlation with MTOpt and T19–28, but inversely proportionally correlated with T35, T10–15, MT10–15, MTsummer, T28, and T0.
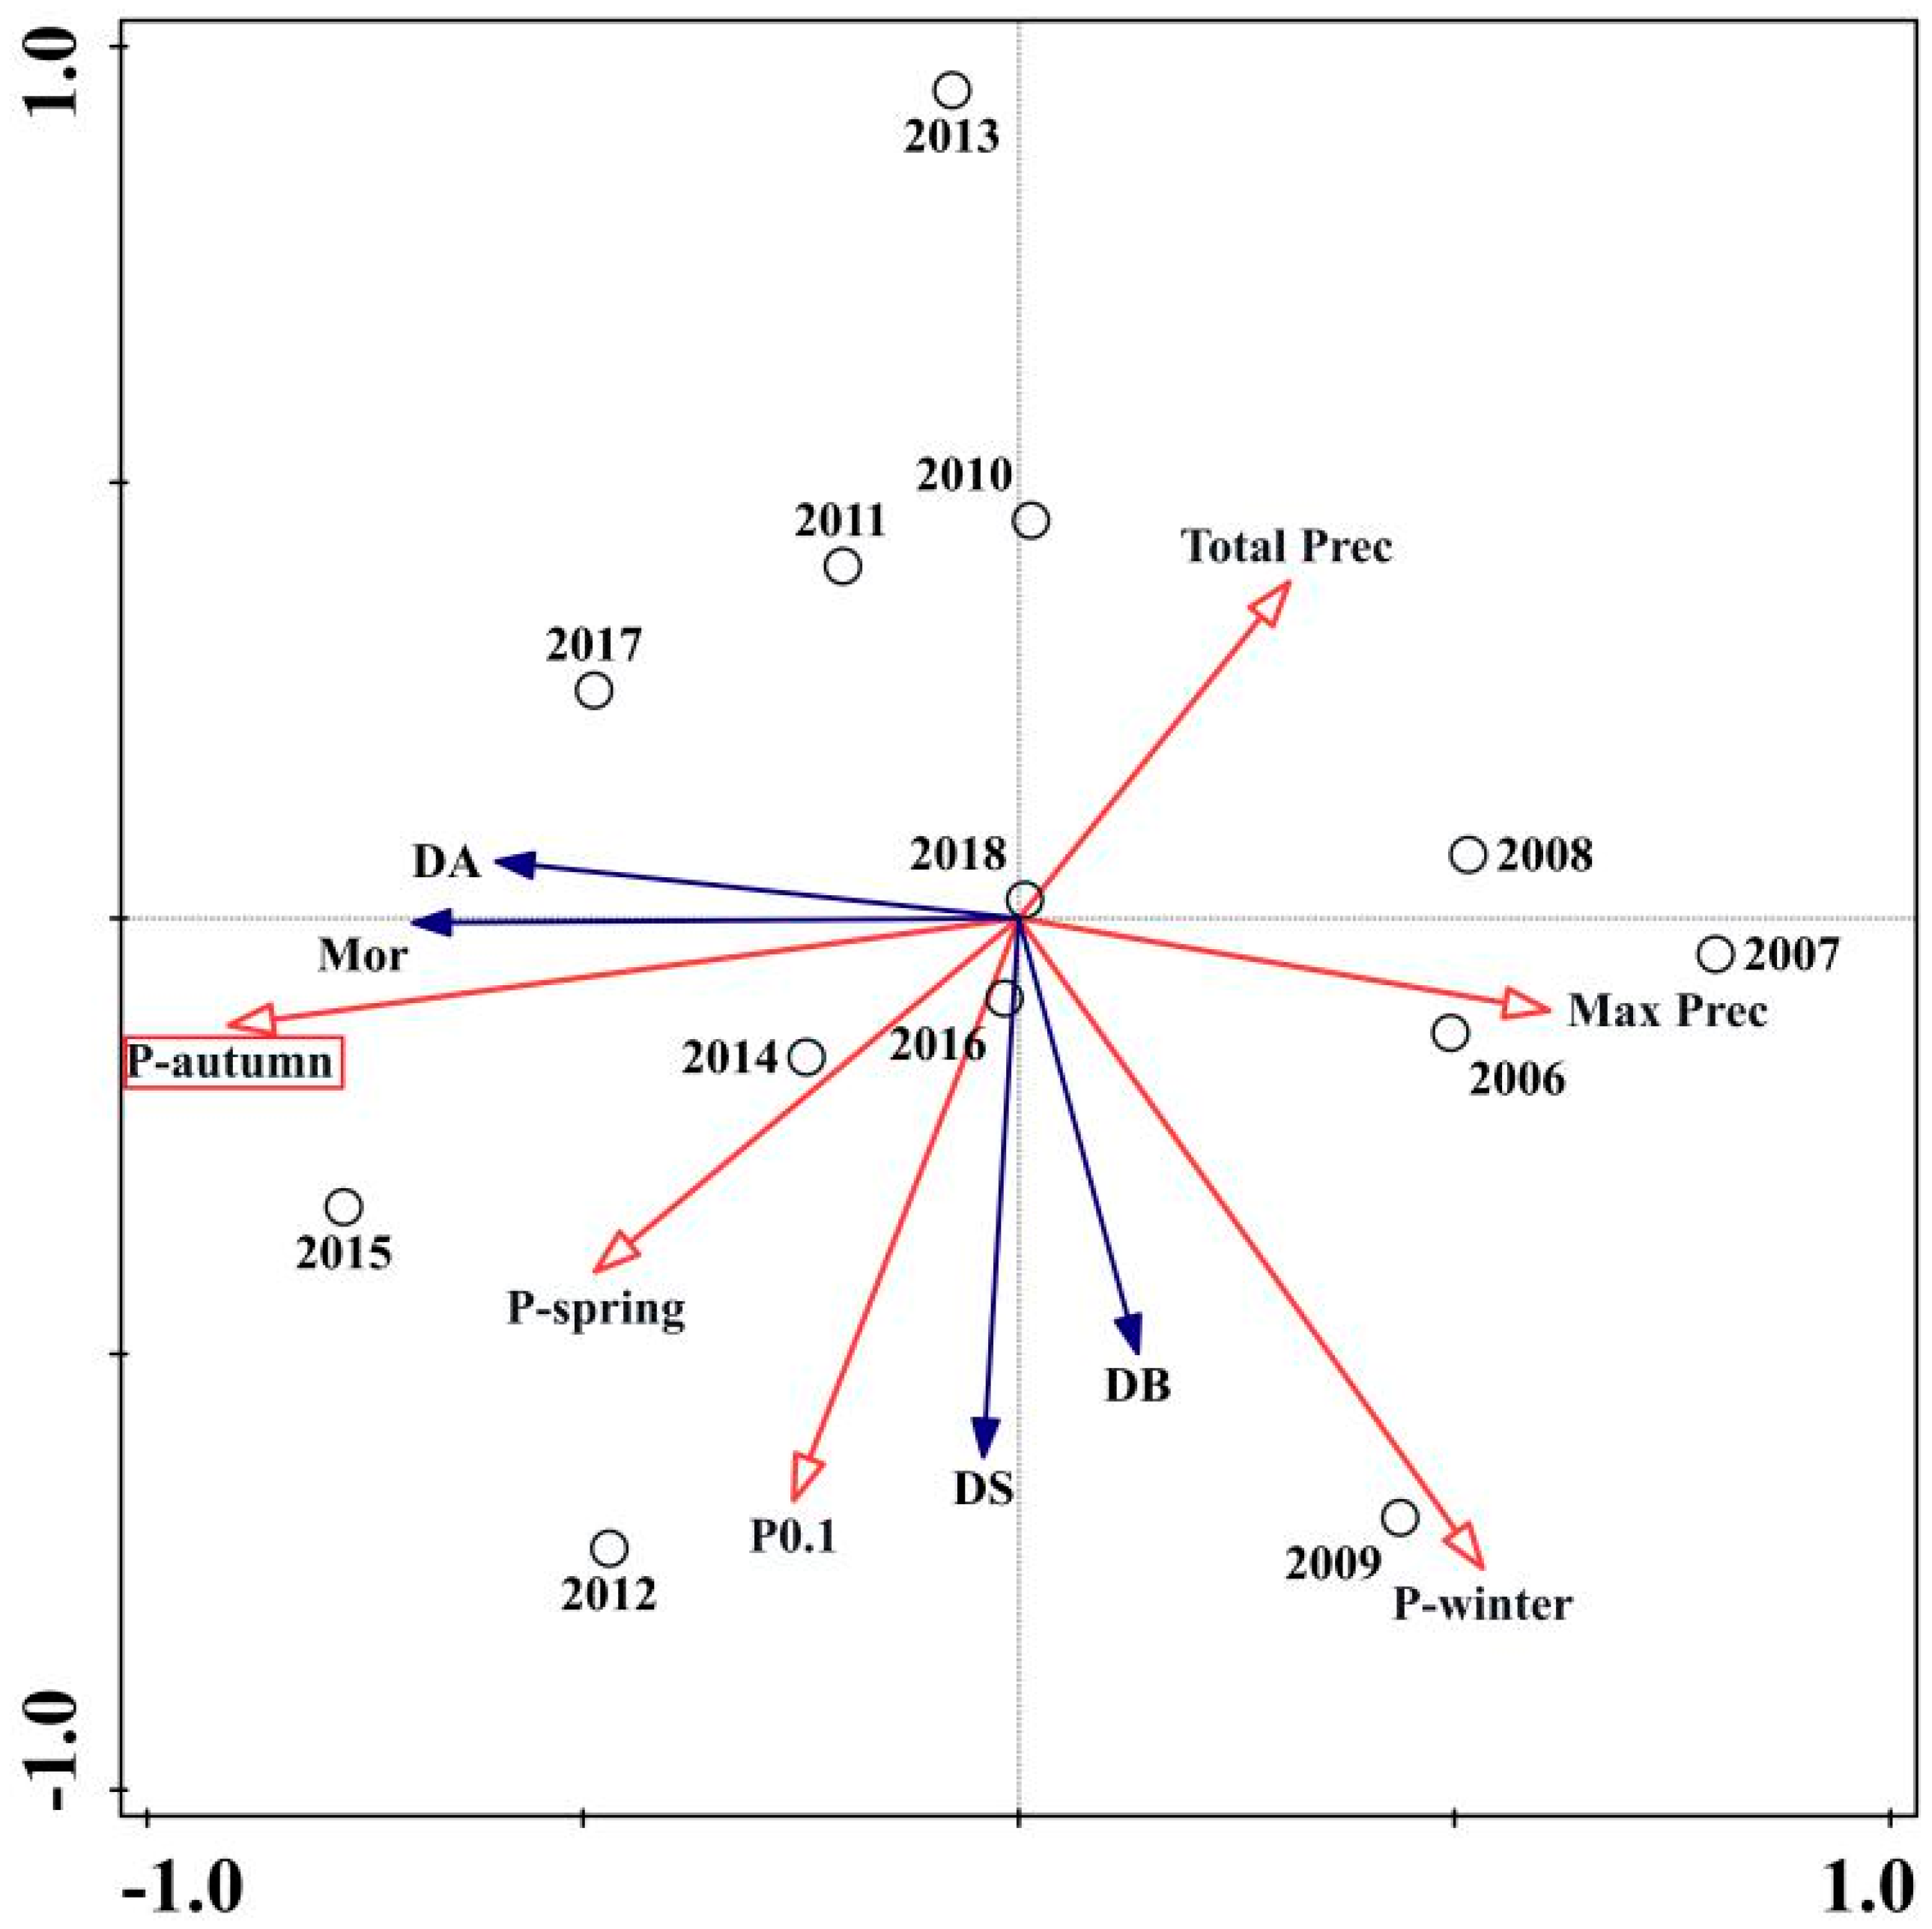
The RDA ordination biplot for the precipitation variables is presented in Figure 4. Pautumn (contribution = 75.5%, p < 0.05) was the most important explanatory variables (Table 3). The four PWD epidemic variables were positively correlated with Pspring, Pautumn, and P0.1 and simultaneously inversely proportional with Max prec and Total prec during the PWD life cycle. Moreover, the presence of damaged blocks and damaged sites was positively correlated with Pwinter, but the mortality rates and damaged area were negatively correlated with precipitation in the winter quarter.
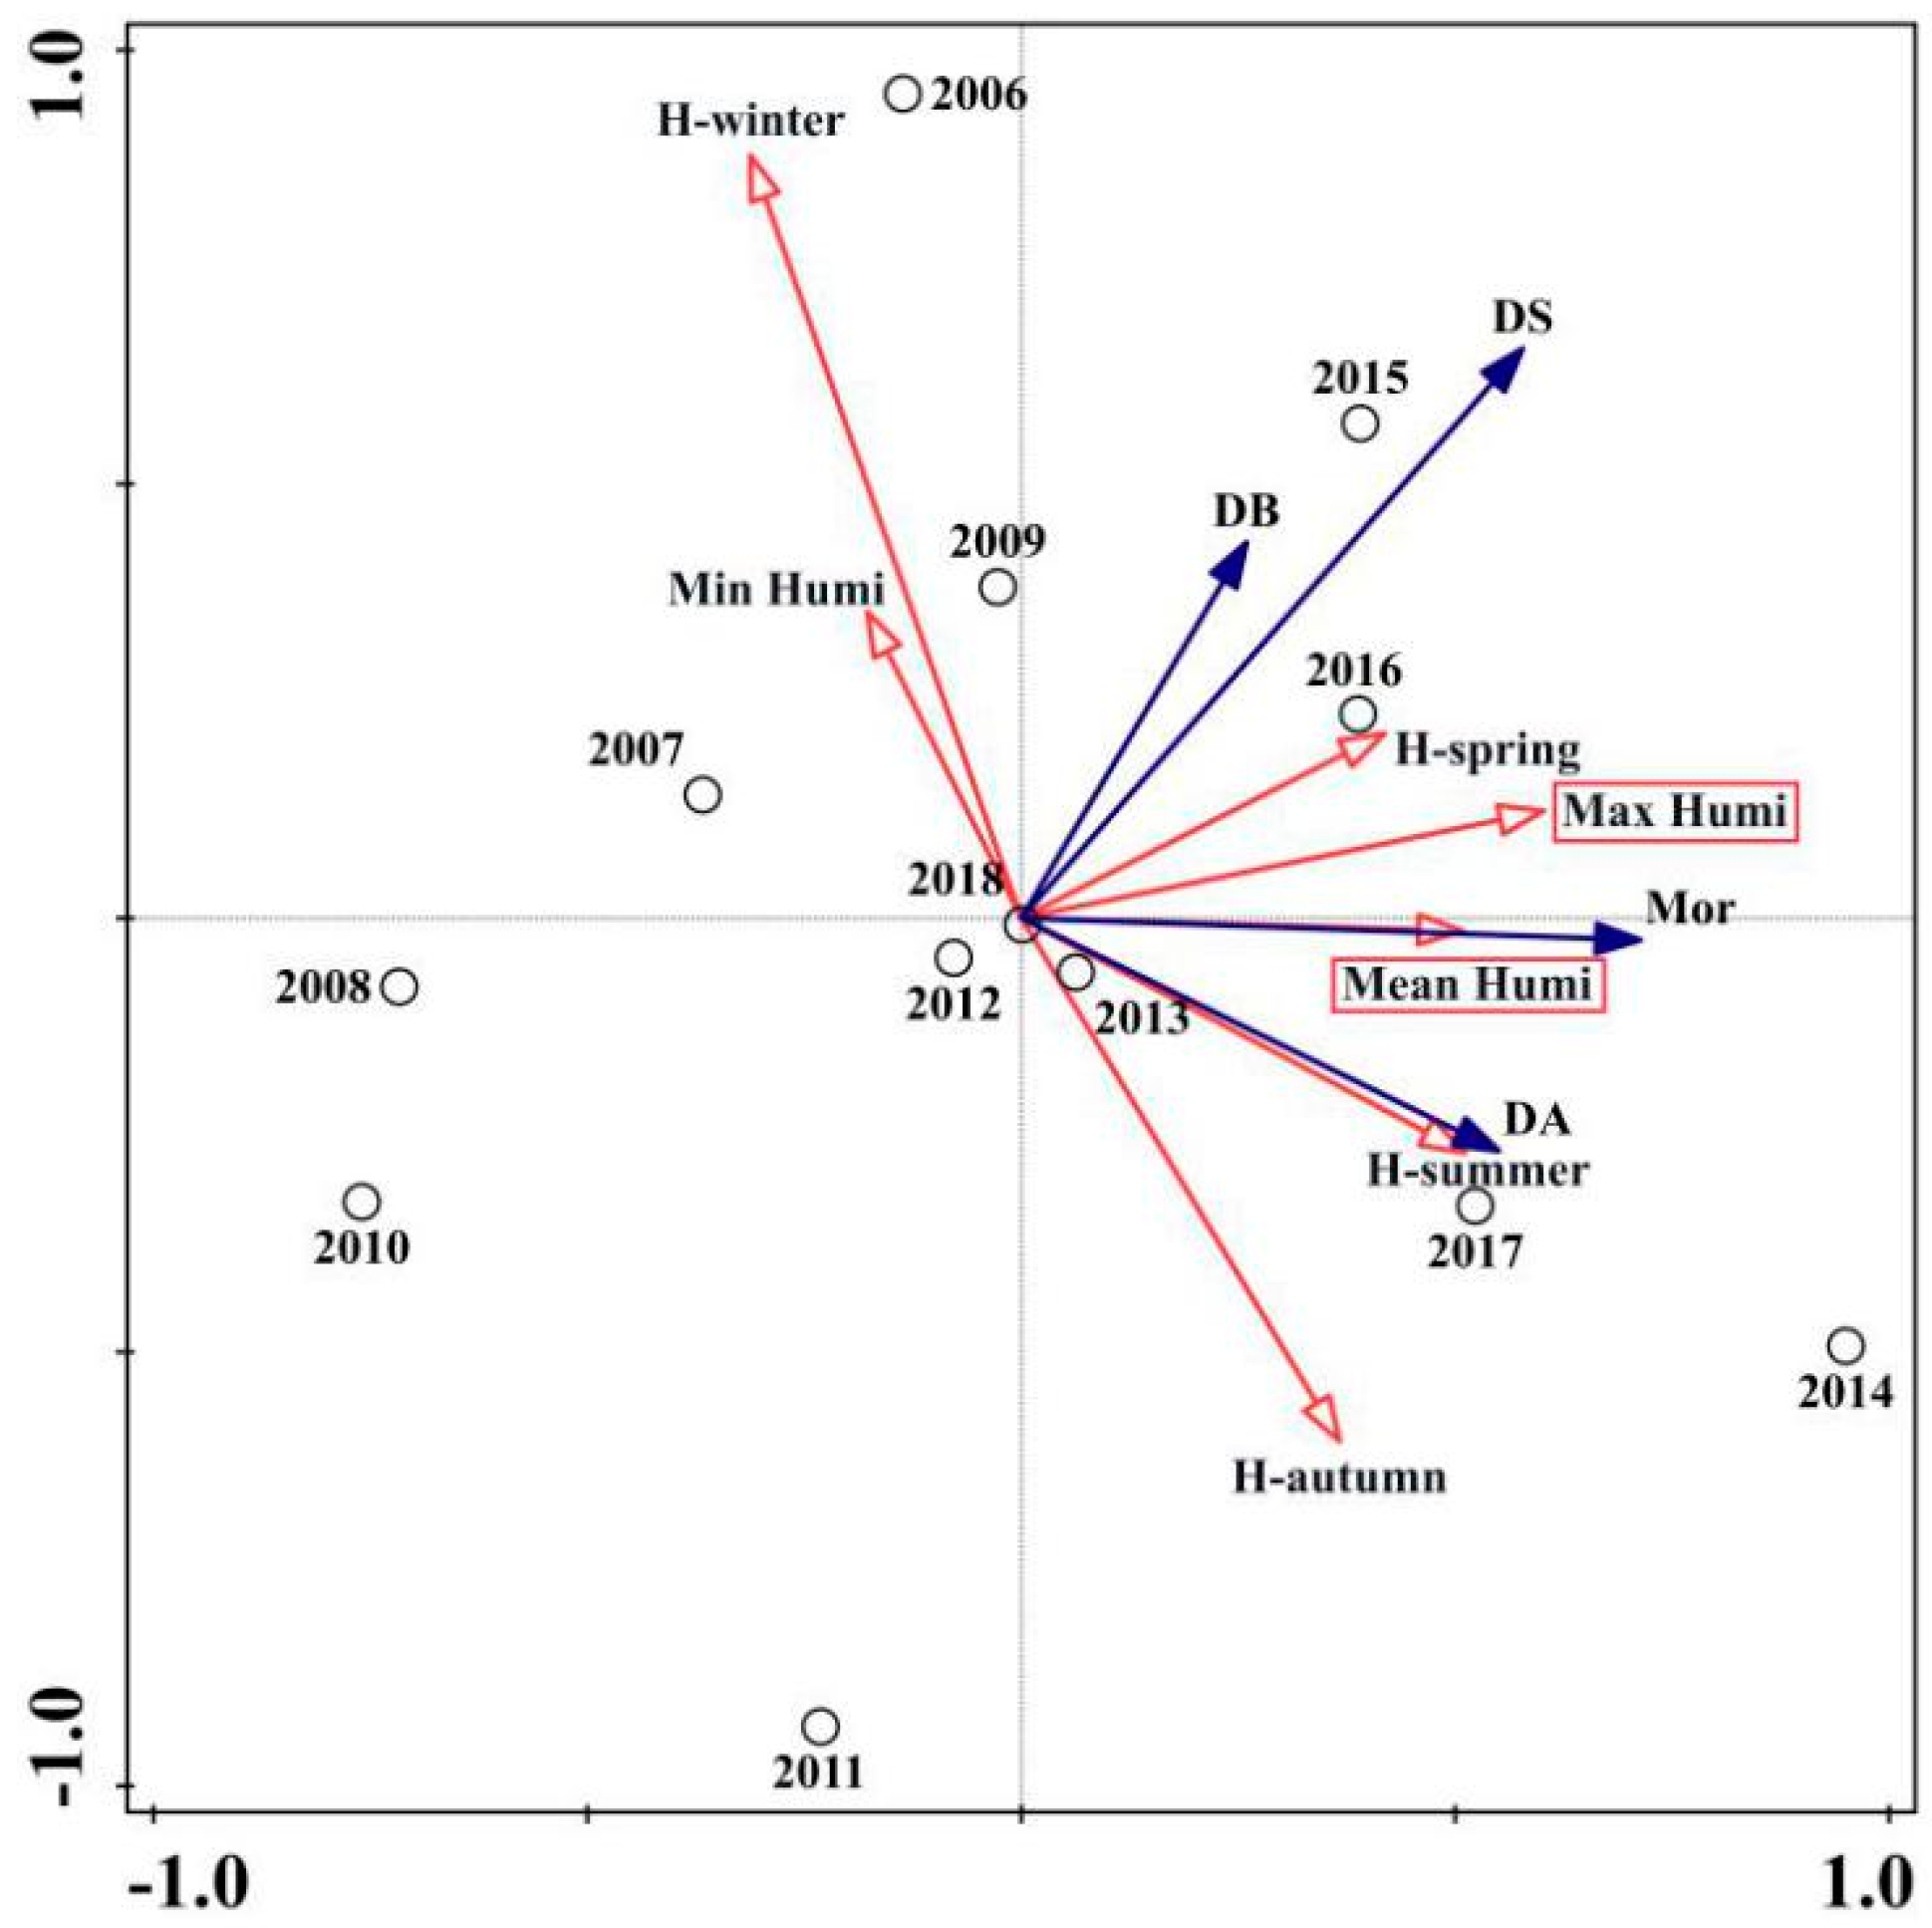
The RDA ordination biplot for the relative humidity variables is presented in Figure 5. Max humi (contribution = 33.1%, p < 0.01) and Mean humi (contribution = 14.1%, p < 0.05) were the most important relative humidity variables (Table 3). The impact of Max humi could be considered as an equally important factor as Hspring for the four PWD variables. Hsummer and Mean humi during the PWD life cycle significantly influenced the extent of the Masson pine mortality and damaged area. There was a positive correlation between the mortality rates and damaged area and Hautumn and a negative correlation with Hwinter and Min humi during the PWD life cycle.
The RDA ordination biplot for the wind speed variables is presented in Figure 6. The plot is characterized by the dominance of Mean wind (contribution = 63.7%, p < 0.05, Table 4) and indicates that higher wind factors clearly increase the amount of damaged blocks and damaged sites. From the ordination graph, we know that the mortality rates and extent of the damaged area were positively correlated with the Max wind and Mean wind, but negatively correlated with the Ext wind.
4. Discussion
The PCA ordination clearly indicated that the most serious PWD damage occurred from 2014 to 2018, with more damaged blocks and damaged sites in 2014 and higher mortality and more extensive damaged areas in 2016 and 2017. This shows that the occurrence of PWD is becoming more and more serious in the Three Gorges Reservoir region. Our results also revealed that the PWD outbreak is continuing, and the mortality rates and the extent of the damaged areas are increasing, even though there was no significant change in the number of damaged blocks and damaged sites. Therefore, if it is not possible to implement effective measures to prevent future PWD outbreaks, Masson pine mortality and the extent of the damaged areas will most likely continue to increase. These results indicated that B. xylophilus is an eruptive and landscape-altering invasive alien species. B. xylophilus populations can rapidly colonize Masson pine forests and are responsible for the mass mortality of host trees in a newly invasive area [20]. Furthermore, this disease may potentially have a profound effect on forest carbon sequestration in the pine forest ecosystem as well as play a critical role in shaping forest structure and composition [45,46].
In order to examine the relationship between climatic variables and PWD caused epidemic variables, 28 out of 46 PWD biological relevant climatic variables were selected through the forward selection procedure before RDA ordination (Table 4). For the temperature variable RDA ordination, MTautumu, MTsummer, MTOpt, T10–15, and TOpt were found to be significantly related with the four epidemic variables. These can be considered as the key temperature variables during PWD outbreak years. This result is in accordance with former studies indicating that the optimum temperature range for PWD development is between 10 and 25 °C [10,40]. The studies also indicated that when the average summer temperature is over 25 °C for more than 55 days, a serious PWD situation would happen in this area [25]. Moreover, a temperature range of 10–15 °C from October to December provide a relatively cold condition, which is necessary for the growth and development of pine sawyer beetle larva [20]. According to the RDA ordination, MTOpt, TOpt, and MT19–28 were positively correlated with PWD epidemic variables. On the contrary, higher values of MTsummer, T28, MTautumn, and T0 can suppress the occurrence of PWD outbreaks. Other studies have also reported that high summer temperatures negatively affect pinewood nematode development (above 28 °C) as well as nematode reproductive processes (above 35 °C) [40,41]. The development rate of vector beetles will significantly decrease when the temperature is above 30 °C and the lethal upper threshold is considered to be between 32 and 35 °C [28,47]. Furthermore, lower temperature barriers also limit the occurrence of PWD. For instance, B. xylophilus cannot get enough effective accumulated temperature when the mean temperature is lower than 10 °C; the survival rate of the vector Monochamus species overwintering larvae will significantly decrease when the winter temperature is lower than 0 °C [10].
The fluctuation of precipitation directly affects the complicated PWD system [13]. Figure 5 shows that total precipitation and maximum daily precipitation significantly suppress the development of PWD. This is mainly because higher precipitation conditions usually makes the PSB under a state of rest, which significantly decrease the activities of PSB and decrease the spread and diffusion of B. xylophilus over long distances [20,28]. The mortality rate of the genus Monochamus can remarkably increase when there is more rainfall during the emergence period of PSB, especially in June and July [48]. Additionally, Pspring, Pautumn, and P0.1 were positively correlated with PWD epidemic variables, which means that higher values of these variables can accelerate the extent of the damaged area. This outcome has also been confirmed by other studies: as a sun-loving and drought-resistant plant, too much rainfall in spring and winter can decrease the vigor of Masson pine trees, which provide favorable conditions for the invasion of B. xylophilus [10,42,48].
According to Figure 6, the selected relative humidity variables were positively correlated with all or some of the PWD epidemic variables. The longevity of PSB is remarkably influenced by relative humidity [28,43]. The eclosion rate of the vector genus Monochamus and population density of B. xylophilus will dramatically increase if the air relative humidity range is between 70% and 85% [48]. Other studies have also confirmed that high values of relative humidity from March to May can significantly promote the damage extent of PWD [10]. Furthermore, wind speed is a key factor influencing the flight capacity of PSB even though this beetle is good at flying and is capable of flying longer distances; the mean flight distance is less than 60 m when there is abundant food [10,20]. In our study, monthly mean wind speed (from May to September) was the most important factor affecting PWD epidemic variables, followed by extreme wind speed and maximum wind speed. Zhao et al. also reported that the flight capacity of PSB is significantly affected by wind speed, and higher year monthly wind speed facilitates the spread and diffusion of vector insects over long distances [20].
Temperature increases as a result of climate change could directly affect the performance related traits and extension of PWD damaged areas [7,9,49]. Any slight change in microclimatic conditions can alter the interactions among B. xylophilus, vector insects, and host trees, which may add more complexity to the PWD system [10,13,50]. Future climate change could potentially lead to more serious PWD-related global Pinus forest resource reduction and habitat degradation [4,51]. Previous research has predicted that the area suitable for development and spread of PWD will increase. Some regions including the Aomori Prefecture in Japan, Boryeong, and Yangju in South Korea as well as Shaanxi, Henan, Tianjin, Liaoning Provinces in China, which have previously been considered as unsuitable for the occurrence of PWD, have experienced PWD outbreaks in recent years and devastating damage to the local pine forest resources has been observed [10,27,52,53]. Furthermore, the model predicts that the outbreak of PWD will move forward rapidly to the north and to higher elevations in mountainous areas in Asia, more sinister is that a large area of Europe will become a PWD risk area by 2070 [4]. Another study predicts that the spread speed and degree of PWD to the west and north part of China will significantly increase and that the damaged areas would be about twice as large as the current outbreak by 2100 [54].
5. Conclusions
In conclusion, the most striking characteristic of the PWD outbreak in the research area is the continuing increase in Masson pine mortality and the extent of the damaged areas. Moreover, the study examined the association between PWD outbreak epidemic variables and biological relevant climatic variables including temperature, precipitation, relative humidity, and wind speed. Furthermore, 28 out of 46 PWD biological relevant climatic variables were selected and used for redundancy analysis in this study. The results contribute to the understanding of the complicated quantitative relationship between PWD epidemic variables and biologically relevant climatic variables that affect them. The results may be useful in predicting the potential risk of PWD outbreaks under future climate change, and in the development of policy-making strategies to manage future PWD outbreaks.
Author Contributions
Conceptualization, R.G. and J.S.; Data curation, Z.W. and Y.H.; Formal analysis, H.W.; Writing—original draft preparation, R.G.; Writing—review and editing, J.S.
Funding
This research was funded by the Scientific and Technological Innovation Programs of Higher Education Institutions in Shanxi (Grant No. 2019L0370), the Technology Innovation Fund of Shanxi Agricultural University (Grant No. 2017YJ20), the Excellent PhD Reward Project Fund of Shanxi Province (Grant No. K271799024), and the Special Fund for Forest Scientific Research in the Public Welfare of China (Grant No. 201504304).
Acknowledgments
Special thanks go to the anonymous reviewers for their valuable comments and suggestions. We also thank Dewen Song and Kezhou He for their assistance with the collection of pine wilt disease epidemic data. We used Editage (www.editage.com) for English language editing.
Conflicts of Interest
The authors declare no conflict of interest.
References
- Climate Change 2013. The Physical Science Basis: Working Group I Contribution to the 5th Assessment of the Intergovernmental Panel on Climate Change; Stocker, T.F., Qin, D., Plattner, G.K., Tignor, M.M.B., Allen, S.K., Boschung, J., Nauels, A., Xia, Y., Bex, V., Midgley, P.M., Eds.; Cambridge University Press: Cambridge, UK; New York, NY, USA, 2014. [Google Scholar]
- Walther, G.R.; Roques, A.; Hulme, P.E.; Sykes, M.T.; Pysek, P.; Fuhn, I.; Zobel, M.; Bacher, S.; Dukat, Z.B.; Bugmann, H.; et al. Alien species in a warmer world: Risks and opportunities. Trends Ecol. Evol. 2009, 24, 686–693. [Google Scholar] [CrossRef] [PubMed]
- Jepsen, J.U.; Kapari, L.; Hagen, S.B.; Schott, T.; Vindstad, O.L.; Nilssen, A.C.; Ims, R.A. Rapid northwards expansion of a forest insect pest attributed to spring phenology matching with sub-Arctic birch. Glob. Chang. Biol. 2011, 17, 2071–2083. [Google Scholar] [CrossRef]
- Ikegami, M.; Jenkins, T.A. Estimate global risks of a forest disease under current and future climates using species distribution model and simple thermal model–pine wilt disease as a model case. For. Ecol. Manag. 2018, 409, 343–352. [Google Scholar] [CrossRef]
- Bale, J.S.; Masters, G.J.; Hodkinson, I.D.; Awmack, C.; Bezemer, T.M.; Brown, V.K.; Butterfield, J.; Buse, A.; Coulson, J.C.; Farrar, J.; et al. Herbivory in global climate change research: Direct effects of rising temperature on insect herbivores. Glob. Chang. Biol. 2002, 8, 1–16. [Google Scholar] [CrossRef]
- Tobin, P.C.; Nagarkatti, S.; Loeb, G.; Saunders, M.C. Historical and projected interactions between climate change and insect voltinism in a multivoltine species. Glob. Chang. Biol. 2008, 14, 951–957. [Google Scholar] [CrossRef]
- Kingsolver, J.G.; Ragland, G.J.; Diamond, S.E. Evolution in a constant environment: Thermal fluctuations and thermal sensitivity of laboratory and field populations of Manduca Sexta. Evolution 2009, 63, 537–541. [Google Scholar] [CrossRef]
- Sambaraju, K.R.; Carroll, A.L.; Zhu, J.; Stahl, K.; Moore, R.D.; Aukema, B.H. Climate change could alter the distribution of mountain pine beetle outbreaks in western Canada. Ecography 2012, 35, 211–223. [Google Scholar] [CrossRef]
- Paaijmans, K.P.; Heinig, R.L.; Seliga, R.A.; Blanford, J.I.; Blanford, S.; Murdock, C.C.; Thomas, M.B. Temperature variation makes ectotherms more sensitive to climate change. Glob. Chang. Biol. 2013, 19, 2373–2380. [Google Scholar] [CrossRef] [PubMed] [Green Version]
- Roques, A.; Zhao, L.L.; Sun, J.H.; Robinet, C. Pine wood nematode, pine wilt disease, vector beetle and pine tree: How a multiplayer system could reply to climate change. In Climate Change and Insect Pests; Björkman, C., Niemelä, P., Eds.; CABI publishing: Oxfordshire, UK, 2015; pp. 220–234. ISBN 9781780643786. [Google Scholar]
- David, G.; Giffard, B.; Piou, D.; Roques, A.; Jactel, H. Potential effects of climate warming on the survivorship of adult Monochamus galloprovincialis. Agric. For. Entomol. 2017, 19, 192–199. [Google Scholar] [CrossRef]
- Lindner, M.; Maroschek, M.; Netherer, S.; Kremer, A.; Barbati, A.; Gonzalo, J.G.; Seidl, R.; Delzon, S.; Corona, P.; Kolstrom, M.; et al. Climate change impacts, adaptive capacity, and vulnerability of European forest ecosystems. For. Ecol. Manag. 2010, 259, 698–709. [Google Scholar] [CrossRef]
- Calvão, T.; Duarte, C.M.; Pimentel, C.S. Climate and landscape patterns of pine forest decline after invasion by the pinewood nematode. For. Ecol. Manag. 2019, 433, 43–51. [Google Scholar] [CrossRef]
- Adams, H.D.; Guardiola-Claramonte, M.; Barron-Gafford, G.A.; Villegas, J.C.; Breshears, D.D.; Zou, C.B.; Troch, P.A.; Huxman, T.E. Temperature sensitivity of drought-induced tree mortality portends increased regional die-off under global-change-type drought. Proc. Natl. Acad. Sci. USA 2009, 106, 7063–7066. [Google Scholar] [CrossRef] [PubMed] [Green Version]
- Allen, C.D.; Macalady, A.K.; Chenchouni, H.; Bacgelet, D.; McDowell, N.; Vennetier, M.; Kitzbergerg, T.; Rigling, A.; Breshears, D.D.; Hogg, E.H.; et al. A global overview of drought and heat-induced tree mortality reveals emerging climate change risks for forests. For. Ecol. Manag. 2010, 259, 660–684. [Google Scholar] [CrossRef] [Green Version]
- McDowell, N.G.; Beerling, D.J.; Breshears, D.D.; Fisher, R.A.; Raffa, K.; Stitt, M. The interdependence of mechanisms underlying climate-driven vegetation mortality. Trends Ecol. Evol. 2011, 26, 523–532. [Google Scholar] [CrossRef] [PubMed]
- Pautasso, M.; Schlegel, M.; Holdenrieder, O. Forest health in a changing world. Microb. Ecol. 2015, 69, 826–842. [Google Scholar] [CrossRef] [PubMed]
- Garrett, K.A.; Dobson, A.D.M.; Kroschel, J.; Natarajan, B.; Orlandini, S.; Tonnang, H.E.Z.; Valdivia, C. The effects of climate variability and the color of weather time series on agricultural diseases and pests, and on decisions for their management. Agric. For. Meteorol. 2013, 170, 216–227. [Google Scholar] [CrossRef] [Green Version]
- Giblin-Davis, R.M.; Davies, K.A.; Morris, K.; Thomas, W.K. Evolution of parasitism in insect transmitted plant nematodes. J. Nematol. 2003, 35, 133–141. [Google Scholar]
- Zhao, B.G. Pine wilt disease in China. In Pine Wilt Disease; Zhao, B.G., Futai, K., Sutherland, J.R., Takeuchi, Y., Eds.; Springer: Tokyo, Japan, 2008; pp. 18–25. ISBN 978-4-431-75655-2. [Google Scholar]
- Abelleira, A.; Picoaga, A.; Mansilla, J.P.; Aguin, O. Detection of Bursaphelenchus xylophilus, causal agent of pine wilt disease on Pinus pinaster in Northwestern Spain. Plant Dis. 2011, 95, 776. [Google Scholar] [CrossRef]
- Dropkin, V.; Foudin, A.; Kondo, E.; Linit, M.; Smith, M. Pinewood nematode: A threat to US forest? Plant Dis. 1981, 65, 1022–1027. [Google Scholar] [CrossRef]
- Wingfield, M.J.; Blanchette, R.A.; Nicholls, T.H. Is the pine wood nematode an important pathogen in the United States? J. For. 1984, 82, 232–235. [Google Scholar]
- Pimentel, C.S.; Ayres, M.P.; Vallery, E.; Young, C.; Streett, D.A. Geographical variation in seasonality and life history of pine sawyer beetles Monochamus: Its relationship with phoresy by the pinewood nematode Bursaphelenchus xylophilus. Agric. For. Entomol. 2014, 16, 196–206. [Google Scholar] [CrossRef]
- Shi, J.; Luo, Y.Q.; Song, J.Y.; Wu, H.W.; Wang, L.; Wang, G.Z. Traits of Masson pine affecting attack of pine wood nematode. J. Integr. Plant Biol. 2007, 49, 1763–1771. [Google Scholar] [CrossRef]
- Gao, R.; Shi, J.; Huang, R.F.; Wang, Z.; Luo, Y.Q. Effects of pine wilt disease invasion on soil properties and Masson pine forest communities in the Three Gorges reservoir region, China. Ecol. Evol. 2015, 5, 1702–1716. [Google Scholar] [CrossRef] [PubMed]
- The 2019 No.4 Bulletin of National Forestry and Grassland Administration—The Epidemic Area of Pine Wilt Disease. Available online: http://www.forestry.gov.cn/sites/main/main/index.jsp (accessed on 1 February 2019).
- An, H.; Lee, S.; Cho, S.J. The effects of climate change on pine wilt disease in South Korea: Challenges and Prospects. Forests 2019, 10, 486. [Google Scholar] [CrossRef]
- Firmino, P.N.; Calvão, T.; Ayres, M.P.; Pimentel, C.S. Monochamus galloprovincialis and Bursaphelenchus xylophilus life history in an area severely affected by pine wilt disease: Implications for forest management. For. Ecol. Manag. 2017, 389, 105–115. [Google Scholar] [CrossRef]
- Pimentel, C.S.; Ayres, M.P. Latitudinal patterns in temperature-dependent growth rates of a forest pathogen. J. Biol. 2018, 72, 39–43. [Google Scholar] [CrossRef] [PubMed]
- Pasho, E.; Camarero, J.J.; Luis, M.; Vicente-Serrano, S.M. Spatial variability in large-scale and regional atmospheric drivers of Pinus halepensis growth in eastern Spain. Agric. For. Meteorol. 2011, 151, 1106–1119. [Google Scholar] [CrossRef]
- Dorman, M.; Perevolotsky, A.; Sarris, D.; Svoray, T. The effect of rainfall and competition intensity on forest response to drought: Lessons learned from a dry extreme. Oecologia 2015, 177, 1025–1038. [Google Scholar] [CrossRef]
- Kurz-Besson, C.B.; Lousada, J.L.; Gaspar, M.J.; Correia, I.E.; David, T.S.; Soares, P.M.M.; Cardoso, R.M.; Russo, A.; Varino, F.; Meriaux, C.; et al. Effects of recent minimum temperature and water deficit increases on Pinus pinaster radial growth and wood density in southern Portugal. Front. Plant Sci. 2016, 7, 1170. [Google Scholar] [CrossRef]
- Robinet, C.; Roques, A.; Pan, H.Y.; Fang, G.F.; Ye, J.R.; Zhang, Y.Z.; Sun, J.H. Role of human-mediated dispersal in the spread of the pinewood nematode in China. PLoS ONE 2009, 4, e4646. [Google Scholar] [CrossRef]
- Gruffudd, H.R.; Jenkins, T.A.R.; Evans, H.F. Using an evapo-transpiration model (ETpN) to predict the risk and expression of symptoms of pine wilt disease (PWD) across Europe. Biol. Invasions 2016, 18, 2823–2840. [Google Scholar] [CrossRef]
- Rutherford, T.A.; Webster, J.M. Distribution of pine wilt disease with respect to temperature in North America, Japan, and Europe. Can. J. For. Res. 1987, 17, 1050–1059. [Google Scholar] [CrossRef]
- Rutherford, T.A.; Mamiya, Y.; Webster, J.M. Nematode-induced pine wilt disease: Factors influencing its occurrence and distribution. For. Sci. 1990, 36, 145–155. [Google Scholar]
- Pérez, G.; Díez, J.J.; Ibeas, F.; Pajares, J.A. Assessing pine wilt disease risk under a climate change scenario in Northwestern Spain. In Managing Forest Ecosystems: The Challenge of Climate Change; Bravo, F., Jandl, R., LeMay, V., von Gadow, K., Eds.; Springer: Dordrecht, The Netherlands, 2008; pp. 269–282. ISBN 978-1-4020-8343-3. [Google Scholar]
- Evans, S.; Evans, H.; Ikegami, M. Modeling PWN-induced wilt expression: A mechanistic approach. In Pine Wilt Disease: A Worldwide Threat to Forest Ecosystems; Mota, M.M., Vieira, P., Eds.; Springer: Dordrecht, The Netherland, 2008; pp. 259–278. ISBN 978-1-4020-8455-3. [Google Scholar]
- Mamiya, Y. Pathology of the pine wilt disease caused by Bursaphelenchus xylophilus. Annu. Rev. Phytopathol. 1983, 21, 201–220. [Google Scholar] [CrossRef] [PubMed]
- Takemoto, S. Population ecology of Bursaphelenchus xylophilus. In Pine Wilt Disease; Zhao, B.G., Futai, K., Sutherland, J.R., Takeuchi, Y., Eds.; Springer: Tokyo, Japan, 2008; pp. 105–122. ISBN 978-4-431-75655-2. [Google Scholar]
- Xi, Y.; Niu, S.K. The effect of climatic factors on pine wilt disease. For. Resour. Manag. 2008, 8, 70–76. [Google Scholar]
- Kong, W.N. The effects of temperature and humidity on the longevity of Monochamus Aalternatus Hope (Coleoptera: Cerambycidae). J. Shanxi Agric. Univ. 2006, 26, 294–295. [Google Scholar]
- Legendre, P.; Legendre, L. Numerical Ecology, 3rd ed.; Elsevier: Amsterdam, The Netherlands, 2012; pp. 65–78. ISBN 9780444538680. [Google Scholar]
- Sturrock, R.N. Climate change and forest diseases: Using today’s knowledge to address future challenges. For. Syst. 2012, 21, 329–336. [Google Scholar] [CrossRef]
- Gao, R.H.; Luo, Y.Q.; Wang, Z.; Yu, H.J.; Shi, J. Patterns of biomass, carbon, and nitrogen storage distribution dynamics after the invasion of pine forests by Bursaphelenchus xylophilus (Nematoda: Aphelenchoididae) in the three Gorges Reservoir Region. J. For. Res. 2018, 29, 459–470. [Google Scholar] [CrossRef]
- Naves, P.; Sousa, E. Threshold temperatures and degree-day estimates for development of post-dormancy larvae of Monochamus galloprovincialis (Coleoptera: Cerambycidae). J. Pest Sci. 2009, 82, 1–6. [Google Scholar] [CrossRef]
- Gao, R.H.; Ji, W.R.; Li, H.; Shi, J. The relationship between pine wilt disease variables and climatic variables. J. Shanxi Agric. Univ. 2019, 39, 32–40. [Google Scholar]
- Elad, Y.; Pertot, I. Climate change impacts on plant pathogens and plant diseases. J. Crop Improv. 2014, 28, 99–139. [Google Scholar] [CrossRef]
- Sternberg, E.D.; Thomas, M.B. Local adaptation to temperature and the implications for vector-borne diseases. Trends Parasitol. 2014, 30, 115–122. [Google Scholar] [CrossRef] [PubMed]
- Hirata, A.; Nakamura, K.; Nakao, K.; Kominami, Y.; Tanaka, N.; Ohashi, H.; Takano, K.T.; Takeuchi, W.; Matsui, T. Potential distribution of pine wilt disease under future climate change scenarios. PLoS ONE 2017, 12, e0182837. [Google Scholar] [CrossRef] [PubMed]
- Nakamura, K.; Maehara, N.; Aikawa, T.; Ichihara, Y. Research project to develop strategic action plan in the pine wilt disease unaffected area in Northern Japan. In Proceedings of the Book of Abstract of the Pine Wilt Disease Conference 2013, Braunschweig, Germany, 15–18 October 2013; Julius Kühn Institute, Federal Research Centre for Cultivated Plants: Quedlinburg, Germany, 2013; p. 66. [Google Scholar]
- Shinya, R.; Morisaka, H.; Takeuchi, Y.; Futai, K.; Ueda, M. Making headway in understanding pine wilt disease: What do we perceive in the postgenomic era? J. Biosci. Bioeng. 2013, 116, 1–8. [Google Scholar] [CrossRef] [PubMed]
- Cheng, G.; Lv, Q.; Feng, Y.M.; Li, Y.X.; Wang, Y.L.; Zhang, X.Y. Temporal and spatial dynamic pattern of PWD distribution in China predicted under climate change scenario. Sci. Silv. Sin. 2015, 51, 119–126. [Google Scholar]
Figure 1.
The number of Masson pine mortality and pine wilt disease outbreak areas after the invasion of B. xylophilus in the study area from 2006 to 2018 (A). The number of damaged forest blocks and the number of damaged forest sites after the invasion of B. xylophilus in the study areas from 2006 to 2018 (B).

Figure 2.
Principal component analysis ordination diagram of different pine wilt disease epidemic variables in the study areas from 2006 to 2018. Mor, the quantity of Masson pine mortality; DA, PWD damaged area; DB, the quantity of PWD damaged blocks; DS, the quantity of PWD damaged sites.
Figure 2.
Principal component analysis ordination diagram of different pine wilt disease epidemic variables in the study areas from 2006 to 2018. Mor, the quantity of Masson pine mortality; DA, PWD damaged area; DB, the quantity of PWD damaged blocks; DS, the quantity of PWD damaged sites.

Figure 3.
Results of the RDA ordination biplot presenting PWD variables and 12 selective temperature variables from 2006 to 2018. For PWD epidemic variables (filled arrows): Mor = The quantity of Masson pine mortality; DA = PWD damaged area; DB = The quantity of PWD damaged blocks; DS = The quantity of PWD damaged sites. For temperature variables (open arrows): MTautumu = Mean temperature in the autumn quarter (9–11); MTsummer = Mean temperature in the summer quarter (6–8); MTOpt = Mean temperature of days with optimum temperature; T10–15 = Number of days with a temperature between 10–15 °C from October to December; TOpt = Number of days with optimum temperature; T35 = Number of days with temperature above 35 °C; MT19–28 = Mean temperature of days with temperature between 19–28 °C from June to September; T0 = Number of days with minimum temperature at or below 0 °C; Min-T = Minimum temperature during PWD life cycle; TUnfav = Number of days with unfavorable temperature; T28 = Number of days with temperature above 28 °C; MT10–15 = Mean temperature of days with temperature between 10–15 °C from October to December.

Figure 4.
Results of the RDA ordination biplot presenting PWD variables and six selective precipitation variables from 2006 to 2018. For PWD epidemic variables (filled arrows): Mor = The quantity of Masson pine mortality; DA = PWD damaged area; DB = The quantity of PWD damaged blocks; DS = The quantity of PWD damaged sites. For precipitation variables (open arrows): Pspring = Precipitation in spring quarter (3–5); Pautumn = Precipitation in autumn quarter (9–11); Pwinter = Precipitation in winter quarter (12, 1, 2); P0.1 = Number of days with precipitation at or above 0.1 mm per day; Max prec = Maximum daily precipitation during PWD life cycle; Total prec = Total precipitation during PWD life cycle.

Figure 5.
Results of the RDA ordination biplot presenting PWD variables and seven selective relative humidity variables from 2006 to 2018. For PWD epidemic variables (filled arrows): Mor = The quantity of Masson pine mortality; DA = PWD damaged area; DB = The quantity of PWD damaged blocks; DS = The quantity of PWD damaged sites. For relative humidity variables (open arrows): Max humi = Maximum relative humidity during PWD life cycle; Mean humi = Mean relative humidity during PWD life cycle; Min humi = Minimum relative humidity during PWD life cycle; Hspring = Relative humidity in the spring quarter (3–5); Hsummer = Relative humidity in the summer quarter (6–8); Hautumn = Relative humidity in the autumn quarter (9–11); Hwinter = Relative humidity in the winter quarter (12, 1, 2).

Figure 6.
Results of the RDA ordination biplot presenting PWD variables and three selective wind speed variables from 2006 to 2018. For PWD epidemic variables (filled arrows): Mor = The quantity of Masson pine mortality; DA = PWD damaged area; DB = The quantity of PWD damaged blocks; DS = The quantity of PWD damaged sites. For wind speed variables (open arrows): Ext wind = Extreme wind speed from May to September; Max wind = Maximum wind speed from May to September; Mean wind = Mean wind speed from May to September.


Table 1.
Climate and weather variables used to assess their association with the incidence of pine wilt disease outbreaks in the study area from 2006 to 2017.
Table 1.
Climate and weather variables used to assess their association with the incidence of pine wilt disease outbreaks in the study area from 2006 to 2017.
| Variables | Description | Rationale |
|---|---|---|
| Max temp | Maximum temperature during pine wilt disease (PWD) life cycle | Pine wilt disease has been observed mainly in areas where the mean daily summer temperature exceed 20 °C for several weeks [36,37,38]. |
| Mean temp | Mean temperature during PWD life cycle | |
| Min temp | Minimum temperature during PWD life cycle | |
| Mtspring | Mean temperature in spring quarter (3–5) | |
| MTsummer | Mean temperature in summer quarter (6–8) | High temperature and seasonal drought causing water deficit drive potential tree evaporation and weaken the tree’s defense capacity against the pine wood nematode, thus favored pathogen and vector development and likely to trigger an outbreak of pine wilt disease [10,20,36,39]. |
| MTautumn | Mean temperature in autumn quarter (9–11) | |
| MTwinter | Mean temperature in winter quarter (12, 1, 2) | |
| T20 | Number of days with temperature at or above 20 °C | |
| MT20 | Mean temperature of days with temperature at or above 20 °C | |
| TOpt | Number of days with optimum temperature | |
| MTOpt | Mean temperature of days with optimum temperature | Pine wood nematode cannot get enough effective accumulated temperature when the mean temperature is lower than 10 °C [20]. |
| TUnfav | Number of days with unfavorable temperature | |
| T10 | Number of days with temperature below 10 °C | Temperature directly affect the development rate of B. xylophilus, the optimum temperature range for pine wilt disease development is between 10–25 °C [10,20,40]. |
| MT10 | Mean temperature of days with temperature below 10 °C | |
| T25 | Number of days with temperature above 25 °C | |
| MT25 | Mean temperature of days with temperature above 25 °C | |
| T28 | Number of days with temperature above 28 °C | High temperature could have negative effects on nematode development (above 28 °C) as well as on nematode reproductive process (above 35 °C) [10,40,41]. |
| MT28 | Mean temperature of days with temperature above 28 °C | |
| T35 | Number of days with temperature above 35 °C | The distribution of Monnchamus species is constrained by thermal barriers, especially by low winter temperatures that regulate the survival of the overwintering fifth-instar larvae [10]. |
| MT35 | Mean temperature of days with temperature above 35 °C | |
| PSB-ddegg | Degree-day accumulation for 50% egg hatch from June through September | A relatively cold condition, which the temperature range between 10–15 °C, is necessary for the growth and development of pine sawyer beetle (PSB) larva from October to December [20]. |
| PSB-ddadult | Degree-day accumulation for adult emergence from March through May | |
| PSB-dd | Degree-day accumulation for one generation during PSB’s life cycle | |
| T10–15 | Number of days with temperature between 10–15 °C from October to December | In China, at least 1200 degree-days were required for the development of PSB generation from egg to adult, with 528 degree-days for adult emergence [20]. |
| MT10–15 | Mean temperature of days with temperature between 10–15 °C from October to December | |
| T19–28 | Number of days with temperature between 19–28 °C from June to September | |
| MT19–28 | Mean temperature of days with temperature between 19–28 °C from June to September | The optimum temperature range for PSB hatching is between 19–28 °C. As to 50% egg hatch, at least 350 degree-days are required through the growing season [10,20]. |
| T0 | Number of days with minimum temperature at or below 0 °C | |
| MT0 | Mean temperature of days with minimum temperature at or below 0 °C | |
| Total prec | Total precipitation during PWD life cycle | |
| Max prec | Maximum daily precipitation during PWD life cycle | |
| P0.1 | Number of days with precipitation at or above 0.1 mm per day | Too much precipitation have a significantly effects on PSB’s flight performance and feeding capacity [10,11,20,42,43]. |
| Pspring | Precipitation in spring quarter (3–5) | |
| Psummer | Precipitation in summer quarter (6–8) | |
| Pautumn | Precipitation in autumn quarter (9–11) | |
| Pwinter | Precipitation in winter quarter (12,1,2) | |
| Max humi | Maximum relative humidity during PWD life cycle | |
| Mean humi | Mean relative humidity during PWD life cycle | |
| Min humi | Minimum relative humidity during PWD life cycle | Relative humidity is prevalent from March to May, being correlated positively with pine wilt disease epidemic degree [20,42]. |
| Hspring | Relative humidity in spring quarter (3–5) | |
| Hsummer | Relative humidity in summer quarter (6–8) | |
| Hautumn | Relative humidity in autumn quarter (9–11) | |
| Hwinter | Relative humidity in winter quarter (12,1,2) | |
| Ext wind | Extreme wind speed from May to September | The flight capacity of PSB can significantly affected by wind speed and higher monthly wind speed facilitates the spread and diffusion of PSB over long distance [20,42]. |
| Max wind | Maximum wind speed from May to September | |
| Mean wind | Mean wind speed from May to September |
Table 2.
The correlation coefficient matrix for the different pine wilt disease epidemic variables in the study area during 2006 to 2018.
Table 2.
The correlation coefficient matrix for the different pine wilt disease epidemic variables in the study area during 2006 to 2018.
| PWD Damaged Blocks | PWD Damaged Sites | Masson Pine Mortality | PWD Damaged Area | |
|---|---|---|---|---|
| PWD damaged blocks | 1 | 0.811 * | 0.255 | 0.253 |
| PWD damaged sites | 1 | 0.502 | 0.411 | |
| Masson pine mortality | 1 | 0.772 * | ||
| PWD damaged area | 1 |
* Correlation is significant at the 0.05 level.
Table 3.
The selected climate and weather variables obtained from the summary of forward selection in the redundancy analysis.
Table 3.
The selected climate and weather variables obtained from the summary of forward selection in the redundancy analysis.
| Variables | Contribution% | F-Ratio | p-Value | |
|---|---|---|---|---|
| Temperature | MTautumn | 40.5 | 7.5 * | 0.018 |
| MTsummer | 14.9 | 3.9 * | 0.032 | |
| MTOpt | 9.6 | 4.4 * | 0.024 | |
| T10–15 | 5.7 | 3.5 * | 0.044 | |
| TOpt | 4.7 | 4.8 * | 0.03 | |
| T35 | 9.8 | 2 | 0.152 | |
| MT19–28 | 9.9 | 3.2 | 0.088 | |
| T0 | 2.4 | 3.8 | 0.082 | |
| Min-T | 1.1 | 2.3 | 0.144 | |
| TUnfav | 0.8 | 2.6 | 0.14 | |
| T28 | 0.4 | 1.8 | 0.33 | |
| MT10–15 | 0.2 | <0.1 | 1 | |
| Precipitation | Pautumn | 75.5 | 6.8 * | 0.026 |
| Pwinter | 6.7 | 0.6 | 0.534 | |
| Pspring | 5.8 | 0.5 | 0.588 | |
| P0.1 | 10.1 | 0.8 | 0.402 | |
| Max prec | 1.8 | 0.1 | 0.888 | |
| Total prec | <0.1 | <0.1 | 1 | |
| Relative humidity | Max humi | 33.1 | 0.9 ** | 0.008 |
| Mean humi | 14.1 | 3.7 * | 0.038 | |
| Hautumn | 13.5 | 2.4 | 0.13 | |
| Min humi | 15.5 | 1.2 | 0.308 | |
| Hsummer | 7.3 | 0.5 | 0.544 | |
| Hwinter | 6 | 0.4 | 0.612 | |
| Hspring | 10.6 | 0.6 | 0.504 | |
| Mean wind | 63.7 | 5.9 * | 0.036 | |
| Wind speed | Ext wind | 21.2 | 2.2 | 0.176 |
| Max wind | 15.1 | 1.7 | 0.188 | |
The Monte Carlo test was performed at the 0.05 significance level. * Significant at p < 0.05; ** Significant at p < 0.01.
Table 4.
The calculation summary of the redundancy analysis.
| Variables | Canonical Axes | Eigenvalues | Cumulative Explained Variation (%) | Pseudo Canonical Correlation | Cumulative Explained Fitted Variation (%) | Sum of All Eigenvalues | Sum of All Canonical Eigenvalues |
|---|---|---|---|---|---|---|---|
| Temperature | RDA1 | 0.901 | 90.05 | 1 | 90.44 | 1 | 0.996 |
| RDA2 | 0.073 | 97.36 | 0.978 | 97.79 | |||
| RDA3 | 0.018 | 99.16 | 1 | 99.6 | |||
| RDA4 | 0.004 | 99.56 | 0.964 | 100 | |||
| Precipitation | RDA1 | 0.496 | 49.58 | 0.744 | 92.57 | 1 | 0.536 |
| RDA2 | 0.036 | 53.16 | 0.672 | 99.26 | |||
| RDA3 | 0.003 | 53.42 | 0.689 | 99.74 | |||
| RDA4 | 0.001 | 53.56 | 0.265 | 100 | |||
| Relative humidity | RDA1 | 0.538 | 53.83 | 0.78 | 90.59 | 1 | 0.594 |
| RDA2 | 0.045 | 58.29 | 0.71 | 98.09 | |||
| RDA3 | 0.009 | 59.26 | 0.687 | 99.72 | |||
| RDA4 | 0.002 | 59.43 | 0.492 | 100 | |||
| Wind speed | RDA1 | 0.596 | 59.63 | 0.814 | 97.88 | 1 | 0.609 |
| RDA2 | 0.012 | 60.83 | 0.419 | 99.85 | |||
| RDA3 | 0.001 | 60.92 | 0.223 | 100 | |||
| RDA4 | 0.304 | 91.27 | 0 |
RDA is the abbreviation of redundancy analysis.
© 2019 by the authors. Licensee MDPI, Basel, Switzerland. This article is an open access article distributed under the terms and conditions of the Creative Commons Attribution (CC BY) license (http://creativecommons.org/licenses/by/4.0/).
Share and Cite
MDPI and ACS Style
Gao, R.; Wang, Z.; Wang, H.; Hao, Y.; Shi, J. Relationship between Pine Wilt Disease Outbreaks and Climatic Variables in the Three Gorges Reservoir Region. Forests 2019, 10, 816. https://doi.org/10.3390/f10090816
AMA Style
Gao R, Wang Z, Wang H, Hao Y, Shi J. Relationship between Pine Wilt Disease Outbreaks and Climatic Variables in the Three Gorges Reservoir Region. Forests. 2019; 10(9):816. https://doi.org/10.3390/f10090816
Chicago/Turabian StyleGao, Ruihe, Zhuang Wang, Haixiang Wang, Yanping Hao, and Juan Shi. 2019. "Relationship between Pine Wilt Disease Outbreaks and Climatic Variables in the Three Gorges Reservoir Region" Forests 10, no. 9: 816. https://doi.org/10.3390/f10090816
Note that from the first issue of 2016, this journal uses article numbers instead of page numbers. See further details here.