Article

Foliar and Wood Traits Covary along a Vertical Gradient within the Crown of Long-Lived Light-Demanding Species of the Congo Basin Semi-Deciduous Forest

1
Laboratory of Wood Technology, Department of Environment, Ghent University, Coupure Links 653, B-9000 Gent, Belgium
2
Royal Museum for Central Africa, Service of Wood Biology, Leuvensesteenweg 13, 3080 Tervuren, Belgium
3
Faculty of Agricultural Sciences, Department of Natural Resources Management, University of Kinshasa, PO Box 117 Kinshasa XI, Congo
4
Center for International Forestry Research, Situ Gede, Sindang Barang, Bogor (Barat) 16115, Indonesia
5
Resources & Synergies Development Pte Ltd., Raffles Quay 16, #33-03, Hong Leong Building, Singapore 048581, Singapore
6
Meise Botanic Garden, Nieuwelaan 38, 1860 Meise, Belgium
7
Faculty of Sciences, Department of Ecology and Fauna Resources Management, University of Kisangani, PO Box 2012 Kisangani, Congo
*
Author to whom correspondence should be addressed.
Forests 2020, 11(1), 35; https://doi.org/10.3390/f11010035
Submission received: 11 November 2019 / Revised: 19 December 2019 / Accepted: 23 December 2019 / Published: 25 December 2019
(This article belongs to the Special Issue Wood Science and Tropical Forest Ecology)

Abstract

:
Plant functional traits have shown to be relevant predictors of forest functional responses to climate change. However, the trait-based approach to study plant performances and ecological strategies has mostly been focused on trait comparisons at the interspecific and intraspecific levels. In this study, we analyzed traits variation and association at the individual level. We measured wood and leaf traits at different height locations within the crown of five individuals of Pericopsis elata (Harms) Meeuwen (Fabaceae) from the northern tropical forest of the Democratic Republic of the Congo. All traits varied between and within individuals. The between-individual variation was more important for leaf traits (23%–48%) than for wood traits (~10%) where the within-individual variation showed to be more important (33%–39%). The sample location height within the crown was found to be the driving factor of this within-individual variation. In a gradient from the base to the top of the crown, theoretical specific hydraulic conductivity and specific leaf area decreased while the stomatal density increased. We found significant relationships among traits and between wood and leaf traits. However, these relationships varied with the position within the crown. The relationship between vessel size and vessel density was negative at the bottom part of the crown but positive upward. Also, the negative relationship between stomatal density and stomatal size became stronger with increasing height within the crown. Finally, the positive relationship between specific leaf area and theoretical specific hydraulic conductivity became stronger in higher parts of the crown, suggesting that P. elata constantly adapts its water use with respect to its water supply, more strongly at the top of the crown where the environment is more extreme and less buffered against environmental fluctuations.

1. Introduction

Climate changes will have different impacts on species that comprise a community. Some species will be stimulated, while others will decline. The typical reaction depends on the species’ traits, understood as any morphological, biochemical, physiological, or phenological characteristic measurable at the individual level [1,2,3]. The prediction of forest changes depends, therefore, on a sound knowledge of the species’ traits and their variability. In this respect, correlative and empirical studies have identified direct and indirect links between plant traits and growth, reproduction, and survival of the species [4]. Others have focused on the distribution of traits to model plant communities [5,6] and to predict plant responses to environmental changes [7]. The results from these studies suggested, for example, that (1) plants with higher seed mass have higher seedling establishment and lower survival; (2) plants with higher wood density have higher survival but lower growth rate; and (3) plants with higher adult stature grow more slowly and show lower survival rates during the juvenile stage, while as adults they show faster growth and better survival [8,9].
However, due to the widespread drought-induced plant die-back [7,10], studies focusing on the relation between traits and plant–water status become increasingly necessary. Such studies help to understand variation in plant hydraulic strategies and to determine which species would be vulnerable to water stress [11]. It has been shown that under water deficit conditions, plants reduce their leaf area and specific leaf area (SLA) to limit water loss but increase their stomatal density and reduce their stomatal size to enhance their adaptation to drought [12,13]. Also, plants having a high SLA are associated with a lower seed mass and a higher growth but are not well adapted to cope with increased drought [7]. As far as wood traits are concerned, studies by [14,15,16] have shown that plants with a high xylem hydraulic conductance have a higher growth rate associated with a lower drought tolerance.
Most of these studies have focused on either leaf or wood traits despite the possible coordination between these two groups of plant traits as expected from the plant life-history theory [17]. This theory predicts that plants having a xylem structure allowing them to safely supply copious water to leaves consequently have leaves with a higher water-use potential and faster growth. Traits associations are better predictors of these functional strategies. Merging the water-use strategy, expressed by leaf traits associations, with the water-supply strategy, expressed by wood traits associations, could provide a more comprehensive framework to characterize plants response to drought.
Most of the studies available in this respect have focused on species-specific mean trait values, while in cross-species analysis a trait value is assumed to be the result of phylogenetic inertia and natural selection from the environment. This means that in such cross-species analysis, associations among traits may be affected by taxonomic biases and by the way traits vary in a lower level than the species. For example, it is now well established that the amount of within-species variation (~30%–50%) is trait-, tissue-, and species-specific and a large part of this variation is related to differences between populations [18]. While the between-populations variation is suggested to be related to environment, the within-population variation (~20%–30%) is suggested to be mainly driven by differences between individuals [19,20,21]. However, we are not yet aware of the intra-individual level of variation which can be substantial. It is necessary to focus on this within-individual variation as plant interactions with biotic and abiotic environments occur at the individual level [22]. Within-individual trait variation may be due to differences between organs or may follow a gradient of water availability expressed by the location height within the crown due to the path length resistance [23]. Knowing about this variation and the way it induces changes in plant strategies may affect the way we sample and provide insight into the intra-canopy plasticity, the hydraulic limitation on tree height, and, by the end, the overall plant responses to drought.
To fulfil this expectation, we need to answer the following two questions: (1) Despite different factors shaping leaf and wood traits, do both groups of plant traits vary dependently as would be expected to optimize photosynthesis? (2) Do the location height gradient within the crown, expressing a gradient of light availability, and water supply (due to the path length resistance), induce changes in trait values and associations? To address these questions, we measured different leaf and wood traits related to tree hydraulics at different height locations within the crown of five dominant individuals, growing within the same population of Pericopsis elata (Harms) Meeuwen (Fabaceae), a flagship species of the Congo Basin forests. A conceptual framework (Figure 1) was suggested and tested along a height location (vertical) gradient within the crown to show whether plant strategies vary along this gradient.

2. Materials and Methods

2.1. Study Species and Location

The study species is Pericopsis elata (Harms) Meeuwen (Fabaceae), a semi-deciduous tree species with a gregarious spatial distribution [24,25,26]. This long-lived heliophilous [24,25] and anemochoric species [24,27] has a disjunct natural distribution area ranging from Ivory Coast to the Democratic Republic of the Congo (DRC). In the adult stage, trees of P. elata can reach a diameter at breast height (DBH) up to 160 cm and a total height up to 50 m. The species is readily recognized by its creamy or greyish flaky bark (with reddish brown spots), its compound leaves (7 to 11 leaflets), and its fruits (indehiscent oblong pods of 1 to 5 discoid seeds). The species occur on soil varying in its moisture content reaching its optimum on rich phosphorus and sulfur clay soils with a limited availability in exchangeable aluminum [25]. Average annual diameter increment varies from 0.32 to 0.45 cm in Cameroon and can reach 0.80 cm in the DRC [25]. Wood density ranges between 0.57 and 0.71 g cm−3.
The study area is located in the Congo Basin, between 0°30′ N–0°10′ S and 25°00′–25°35′ E in the province of Tshopo, northern Democratic Republic of the Congo (DRC). The region is covered by semi-deciduous forests, part of the Guineo-Congolean regional center of endemism [28], consisting of monodominant forests of Gilbertiodendron dewevrei (De Wild.) J. Léonard and Brachystegia laurentii (De Wild.) Louis ex J. Léonard as well as old secondary forests characterized by species such as Khaya anthotheca (Welw.) C.DC., Entandrophragma cylindricum (Sprague) Sprague and Hoyle, Pericopsis elata (Harms) Meeuwen, or Milicia excelsa (Welw.) C.C. Berg in the dominant stratum [28]. It has an Af climate, typifying areas without dry season, according to the Köppen classification. The average annual rainfall of the region, calculated from data collected between 1908 and 2008 is 1672 mm [26] and a slight decrease is observed in January–February and June–July. Temperatures slightly fluctuate around the mean annual temperature of 25.1 °C.

2.2. Sample Collection

On 13–15 March 2016, leaf and wood samples were collected from five co-occurring trees separated on average by 100 m distance (about 10 ha of sapling area) with a diameter at breast height (DBH) ranging from 93 to 143 cm and a similar total height of 4–43 m (Table 1). All the studied trees were emergent. Their crowns were above the canopy level and had a full access to sunlight. We therefore assumed that the environmental conditions (photosynthetically active radiation, air temperature, and humidity) were almost similar from the bottom to the top of the outer crown as vertical variations of some of these environmental variables were not substantial in an opened environment [29]. To test whether there was a height gradient of variation in wood and leaf traits, five leaf samples were collected at different locations within the crown. The sample location was selected on a regular basis within the crown at 0% (base of crown), 25%, 50% (middle of the crown), 75%, and 100% (top of the crown) crown height. The sample location distance from the tree top was carefully measured using a tape measure and converted into sample location height by subtracting this distance from the tree total height (Ht). The sample location height ranged from 15 m to 43 m. However, due to technical issues during laboratory processing, some samples were excluded from the measurement or the calculation of some traits, leading to differences in the range of the sample location height. From each leaf sample, five leaflets without obvious symptoms of pathogen or herbivore attacks as well as a wood segment from the twig directly supporting the leaf sample were also collected. In addition, a stem sector of about 3 cm3 located on the trunk at 1.3 m height from the soil level was collected to estimate the xylem tapering ratio of P. elata.

2.3. Traits Measurements

Wood microscopic analyses were performed on the complete transversal sections of twigs following [30]. Wood samples were first cut (a small segment of 1 cm height) and embedded in PolyEthyleneGlycol1500 (VWR Chemicals, Oud-Haverlee, Leuven, Belgium) then a transverse section of 10–20 µm was cut with a slide microtome. The section was stained with a solution of Safranine (1% in 50% alcohol) and Alcian Blue (1% in distilled water), fixed permanently with Euparal and dried in the open air. The obtained sections were digitalized using a Toupview UH-CMOS camera (Hangzhou ToupTek Photonics Co., Ltd., Zhejiang, China) mounted on an Olympus BX51M reflected light microscope (Spach Optics Inc., Rochester, NY, USA), then analyzed with ImageJ 1.51n software [31]. The total area of the section was measured and used to calculate the cross-sectional area of sapwood, as [32]. Four wood traits were measured: Mean vessel diameter (D, µm), and lumen area (A, µm2), vessel density (number (N) per unit area, mm−2), and fiber wall thickness (Fw, µm). While vessel diameter, vessel area, and fiber wall thickness were measured on 30 vessels and fibers, respectively, for wood samples from the bottom part of the crown of Tw69042, Tw69045, and Tw69046, no measurement was made because of the poor quality of images for an accurate measurement. These three wood samples were, therefore, excluded for the measurement of all wood traits. Further, two wood traits providing information on the vascular strategy [33,34] were calculated: The vessel lumen fraction (VF = A × N) and the total number of vessels (TVN = N × As). Finally, two wood traits giving information on the hydraulic properties were calculated according to [35]: The theoretical specific hydraulic conductivity (Ktheo, kg m−1 MPa s−1) as Equation (1) and the hydraulic weighted vessel diameter (Dh, µm) as Equation (2).
K t h e o = π ρ 128 μ A s ( D 4 )
D h = ( ( 1 n ) i n D 4 ) 1 / 4
where ρ is the density of water at 20 °C (=998.2 kg m−3) and μ is the viscosity of water at 20 °C (=1002 × 10−3 Pa s). For each twig, the Dh calculated on twig samples ( D h N 1 ) and the one calculated on a wood sample from the trunk at 1.3 m above the ground level ( D h 0 ) were used to compute the conduit tapering ratio of the tree (T) as T = D h 0 / D h N 1 [23].
For leaf traits, the leaflets were first scanned and their surface (leaf area, mm2) was determined by image analyses using ImageJ 1.51n software [31]. Some leaflets were excluded from the measurements of certain leaf traits because of technical issues during laboratory processing. The remaining leaflets were then oven-dried at 70 °C for 72 h and their dry mass (LDM, mg) was measured. The specific leaf area (SLA, mm2 mg−1) was obtained following [36]. As the studied species has hypostomatic leaflets, stomatal features were assessed on the abaxial surface of each leaflet. To do this, a transparent nail polish was applied on the middle portion of the lamina midway between the midrib and the leaflet edge. Once the polish dried, its imprint on the leaflet was removed using an adhesive tape, mounted on a glass slide, and digitized. Stomatal length (Ls, µm), width (Ws, µm), and density (Dstomata, number per unit leaf area, mm−2), together with pore length (Lp, µm) were determined using ObjetJ plug-in of ImageJ 1.51n software [31].
Two additional stomatal morphometric variables were calculated: Stomatal size (S, µm2) and maximum stomatal conductance to water vapor (gsmax, mole m−2 s−1). The stomatal size was derived from the stomatal length: S = 0.25 × Ls2 [37]. The maximum stomatal conductance to water vapor is positively correlated with stomatal density and negatively correlated with pore depth and, thus, was calculated based on the following equation [38,39]:
g s m a x = d v × D s t o m a t a × a m a x / ( l + π a m a x / π 2 )
where d is the diffusivity of water vapor in air at 25 °C (=2.43 × 10⁻⁵ m2 s−1), v is the molar volume of air at 25 °C (0.024 m3 mole−1), Dstomata is the stomatal density (mm−2), amax is the maximum area of pores (µm2) representing the area of the pore if the stoma is completely opened, and l is the pore depth (m). As the guard cells have an elliptical shape, l is approximated by guard cell width and the maximum area of pores is calculated from the pore length (Lp, m) using the formula of the area of an ellipse: amax = Lp × (Lp/2) with the latter term a proxy for pore width. The maximum stomatal conductance was always higher (~20%) than the operating stomatal conductance [40,41]. Leaflets from which a poor quality of imprint was obtained were excluded from measurements of stomatal features (29 leaflets for stomatal density, 50 leaflets for stomatal size, and 53 leaflets for maximum stomatal conductance). The measured wood and leaf traits are illustrated in Figure 2.

2.4. Statistical Analysis

Linear mixed models (LMM) with a random factor for a tree were performed to evaluate the extent of intra- and inter-individual variation using the variance partitioning approach. To avoid pseudo-replication, the sample location within crown was used as a nested factor within a tree for all trait models except for vessel density, hydraulic weighted vessel diameter, and theoretical specific hydraulic conductivity as they only have one value per location within the crown. For these traits the variance of the error term included both the within-tree variation and the residual variation. Models with and without the nested levels are expressed in Equations (4) and (5), respectively, where T i j is the trait value for the jth location height within the tree i , and ε i j the error term. The variance components were extracted using the function “VarCorr” from the package ‘lme4′ [42] for R software [43]. The variance computed in this analysis is the variance around the mean. Leaf area, leaf dry mass, specific leaf area, stomatal density, fiber wall thickness, and vessel density were log10-transformed to meet to assumption of normality. A bootstrapping procedure was computed to calculate the 95% confidence intervals around the variance estimation. As supplement, we computed the coefficient of variation and calculated traits plasticity as an index of the within-crown trait variation. Trait plasticity within the crown was calculated for each tree and each trait as the absolute difference between the maximum and the minimum value of the considered trait within the crown of the considered tree, divided by the maximum value, and multiplied by 100%. The overall trait plasticity was calculated as the mean of plasticity over all traits and trees. This overall mean plasticity was than compared with the mean plasticity of each trait (Figure S1) using the function “compare means” from the R package ‘survminer’.
T i j = ( β 0 + β 0 i + β 0 i j ) + ε i j
T i = ( β 0 + β 0 i ) + ε i j
Pairwise correlations were used to test the correlation between traits and the canopy sample location and to investigate the pairwise relationship among wood and leaf traits and between wood and leaf traits. For this analysis, traits were averaged on each sample location to reduce the influence of local variation (i.e., driven by leaf traits differences between leaflets and wood traits differences within-wood sample). This led to normally distributed traits except for vessel density where a log10-transformation was applied to have normally distributed data. On this dataset, multiplicative linear models predicting a trait on the basis of another trait were fitted to test the effect of sample location height within the crown on pairwise traits relationship, highlighting whether trait relationships become stronger or weaker with increasing height within the crown. For this analysis, the sample location height (Hs) was used as the interaction term. To address the multicollinearity, all predictors were centered prior to the analysis [44]. The multiplicative model performed is expressed as in Equation (6), where β 0 is the overall intercept (trait value when all partial slopes equal zero), β 1 and β 2 are the partial slopes of the predicted trait on the predictor trait (X1), and the sample location height (X2), respectively, holding the other X constant and ε i is the residual component. The procedure suggested in [45] to further explore the interaction term was used. Four different models were, therefore, fitted (Equations (7) to (10)) to calculate the slope of the response trait for a range of sample location heights (e.g., mean ± 1 standard deviation and ± 2 standard deviations). An increasing or decreasing slope throughout this range meant that the trait relationships became stronger or weaker with increasing sample location height.
T i = β 0 + β 1 X i 1 + β 2 X i 2 + β 3 X i 1 X i 2 + ε i
T i = β 0 + β 1 X i 1 + β 2 ( X ¯ X 2 2 σ X 2 ) + β 3 X i 1 ( X ¯ X 2 2 σ X 2 ) + ε i
T i = β 0 + β 1 X i 1 + β 2 ( X ¯ X 2 σ X 2 ) + β 3 X i 1 ( X ¯ X 2 σ X 2 ) + ε i
T i = β 0 + β 1 X i 1 + β 2 ( X ¯ X 2 + σ X 2 ) + β 3 X i 1 ( X ¯ X 2 + σ X 2 ) + ε i
T i = β 0 + β 1 X i 1 + β 2 ( X ¯ X 2 + 2 σ X 2 ) + β 3 X i 1 ( X ¯ X 2 + 2 σ X 2 ) + ε i

3. Results

3.1. Trait Variation and Plasticity within the Crown

The within-crown trait variation was significant both for wood and for leaves (Table 2). Among wood traits, theoretical specific hydraulic conductivity and vessel lumen area showed the highest variation (44% and 36%, respectively) while the leaf dry mass and the leaf area showed the highest variation amongst leaf traits (50% and 43%). Leaf dry mass varied 13.4-fold (11.3–152 mg), specific leaf area varied 3.5-fold (6.7–23.6 mm mg−1), and leaf area varied 9.9-fold (175–1739 mm2). For wood traits, theoretical specific hydraulic conductivity varied 6.9-fold (0.25–1.74), vessel lumen area varied 8.7-fold (319.3–2798.2), mean vessel diameter varied 3-fold (64.3–21.3), and fiber wall thickness varied 5-fold (1.15–5.95). Theoretical specific hydraulic conductivity (57.7 ± 12.8) and leaf dry mass (40.5 ± 15.3) showed the highest within-crown plasticity for wood and leaf traits, respectively.
The variance partitioning strongly differed depending on the studied variance component (tree or sample location height, Hs) and the trait being considered (Table 3). The between-individual variation showed to be more important for leaf traits (25%–53.5%) than for wood traits (~10%), except for vessel density (35.1%) and theoretical specific hydraulic conductivity (49.1%). The within-individual variation however, is more pronounced for wood traits (~35%) than for leaf traits (<20%), except for the specific leaf area (35.1%).

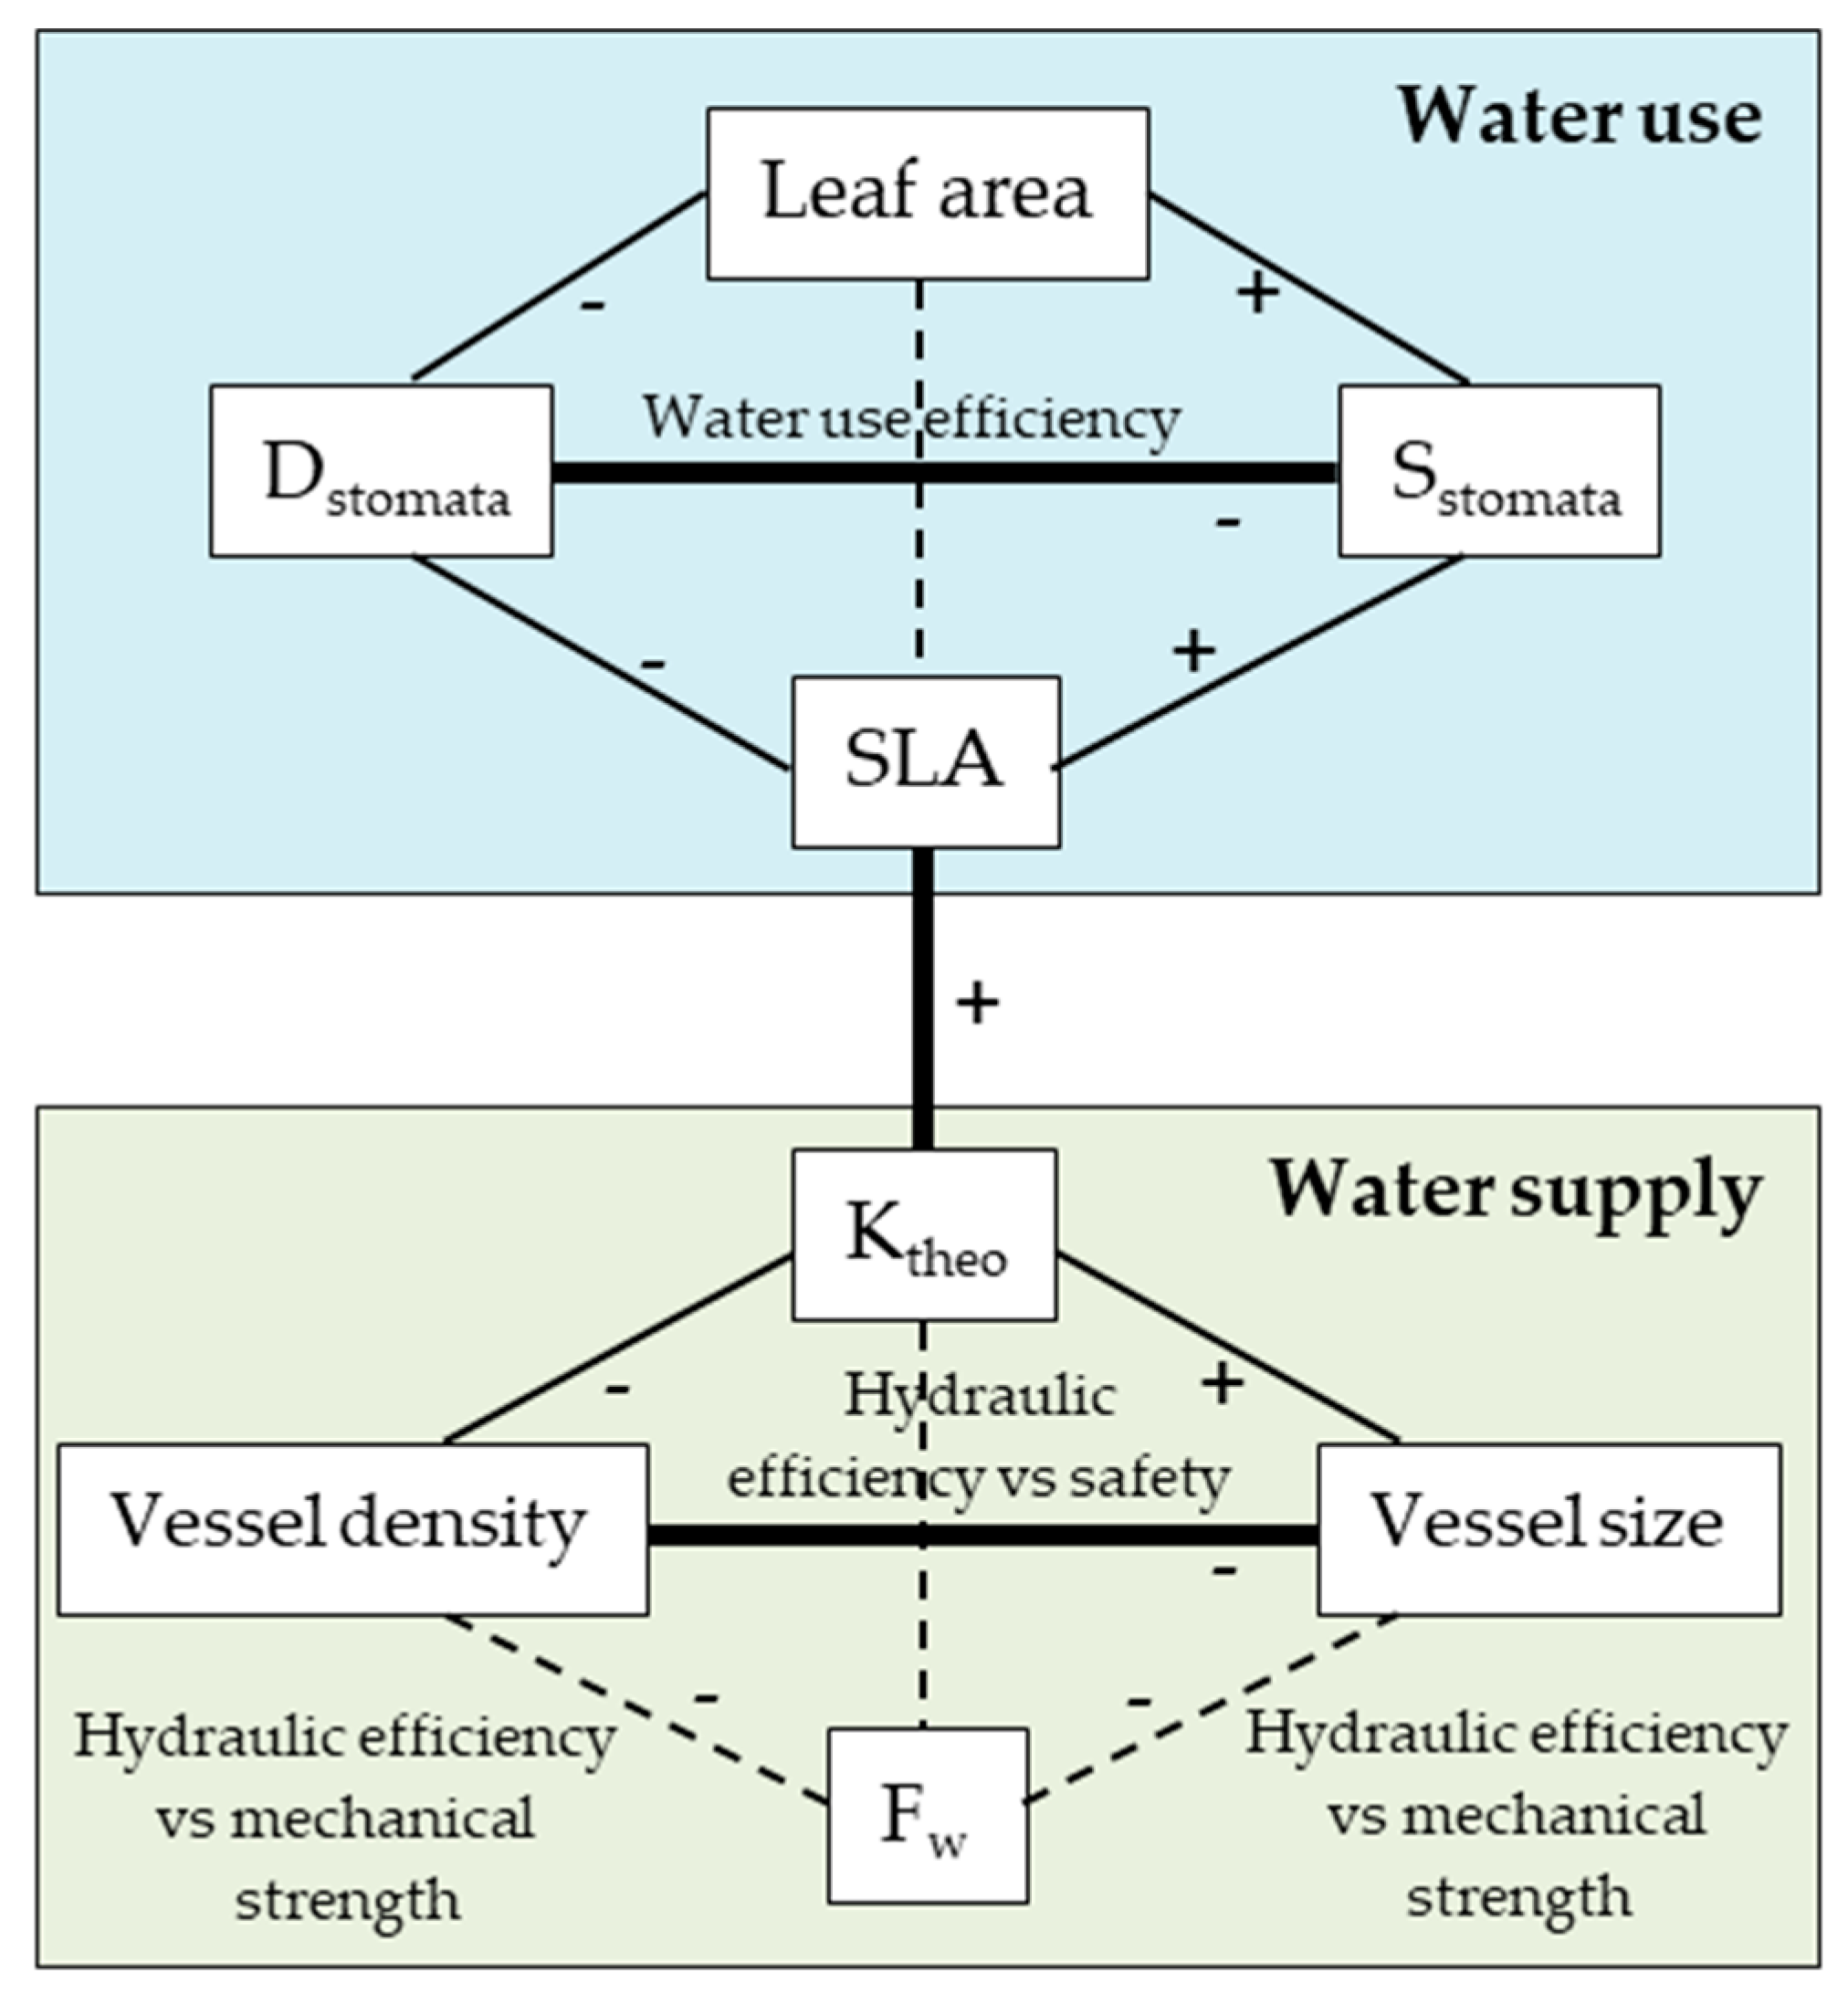
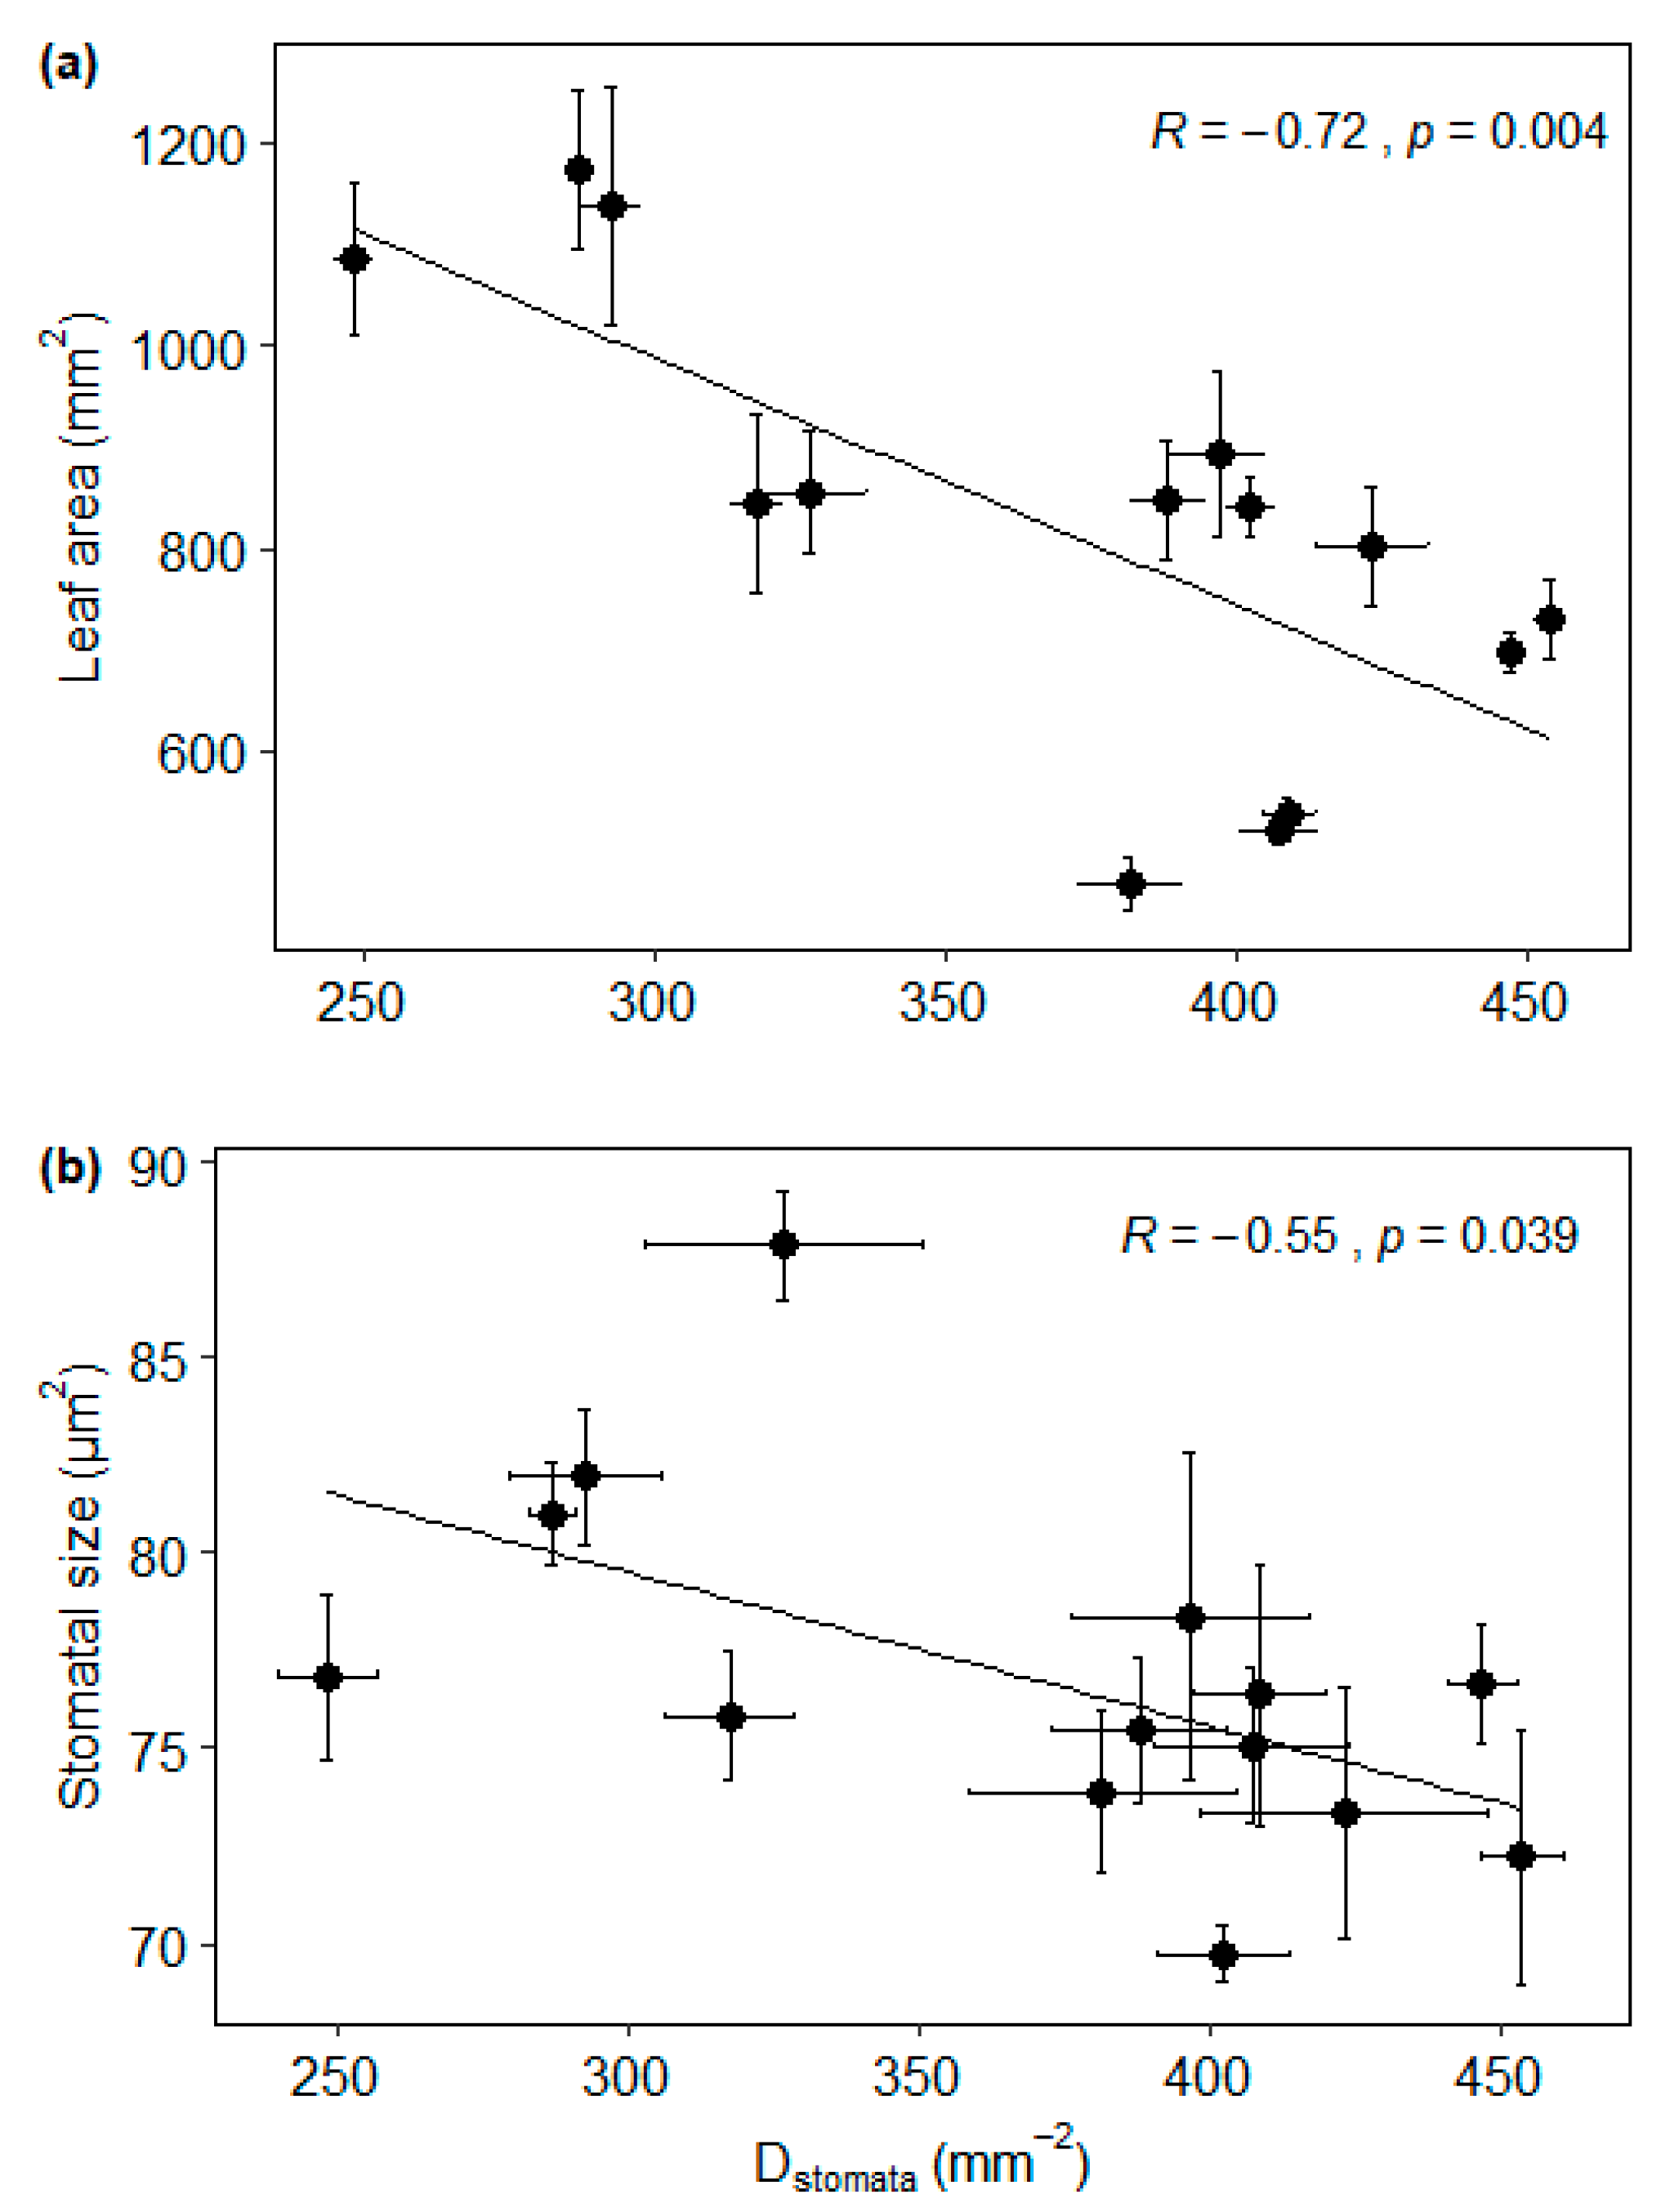
3.2. Trait Associations

A significant pairwise relationship was found among leaf traits (Figure 3). Stomatal density was negatively related to stomatal size (R = −0.55, p < 0.05), SLA (R = −0.61, p < 0.05), and LA (R = −0.72, p < 0.01). As far as wood traits are concerned (Figure S2), theoretical specific hydraulic conductivity showed a significant positive relationship with vessel fraction (R = 0.71, p < 0.001) and conduit tapering (R = 0.63, p < 0.01), and vessel density showed a significant negative relationship with hydraulic conduit diameter (R = −0.41, p < 0.01). None of theoretical specific hydraulic conductivity (R = −0.22, p > 0.05) or vessel density (R = −0.31, p > 0.05) was related to fiber wall thickness, suggesting that wood hydraulic properties are independent from fiber structure.
We found coordination between wood and leaf traits, suggesting a synchronized construction cost of wood (twig) and leaf (Figure S3). This coordination was mainly expressed by the positive correlation between theoretical specific hydraulic conductivity and specific leaf area (R = 0.65, p < 0.01).

3.3. The Effect of Sample Location Height on Trait Associations

The sample location height showed a significant effect on plant traits and this effect was more pronounced for leaf traits (Figure 4). For all studied trees, maximum stomata conductance (R = 0.75, p < 0.01) and stomatal density (R = 0.56, p < 0.05) increased significantly with increasing height within the crown while specific leaf area (R = −0.48, p < 0.05) decreased. Theoretical specific hydraulic conductivity showed a significant negative relationship with sample location height (R = −0.55, p < 0.05).
The sample location height showed a significant effect on trait relationships (Table 4). For leaf traits, the negative relationship between stomatal density and specific leaf area, and the negative relationship between maximum stomatal conductance and specific leaf area decreased with increasing height within the crown. These relationships became positive at the upper part of the crown. Also, the negative relationship between stomatal size and stomatal density was not significant at the lower crown position. But this relationship increased upward and became significant at high (p < 0.001) and very high (p < 0.01) height within the crown. For wood traits, the positive relationship between vessel fraction and theoretical specific hydraulic conductivity was not significant at the lower crown position but became significant upward. Also, theoretical specific hydraulic conductivity was positively related to conduit tapering (T) at the lower crown position but this relationship became positive upward. Another relationship affected by the position within the crown was that between vessel hydraulic diameter and vessel density. This relationship was significantly negative at the lower crown position and became positive but not significant upward.
The same pattern was observed for the relationship between wood and leaf traits, especially the one between theoretical specific hydraulic conductivity and specific leaf area. This latter relationship was negative and not significant at the lower crown position but became positive and significant upward.

4. Discussion

4.1. Trait Variation and Plasticity within the Crown

We found a substantial variation of leaf and wood traits that was due to differences between (inter) and within (intra) individual trees of P. elata. These variations showed to be tissue and trait specific. The inter-individual variation was more important for leaf traits (23%–48%) than for wood traits (<10%) where the intra-individual variation showed to be important (33%–39%). For leaf traits, the intra-individual variation showed to be negligible (<15%) for some traits (leaf area, stomatal size, and leaf dry mass) unlike for others (specific leaf area, stomatal density, and maximum stomata density) where both inter- and intra-individual variation showed to be substantial. The substantial inter-individual variation of leaf traits might be related to environmental conditions (light, soil nutrient or soil water content, air temperature, and relative humidity) as predicted by previous studies [46,47]. However, our study was conducted within a limited spatial scale where environmental conditions were assumed to be homogenous. All the studied trees were fully exposed to sunlight and samples were collected on the outer part of the crown. Based on findings from Oumbe A. [29], the vertical variation of irradiance was not high enough along a reduced range (15 m to 44 m) corresponding to the range of the sample location height in this study. This suggests that the higher inter-individual trait variation we found would be due to genetic differentiation, soil water nutrient, or soil water content. However, it was beyond the scope of this study to test this hypothesis due to the limited sample size. The intra-individual trait variation highlighted here was expressed by the location height gradient within the crown. The prevalent reason for this trait variation along a height gradient within the crown could, therefore, be related to differences in water supply due to a non-optimal tapering of xylem conduit [23]. We found evidence for this assumption as a negative relationship between theoretical specific hydraulic conductivity, and sample location height within the crown was highlighted in this study. It was previously reported that a decrease in theoretical specific hydraulic conductivity is most closely related to a decrease in water availability because the turgor pressure as the driving force of cell expansion is largely affected by water availability [48,49]. Based on these findings, we could presumably conclude that the negative relationship between theoretical specific hydraulic conductivity and sample location height within the crown would be due to a reduced water availability and water supply potential occurring upward.
Leaf area and specific leaf area were negatively correlated with sample location height, suggesting that leaves became smaller upward. Also, stomatal density was positively correlated with sample location height, suggesting that stomatal number per unit leaf area increased upward. We suggest that these trends were due to the reduced water supply ability occurring upward. Similar trends have previously been reported across a gradient of water availability [50,51], indicating an adaptation to drought [52]. Further, we found a positive relationship between maximum stomatal conductance and sample location height, suggesting more potential water loss upward due to transpiration. This result was not consistent with previous findings as stomatal conductance has been reported to decrease with increasing tree total height and water deficit [53,54,55,56]. The reason for this counterintuitive result may be the effect of the sapwood area-to-leaf area ratio (AS:AL) as an increase in AS:AL has been suggested as a common structural adjustment compensating partially for the greater resistance to water flow in taller trees [57]. In this study, we found no significant variation of the cross-sectional area of sapwood (AS) along the height gradient within the crown but a decreasing theoretical specific hydraulic conductivity, suggesting that the vessel lumina fraction decreased upward. As leaf area also decreased upward, we could presumably relate the negative relationship between maximum stomatal conductance and sample location height to the decrease in leaf number per unit sapwood area upward. This will be an adjustment maintaining the water supply per unit leaf area and allowing trees to continue growing taller despite the water stress occurring upward. This result shows how the trait-based approach can help to unravel the drought response of tropical tree species. However, up to now little is known about the water-use strategy of most tropical species, including P. elata. More research is needed, especially on how foliar phenology responds to rainfall as tree water-use pattern has shown to be influenced by foliar phenology [58].

4.2. Trait Associations and the Effect of Sample Location Height

As for cross-species analysis, we found a negative relationship between vessel size and vessel density [59]. However, this relationship showed to change with the position within the crown. At lower canopy, a significant negative relationship between hydraulic conduit diameter and vessel density occurred, indicating that wood contains a small number of large vessels. At the top of the canopy, this relationship became fairly positive (Table 4). This change would be an adjustment to avoid twigs at the tree top dying because of xylem cavitation. As vessel size showed to only marginally decrease with Hs and the potential water deficit occurring at the tree top could increase the risk of embolism, twigs at the tree top produce many vessels to ensure that the drop-out of single vessels through embolism does not endanger the entire conductive system [60]. Another well documented tradeoff is that between hydraulic efficiency and mechanical strength. Woods with high hydraulic efficiency are supposed to have low mechanical strength [61,62]. However, we did not find evidence to support this tradeoff within the crown of P. elata. Theoretical specific hydraulic conductance increased significantly with vessel lumen fraction but decreased only fairly with fiber wall thickness, suggesting that high hydraulic conductivity may occur in twigs without significantly affecting their mechanical strength. This result corroborates the findings that for broad-leaved species, fiber wall thickness is rather related to wood density than wood hydraulic conductance [63].
For leaf traits, previous studies have reported that stomatal size is negatively related with stomatal density across plant species [64]. Within a given species, stomatal size and stomatal density are often not related. In our study, we found a significant negative relationship between stomatal size and stomatal density within P. elata, as has been reported by [41,64,65], and this relationship became stronger upward in the canopy, suggesting that leaves at the tree top have many smaller stomata per unit leaf area. This result suggests that leaves at the tree top have higher operating stomatal conductance under standard conditions, a higher maximum rate of stomatal opening in response to light, and a faster stomatal response [66]. These conditions have been associated with an enhanced water balance in dynamic light environments and a higher assimilation rate [67]. This means that trees of P. elata increase their stomatal density and decrease their stomatal size to be more flexible, especially at the top of the crown where the environment is more extreme and variable. No fiber-related traits showed significant relationships with leaf traits, suggesting that leaf–wood trade-off is more importantly functional than mechanical [68]. Elsewhere, larger leaves are expected to require high hydraulic conductance because they are assumed to be more evaporative than thicker leaves. We found evidence to support this assumption as we found a significant positive relationship between the specific leaf area and the theoretical hydraulic conductance. However, this relationship became stronger upward in the canopy. This result suggests that P. elata constantly adapts its water use with respect to its water-supply ability, more importantly at the top of the crown where the environment is more extreme and variable.

5. Conclusions

This study aimed at assessing traits variation at lower levels than inter-species to demonstrate the amount of trait variation that can be found within and between the crowns of a tropical tree species. We found that leaf traits varied more between canopies than between sample locations within the same tree crown, whereas wood traits were strongly dependent on location height within the crown and less variable between individuals. Studied traits covary with each other and these relationships interact with the location height within the crown. These findings stress the importance of accounting for the intra-individual traits variation to improve our understanding of plants’ functional responses.

Supplementary Materials

The following are available online at https://www.mdpi.com/1999-4907/11/1/35/s1, Figure S1: Plasticity of wood (blue) and leaf (red) traits within the crown of Pericopsis elata (Harms) Meeuwen (Fabaceae). Figure S2: Relationships between wood (twig) traits, theoretical specific hydraulic conductivity (Ktheo) as a function of the conduit tapering ratio (Tapering), vessel fraction and fiber wall thickness (Fw), and vessel density (number/area, N) as a function of hydraulic weighted vessel diameter (Dh), theoretical specific hydraulic conductivity (Ktheo), and fiber wall thickness (Fw) of Pericopsis elata (Harms) Meeuwen (Fabaceae). Figure S3: Relationships between theoretical specific hydraulic conductivity (Ktheo) and specific leaf area (SLA) of Pericopsis elata (Harms) Meeuwen (Fabaceae).

Author Contributions

H.B. and N.B. conceived and designed the experiment. N.B. carried out the experiment and performed field work. C.K. analyzed data, including laboratory processing and statistical analysis, and wrote the manuscript with support from M.R., T.D.M., S.M., B.T., P.-C.B., and L.N. The final draft of the manuscript received contributions from all authors. All authors have read and agreed to the published version of the manuscript.

Funding

This research was performed under projects “Biosphere traits” (UN/31) and “Herbaxylaredd” (BR/143/A3) funded by the Belgian Science Policy Office (Belspo).

Acknowledgments

We thank the company Resources and Synergies Development, through its manager G. Assimbo, for logistical assistance and the logging company CFT (Compagnie Forestière de Transformation) through its director K. Ammacha, for access to the concession and other logistical assistance. We are grateful to J. Komba (CFT) and the rest of the logging team for technical assistance on the field and K. Lievens (technical assistant at the Royal Museum of Central Africa) for contributions during laboratory processing. We also thank three anonymous reviewers for their valuable comments.

Conflicts of Interest

The authors declare no conflict of interest.

References

  1. Beeckman, H. Wood Anatomy and Tait-based ecology. IAWA J. 2016, 37, 127–151. [Google Scholar] [CrossRef]
  2. Lachenbruch, B.; Mcculloh, K.A. Traits, properties, and performance: How woody plants combine hydraulic and mechanical functions in a cell, tissue, or whole plant. New Phytol. 2014, 204, 747–764. [Google Scholar] [CrossRef] [PubMed]
  3. Violle, C.; Navas, M.L.; Vile, D.; Kazakou, E.; Fortunel, C.; Hummel, I.; Garnier, E. Let the concept of trait be functional! Oikos 2007, 116, 882–892. [Google Scholar] [CrossRef]
  4. Weiher, E.; van der Werf, A.; Thompson, K.; Roderick, M.; Garnier, E.; Eriksson, O. Challenging Theophrastus: A common core list of plant traits for functional ecology. J. Veg. Sci. 1999, 10, 609–620. [Google Scholar] [CrossRef]
  5. Jung, V.; Violle, C.; Mondy, C.; Hoffmann, L.; Muller, S. Intraspecific variability and trait-based community assembly. J. Ecol. 2010, 98, 1134–1140. [Google Scholar] [CrossRef]
  6. Savage, J.A.; Cavender-Bares, J. Habitat specialization and the role of trait lability in structuring diverse willow (genus Salix) communities. Ecology 2012, 93, 138–150. [Google Scholar] [CrossRef] [Green Version]
  7. Greenwood, S.; Ruiz-Benito, P.; Martinez-Vilalta, J.; Lloret, F.; Kitzberger, T.; Allen, D.C.; Fensham, R.; Laughlin, D.C.; Kattge, J.; Bönisch, G.; et al. Tree mortality across biomes is promoted by drought intensity, lower wood density and higher specific leaf area. Ecol. Lett. 2017, 20, 539–553. [Google Scholar] [CrossRef]
  8. Kraft, N.J.B.; Valencia, R.; Ackerly, D.D. Functional traits and niche-based tree community assembly in an Amazonian forest. Science 2008, 322, 580–582. [Google Scholar] [CrossRef] [Green Version]
  9. Visser, M.D.; Bruijning, M.; Wright, S.J.; Muller-Landau, H.C.; Jongejans, E.; Comita, L.S.; de Kroon, H. Functional traits as predictors of vital rates across the life cycle of tropical trees. Funct. Ecol. 2016, 30, 168–180. [Google Scholar] [CrossRef]
  10. Martínez-Vilalta, J.; Lloret, F.; Breshears, D.D. Drought-induced forest decline: Causes, scope and implications. Biol. Lett. 2012, 8, 689–691. [Google Scholar] [CrossRef]
  11. Skelton, R.P.; West, A.G.; Dawson, T.E. Predicting plant vulnerability to drought in biodiverse regions using functional traits. Proc. Natl. Acad. Sci. USA 2015, 112, 5744–5749. [Google Scholar] [CrossRef] [Green Version]
  12. Xu, Z.; Zhou, G. Responses of leaf stomatal density to water status and its relationship with photosynthesis in a grass. J. Exp. Bot. 2008, 59, 3317–3325. [Google Scholar] [CrossRef] [Green Version]
  13. Zhang, L.; Niu, H.; Wang, S.; Zhu, X.; Luo, C.; Li, Y.; Zhao, X. Gene or environment? Species-specific control of stomatal density and length. Ecol. Evol. 2012, 2, 1065–1070. [Google Scholar] [CrossRef]
  14. Ladjal, M.; Huc, R.; Ducrey, M. Drought effects on hydraulic conductivity and xylem vulnerability to embolism in diverse species and provenances of Mediterranean cedars. Tree Physiol. 2005, 25, 1109–1117. [Google Scholar] [CrossRef] [Green Version]
  15. Lovisolo, C.; Schubert, A. Effects of water stress on vessel size and xylem hydraulic conductivity in Vitis vinifera L. J. Exp. Bot. 1998, 49, 693–700. [Google Scholar]
  16. Savi, T.; Bertuzzi, S.; Branca, S.; Tretiach, M.; Nardini, A. Drought-induced xylem cavitation and hydraulic deterioration: Risk factors for urban trees under climate change? New Phytol. 2015, 205, 1106–1116. [Google Scholar] [CrossRef] [Green Version]
  17. Paine, C.E.T.; Baraloto, C.; Chave, J.; Hérault, B. Functional traits of individual trees reveal ecological constraints on community assembly in tropical rain forests. Oikos 2011, 120, 720–727. [Google Scholar] [CrossRef]
  18. Albert, C.H.; Thuiller, W.; Yoccoz, N.G.; Douzet, R.; Aubert, S.; Lavorel, S. A multi-trait approach reveals the structure and the relative importance of intra- vs. interspecific variability in plant traits. Funct. Ecol. 2010, 24, 1192–1201. [Google Scholar] [CrossRef]
  19. Chacón-Madrigal, E.; Wanek, W.; Hietz, P.; Dullinger, S. Is local trait variation related to total range size of tropical trees? PLoS ONE 2018, 13, e0193268. [Google Scholar] [CrossRef]
  20. Liu, R.; Liang, S.; Long, W.; Jiang, Y. Variations in Leaf Functional Traits Across Ecological Scales in Riparian Plant Communities of the Lijiang River, Guilin, Southwest China. Trop. Conserv. Sci. 2018, 11, 194008291880468. [Google Scholar] [CrossRef] [Green Version]
  21. Liu, C.; He, N.; Zhang, J.; Li, Y.; Wang, Q.; Sack, L.; Yu, G. Variation of stomatal traits from cold temperate to tropical forests and association with water use efficiency. Funct. Ecol. 2018, 32, 20–28. [Google Scholar] [CrossRef] [Green Version]
  22. Violle, C.; Enquist, B.J.; McGill, B.J.; Jiang, L.; Albert, C.H.; Hulshof, C.; Jung, V.; Messier, J. The return of the variance: Intraspecific variability in community ecology. Trends Ecol. Evol. 2012, 27, 244–252. [Google Scholar] [CrossRef]
  23. Anfodillo, T.; Carraro, V.; Carrer, M.; Fior, C.; Rossi, S. Convergent tapering of xylem conduits in different woody species. New Phytol. 2006, 169, 279–290. [Google Scholar] [CrossRef]
  24. Bourland, N.; Kouadio, L.Y.; Lejeune, P.; Sonké, B.; Philippart, J.; Daïnou, K.; Fétéké, F.; Doucet, J.-L. Ecology of Pericopsis elata (Fabaceae), an Endangered Timber Species in Southeastern Cameroon. Biotropica 2012, 44, 840–847. [Google Scholar]
  25. Boyemba, F. Ecologie de Pericopsis elata (Harms) Van Meeuwen (Fabaceae), Arbre de Forêt Tropicale Africaine à Répartition Agrégée. Ph.D. Thesis, Université Libre de Bruxelles, Bruxelles, Belgium, 2011, unpublished. [Google Scholar]
  26. De Ridder, M.; Toirambe, B.; Van den Bulcke, J.; Bourland, N.; Van Acker, J.; Beeckman, H. Dendrochronological potential in a semi-deciduous rainforest: The case of Pericopsis elata in central Africa. Forests 2014, 5, 3087–3106. [Google Scholar] [CrossRef]
  27. Hall, J.; Swaine, M.D. Distribution and Ecology of Vascular Plants in A Tropical Rain Forest; Werger, M.J., Ed.; Geobotany W. Junk: The Hague, The Netherlands, 1981; ISBN 9789400986527. [Google Scholar]
  28. White, F. La Végétation de L’afrique; ORSTOM-UNESCO: Paris, France, 1986; ISBN 9232019558. [Google Scholar]
  29. Oumbe, A.; Wald, L. A parameterisation of vertical profile of solar irradiance for correcting solar fluxes for changes in terrain elevation. In Proceedings of the Earth Observation and Water Cycle Science Conference, Frascati, Italy, 4 April 2010; p. S05. [Google Scholar]
  30. Jansen, S.; Kitin, P.; De Pauw, H.; Idris, M.; Beeckman, H.; Smets, E. Preparation of wood specimens for transmitted light microscopy and scanning electron microscopy. Belg. J. Bot. 1998, 131, 41–49. [Google Scholar]
  31. Schneider, C.A.; Rasband, W.S.; Eliceiri, K.W. NIH Image to ImageJ: 25 years of image analysis. Nat. Methods 2012, 9, 671. [Google Scholar] [CrossRef]
  32. Tyree, M.T.; Zimmermann, M.H. Xylem Structure and the Ascent of Sap; Timell, T.E., Ed.; Wood Scien.: Karnataka, India; Springer Verlag: Berlin, Germany, 2002; ISBN 9783642640711. [Google Scholar]
  33. Fortunel, C.; Ruelle, J.; Beauchêne, J.; Fine, P.V.A.; Baraloto, C. Wood specific gravity and anatomy of branches and roots in 113 Amazonian rainforest tree species across environmental gradients. New Phytol. 2014, 202, 79–94. [Google Scholar] [CrossRef]
  34. Zanne, A.E.; Westoby, M.; Falster, D.S.; Ackerly, D.D.; Loarie, S.R.; Arnold, S.E.J.; Coomes, D.A. Angiosperm wood structure: Global patterns in vessel anatomy and their relation to wood density and potential conductivity. Am. J. Bot. 2010, 97, 207–215. [Google Scholar] [CrossRef] [Green Version]
  35. Sterck, F.J.; Zweifel, R.; Sass-Klaassen, U.; Chowdhury, Q. Persisting soil drought reduces leaf specific conductivity in Scots pine (Pinus sylvestris) and pubescent oak (Quercus pubescens). Tree Physiol. 2008, 28, 529–536. [Google Scholar] [CrossRef] [Green Version]
  36. Pérez-Harguindeguy, N.; Díaz, S.; Garnier, E.; Lavorel, S.; Poorter, H.; Jaureguiberry, P.; Bret-Harte, M.S.; Cornwell, W.K.; Craine, J.M.; Gurvich, D.E.; et al. New handbook for standardised measurement of plant functional traits worldwide. Aust. J. Bot. 2013, 61, 167–234. [Google Scholar] [CrossRef]
  37. Taylor, S.H.; Franks, P.J.; Hulme, S.P.; Spriggs, E.; Christin, P.A.; Edwards, E.J.; Woodward, F.I.; Osborne, C.P. Photosynthetic pathway and ecological adaptation explain stomatal trait diversity amongst grasses. New Phytol. 2012, 193, 387–396. [Google Scholar] [CrossRef]
  38. Brown, H.T.; Escombe, F. Static diffusion of gases and liquids in relation to the assimilation of carbon and translocation in plants. Ann. Bot. 1900, 14, 537–542. [Google Scholar] [CrossRef]
  39. Franks, P.J.; Farquhar, C.D. The Mechanical Diversity of Stomata and Its Significance in Gas-Exchange Control. Plant Physiol. 2006, 143, 78–87. [Google Scholar] [CrossRef] [Green Version]
  40. Dow, G.J.; Bergmann, D.C.; Berry, J.A. An integrated model of stomatal development and leaf physiology. New Phytol. 2014, 201, 1218–1226. [Google Scholar] [CrossRef]
  41. Fanourakis, D.; Giday, H.; Milla, R.; Pieruschka, R.; Kjaer, K.H.; Bolger, M.; Vasilevski, A.; Nunes-Nesi, A.; Fiorani, F.; Ottosen, C.O. Pore size regulates operating stomatal conductance, while stomatal densities drive the partitioning of conductance between leaf sides. Ann. Bot. 2015, 115, 555–565. [Google Scholar] [CrossRef] [Green Version]
  42. Bates, D.; Mächler, M.; Bolker, B.M.; Walker, S.C. Fitting Linear Mixed-Effects Models Using lme4. J. Stat. Softw. 2015, 67, 1–48. [Google Scholar] [CrossRef]
  43. R Core Team. R: A Language and Environment for Statistical Computing; R Core Team: Vienna, Austria, 2018; Volume 1, pp. 1–2630. [Google Scholar]
  44. Shieh, G. Clarifying the role of mean centring in multicollinearity of interaction effects. Br. J. Math. Stat. Psychol. 2011, 64, 462–477. [Google Scholar] [CrossRef]
  45. Logan, M. Biostatistical Design and Analysis Using R: A Practical Guide; Wiley-Blackwell: Oxford, UK, 2010; ISBN 9781444335248. [Google Scholar]
  46. Siefert, A. Incorporating intraspecific variation in tests of trait-based community assembly. Oecologia 2012, 170, 767–775. [Google Scholar] [CrossRef]
  47. Ordoñez, J.C.; Van Bodegom, P.M.; Witte, J.P.M.; Bartholomeus, R.P.; Van Dobben, H.F.; Aerts, R. Leaf habit and woodiness regulate different leaf economy traits at a given nutrient supply. Ecology 2010, 91, 3218–3228. [Google Scholar] [CrossRef]
  48. Oladi, R.; Bräuning, A.; Pourtahmasi, K. “Plastic” and “static” behavior of vessel-anatomical features in Oriental beech (Fagus orientalis Lipsky) in view of xylem hydraulic conductivity. Trees-Struct. Funct. 2014, 28, 493–502. [Google Scholar] [CrossRef]
  49. Giagli, K.; Gričar, J.; Vavrčík, H.; Menšík, L.; Gryc, V. The effects of drought on wood formation in Fagus Sylvatica during two contrasting years. IAWA J. 2016, 37, 332–348. [Google Scholar] [CrossRef]
  50. Zhang, Y.; Chen, J.M.; Miller, J.R. Determining digital hemispherical photograph exposure for leaf area index estimation. Agric. For. Meteorol. 2005, 133, 166–181. [Google Scholar] [CrossRef]
  51. Xu, Z.; Zhou, G. Effects of water stress and nocturnal temperature on carbon allocation in the perennial grass, Leymus chinensis. Physiol. Plant. 2005, 123, 272–280. [Google Scholar] [CrossRef]
  52. Martínez, J.P.; Silva, H.; Ledent, J.F.; Pinto, M. Effect of drought stress on the osmotic adjustment, cell wall elasticity and cell volume of six cultivars of common beans (Phaseolus vulgaris L.). Eur. J. Agron. 2007, 26, 30–38. [Google Scholar] [CrossRef]
  53. Hubbard, R.M.; Bond, B.J.; Senock, R.S.; Ryan, M.G. Effects of branch height on leaf gas exchange, branch hydraulic conductance and branch sap flux in open-grown ponderosa pine. Tree Physiol. 2002, 22, 575–581. [Google Scholar] [CrossRef] [Green Version]
  54. Delzon, S.; Sartore, M.; Burlett, R.; Dewar, R.; Loustau, D. Hydraulic responses to height growth in maritime pine trees. Plant Cell Environ. 2004, 27, 1077–1087. [Google Scholar] [CrossRef]
  55. Zaehle, S. Effect of height on tree hydraulic conductance incompletely compensated by xylem tapering. Funct. Ecol. 2005, 19, 359–364. [Google Scholar] [CrossRef]
  56. Whitehead, D. Regulations of stomatal conductance and transpiration in forest canopies. Tree Physiol. 1998, 18, 633–644. [Google Scholar] [CrossRef]
  57. McDowell, N.; Barnard, H.; Bond, B.J.; Hinckley, T.; Hubbard, R.M.; Ishii, H.; Köstner, B.; Magnani, F.; Marshall, J.D.; Meinzer, F.C.; et al. The relationship between tree height and leaf area: Sapwood area ratio. Oecologia 2002, 132, 12–20. [Google Scholar] [CrossRef]
  58. Butz, P.; Hölscher, D.; Cueva, E.; Graefe, S. Tree Water Use Patterns as Influenced by Phenology in a Dry Forest of Southern Ecuador. Front. Plant Sci. 2018, 9, 945. [Google Scholar] [CrossRef] [Green Version]
  59. Sperry, J.S.; Meinzer, F.C.; McCulloh, K.A. Safety and efficiency conflicts in hydraulic architecture: Scaling from tissues to trees. Plant Cell Environ. 2008, 31, 632–645. [Google Scholar] [CrossRef]
  60. Fichtler, E.; Worbes, M. Wood anatomical variables in tropical trees and their relation to site conditions and individual tree morphology. IAWA J. 2012, 33, 119–140. [Google Scholar] [CrossRef]
  61. Fan, Z.-X.; Sterck, F.; Zhang, S.-B.; Fu, P.-L.; Hao, G.-Y. Tradeoff between Stem Hydraulic Efficiency and Mechanical Strength Affects Leaf–Stem Allometry in 28 Ficus Tree Species. Front. Plant Sci. 2017, 8, 1619–1629. [Google Scholar] [CrossRef] [Green Version]
  62. Santiago, L.S.; Goldstein, B.G.; Meinzer, F.C.; Fisher, J.B.; Maehado, K.; Woodruff, D.; Jones, T. Leaf photosynthetic traits scale with hydraulic conductivity and wood density in Panamanian forest canopy trees. Oecologia 2004, 140, 543–550. [Google Scholar] [CrossRef]
  63. Jacobsen, A.L.; Pratt, R.B.; Ewers, F.W.; Davis, S.D. Cavitation resistance among 26 chaparral species of southern California. Ecol. Monogr. 2007, 77, 99–115. [Google Scholar] [CrossRef]
  64. Franks, P.J.; Drake, P.L.; Beerling, D.J. Plasticity in maximum stomatal conductance constrained by negative correlation between stomatal size and density: An analysis using Eucalyptus globulus. Plant Cell Environ. 2009, 32, 1737–1748. [Google Scholar] [CrossRef]
  65. Douhovnikoff, V.; Taylor, S.H.; Hazelton, E.L.G.; Smith, C.M.; O’Brien, J. Maximal stomatal conductance to water and plasticity in stomatal traits differ between native and invasive introduced lineages of Phragmites australis in North America. AoB Plants 2016, 8, 1–11. [Google Scholar] [CrossRef] [Green Version]
  66. Drake, R.E.; Frey, W.; Bond, G.R.; Goldman, H.H.; Salkever, D.; Miller, A.; Moore, T.A.; Riley, J.; Karakus, M.; Milfort, R. Assisting social security disability insurance beneficiaries with schizophrenia, bipolar disorder, or major depression in returning to work. Am. J. Psychiatry 2013, 170, 1433–1441. [Google Scholar] [CrossRef]
  67. Aasamaa, K.; Sõber, A.; Rahi, M. Leaf anatomical characteristics associated with shoot hydraulic conductance, stomatal conductance and stomatal sensitivity to changes of leaf water status in temperate deciduous trees. Funct. Plant Biol. 2001, 28, 765–774. [Google Scholar] [CrossRef]
  68. Niinemets, Ü.; Portsmuth, A.; Tena, D.; Tobias, M.; Matesanz, S.; Valladares, F. Do we underestimate the importance of leaf size in plant economics? Disproportional scaling of support costs within the spectrum of leaf physiognomy. Ann. Bot. 2007, 100, 283–303. [Google Scholar] [CrossRef]
Figure 1. Conceptual framework illustrating the expected traits relationships and the underlying plant tradeoffs. The thickness of the line connecting traits indicates the consistency and the strength of the relationship. A dotted line indicates the weakest and most inconsistent traits relationships. Traits are grouped into two boxes as they are related to leaves (upper box) or wood/twig (lower box). The sign of the relationship is also provided. Traits include leaf area, specific leaf area (SLA), stomatal density (Dstomata), stomatal size (Sstomata), theoretical specific hydraulic conductivity (Ktheo), fiber wall thickness (Fw), vessel density, and vessel size.
Forests 11 00035 g001
Figure 2. Leaf and wood features of Pericopsis elata (Harms) Meeuwen (Fabaceae): Vessels (a,b) and fiber (c,d) on a cross-section of wood from the trunk at 1.3 m above the ground level (a,c) and from a twig of 0.3 cm diameter (b,d), the imprint photograph of a leaflet collected at the bottom part of the crown (e) and at the top of the crown (f). The images were made with the objective lenses of 10× for (a,b) and 40× for others. The length of the scale is 200 µm for (a,b), and 50 µm for the others.
Forests 11 00035 g002
Figure 3. Relationships between leaf traits, stomatal density (Dstomata), stomatal size (b), and leaf area (LA) (a) of Pericopsis elata (Harms) Meeuwen (Fabaceae). Regression line, Pearson correlation (r) and significance levels (p) are provided. Horizontal and vertical bars indicate the standard error of the mean.
Forests 11 00035 g003
Figure 4. Leaf and wood traits, specific leaf area (SLA) (a), stomatal density (Dstomata) (b), maximum stomatal conductance (gsmax) (c), vessel diameter (d), fiber wall thickness (Fw) (e), and theoretical specific hydraulic conductivity (Ktheo) (f) of Pericopsis elata (Harms) Meeuwen (Fabaceae) as a function of the sample location height. Regression line for significant relationship (p < 0.05), Pearson correlation (R), and significance levels (p) are provided.
Forests 11 00035 g004
Table 1. Museum code (Tw: Tervuren wood), locations in decimal degree, total height (Ht) and diameter at breast height (DBH) of the five studied trees of Pericopsis elata (Harms) Meeuwen (Fabaceae).
Museum CodeLongitudeLatitudeHt (m)DBH (cm)
Tw6904225.420970.1189541.099.5
Tw6904325.421250.1215743.3126.0
Tw6904525.401370.1174342.0105.3
Tw6904625.396760.1175240.9142.5
Tw6904725.395370.1487142.493.9
Table 2. Leaf and twig wood traits statistics of the five studied individuals of Pericopsis elata (Harms) Meeuwen (Fabaceae) at the 95% confidence interval (CI). Wood traits include the fiber wall thickness (Fw), theoretical specific hydraulic conductivity (Ktheo), vessel density (N, vessel number per unit area), hydraulic weighted vessel diameter (Dh), vessel lumen area (A), and diameter (D), while leaf traits include leaf area (LA), leaf dry mass (LDM), specific leaf area (SLA), stomatal density (Dstomata), stomatal size, and maximum stomatal conductance (gsmax). Trait plasticity within the crown is provided, as well as its standard deviation.
Traits95% CI StatisticsPlasticity (%)
MeannRangeSECV
Wood Traits
D (µm)42.4566021.3–64.30.30.1823.4 ± 4.8
A (µm2)1303.4660319.3–2798.2180.3642.1 ± 6.8
Fw (µm)3.086601.15–5.950.040.2529.7 ± 12.5
N (mm−1)186.7222121.9–256.36.50.1626.6 ± 4.4
Dh (µm)43.592233.2–53.31.130.1221.6 ± 3.4
Ktheo (kg m−1 MPa s−1)0.86220.25–1.740.080.4457.7 ± 12.8
Leaf Traits
LA (mm2)703.83119175–173927.640.4333.9 ± 13.1
LDM (mg)54.7611911.3–1522.520.5040.5 ± 15.3
SLA (mm.mg−1)13.841196.7–23.60.330.2627.3 ± 16.4
Dstomata (mm−2)374.1690208–553.18.950.2328.9 ± 8.9
Stomatal size (µm)76.646964–910.750.088.1 ± 4.5
gsmax (mole m−2 s−1)1.39690.73–2.030.040.2227.3 ± 10.9
n, number of observations (corresponding to the number of vessels for D and A, of fibers for Fw, of wood samples for N, Dh, and Ktheo, and of leaflets for all leaf traits); SE, standard error; CV, coefficient of variation.
Table 3. Variance partitioning of linear mixed models with a random effect on tree across the nested sample location height within the tree crown (Hs). Wood traits include the fiber wall thickness (Fw), theoretical specific hydraulic conductivity (Ktheo), vessel density (N, vessel number per unit area), hydraulic weighted vessel diameter (Dh), vessel lumen area (A), and diameter (D), while leaf traits include leaf area (LA), leaf dry mass (LDM), specific leaf area (SLA), stomatal density (Dstomata), stomatal size, and maximum stomatal conductance (gsmax). Parentheses represent the 95% confidence interval (CI) computed by bootstrapping (500 runs with 1000 randomly sampled data points with replacement). The correlation coefficient (R²) and the significance (p-value) of the models are also provided (with p-value < 0.01: ** and p-value < 0.001: ***).
Traits% Variance of Traits (95% CI)Model
TreeHsErrorR2p-Value
Wood traits
D (µm)8.7 (8.4–9.0)36.9 (35.9–37.9)54.4 (53.0–55.8)0.46***
A (µm2)10.0 (9.7–10.3)36.5 (35.5–37.5)53.5 (52.0–55.0)0.46***
Fw (µm)4.8 (4.6–5.0)34.5 (33.5–35.3)60.8 (59.3–62.5)0.39***
N35.1 (34.1–36.1)-64.9 (63.2–66.6)0.35***
Dh8.1 (7.8–8.4)-91.9 (89.5–94.3)0.10***
Ktheo49.1 (47.7–50.5)-50.9 (49.5–52.3)0.49**
Leaf traits
LA (mm2)41.1 (40.0–42.2)11.1 (10.8–11.4)47.8 (46.6–49.2)0.52***
LDM (mg)53.5 (52.1–54.9)14.1 (13.7–14.5)32.4 (31.5–33.3)0.68***
SLA (mm.mg−1)41.5 (40.4–42.6)35.1 (34.1–36.1)23.3 (22.7–23.9)0.77***
Dstomata (mm−2)29.3 (28.5–30.1)17.2 (16.6–17.6)53.5 (52.1–54.9)0.46***
Stomatal size (µm)32.8 (31.9–33.7)9.2 (8.9–9.5)58.0 (56.5–59.5)0.42***
gsmax (mole m−2 s−1)25.1 (24.4–25.8)17.9 (17.4–18.4)57.0 (55.5–58.5)0.43**
Table 4. Simple slope of multiplicative linear models for a range of sample location heights (Hs). Coefficient of determination (R2), F-value (F), and significance (p-value) of the relationship (with p-value > 0.05: ns; p-value < 0.05: *; p-value < 0.01: ** and p-value < 0.001: ***) are provided. Leaf traits include stomatal density (Dstomata), specific leaf area (SLA), maximum stomatal conductance (gsmax), stomatal size (S), leaf area (LA), and leaf dry mass (LDM) while wood traits include theoretical specific hydraulic conductivity (Ktheo), conduit tapering (T), vessel fraction (VF), fiber wall thickness (Fw), hydraulic weighted vessel diameter (Dh), vessel density (VD), total vessel number (TVN), and cross-sectional area of sapwood (As).
Model X ¯ H s 2 σ X ¯ H s 1 σ X ¯ H s + 1 σ X ¯ H s + 2 σ Model Fit
R2Fp
Leaf
Dstomata ~ SLA × Hs−13.53 *−9.61 *−1.75 ns2.90 ns0.225.69**
gs ~ SLA × Hs−0.075 **−0.055 **−0.015 ns0.005 ns0.424.51*
S ~ Dstomata × Hs−0.021 ns−0.029 *−0.046 ***−0.055 **0.256.81***
LA ~ Dstomata × Hs−2.096 *−1.802 **−1.212 ns−0.918 ns0.225.79**
Wood
Ktheo ~ T × Hs0.038 ns−0.235 ns−0.782 **−1.056 *0.454.12*
VF ~ Ktheo × Hs0.039 ns0.075 ns0.147 ***0.182 **0.577.03**
Fw ~ Ktheo × Hs0.219 ns0.039 ns−0.321 ns−0.501 ns0.070.39ns
Dh ~ VD × Hs−0.293 *−0.188 *0.021 ns0.126 ns0.272.01*
Ktheo ~ VD × Hs−0.009 ns−0.005 ns0.004 ns0.009 ns0.221.51ns
Fw ~ VD × Hs−0.012 ns−0.008 ns−0.004 ns−0.002 ns0.150.90ns
Leaf vs. wood
Ktheo ~ LDM × Hs0.093 ns0.029 ns−0.096 ns−0.159 ns0.120.73ns
TVN ~ LDM × Hs−1.347 ns1.634 ns7.596 *10.577 *0.363.02ns
Ktheo ~ SLA × Hs−0.020 ns0.038 ns0.154 ***0.212 **0.597.75**
T ~ SLA × Hs0.113 ns0.045 ns−0.093 ns−0.162 ns0.241.64ns

