Chemical Structure and Mechanical Properties of Wood Cell Walls Treated with Acid and Alkali Solution


Research Institute of Wood Industry, Chinese Academy of Forestry, Beijing 100091, China
*
Author to whom correspondence should be addressed.
Forests 2020, 11(1), 87; https://doi.org/10.3390/f11010087
Submission received: 13 December 2019
/
Revised: 8 January 2020
/
Accepted: 8 January 2020
/
Published: 10 January 2020
(This article belongs to the Special Issue Wood Science and Tropical Forest Ecology)
Abstract
:The mechanical properties of individual fibers are related to the production and performance of papers and fiberboards. This paper examines the behavior of the microstructure constituents of wood subjected to acid and alkali treatments. The chemical structure and mechanical properties of wood cell walls with different acid or alkali treatments was analyzed. The results show that, compared with acid treatment, the crystal size and crystallinity index of cellulose increased after alkali treatment, resulting in an increase in the cell wall elastic modulus. The mechanical properties of the wood cell wall S2 region were higher than those of the compound middle lamella (CML) region. There was a topochemical effect between the CML and the S2 region in acid and alkali-treated samples, which provided a major threshold that facilitates the production/separation of wood fibers for better strength fiber properties.
1. Introduction
The mechanical properties of individual fibers are related to the production and performance of papers and fiberboards. For paper and fiberboard production, the singular fibers are ground into wood pulp and then refined by mechanical, chemical or chemi-mechanical defibrillation. In mechanical pulping, temperature and mechanical force are often used to soften and separate fibers [1]. As there is no material loss during mechanical pulping, the pulp output can be as high as 90% [2]. Chemical pulping produces a pulp in lower yields but with better strength [3]. Chemi-mechanical pulping combines the advantages of a high pulping rate, low pulping cost, and high fiber strength [4,5]. Chemi-mechanical pulping generally involves an alkali and acid pre-treatment [5,6,7], that undergoes two main steps of (1) the lignin in the middle lamella being separated into individual fibers under the chemical attack and (2) the lignin in the cell walls being removed to make the fibers flexible, resulting in higher paper strength [8].
The alkaline process for natural fiber materials is generally carried out at a certain temperature (heating) in mixed solution of sodium hydroxide and sodium sulphide—it is precisely affected by hydroxide ions and hydrosulfide ions [8]. Alkaline treatment is mainly used to degrade and dissolve lignin—unfortunately, the chemistry of the process normally cannot be fully selective toward lignin. Therefore, hemicelluloses and other carbohydrates also degrade during processing. The effects of alkali concentration, treatment time and temperature on the chemical structure of fibers and their mechanical properties have attracted much attention [9,10,11,12]. Cellulose crystallinity in an alkali treatment has been found to be higher than that in a control sample [13]. The lateral fibril aggregate dimensions of cellulose in alkali treatments have also been found to be larger, though the conversion of cellulose I to cellulose II is inconsistent in many research results [14,15,16]. The tensile strength and elastic modulus of the fibers also increased after alkali treatment because lignin and hemicellulose were removed [9,17].
Alkali treatment is the most common method to remove lignin from wood in the industry; however, due to the incomplete lignin removal (about 90%–95%), it is not preferred for isolating holocellulose. Acid–chlorite delignification with acetic acid and sodium chlorite aqueous may be the most commonly used method to remove lignin from biomass. This method can effectively bleach and dissolve lignin at moderate temperatures. Acid–chlorite mainly affects lignin in biomass and also affect other polysaccharides [18,19,20]. Kumar et al. (2009) reported that the process of acid-chlorite delignification has obvious adverse effects on the length of cellulose chains [20]. According to Grierer (1986), in the process of acid–chlorite delignification, cellulose degradation is mainly composed of two parts—one is the acid fracture of glycosidic bonds, the other is the oxidative degradation of polysaccharides [19]. Acid hydrolysis can reduce the molecular weight of cellulose under weakly acidic conditions, and has been widely used [21]. The oxidation of cellulose is mostly borrowed from hypochlorite to achieve the maximum degradation rate under neutral pH conditions, but its treatment effect is non-specific [22]. Considering the slow oxidative degradation under acidic conditions [23], acetic acid can be used to reduce the pH of the solution during delignification. However, the addition of acetic acid increases the possibility of the hydrolysis of cellulose chains under acidic conditions.
Masson pine (Pinus massoniana Lamb.) is the most widely distributed pine species in China, and is also an important pioneer tree species and a main commercial species in southern China. It has a moderate wood density, long tracheids, and a clear texture, and is an excellent raw material for pulp and fiberboard, widely used in furniture manufacturing, wood-based panels and wood structural components production, etc. This study investigates the effects of acid and alkali solutions treatment on the microstructure constituents of Masson pine wood. Both the chemical structure and mechanical properties of the cell walls were examined. Optimum process parameters were generated to make the cell wall have high mechanical properties. The outcomes of the study could facilitate the effective separation of wood fibers in an energy-efficient manner and the improvement of the fiber strength during the delignification pre-treatment process.
2. Materials and Methods
2.1. Materials
The wood was sampled at 1.5 m tree height from a mature green wood, Pinus massoniana Lamb., (growth rings 75 ± 5) that had a density of 0.51 g/cm3, located in Nanjing, Jiangsu Province, China. The 40th growth ring latewood was used; this part of the wood had a thicker compound middle lamella (CML) region (1.0 μm~1.5 μm) compared to that in other regions, and such to ensure an accurate determination of the chemical structure and mechanical properties within the CML region. The samples were carefully prepared by splitting with a two-edged knife evenly in all directions (1 mm (tangential) by 1 mm (radial) by 10 mm (longitudinal)). The prepared samples were arbitrarily divided into three groups, namely the control group, acid treatment group and alkali treatment group. The acid treatment group and alkali treatment group samples were immersed in water at 80 °C for 24 h, then extracted with benzene/ethanol (volume ratio 2:1, B/E extraction) at 80 °C in a Soxhlet apparatus (BGG, Beijing, China) for 24 h in order to remove wood extracts or any contamination. These samples were then treated by acid or alkali solution, depending on their group designation.
2.2. Acid and Alkali Treatment
The acid liquor consisted of 150 mL of water, 2 g of sodium chlorite (NaClO2) and 2.5 mL of acetic acid (CH3COOH). The alkali treatment solution was 1.0 mol/L sodium hydroxide solution. Two group samples were soaked in acid or alkali solution at 80 °C in a Soxhlet apparatus for 2, 4, 6 and 8 h, respectively. After this, the samples were individually rinsed thoroughly in deionized water until the pH value reached 7 to avoid the influence of other treatment solutions. All treated samples and the control group were dried in an air-dry oven at 80 °C for 24 h.
2.3. Confocal Raman Microscopy (CRM)
A 20 μm thick slice was cut on a rotary microtome (LEICA RM2255, Köln, Germany), immediately placed on a glass slide, and a cover slip was used to seal after dropping a drop of deuteroxide to avoid a decrease in moisture during the measurement. The spectra were obtained from a confocal Raman microscope (CRM200, WITEC, Ulm, Germany) equipped with a piezo scanner (P-500, Physik Instrumente, Karlsruhe, Germany) and a high numerical aperture (NA) microscope objective (Nikon, 100 oil NA 5 1.25, Tokyo, Japan). A linear polarized laser (diode pumped green laser, λ = 532 nm, CrystaLaser, Toptica Photonics AG, Graefelfing, Germany) was focused with a diffraction-limited spot size (0.61 λ/NA) and the Raman light was detected using an air-cooled, back-illuminated spectroscopic CCD (ANDOR) behind a grating (600 g/mm) spectrograph (ACTON). The laser power on the sample was approximately 5 mW. The wavenumber ranged from 3200 cm−1 to 250 cm−1, and the resolutionwas 4 cm−1. The step length between two points was 0.5 μm, and the integration time was 2 s. Five cells of each group sample were arbitrarily selected from the radial and tangential walls of each cell wall (Figure 1). With the illumination of a line on the sample, all the spectral information of the line was recorded. The chemical spectrographs of the CML region or S2 region for each group samples were the mean values of all spectrographs of the CML region or the S2 region from each individual group. Labspec 5 software was used for spectra baseline correction at 3100 cm−1, 1800 cm−1, 700 cm−1 and 300 cm−1, then standardization was performed. The average spectra of the CML and S2 region illustrated the differences in chemicals or chemical structures.
2.4. Nanoindentation
The static indentation method was used to measure the elastic modulus and hardness of the cell walls of treated wood. All experiments were performed on a Hysitron TI 950 nanoindenter, with a Berkovich diamond pyramid and the tip radius of the indenter of 100 nm. Before the test, the samples were kept in the test chamber at 25 °C and 40 ± 3% relative humidity for at least 24 h. To reduce the test error caused by surface roughness and to ensure the accuracy of the indentation location (particularly for the CML region), the depth of indentation was set to be greater than 100 nm and less than 200 nm. The peak force was 200 μN, with a standard holding time of 2 s, and loading and unloading time of 5 s each. The samples did not embed with resin in order to decrease the effect of the resin on the mechanical properties of the cell wall. The samples were vertically fixed on the cylindrical holder by a hot melt adhesive and the cross section area (about 0.5 mm × 0.5 mm) was cut by an ultramicrotome with a diamond knife to keep the cutting surface smooth (Figure 1). We randomly selected 3 samples of each treatment and measured 45 points of each sample at S2 and CML region, respectively. In the final analysis, only the indentations in the valid positions verified by the scanning probe microscope image were used—that is, they were clearly located in the S2 or CML region. For example, for the CML nanoindentations, the indents were in the middle of CML region to avoid overlapping with the S1 layer or being affected by the edge effect. The elastic modulus and hardness of cell walls and CML region for this treatment wood were averages of those 135 points. Indentation positions of S2 and CML region are shown in Figure 1.
2.5. X-ray Diffraction
XRD sample patterns were measured using the XRD (D/max 2200, Rigaku, Japan), with Ni-filtered CuKα radiation (λ = 0.154 nm) at 40 kV and 30 mA. The scattered radiation was detected in the range of 2θ = 5°~50° at a scan rate of 1 °/min. The background was subtracted, and the peaks were resolved using PeakFitR (Sea-Solve Software Inc., Richmond, CA, USA). The crystallinity index (CrI) was determined using the Turley method, as follows:
CrI = (I002 − Iam)/I002 × 100%
The crystal size dimension, Dhkl, was evaluated by Scherrer’s equation:
where K is the Scherrer constant (K = 0.9), λ is the wavelength of the X-ray and β1/2 is the peak full width at half of maxima intensity obtained by MDI Jade software, when peak fitting was conducted with the Gaussian function.
Dhkl = Kλ/(β1/2 × cos θ)
2.6. Data Statistical Analysis
The analysis of variance (ANOVA) was made on the data to evaluate the effect of acid and alkali treatment on the elastic modulus and hardness properties using the SAS program (SAS Institute 9.0, Cary, NC, USA). The least significant difference test was used to test for significant differences at a 95% probability confidence interval.
3. Results
3.1. Changes in Chemical Structure after Acid and Alkali Treatments
3.1.1. Acid Treatment
The characteristic lignin band near 1600 cm−1 is due to aromatic skeletal vibrations, and the band at 1271 cm−1 is due to either the guaiacyl ring or methoxy-aromatics [24,25]. The sample without treatment is included for comparison (Figure 2). From the peak intensities at 1271 cm−1 and 1600 cm−1, the lignin concentration in the control sample was higher in the CML region than in the S2 region. The Raman spectrograms in Figure 2a,b show the changes in cell wall composition with different acid treatments. A plot of cell wall delignification rate versus time for different treatments is shown in Figure 3. The delignification rate is defined as the percentage reduction in lignin signal peak intensity for each treatment time period. For the 2 h treatment sample, the delignification rate (Figure 3) and the change in the 1600 cm−1 peak intensity (Figure 2) before and after treatment were small, indicating that the lignin was almost unchanged for the S2 and CML region during this time period. As the time increased to 4 h, the relative intensities of the peaks at 1600 cm−1 and 1271 cm−1 significantly decreased (Figure 2a,b) and the delignification rate reached the maximum value at 4 h (Figure 3), indicating that a large amount of lignin was dissolved. When the treatment time continued to increase from 6 h to 8 h, the intensity of the peaks at both 1600 cm−1 and 1271 cm−1 continued to decrease, especially at 1271 cm−1, which almost disappeared, and the delignification rate was decreased (Figure 3). This means that there may be little lignin residue in the samples. The delignification degree of the CML region was severer than that of S2 region for the whole process. This difference in the delignification between the S2 and CML region is called a topochemical effect. This difference in lignin reactivity was likely the result of the differences not only in chemical structures (e.g., middle lamella lignin has lower phenolic O-H, lower uncondensed β-O-4 aryl ethers and lower methoxyl content than S2 lignin, and S2 lignin is relatively more crosslinked) but also the presence of carbohydrate polymers. The latter has fewer interactions or associations with the middle lamella lignin and the kinetics of delignification is less dependent on diffusion than S2 lignin [26].
Two vibration bands of cellulose, the β-D glucoside bending at 380 cm−1 and the C-H and C-H2 stretching at 2895 cm−1, were monitored. In untreated wood, the S2 region had a higher concentration of cellulose than the CML region (Figure 2). This was consistent with previous reports [25]. The Raman spectra obtained from the CML and S2 regions were averaged before analysis, and are shown in Figure 2a,b. The changes in the crystallinity index and crystallite size under acid treatments are shown in Table 1. The relative intensities of the peaks at 380 cm−1 and 2895 cm−1 in the S2 and CML region was almost unchanged after 2 h of acid treatment. This may be due to cellulose being protected by lignin and not in contact with the acid solution during the initial acid treatment stage (lignin was almost unchanged in this period). When the treatment time was increased from 2 h to 6 h, much more lignin was dissolved, meaning that cellulose may be exposed and begin to dissolve. The intensity of the cellulose signal of the treated wood decreased notably in both the CML and S2 region due to cellulose molecules being depolymerized. It is very interesting that the crystallinity index of the acid treated wood increased from 47.54% to 53.80% from the benzene/ethanol (B/E) treatment for 6 h acid treatment (Table 1). This indicates that there may be the dissolution of non-crystalline materials, such as hemicellulose, and the dissolution of the cellulose amorphous region, in which a depolymerization occurred in the amorphous region through the breakdown of β-(1,4)-bonds between the saccharide units of cellulose. When the processing intensity increased again, however, the crystallinity index decreased due to the breakdown of crystalline cellulose. From 6 h to 8 h of treatment intensity, the crystallite size decreased from 2.99 to 2.74 nm (Table 1), and inversely correlated with treatment intensity because of acid hydrolysis or oxidative cleavage of the cellulose chain [27].
3.1.2. Alkali Treatment
The reduction in the peak intensity at 1600 cm−1 in Figure 2c,d assigned to aromatic skeletal vibrations indicates that lignin in the CML and S2 region may be partially removed during the alkali processing. According to the dissolution of lignin, the alkali treatment can be divided into three phases [8]. In the initial phase, the lignin is softened, whereas the carbohydrates are lost (especially glucomannan) and the pectin is dissolved. In the bulk phase, most of the lignin is removed and the carbohydrates are dissolved. As showed in Figure 3, the delignification rate was highest in the 4 h treatment time, then the delignification rate began to decrease. Most of the lignin was dissolved in the 6 h treatment period (Figure 2c,d). During the residual phase (8 h), the lignin dissolution is slow, even though polysaccharide degradation occurs to some extent. By contrast, the lignin in the S2 region dissolved faster than that in the CML region and this topochemical effect between S2 and CML region was opposite to that observed in the acid treatment. There seem to be two factors involved in the dissolution of lignin from the CML and S2 region. First, there may be inherent chemical differences in the lignin itself in the CML and S2 region, and those differences may cause the CML lignin to be less reactive with NaOH than the S2 lignin. Second, the dissolution of hemicelluloses from the secondary wall during alkali treatment increases the size of the pores in the wall and thereby allows the secondary wall lignin to be removed more quickly [28].
Microfibrils were also prone to dissolve when the cell wall lost lignin. Two vibration bands, signals of cellulose at 380 cm−1 and 2895 cm−1, decreased notably after 4 h of alkali exposure, as the lignin in the cell wall may have been lost. This indicates that the intensity of alkali treatment may be a crucial factor affecting the change in the composition of wood cell walls. The higher treatment intensity tends to encourage more lignin dissolution and part of the cellulose may also be degraded. The changes in the crystallinity index and crystallite size under alkali treatments are shown in Table 1. During alkali treatment and during the drying of the alkali-treated cell walls, an increase in the lateral fibril aggregate in dimension was observed, with a crystallite breadth increasing from 2.88 nm to 2.94 nm (Table 1). This is consistent with previous reports that, due to the removal of hemicellulose and lignin, the increased contact between the cellulose surfaces makes the fibril aggregates in NaOH larger than in the acid-treated cell walls [14,15,16,29]. The crystallinity index of the alkali-treated wood increased from 53.54% to 53.71% when the treatment time increased from 2 h to 4 h, due probably to the dissolution of non-crystalline materials, but the crystallinity index of 8 h treatment wood decreased to 50.71% as a prolonged exposure to alkali may result in crystalline cellulose dissolution (Table 1).
3.1.3. Different Changes in Chemical Structure after Acid and Alkali Treatment
The topological effects of alkali treatment and acid treatment on the CML and S2 region were not consistent. The topochemical effects of the alkali treatment are consistent with previous reports [28,30]. As can be seen, the alkali treatment resulted in both larger crystallite sizes and higher crystallinity indices than acid treatment. It was reported that the removal of hemicelluloses during alkali processing will increase lateral fibril aggregate dimensions [31]. However, for the acid treatment, the removal of hemicellulose did not cause a significant change in the lateral fibril aggregate dimensions. This could be due to the higher swelling ability of the alkali liquor than that of the acid liquor [32]. Another possibility is that although the swelling may contribute to the breaking of hemicellulose–hemicellulose and hemicellulose–cellulose associations, increased the non-hindered accessible surfaces. After the increase in cell wall mobility, these dissociations can be re-aggregated through the formation of hydrogen bonds [15].
3.2. Changes in Mechanical Properties after Acid and Alkali Treatments
3.2.1. Hot Water and B/E Extraction Treatment
As showed in Table 1, the hot water treatment did not result in a significant change in the crystallite size and crystallinity index. However, the crystallinity index of the benzene/ethanol (B/E) extraction treatment sample decreased to 47.54% from 56.72% and the crystallite size decreased to 2.61 nm from 2.85 nm (Table 1). This could be due to the fact that the benzene or ethanol have less swelling capacity compared to water [33].
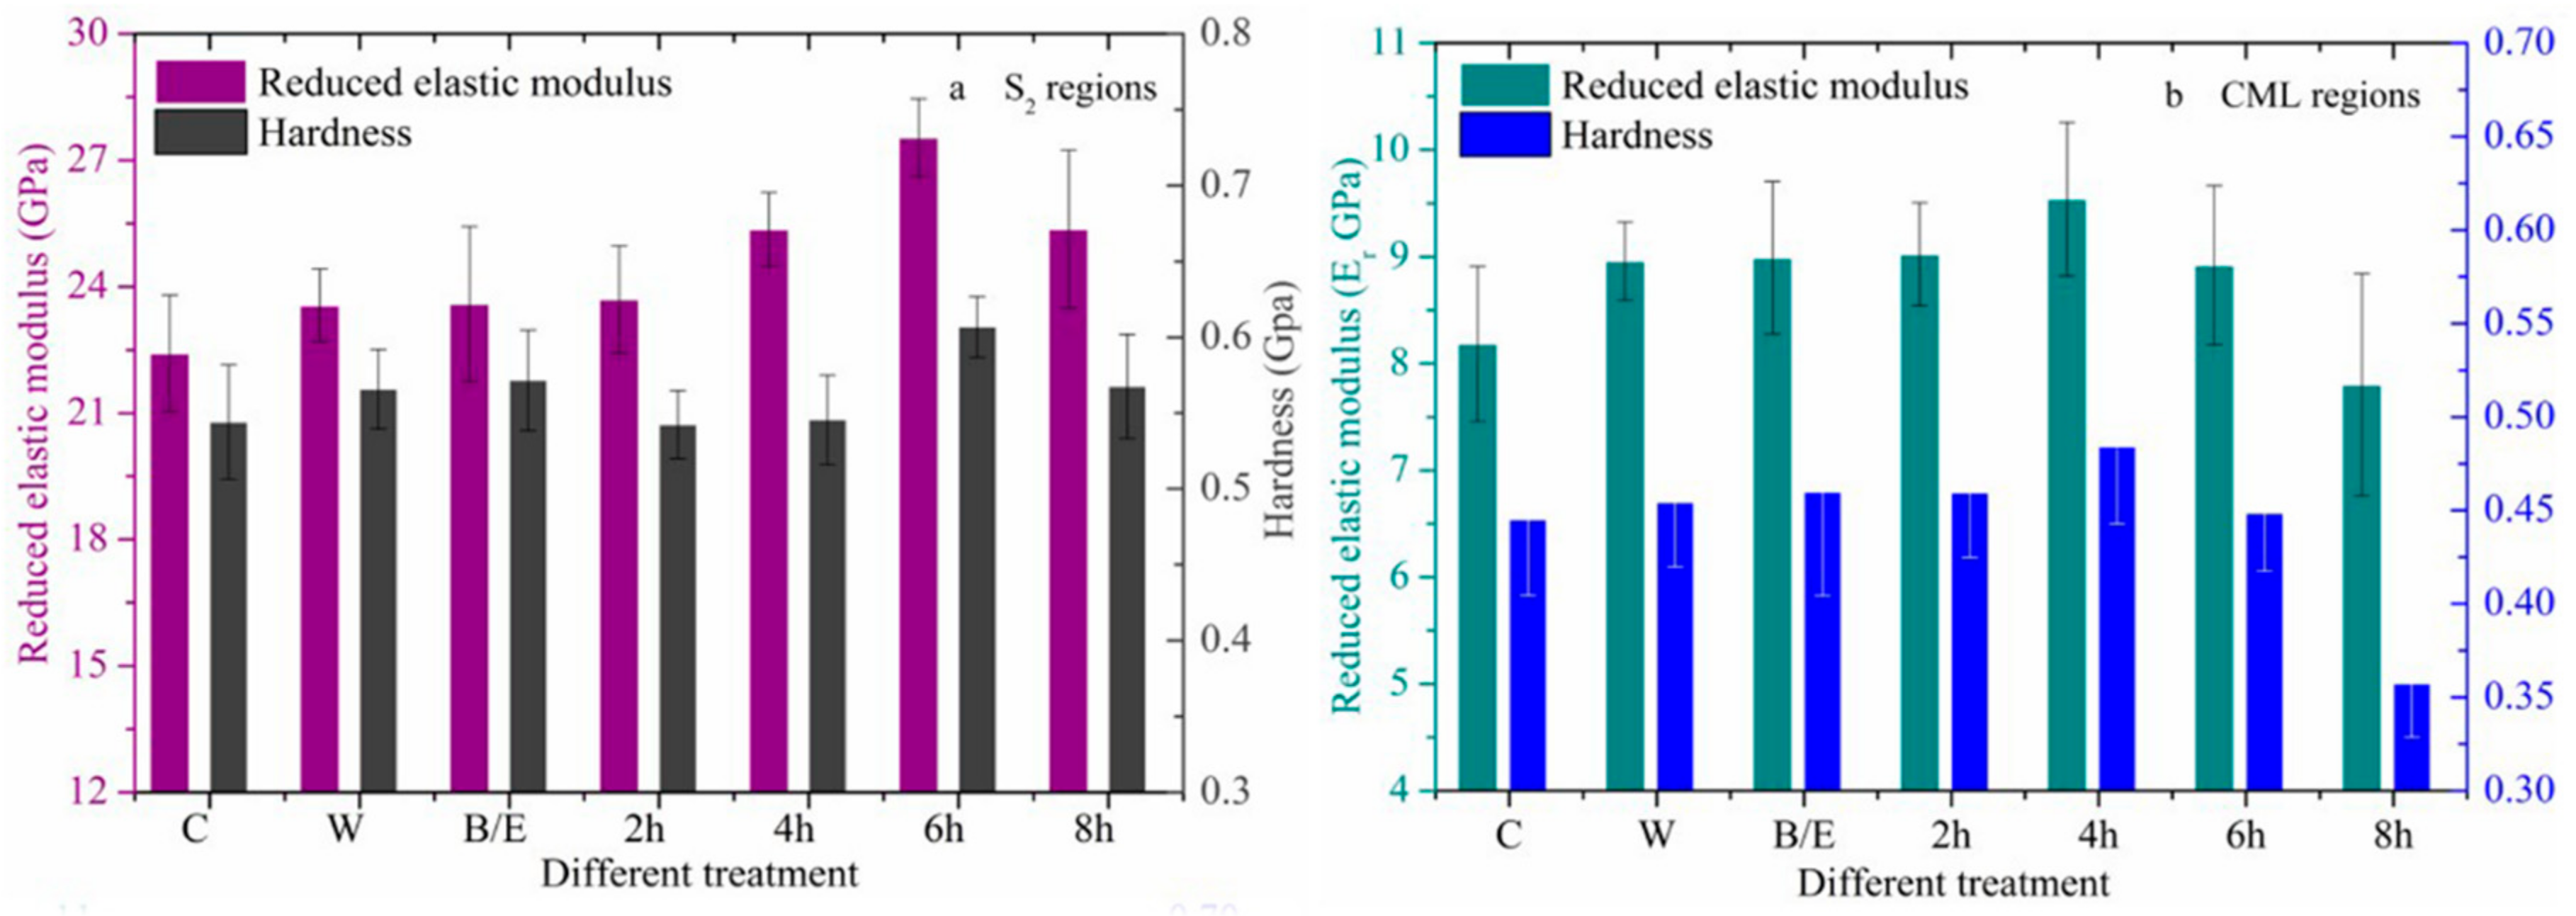
The increase in the reduced elastic modulus and hardness of hot water- and B/E extraction- treated wood cell walls in the longitudinal direction is shown in Figure 4 and Figure 5, with error bars representing the standard deviations. It is evident that the hot water extraction resulted in an increase in the reduced elastic modulus by 1.15 GPa and 0.77 GPa, and the hardness by 0.03 GPa and 0.01 GPa for the S2 and CML region, respectively, when compared to the untreated samples, consistent with previous work [34]. This may be due to the removal of (1) the polymeric non-cellulosic hemicelluloses and monomeric sugars, which led to a change in the microstructure of cellulose [35], and (2) soluble inorganic extractives. Compared with the untreated sample, the reduced elastic modulus of S2 and CML region increased by 5.13% and 9.41%, and the hardness increased by 5.51% and 2.25%, respectively, after B/E extraction. The effect of hot water and B/E extraction treatments is very similar. This result shows that organic extractives have made very little contribution to the change in the elastic modulus and hardness of wood cell walls. This is consistent with the previous report on the effect of organic extractives on the wood cell wall mechanical properties [25].
3.2.2. Changes in Mechanical Properties after Acid Treatment
The changes in the reduced elastic modulus and the hardness of wood cell walls with acid gradient treatment are shown in Figure 4. For the S2 region (Figure 4a), the reduced elastic modulus of the 2 h treatment sample showed almost no change, but the hardness decreased. The lignin degradation rate decreased from 4 h to 6 h, resulting in an increase in the modulus by 7.48% and 16.69% when compared to the hot water and B/E-treated wood, respectively (Figure 4). The hardness in this stage increased slightly. The main reasons for this are illustrated in Figure 6 II—that is, when matrices in between cellulose microfibril aggregates (Figure 6 II, a region) are extracted, cellulose microfibril aggregates may be rearranged. This contributes to the microfibril angle decrease. Furthermore, after lignin was decomposed, cellulose began to be exposed and cellulose amorphous regions were dissolved, giving rise to an increase in crystallinity index. In the final acid treatment stage, part of the cellulose crystalline region may also be resolved, and this is indicated by the decreases in the cellulose crystallinity index and mechanical properties. For the CML region (Figure 4b), when the treatment time increased from 2 to 4 h, the reduced elastic modulus and hardness increased slightly, from 8.99 to 9.54 GPa and 0.46 to 0.48 GPa, respectively. However, when the acid treatment intensity increased again from 6 to 8 h, the reduced modulus and hardness dropped precipitously. The main reason for this was the specific chemical composition, with the highest lignin content and the lowest cellulose content in the middle lamella (Figure 3), and prolonged treatment resulted in the major loss of the chemical compositions and hence the mechanical properties. As shown in Figure 4, the difference between the mechanical properties of the S2 and CML region is very significant—this provides an outstanding threshold for an acid treatment process, which, for example, at a treatment time of 6 h could produce/separate high quality fibers as the mechanical properties of the S2 region were more than three times those of the CML region.
3.2.3. Changes in Mechanical Properties after Alkali Treatment
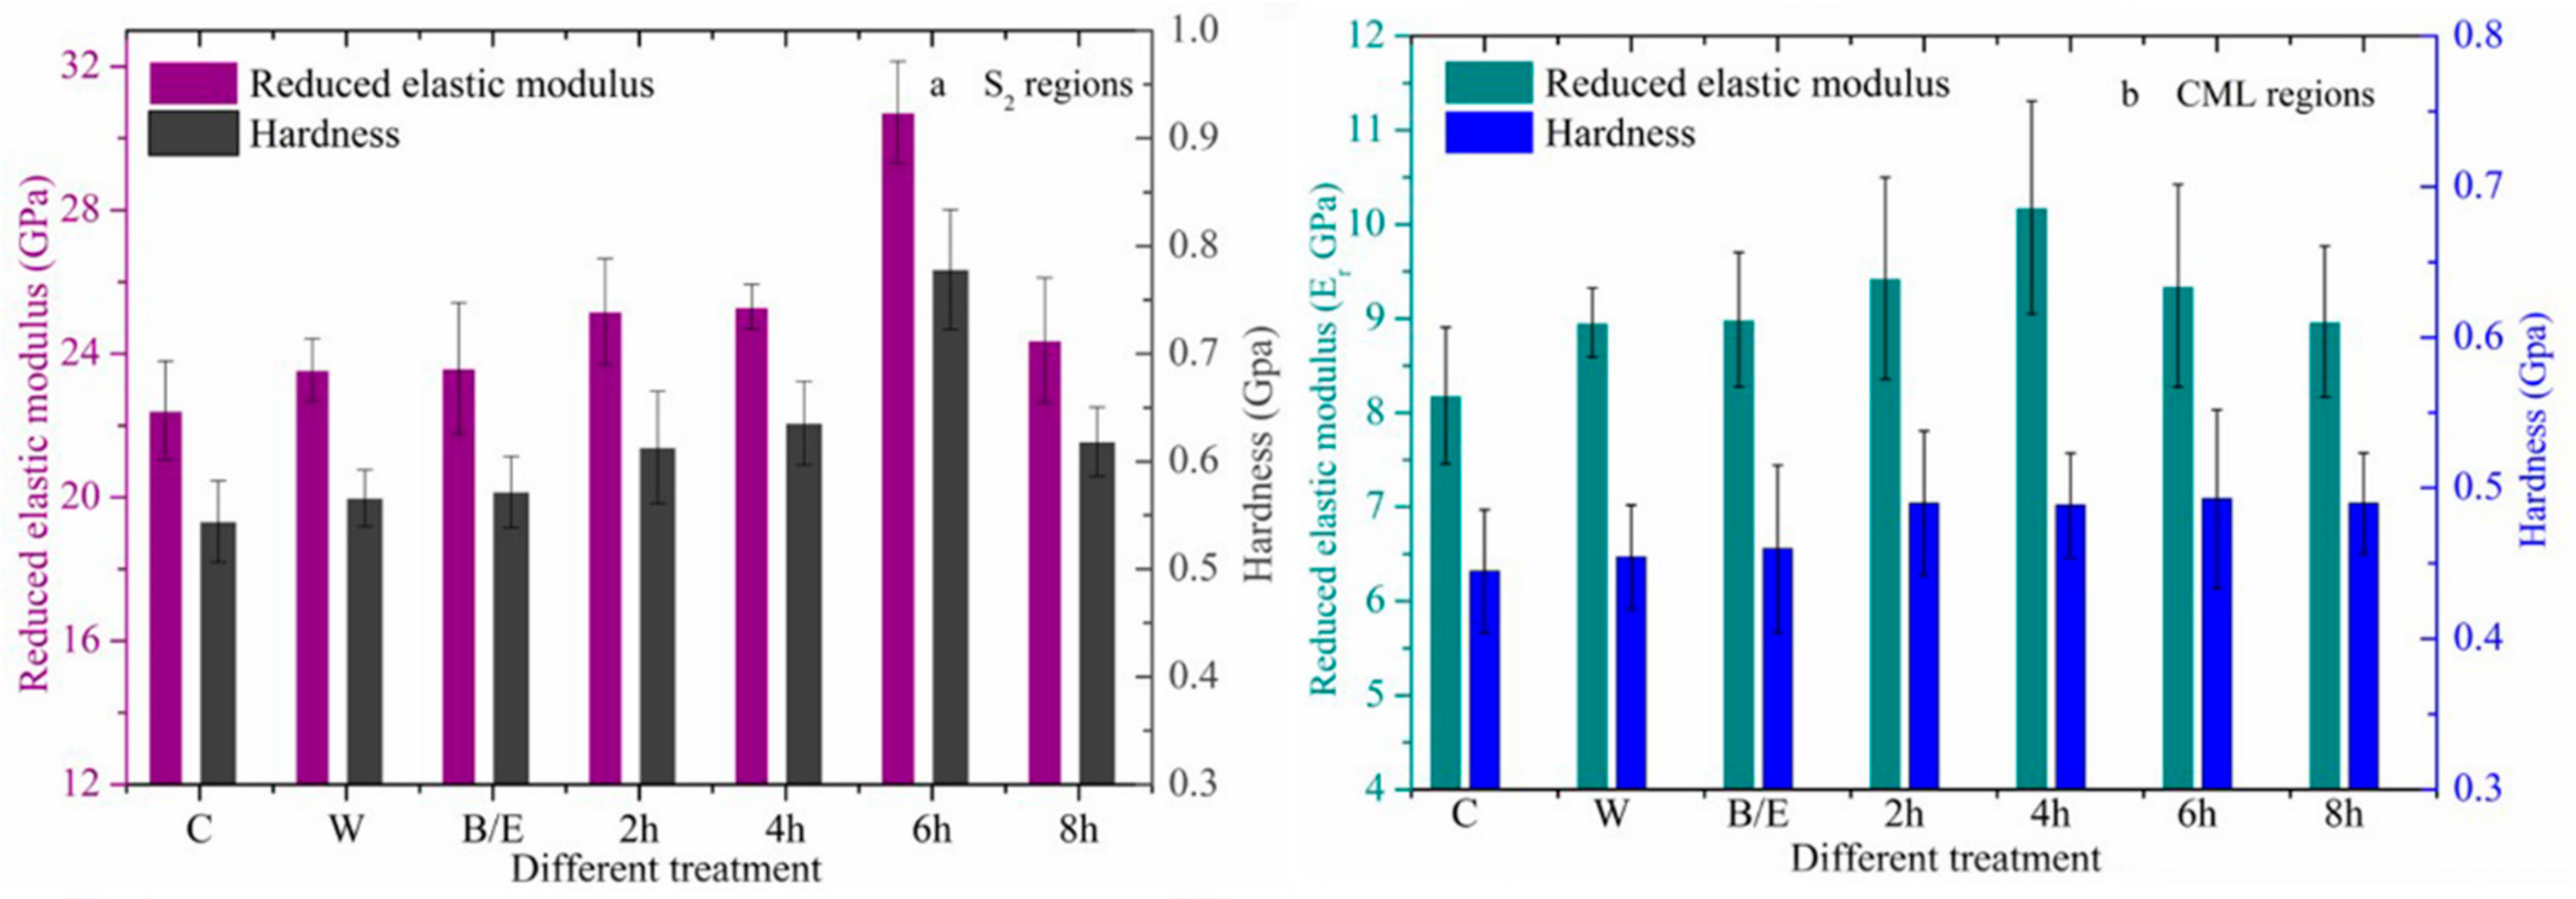
Figure 5 shows the reduced elastic modulus and hardness in the longitudinal direction of the alkali-treated wood cell walls. The results show that, compared with the B/E extractive treatment, the absolute modulus of the S2 region was increased by 6.70% and 7.20%, and the hardness was increased by 7.02% and 12.28%, respectively, at 2 and 4 h alkaline treatment. When the alkali treatment time is 6h, the reduced modulus of the S2 region remarkably increased to 30.73 GPa, and the hardness to 0.79 GPa. The mechanical properties of the 6 h treatment sample were notably stronger than those of B/E extractive treatment wood cell walls, which is consistent with previous studies [36]. When the matrix between cellulose microfibrils was extracted (Figure 6 II, b region), the distance between microfibrils decreased and the section sizes increased due to free hydrogen bonding or the higher swelling ability of the alkali liquor, both indicative of a widening cellulose crystallite size (Table 1) [17]. The matrix between cellulose microfibril aggregates (Figure 6 II, a region) was also extracted, contributing to the microfibril angle decrease [36]. These factors could contribute to better longitudinal mechanical properties. In the final alkali treatment stage, part of the cellulose crystalline region was also dissolved and the cellulose crystallinity index decreased, leading to a weakening in the mechanical properties. For the CML region (Figure 5b), with a treatment time increase from 0 to 4 h, the reduced elastic modulus and hardness increased from 8.99 to 10.18 GPa, and 0.46 to 0.49 GPa, respectively. The reduced modulus began to decrease and the hardness remained constant while the treatment intensity increased from 6 to 8 h. As shown in Figure 5, the difference between the mechanical properties of the S2 and CML regions also provided a significant threshold facilitating the alkali treatment process. As shown in Figure 4 and Figure 5, the mechanical properties of cell walls were higher for different alkali treatment times than for the acid treatment, with the alkali-treated sample exhibiting higher ordered cellulose (crystallinity index) and more aggregated fibrils (crystallite size) than the acid-treated wood (Table 1).
4. Conclusions
The behavior of the S2 and CML regions of wood under acid and alkali exposure was measured. Compared with acid treatment, alkali treatment can obtain larger crystallite sizes and higher crystallinity indices. Removal of hemicellulose during alkali treatment increased the lateral fibril aggregate dimensions, but this operation did not achieve the same effect during the acid treatment. With the increase in treatment time, the reduced elastic modulus and hardness of acid and alkali treatments increase and then decrease, but the changes between the two treatments are different. The mechanical properties of the wood cell wall S2 region were higher than those of the CML region. There was a topochemical effect between the CML and S2 regions by acid and alkali-treated samples, which provides a major threshold that facilitates the production/separation of wood fibers for better strength fiber properties.
Author Contributions
The manuscript was completed through contributions of all authors. E.X., D.W. and L.L. conceived and designed the experiments; E.X. and D.W. performed the experiments; E.X., D.W. and L.L. analyzed the data; E.X., D.W. and L.L. wrote the manuscript. All authors have read and agreed to the published version of the manuscript.
Funding
This research was supported by the ″National Natural Science Foundation of China″ (No. 31770597), and ″The program from the China Scholarship Council″ (No. 201803270009).
Conflicts of Interest
The authors declare no conflicts of interest.
References
- Magistris, F.D.; Salmén, L. Mechanical behaviour of wet wood in sequences of compression and combined compression and shear. Nord. Pulp Pap. Res. J. 2006, 21, 231–236. [Google Scholar] [CrossRef]
- Heitner, C.; Karnis, A.; Atack, D. Ultra-high yield pulping. IV. High strength pulp from mechanical pulp rejects [Sulphonation of wood chips]. Proc. Tech. Assoc. Pulp Pap. Ind. (USA) 1983, 85, 133–139. [Google Scholar]
- Sixta, H.; Potthast, A.; Krotschek, A.W. Chemical Pulping Processe. In Handbook of Pulp, 1st ed.; Sixta, H., Ed.; Wiley-VCH: Weinheim, Germany, 2006; Volume 1, pp. 109–229. ISBN 9783527309993. [Google Scholar]
- Germer, E.I. Production of bleachable pulp through catalytic oxygen-alkaline delignification of high-yield mechanical pulp. Tappi J. 1995, 78, 121–124. [Google Scholar]
- Zhang, H.; Hou, Q.; Liu, W.; Yue, Z.; Jiang, X.; Ma, X. Improved diffusivity of NaOH solution in autohydrolyzed poplar sapwood chips for chemi-mechanical pulp production. Bioresour. Technol. 2018, 259, 61–66. [Google Scholar] [CrossRef]
- Sundberg, K.E.; Holmbom, B.R.; Pranovich, A.V. Chemical changes in thermomechanical pulp at alkaline conditions. J. Wood Chem. Technol. 2003, 23, 89–112. [Google Scholar] [CrossRef]
- Zanuttini, M.; Marzocchi, V.; Mocchiutti, P.; Inalbon, M. Deacetylation consequences in pulping processes. Holz Als Roh-Und Werkstoff. 2005, 63, 149–153. [Google Scholar] [CrossRef]
- Fahlén, J. The Cell Wall Ultrastructure of Wood Fibres: Effects of the Chemical Pulp Fibre Line. Ph.D. Thesis, Kungliga Tekniska Högskolan, Stockholm, Sweden, January 2005. [Google Scholar]
- Vinod, A.; Vijay, R.; Singaravelu, D.L.; Sanjay, M.R.; Siengchin, S.; Moure, M.M. Characterization of untreated and alkali treated natural fibers extracted from the stem of Catharanthus roseus. Mater. Res. Express 2019, 6, 085460. [Google Scholar] [CrossRef]
- Kathirselvam, M.; Kumaravel, A.; Arthanarieswaran, V.P.; Saravanakumar, S.S. Characterization of cellulose fibers in Thespesia populnea barks: Influence of alkali treatment. Carbohyd. Polym. 2019, 217, 178–189. [Google Scholar] [CrossRef]
- Reddy, K.O.; Shukla, M.; Maheswari, C.U.; Rajulu, A.V. Mechanical and physical characterization of sodium hydroxide treated Borassus fruit fibers. J. For. Res. 2012, 23, 667–674. [Google Scholar] [CrossRef]
- Chen, H.; Yu, Y.; Zhong, T.; Wu, Y.; Li, Y.; Wu, Z.; Fei, B. Effect of alkali treatment on microstructure and mechanical properties of individual bamboo fibers. Cellulose 2016, 24, 333–347. [Google Scholar] [CrossRef]
- Evans, R.; Newman, R.H.; Roick, U.C.; Suckling, I.D.; Wallis, A.F. Changes in cellulose crystallinity during kraft pulping. Comparison of infrared, x-ray diffraction and solid state NMR results. Holzforschung 1995, 49, 498–504. [Google Scholar] [CrossRef]
- Hult, E.L.; Larsson, P.T.; Iversen, T. A comparative CP/MAS 13C-NMR study of cellulose structure in spruce wood and kraft pulp. Cellulose 2000, 7, 35–55. [Google Scholar] [CrossRef]
- Hult, E.L.; Larsson, P.T.; Iversen, T. Cellulose fibril aggregation—An inherent property of kraft pulps. Polymer 2001, 42, 3309–3314. [Google Scholar] [CrossRef]
- Hult, E.L.; Larsson, P.T.; Iversen, T. A comparative CP/MAS 13C-NMR study of the supermolecular structure of polysaccharides in sulphite and kraft pulps. Holzforschung 2002, 56, 179–184. [Google Scholar] [CrossRef]
- Gassan, J.; Bledzki, A.K. Alkali treatment of jute fibers: Relationship between structure and mechanical properties. J. Appl. Polym. Sci. 1999, 71, 623–629. [Google Scholar] [CrossRef]
- Ahlgren, P.A.; Goring, D.A.I. Removal of wood components during chlorite delignification of black spruce. Can. J. Chem. 1971, 49, 1272–1275. [Google Scholar] [CrossRef]
- Gierer, J. Chemistry of delignification. Wood Sci. Technol. 1985, 19, 289–312. [Google Scholar] [CrossRef]
- Kumar, R.; Mago, G.; Balan, V.; Wyman, C.E. Physical and chemical characterizations of corn stover and poplar solids resulting from leading pretreatment technologies. Bioresour. Technol. 2009, 100, 3948–3962. [Google Scholar] [CrossRef]
- Millet, M.A.; Moore, W.E.; Saeman, J.E. Preparation and properties of hydrocelluloses. Ind. Eng. Chem. 1954, 46, 1493–1497. [Google Scholar] [CrossRef]
- Lewin, M.; Epstein, J.A. Functional groups and degradation of cotton oxidized by hypochlorite. J. Polym. Sci. 1962, 58, 1023–1037. [Google Scholar] [CrossRef]
- Singh, O.P. Kinetics and mechanism of hypochlorite oxidation of cellulose. Text. Dry. Print. 1982, 15, 35–38. [Google Scholar]
- Ji, Z.; Ma, J.; Xu, F. Multi-scale visualization of dynamic changes in poplar cell walls during alkali pretreatment. Microsc. Microanal. 2014, 20, 566–576. [Google Scholar] [CrossRef] [PubMed]
- Wang, X.; Li, Y.; Deng, Y.; Yu, W.; Xie, X. Contributions of basic chemical components to the mechanical behavior of wood fiber cell walls as evaluated by nanoindentation. Bioresource 2016, 11, 6026–6039. [Google Scholar] [CrossRef] [Green Version]
- Agarwal, U.P. Higher acid-chlorite reactivity of cell corner middle lamella lignin in black spruce. In Proceedings of the 14th International Symposium on Wood Fibre and Pulping Chemistry, Durban, South Africa, 25–28 June 2007. [Google Scholar]
- Hubbell, C.A.; Ragauskas, A.J. Effect of acid-chlorite delignification on cellulose degree of polymerization. Bioresour. Technol. 2010, 101, 7410–7415. [Google Scholar] [CrossRef] [PubMed]
- Kerr, A.J.; Goring, D.A.I. The role of hemicellulose in the delignification of wood. Can. J. Chem. 1975, 53, 952–959. [Google Scholar] [CrossRef] [Green Version]
- Virtanen, T.; Maunu, S.L.; Tamminen, T.; Bo Hortling, B.; Liitia, T. Changes in fiber ultrastructure during various kraft pulping conditions evaluated by 13C CPMAS NMR spectroscopy. Carbohydr. Polym. 2008, 73, 156–163. [Google Scholar] [CrossRef]
- Whiting, P.; Pulp, D.G. The topochemistry of delignification shown by pulping middle lamella and secondary wall tissue from black spruce wood. J. Wood Chem. Technol. 1981, 1, 111–122. [Google Scholar] [CrossRef]
- Hult, E.L.; Liitiä, T.; Maunu, S.L.; Hortling, B.; Iversen, T. A CP/MAS 13C-NMR study of cellulose structure on the surface of refined kraft pulp fibers. Carbohydr. Polym. 2002, 49, 231–234. [Google Scholar] [CrossRef]
- Page, D.H. The origin of the differences between sulfite and kraft pulps. Pulp Pap. Can. 1983, 84, 15–20. [Google Scholar]
- Mantanis, G.I.; Young, R.A.; Rowell, R.M. Swelling of wood. Part II. Swelling in organic liquids. Holzforschung 1994, 48, 480–490. [Google Scholar] [CrossRef]
- Paredes, J.J.; Shaler, S.; Howell, C.; Jakes, J. Influence of hot water extraction on cell wall and OSB strand mechanics. Wood Sci. Technol. 2017, 51, 1307–1319. [Google Scholar] [CrossRef] [Green Version]
- Krogell, J.; Korotkova, E.; Eränen, K.; Pranovich, A.; Salmi, T.; Murzin, D.; Willför, S. Intensification of hemicellulose hot-water extraction from spruce wood in a batch extractor—Effects of wood particle size. Bioresour. Technol. 2013, 143, 212–220. [Google Scholar] [CrossRef] [PubMed]
- Shelat, B.R.; Radhakrishnan, T.; Iyer, B.V. The relation between crystallite orientation and mechanical properties of mercerized cottons. Text. Res. J. 1960, 30, 836–842. [Google Scholar] [CrossRef]
Figure 1.
Schematic illustration of nanoindentation and Raman testing.

Figure 2.
Change in chemical structure with different acid ((a): S2, (b): compound middle lamella (CML)) and alkali ((c): S2, (d): CML) treatment.
Figure 2.
Change in chemical structure with different acid ((a): S2, (b): compound middle lamella (CML)) and alkali ((c): S2, (d): CML) treatment.

Figure 3.
Delignification rate over time for alkali and acid gradient-treated cell walls.

Figure 4.
Changes in the mechanical properties of cell walls with acid gradient treatment. ((a): S2 regions; (b): CML regions).
Figure 4.
Changes in the mechanical properties of cell walls with acid gradient treatment. ((a): S2 regions; (b): CML regions).

Figure 5.
Changes in the mechanical properties of cell walls with alkali gradient treatment. ((a): S2 regions; (b): CML regions).
Figure 5.
Changes in the mechanical properties of cell walls with alkali gradient treatment. ((a): S2 regions; (b): CML regions).

Figure 6.
Schematic illustration of changes in cellulose fibril aggregates before and after delignification treatment ((I): Changes in cellulose crystal size; (II): Original cellulose fibril aggregates cross section; (III): Cellulose fibril aggregates longitudinal section).
Figure 6.
Schematic illustration of changes in cellulose fibril aggregates before and after delignification treatment ((I): Changes in cellulose crystal size; (II): Original cellulose fibril aggregates cross section; (III): Cellulose fibril aggregates longitudinal section).


Table 1.
Changes in crystallinity index and crystallite size after treatment.
| Sample 1 | CrI 2 (%) | 2θ 3(002) (°) | FWHM 4 (°) | Dhkl 5 (nm) |
|---|---|---|---|---|
| Control | 56.72 ± 0.14 (A) | 22.30 ± 0.01 | 2.81 ± 0.04 | 2.85 ± 0.00 (AB) |
| Hot water | 52.40 ± 0.08 (C) | 22.52 ± 0.37 | 2.91 ± 0.03 | 2.78 ± 0.03 (BC) |
| B/E | 47.54 ± 0.37 (E) | 22.20 ± 0.03 | 3.10 ± 0.14 | 2.61 ± 0.12 (D) |
| 2H | 49.40 ± 0.53 (D) | 22.20 ± 0.02 | 3.02 ± 0.09 | 2.68 ± 0.08 (CD) |
| 4H | 50.02 ± 0.59 (D) | 22.15 ± 0.01 | 2.94 ± 0.16 | 2.75 ± 0.14 (CD) |
| 6H | 53.80 ± 0.25 (B) | 22.26 ± 0.00 | 2.71 ± 0.19 | 2.99 ± 0.11 (A) |
| 8H | 52.36 ± 0.77 (C) | 22.19 ± 0.02 | 2.96 ± 0.05 | 2.74 ± 0.05 (C) |
| Control | 56.72 ± 0.14 (A) | 22.30 ± 0.01 | 2.81 ± 0.04 | 2.85 ± 0.00 (CD) |
| Hot water | 52.40 ± 0.08 (C) | 22.52 ± 0.37 | 2.91 ± 0.03 | 2.78 ± 0.03 (D) |
| B/E | 47.54 ± 0.37 (E) | 22.20 ± 0.03 | 3.10 ± 0.14 | 2.61 ± 0.12 (E) |
| 2OH | 53.54 ± 0.12 (B) | 22.40 ± 0.18 | 2.81 ± 0.06 | 2.88 ± 0.06 (CD) |
| 4OH | 53.71 ± 0.50 (B) | 22.31 ± 0.02 | 2.53 ± 0.11 | 3.34 ± 0.03 (A) |
| 6OH | 52.52 ± 0.18 (C) | 22.28 ± 0.02 | 2.64 ± 0.12 | 3.21 ± 0.07 (B) |
| 8OH | 50.71 ± 0.33 (D) | 22.30 ± 0.01 | 2.75 ± 0.13 | 2.94 ± 0.05 (C) |
1 The letter “H” = acid treatment. “OH” = alkali treatment. The number in front of letter is the treatment time, in hours. 2 CrI = crystallinity index. 3 2θ = 002 crystal diffraction peak position. 4 FWHM = full width at half of maxima intensity. 5 Dhkl = the crystal size dimension. The numbers followed by ± refer to the standard deviations in the samples. Different letters indicate significant differences (95% confidence level).
© 2020 by the authors. Licensee MDPI, Basel, Switzerland. This article is an open access article distributed under the terms and conditions of the Creative Commons Attribution (CC BY) license (http://creativecommons.org/licenses/by/4.0/).
Share and Cite
MDPI and ACS Style
Xu, E.; Wang, D.; Lin, L. Chemical Structure and Mechanical Properties of Wood Cell Walls Treated with Acid and Alkali Solution. Forests 2020, 11, 87. https://doi.org/10.3390/f11010087
AMA Style
Xu E, Wang D, Lin L. Chemical Structure and Mechanical Properties of Wood Cell Walls Treated with Acid and Alkali Solution. Forests. 2020; 11(1):87. https://doi.org/10.3390/f11010087
Chicago/Turabian StyleXu, Enguang, Dong Wang, and Lanying Lin. 2020. "Chemical Structure and Mechanical Properties of Wood Cell Walls Treated with Acid and Alkali Solution" Forests 11, no. 1: 87. https://doi.org/10.3390/f11010087
Note that from the first issue of 2016, this journal uses article numbers instead of page numbers. See further details here.