Article

Impact of Recent Climate Change on Water-Use Efficiency Strategies of Larix sibirica in the Altai-Sayan Mountain Range

by
Olga V. Churakova (Sidorova)
1,2,*,
Marina V. Fonti
1,2,
Rolf T. W. Siegwolf
2,
Matthias Saurer
2 and
Vladimir S. Myglan
3
1
Laboratory of Ecosystems Biogeochemistry, Institute of Ecology and Geography, Siberian Federal University, Svobodniy pr. 79, 660041 Krasnoyarsk, Russia
2
Forest Dynamics, Swiss Federal Institute for Forest, Snow and Landscape Research WSL, Zürcherstrasse 111, CH-8903 Birmensdorf, Switzerland
3
Siberian Dendrochronology Laboratory, Institute of Humanities, Siberian Federal University, Svobodniy pr. 79, 660041 Krasnoyarsk, Russia
*
Author to whom correspondence should be addressed.
Forests 2020, 11(10), 1103; https://doi.org/10.3390/f11101103
Submission received: 8 September 2020 / Revised: 14 October 2020 / Accepted: 15 October 2020 / Published: 17 October 2020

Abstract

:
A strong increase in the mean annual air temperature during the past 50 years by up to 0.54 °C was recorded in the Altai region (45°–52° N; 84°–99° E) compared to the global value of 0.07 °C over the period 1901–2008. The impact of the climatic changes on the hydrology are complex in these mountainous forest ecosystems and not fully understood. We aim to reveal differences in the intrinsic water-use efficiencies (iWUE) strategy by larch (Larix sibirica Ledeb.) derived from stable carbon isotopes at contrasting sites, ranging from the steppe (Ersin, Chadan) to high-elevation (Mongun, Koksu) sites of the Altai over the past century. The iWUE trends increased rapidly for all study sites except Chadan, where a decreasing trend after 2010 has been observed. This decline can be related to increased amount of precipitation compared to increased drought at the other sites. In general, the iWUE is increased up to 14% (1985–2019 compared to 1919–1984), which is lower compared to other studies across the globe likely due to harsh climatic conditions. Vapor pressure deficit and maximal air temperature are impacting Siberian larch significantly and affecting their iWUE differently at the high-elevated and steppe sites of the Altai over the past century.

1. Introduction

The Altai-Sayan mountain range (ASMR) is a unique mountain region with widely contrasting eco-physiological conditions, representing vegetation from the steppe ecotone to the high elevation sites. Annual temperature and precipitation amount vary significantly from low (45° N, 84° E) to high (52° N, 99° E) latitudes and represent average surface air temperature ranging from −6 °C to +7 °C and an annual amount of precipitation ranging from 143 to 820 mm/year, respectively.
Climate change is supposed to be severe, but not easy to assess in this remote region. Instrumental data observations from the local weather stations situated in the ASMR at the high altitudes (1500–2300 m a.s.l.) are usually limited to the past 30–40 years. Nevertheless, clear warming trends over the past decades were found. Based on the air temperature data recorded from the 17 local weather stations for the period from 1966 to 2015, it was shown that the mean annual air temperature increased by up to 0.54 °C [1] in the ASMR (45°–52° N to 84°–99° E), which is considerably more than the global value of 0.07 °C or Northern-Hemisphere value of 0.10 °C over the period 1901–2008 [2].
Rising air temperature, changes in the hydrological and atmospheric-circulation patterns over the past decades are leading to increasing frequency of droughts or flooding extreme events impacting forest ecosystems and society worldwide [3,4]. Severe and frequent drought events have been already recorded in the steppe and forest-steppe zones of Russia, which led to forest fires and severe damage of the agricultural sector [5,6].
The water cycle is a complex target compared to surface air temperature and therefore not well understood in the studied region. However, both temperature and moisture signals, like vapor pressure deficit (VPD) and soil water availability are well captured by stable carbon isotopes and their analysis is therefore useful for assessing tree responses to changes in water cycle. The stable carbon isotope ratio 13C/12C is related to the ratio of photosynthesis (A) to stomatal conductance (g), which is defined as water loss per carbon gain defining the intrinsic water-use (iWUE). This is an important plant physiological property, particularly for plants growing in dry areas, and may determine which plants are better adapted to increasing warming. Plants with high iWUE tend to close stomata fast under dry conditions, and therefore are less prone to hydraulic failure [7,8]. Because transpiration is influencing by the stomatal conductance (g) and vapor pressure deficit (VPD), the intrinsic water-use efficiency also depends on evaporative demand and does not consider respiratory losses [7].
Atmospheric vapor pressure deficit (VPD) is a crucial parameter in determining photosynthesis. Temperature increase causes an increase in VPD and soil moisture decreases through evapotranspiration [9]. A few recent studies showed a significant effect of the global increased VPD changes [10] on reduction in vegetation growth and forest mortality [8,11].
Rapidly increasing iWUE has been observed in different forest ecosystems, which is attributed to rising air temperature and atmospheric CO2 concentrations [11,12,13,14,15,16,17,18,19]. Heterogeneity in response of the iWUE to the CO2 and temperature changes were also observed showing either “overestimated effect” for specific site locations [16] or decreasing trends modulated by water availability [19]. Yet, many factors (e.g., temperature, precipitation, relative humidity) could explain this heterogeneous effect; one of them is the impact of VPD changes [20,21]. Recent studies also showed significant dependence of photosynthesis in boreal tree species on soil moisture, soil thaw depth, and water source, affecting tree growth under permafrost conditions in a warming world [1,3,4,22]. Under low amounts of precipitation, and warm and dry conditions, trees respond to limited water resources by reducing stomatal conductance, resulting in a diminished intercellular CO2 concentration, which leads to a reduced 13C discrimination [23].
Recent studies showed that drought can lead to leaf morphological adjustments and altered physiological tree responses, which is further enhanced by elevated temperature and CO2 increase [24] and can offset potential iWUE of forest ecosystems from rising atmospheric CO2 [25]. In order to better understand impact of climatic changes at the Altai-Sayan mountain range on Siberian larch trees, we aim to examine water-use efficiency strategies at different locations under centennial air temperature and vapor pressure deficit changes.

2. Materials and Methods

2.1. Study Sites

The study sites represent a high-altitudinal transect from the high-elevation sites located in the Russian Altai in Mongun (MOG) [26], Tuva Republic to the low-elevation steppe zone in Ersin (HO) closely located to the Mongolia (Figure 1a).
Climate is characterized as continental with hot summers and cold winters, and a low amount of precipitation for all sites, but to a varying degree (Table 1). To get air temperature data as close as possible for the study site conditions we applied a correction (0.6 °C) per each 100 m [27] of elevation compared to the meteorological station. Precipitation data was kept, originally measured at the weather station data due to complex geographical relief and heterogeneous precipitation distribution.
Temperature and precipitation data available from the local weather stations are represented by different periods and have missing years (Figure S1). Therefore, KNMI Climate Explorer (https://climexp.knmi.nl) was used for the calculation of the spatial distribution of the summer (June–August) averaged CRU TS4.04 vapor pressure deficit and maximum values of the surface air temperature and precipitation signals with the averaged iWUE time series from the four study sites within the range 45°–55° N and 85°–100° E, p < 0.1 for the period from 1919 to 2019.
Larix sibirica Ledeb. are long-living trees (Figure 1b) reaching an age of up to 840 years, which is dendrochronologically dated from 960 to 1800 in the Altai region [26]. The main difference between study sites is elevation, which varies from the highest altitude at 2300 m a.s.l. for MOG towards 832 m a.s.l. for the lowest elevation at the CH site. There is a large climatic gradient from the coldest and driest MOG site towards the warmest and wet site on the steppe zone in Chadan. Annual air temperature is in the range from −2 to −6 °C. Precipitation varies significantly from 143 to 443 mm/year within the Altai region (Table 1). Most of the precipitation falls in July.
The Mongun (MOG) site is situated in the western part of the Tuva Republic, Russian Federation, on the northern and northeastern slopes of the mountain ridge Mongun Taiga (Figure 1a). The ridge expands over a territory of approximately 400 km2 and is the center of modern glaciation (the highest point is 3976 m) [27,28]. Permafrost at the MOG site is characterized by high air temperature and low (143 mm/year) amount of precipitation. Trees could have additional access to the thawed permafrost water during summer to survive [27].
The Koksu (KOK) site is characterized by an alpine relief form and alpine vegetation type. The sampling site is a horizontal plateau with a northern exposed slope, located 1.5–2 km below the rock wall of the Kara, representing the central part of the ridge (Figure 1a). The soil surface is covered by sphagnum (Sphagnum L.), which indicates that this area is sufficiently wet. Mild annual temperatures and a greater amount of precipitation is recorded for the KOK site compared to all others (Table 1).
The Ersin (HO) site is represented by sparsely distributed growing trees on the open surface. Low grass vegetation is covering the ground in combination with crushed soil turf of cereals, shoots of different kinds of wormwood, and astrogallows. xerophytes are dominating here.
The Chadan (CH) site is located in the western part of the Tuva lowland (Figure 1a). It represents a small part of the forest in the steppe zone, where trees grow on sand deposits. Grass vegetation is represented by Ceratoides papposa Botsch. & Ikonn., Cleistogenes squarrosa (Trin.) Keng, Carex duriuscula C. A. Mey, and Kochia prostrata (L.) Schrad. species. The seasonal freezing soil depth can vary between 1.3 to 3.6 m.

2.2. Stable Carbon Isotope Chronologies and Intrinsic Water-Use Efficiency (iWUE)

Earlier published stable carbon (δ13C) isotope chronologies of tree-ring cellulose based on five trees for each of the four studied sites HO and CH (1919–2019) [19], MOG (1919–2016) [29], and KOK (1779–2005) [30], were used for calculation of the intrinsic water-use efficiency (iWUE).
The calculation of iWUE was based on the Equations (1) and (2) described in detail by Saurer and Siegwolf [31].
iWUE = Ca (b − ∆13C)/1.6 (b − a)
13C = (δ13Ca − δ13Cplant)/(1 + δ13Cplant)
a—is the discrimination against 13CO2 during CO2 diffusion through the stomata (a = 4.4‰), b is the discrimination associated with carboxylation (b = 27‰), Ca—ambient CO2 concentration; δ13Cplant—uncorrected δ13C in tree-ring cellulose measurements relative to the δ13C atmospheric CO2 measurements; δ13Ca—data available from https://www.esrl.noaa.gov/gmd/outreach/isotopes/c13tellsus.html.

2.3. Statistical Analyses

We calculated linear changes over different time windows and calculated the slope of the regression line to determine the changes in iWUE per year. Pearson correlation coefficients (r) were calculated to reveal statistical relationships between iWUE chronologies (correlation matrix).
Calculations of the mean and standard deviation (SD), t-value, F-criteria, and degree of freedom (df) were performed to explore the differences in the mean of the iWUE chronologies. The level of statistical significance is expressed as a p-value ≤ 0.05.
The iWUE-data were expressed by smoothing with a 11-year Hamming window [32] to reveal low-frequency variations and to compare long-term trends between study sites. The statistical analysis was performed in the STATISTICA 13.3 Software (StatSoft Europe, Hamburg).

3. Results

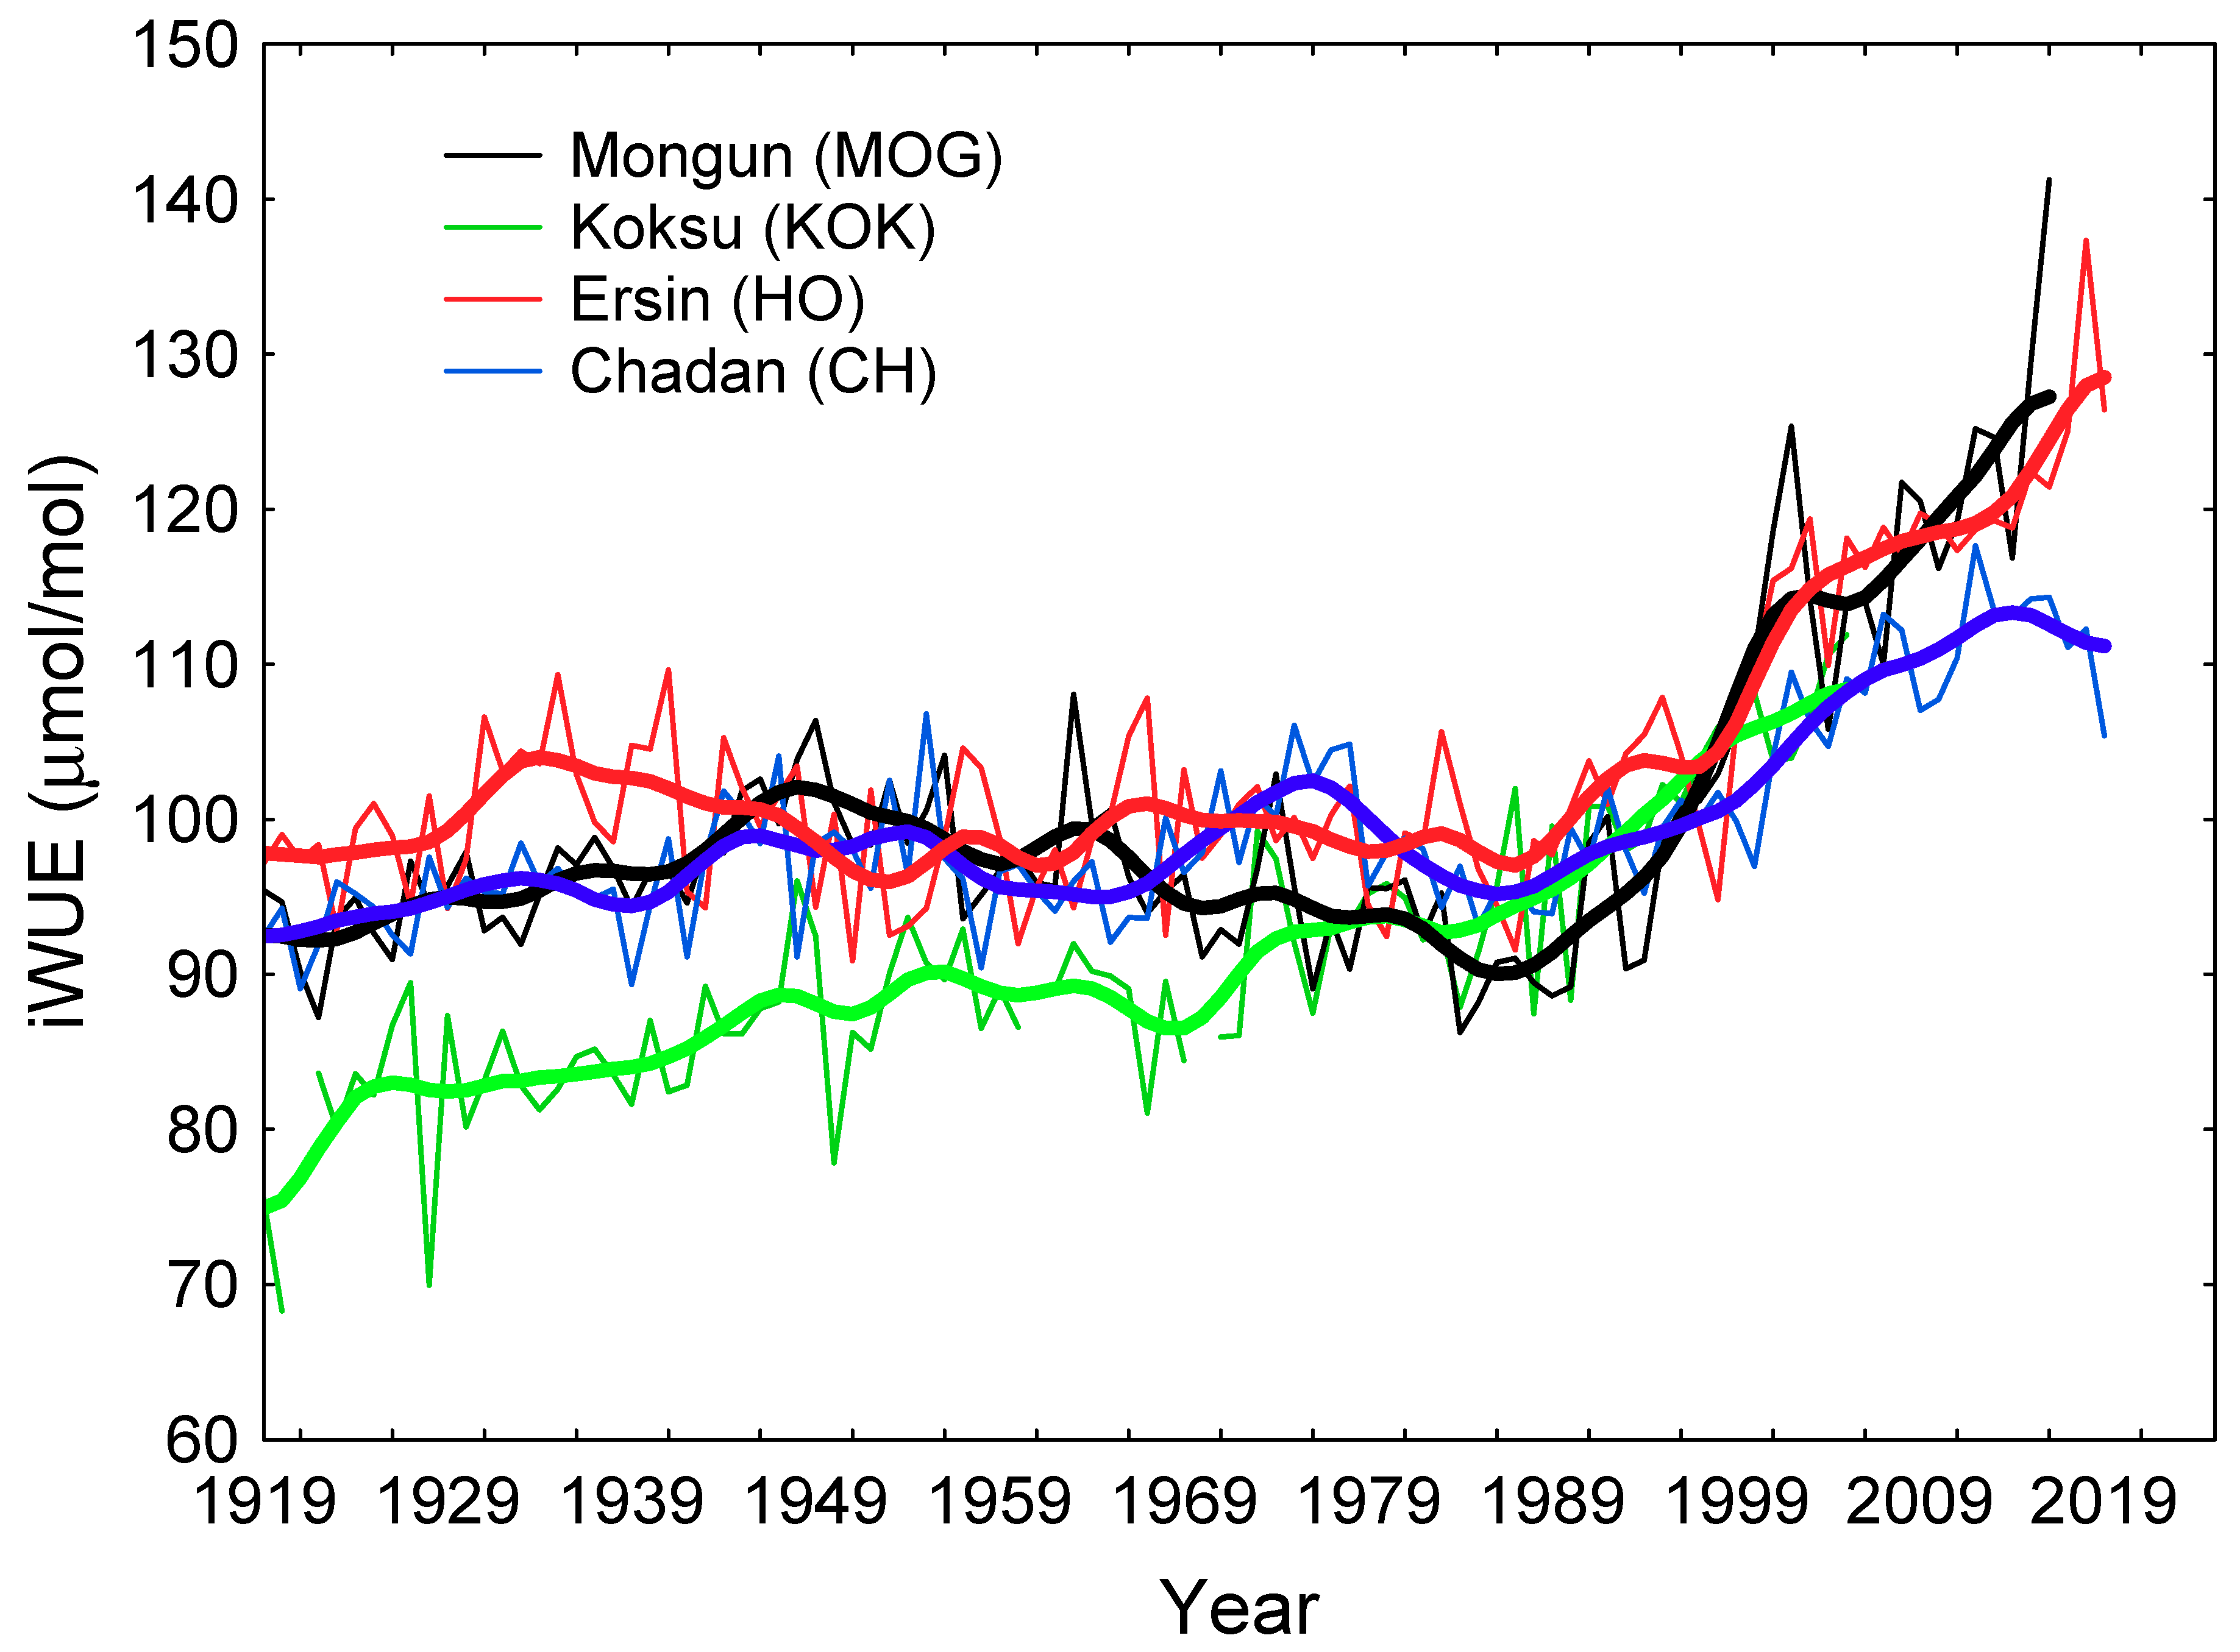
3.1. iWUE Chronologies

Annual and smoothed intrinsic water use efficiency (iWUE) chronologies for the Mongun (MOG), Koksu (KOK), Ersin (HO), and Chadan (CH) sites were calculated (Figure 2).
Since 1985 (Figure 2, vertical dashed line), the iWUE trends increased rapidly and continuing increase towards 2019 for both MOG and HO sites. The maximum iWUE values were recorded for the MOG (141 μmol/mol) and for the HO (137 μmol/mol) sites, respectively (Table 2).
The minimum values were found for KOK. Overall, iWUE at MOG and HO are similar over most of the records, while KOK deviates in the early part and CH in the last part.

3.2. Trends Analysis

Results of time series analysis show high significant trends mainly for the KOK site, which is characterized by continuously increasing trend over the whole period from 1919 to 2005 with the slope 0.29 (Table 3).
For the MOG and HO sites iWUE trends are less pronounced for the common period of observations from 1919 to 2005; however, since 1985 the iWUE have drastically increased. Yet, iWUE data are available for both HO and CH for the period from 2005 to 2019, and MOG data are available for the period from 2005 to 2016, which show slopes 0.98, 0.62, and 1.4 (p < 0.01), respectively.
Slopes calculated for the longest time series of the HO and the CH sites (1919–2019) were 0.19 and 0.15, respectively, with the strong increase within the past 14 years (2005–2019) for the HO (0.87) compared to the CH (0.11) site. The slope calculated for the MOG-iWUE was 0.2 over the studied period from 1919 to 2016. A negative slope for the period from 1919 to 1984 was found for the HO site only (Table 3). Averaged regional slope (ASMR) for the whole period from 1919 to 2019 was 0.13.

3.3. Spatial Climate Patterns

Spatial correlation analysis shows significant relationships between iWUE from the four studied sites with the gridded average June–August vapor pressure deficit changes (r = 0.4, p < 0.1) (Figure 3a), and gridded average maximal surface air temperature (r = 0.4–0.5, p < 0.1) (Figure 3b) for the period from 1919 to 2019. The strength of the temperature correlation follows a west-to-east gradient along the sites and shows high correlation with local weather station data (r = 0.9, p < 0.1). However, a significant spatial correlation with the averaged June–August precipitation (r = −0.3–0.4, p < 0.1) was revealed for the CH site only (Figure 3c). There is also relatively low correlation (r = 0.3, p < 0.1) between gridded summer precipitation and local weather stations data due to the relief location (valleys vs. high elevations), where amount of precipitation distributed unevenly.

4. Discussion

Siberian larch trees from the cold and dry site MOG respond similarly to climatic changes as trees from the warm and dry HO site. This indicates that drastic changes in permafrost degradation and soil back-freezing (cold-dry) show a similar tendency to develop water shortage, which is reflected in the iWUE-trend following the increase in CO2 in the atmosphere as under warm and dry (warm-dry) environmental conditions on the steppe zone for the period from 1985 to 2019. A continuous iWUE trend since 1919 towards the recent decade was observed for the KOK site only. All other iWUE chronologies showed a minor increase in the first part of the record and a pronounced trend after 1985. This is in contrast to other studies, where a long-term continuous iWUE increase over the whole 20th century was reported, for instance, for European sites [7]. In the latter study, the iWUE-increase over the 20th century was between 26% (for conifers) and 32% (for broadleaved species), which is much more than the average increase of 14% found in this study. This could be explained by the generally harsh (continental) climatic conditions in Altai, where snow even can occur already in end of July–early August [29,30]. Air temperature increases and a reduction in precipitation can result in permafrost degradation in Altai region [1], which impact on important hydro-climatic factors, such as the interplay between water source, soil moisture, and soil thaw depth, influencing tree growth under permafrost conditions [25,28]. Dynamics of soil moisture and soil temperature are dominant factors and can thus influence carbon isotope ratios significantly at our study region. The study by Giguère-Croteau et al. [33] showed that boreal trees from North America are more efficient water users due to increased [CO2]; however, they are not growing faster. The effect of drought and recent CO2 changes are hardly possible to separate from the iWUE chronologies derived from tree-ring cellulose. A recent study by Adams et al. [34] reported higher iWUE increase during 1920–1930 and 1940–1950 with gradually decreasing global trend towards recent 2001–2010 period. Peters et al. [35] and Yang et al. [36] showed that drastic changes in modern iWUE increase or decrease (2001–2011) can be explained by the contribution of single extreme drought or flooding events, which is in line with our study. For example, based on the local Ersin (HO) weather station data for July of the year 2017, characterized by heatwaves up to 25 °C, compared to the mean of 18.6 °C over the period 1949–2019, and strongly decreased amount of July precipitation from 51 mm to 20 mm for the reference period from 1949 to 2019 (Figure S1).
In general, the response of Siberian larch trees from this region most likely started earlier showing faster response to recent climatic changes (increasing air temperature, VPD, CO2, and precipitation changes) compared to other regions [7]. Higher summer air temperature increases iWUE as a result of reduced light-saturated net photosynthesis and a more stringent stomatal control [21].
The impact of the VPD on iWUE changes is highly important for the Altai Sayan Mountain Range because it is collinear with air temperature changes. Since both air temperature and VPD are increasing over the past few decades and will most likely increase in the near future, this will significantly affect Siberian forest ecosystems by higher evapotranspiration rates and further tree water loss. Therefore, Siberian larch trees, which grow on the diminishing permafrost at high elevation sites, could seriously be affected by the development of water shortage due to limited access to the groundwater [29].
Opposite to the MOG, KOK, and HO sites, the CH-site shows the decline of the iWUE over the past few years (Figure 2), which indicates decreasing VPD at the local scale. Based on the Chadan weather station data, July precipitation has significantly increased relative to the average of 54 mm (1949–2016) to an extreme value of 191 mm in 2018 and 135 mm in 2019, respectively, which caused flooding events [1,19,29,30]. These records are also confirmed by the spatial distribution of averaged June–August precipitation patterns based on the CRU gridded data (Figure 3c). However, we should notice the complex geological relief of the ASMR, where precipitation distribution depends on the forest locations, slopes and elevations. Local mountain weather stations provide more precise measurements of the climate parameters as temperature, precipitation, and VPD compared to the gridded data. However, the local weather station data observations are usually much shorter compared to the gridded data. Due to heterogeneous precipitation distribution, most of the gridded precipitation data were extrapolated from the lowland, or a few records from the high-altitude weather stations were used. Therefore, the correlation signal recorded between CH and June–August gridded precipitation is not so high, but still significant (Figure 3c). This shows the strong heterogeneity of climate conditions in this region [19], which is recorded in the different patterns of the CH-iWUE chronology compared to other studied sites.

5. Conclusions

Combination of both VPD and temperature increase play a significant role for the Siberian larch trees in the studied Altai-Sayan mountain range. Future simultaneous increase in both parameters (VPD and air temperature) could lead to higher drought frequencies at the high elevations of the Altai-Sayan Mountain range and likely heterogeneous distribution of precipitation in the steppe zone of the Altai region leading in some places to flooding events (e.g., Chadan) or increasing droughts like in the Ersin site. Since 1985 the iWUE trends increased continuously for all study sites except of Chadan, where a decreasing trend after 2010 has been observed. This decline can be related to the more than two-fold increased amount of precipitation (191 mm and 135 mm according to the mean of 54 mm) during the single years (e.g., 2018, 2019) over the period from 1949 to 2016 in this region. This contrast with increased drought periods at the Mongun, Koksu, and Ersin study sites, characterised by increasing air temperature by 6 °C for the single year (e.g., in the year of 2017) and strongly decreased amount of July precipitation from 51 mm to 20 mm for the reference period from 1949 to 2019. In the Altai Sayan Mountain Range, iWUE increased up to 14 % for the period from 1985 to 2019 compared to the past (1919–1984), indicating changes in water-use strategies by Siberian larch trees at both the high-elevated and the steppe sites of the Altai-Sayan Mountain range. The temporal pattern and magnitude of increase in iWUE is quite different compared to other regions of the globe, showing that specific climate conditions and their tree physiological consequences can be sensitively recorded with such isotope-based reconstructions.

Supplementary Materials

The following are available online at https://www.mdpi.com/1999-4907/11/10/1103/s1, Figure S1: July air temperature (a) and July precipitation (b) data sets available from the local weather stations: Mugur-Aksi Mongun (MOG), Ak-kem for Koksu (KOK), Ersin for Ersin (HO) and Chadan for Chadan (CH) (see Table 1) study sites. A vertical red dotted line in 1985 indicates start of temperature and precipitation changes with the extremes during single years over the reference period 1949–2019.

Author Contributions

O.V.C., M.S., R.T.W.S. planned and designed the research. V.S.M. performed sampling and coordinated expeditions at the Altai sites. O.V.C., M.S., M.V.F., V.S.M. analyzed data and wrote the manuscript. All authors have read and agreed to the published version of the manuscript.

Funding

The work was supported by the Russian Science Foundation granted to V.S. Myglan (RSF 19-14-00028, Extreme (catastrophic) droughts on the Siberian south over the past millennia).

Conflicts of Interest

The authors declare no conflict of interest.

References

  1. Zhang, D.; Yang, Y.; Lan, B. Climate variability in the northern and southern Altai Mountains during the past 50 years. Sci. Rep. 2018, 8, 3238. [Google Scholar] [CrossRef] [PubMed]
  2. Harris, I.; Jones, P.D.; Osborn, T.J.; Lister, D.H. Updated high-resolution grids of monthly climatic observations—The CRU TS3.10 Dataset. Int. J. Climatol. 2013, 34, 623–642. [Google Scholar] [CrossRef] [Green Version]
  3. Pachauri, R.K.; Allen, M.R.; Barros, V.R.; Broome, J.; Cramer, W.; Christ, R.; Church, J.A.; Clarke, L.; Dahe, Q.; Dasgupta, P.; et al. Climate Change 2014: Synthesis Report. Contribution of Working Groups I, II and III to the Fifth Assessment Report of the Intergovernmental Panel on Climate Change; IPCC: Geneva, Switzerland, 2014; 138p. [Google Scholar] [CrossRef]
  4. Fischer, H.; Meissner, K.J.; Mix, A.C.; Abram, N.J.; Austermann, J.; Brovkin, V.; Capron, E.; Colombaroli, D.; Daniau, A.L.; Dyez, K.A.; et al. Palaeoclimate constraints on the impact of 2 C anthropogenic warming and beyond. Nat. Geosci. 2018, 11, 474–485. Available online: https://www.nature.com/articles/s41561-018-0146-0 (accessed on 25 June 2020). [CrossRef]
  5. Knorre, A.A.; Siegwolf, R.; Saurer, M.; Sidorova, O.V.; Vaganov, E.A.; Kirdyanov, A.V. Twentieth century trends in tree ring stable isotopes (δ13C and δ18O) of Larix sibiricaunder dry conditions in the forest steppe in Siberia. Geophys. Res. Biogeosci. 2010, 115, 1–12. [Google Scholar] [CrossRef] [Green Version]
  6. Cook, E.R.; Solomina, O.; Matskovsky, V.; Cook, B.I.; Agafonov, L.; Dolgova, E.; Karpukhin, A.; Knysh, N.; Kulakova, M.; Kuynetsova, V.; et al. The European Russia Drought Atlas (1400–2016 CE). Clim. Dyn. 2020, 54, 2317–2335. [Google Scholar] [CrossRef]
  7. Saurer, M.; Spahni, R.; Frank, D.C.; Joos, F.; Leuenberger, M.; Loader, N.J.; McCarroll, D.; Gagen, M.; Poulter, B.; Siegwolf, R.T.W.; et al. Spatial variability and temporal trends in water-use efficiency of European forests. Glob. Chang. Biol. 2014, 20, 3700–3712. [Google Scholar] [CrossRef] [PubMed]
  8. McDowell, N.; Pockman, W.T.; Allen, C.D.; Breshears, D.D.; Cobb, N.; Kolb, T.; Plaut, J.; Sperry, J.; West, A.; Williams, D.G.; et al. Mechanisms of plant survival and mortality during drought: Why do some plants survive while others succumb to drought? New Phytol. 2008, 178, 719–739. [Google Scholar] [CrossRef] [PubMed]
  9. Williams, A.; Allen, C.D.; Macalady, A.K.; Griffin, D.; Woodhouse, C.A.; Meko, D.M.; Swetnam, T.W.; Rauscher, S.A.; Seager, R.; Grissino-Mayer, H.D.; et al. Temperature as a potent driver of regional forest drought stress and tree mortality. Nat. Clim. Chang. 2013, 3, 292–297. [Google Scholar] [CrossRef]
  10. Zhang, Q.; Ficklin, D.L.; Manzoni, S.; Wang, L.; Way, D.; Phillips, R.P.; Novick, K.A. Response of ecosystem intrinsic water use efficiency and gross primary productivity to rising vapor pressure deficit. Environ. Res. Lett. 2019, 14, 074023. [Google Scholar] [CrossRef]
  11. Yuan, W.; Zheng, Y.; Piao, S.; Ciais, P.; Lombardozzi, D.; Wang, Y.; Ryu, Y.; Chen, G.; Dong, W.; Hu, Z.; et al. Increased atmospheric vapor pressure deficit reduces global vegetation growth. Sci. Adv. 2019, 5, eaax1396. [Google Scholar] [CrossRef] [Green Version]
  12. Franks, P.J.; Adams, M.K.; Amthor, J.S.; Barbour, M.M.; Berry, J.A.; Ellsworth, D.S.; Farquhar, G.D.; Ghannoum, O.; Lloyd, J.; McDowwell, N.; et al. Sensitivity of plants to changing atmospheric CO2 concentration: From the geological past to the next century. New Phytol. 2013, 197, 1077–1094. [Google Scholar] [CrossRef] [PubMed]
  13. Battipaglia, G.; Saurer, M.; Cherubini, P.; Calfapietra, C.; McCarthy, H.R.; Norby, R.J.; Cotrufo, M.F. Elevated CO2 increases tree-level intrinsic water use efficiency: Insights from carbon and oxygen isotope analyses in tree rings across three forest FACE sites. New Phytol. 2012, 197, 544–554. [Google Scholar] [CrossRef] [PubMed] [Green Version]
  14. Lévesque, M.; Siegwolf, R.; Saurer, M.; Eilmann, B.; Rigling, A. Increased water-use efficiency does not lead to enhanced tree growth under xeric and mesic conditions. New Phytol. 2014, 203, 94–109. [Google Scholar] [CrossRef] [PubMed] [Green Version]
  15. Frank, D.C.; Poulter, B.; Saurer, M.; Esper, J.; Huntingford, C.; Helle, G.; Treydte, K.; Zimmermann, N.E.; Schleser, G.H.; Ahlström, A.; et al. Water-use efficiency and transpiration across European forests during the Anthropocene. Nat. Clim. Chang. 2015, 5, 579–583. [Google Scholar] [CrossRef] [Green Version]
  16. Churakova Sidorova, O.V.; Saurer, M.; Bryukhanova, M.; Siegwolf, R.; Bigler, C. Site-specific water-use strategies of mountain pine and larch to cope with recent climate change. Tree Physiol. 2016, 36, 942–953. Available online: https://academic.oup.com/treephys/article/36/8/942/2515599 (accessed on 8 August 2016). [CrossRef] [Green Version]
  17. Keller, K.M.; Lienert, S.; Bozbiyik, A.; Stocker, T.F.; Churakova Sidorova, O.V.; Frank, D.C.; Klesse, S.; Koven, C.D.; Leuenberger, M.; Riley, W.J.; et al. 20th-century changes in carbon isotopes and water-use efficiency: Tree-ring-based evaluation of the CLM4.5 and LPX-Bern models. Biogeosciences 2017, 14, 2641–2673. [Google Scholar] [CrossRef] [Green Version]
  18. Shestakova, T.A.; Voltas, J.; Saurer, M.; Berninger, F.; Esper, J.; Andreu-Hayles, L.; Daux, V.; Helle, G.; Leuenberger, M.; Loader, N.J.; et al. Spatio-temporal patterns of tree growth as related to carbon isotope fractionation in European forests under changing climate. Glob. Ecol. Biogeogr. 2019, 28, 1295–1309. [Google Scholar] [CrossRef]
  19. Churakova Sidorova, O.V.; Myglan, V.S.; Fonti, M.V.; Saurer, M. Isotopic responses to dry and wet episodes as captured in tree rings of southern Altai relict forests. Eur. J. For. Res. 2020. in revision. [Google Scholar]
  20. Zhou, S.; Williams, P.; Berg, A.M.; Cook, B.B.; Zhang, Y.; Hagemann, S.; Lorenz, R.; Seneviratne, S.I.; Gentine, P. Land–atmosphere feedbacks exacerbate concurrent soil drought and atmospheric aridity. Proc. Natl. Acad. Sci. USA 2019, 116, 18848–18853. [Google Scholar] [CrossRef] [Green Version]
  21. Umair, M.; Kim, D.; Choi, M. Impact of climate, rising atmospheric carbon dioxide, and other environmental factors on water-use efficiency at multiple land cover types. Sci. Rep. 2020, 10, 11644. [Google Scholar] [CrossRef]
  22. Reich, P.B.; Sendall, K.M.; Stefanski, A.; Rich, R.L.; Hobbie, S.E.; Montgomery, R.A. Effects of climate warming on photosynthesis in boreal tree species depend on soil moisture. Nature 2018, 562, 263–267. [Google Scholar] [CrossRef] [PubMed]
  23. Farquhar, G.D.; Ehleringer, J.R.; Hubick, K.T. Carbon isotope discrimination and photosynthesis. Annu. Rev. Plant Physiol. Plant Mol. Biol. 1989, 40, 503–537. [Google Scholar] [CrossRef]
  24. Bhusal, N.; Lee, M.; Han, A.R.; Kim, H.S. Responses to drought stress in Prunus sargentii and Larix kaempferi seedlings using morphological and physiological parameters. For. Ecol. Manag. 2020, 465, 118099. [Google Scholar] [CrossRef]
  25. Liu, N.; Kala, J.; Liu, S.; Haverd, V.; Dell, B.; Smettem, K.R.J.; Harper, R.J. Drought can offset potential water use efficiency of forest ecosystems from rising atmospheric CO2. J. Environ. Sci. 2020, 90, 262–274. [Google Scholar] [CrossRef]
  26. Myglan, V.S.; Oidupaa, O.C.; Kirdyanov, A.V.; Vaganov, E.A. A 1929-year tree-ring chronology for the Altai-Sayan region (Western Tuva). Archaeol. Ethnol. Anthr. Eurasia 2008, 36, 25–31. [Google Scholar] [CrossRef]
  27. Sevastyanov, V.V. Climate of the High-Elevated Regions in Altai and Sayan; Tomsk University: Tomsk, Russia, 1998; 201p. [Google Scholar]
  28. Alisov, B.P. Climate USSR; Moscow State University: Moscow, Russia, 1956; 547p. [Google Scholar]
  29. Sidorova, O.V.; Saurer, M.; Myglan, V.S.; Eichler, A.; Schwikowski, M.; Kirdyanov, A.V.; Bryukhanova, M.V.; Gerasimova, O.V.; Kalugin, I.; Daryin, A.; et al. A multi-proxy approach for revealing recent climatic changes in the Russian Altai. Clim. Dyn. 2012, 38, 175–188. [Google Scholar] [CrossRef] [Green Version]
  30. Sidorova, O.V.; Siegwolf, R.; Myglan, V.S.; Loader, N.J.; Helle, G.; Saurer, M. The application of tree-rings and stable isotopes for reconstructions of climate conditions in the Altai-Sayan Mountain region. Clim. Chang. 2013, 120, 153–167. [Google Scholar] [CrossRef]
  31. Saurer, M.; Siegwolf, R.T.W. Human Impacts on Tree-Ring Growth Reconstructed from Stable Isotopes. Terr. Ecol. 2007, 1, 49–62. [Google Scholar]
  32. Blackman, R.; Tukey, J.W. The Measurement of Power Spectra from the Point of View of Communications Engineering—Part I. Bell Syst. Tech. J. 1958, 37, 185–282. [Google Scholar] [CrossRef]
  33. Giguère-Croteau, C.; Boucher, É.; Bergeron, Y.; Girardin, M.P.; Drobyshev, I.; Silva, L.C.R.; Hélie, J.-F.; Garneau, M. North America’s oldest boreal trees are more efficient water users due to increased [CO2], but do not grow faster. Proc. Natl. Acad. Sci. USA 2019, 116, 2749–2754. [Google Scholar] [CrossRef] [Green Version]
  34. Adams, M.A.; Buckley, T.N.; Turnbull, T.L. Diminishing CO2-driven gains in water-use efficiency of global forests. Nat. Clim. Chang. 2020, 10, 466–471. [Google Scholar] [CrossRef]
  35. Peters, W.; van der Velde, I.R.; van Schaik, E.; Miller, J.B.; Ciais, P.; Duarte, H.F.; van der Laan-Luijkx, I.T.; van der Molen, M.K.; Scholze, M.; Schaefer, K. Increased water-use efficiency and reduced CO2 uptake by plants during droughts at a continental scale. Nat. Geosci. 2018, 11, 744–748. [Google Scholar] [CrossRef]
  36. Yang, Y.; Guan, H.; Batlaan, O.; McVicar, T.R.; Long, D.; Piao, S.; Liang, W.; Liu, B.; Jin, Z.; Simmons, C.T. Contrasting responses of water use efficiency to drought across global terrestrial ecosystems. Sci. Rep. 2016, 6, 23284. [Google Scholar] [CrossRef] [Green Version]
Figure 1. A map with a location of the studied sites (Mongun (MOG), Koksu (KOK), Ersin (HO) and Chadan (CH)) in the Altai-Sayan Mountain Range (ASMR) (a). Photos of the Larix sibirica Ledeb. trees at the MOG site (b), KOK (c), HO (d) and CH (e) sites. Photos were made during the fieldwork studies and archived at the Siberian dendrochronological laboratory at the Siberian Federal University, Russian Federation.
Forests 11 01103 g001
Figure 2. Annual and smoothed by a 11-year Hamming window intrinsic water use efficiency (iWUE) calculated for the Mongun (MOG, black line), Koksu (KOK, green line), Ersin (HO, red line), and Chadan (CH, blue line) sites. Vertical dashed line represents the start of a rapid increase in the iWUE trends for all studied sites. The years of 1921, 1961, and 1970 are missing for the KOK site.
Forests 11 01103 g002
Figure 3. Spatial distribution of correlation coefficients with the p < 0.1 within the range from −0.6 (dark blue) to +0.6 (dark red, right vertical scale) between averaged iWUE time series from Koksu (KOK), Mongun (MOG), Ersin (HO) and Chadan (CH), and (a) averaged June–August vapor pressure deficit (VPD), (b) averaged June–August maximal value of the surface air temperature and (c) averaged June–August precipitation calculated for the period from 1919 to 2019.
Forests 11 01103 g003
Table 1. Study sites and local weather stations used for the climatic analysis (Figure S1). Air temperature data in brackets were recalculated according to the altitude, °C/100 m [27].
Site CodeSite NameCoordinatesm a.s.l.Weather Station
(Instrumental Period)
Annual
Air Temp., Station &
°C Per 100 m a.s.l.
Annual
Precipitation, mm/year
MOGMongun50° N, 89° E2300Mugur Aksy
50° N, 90° E,
1850 m. a.s.l.
(1966–2015)
−2.5
(≈−5.7)
143
KOKKoksu49° N, 86° E2200Ak-kem,
49° N, 86° E
2056 m a.s.l.
(1961–1995)
−1.4
(≈−2.2)
443
HOErsin50° N, 93° E1502Ersin
50° N, 95° E,
1104 m a.s.l.
(1919–2019)
−3.7
(≈−6.0)
197
CHChadan51° N, 91° E832Chadan
51° N, 91° E,
820 m a.s.l.
(1945–2019)
−2.1
(≈−2.2)
235
Table 2. Statistical parameters of iWUE given as mean, standard deviation (SD), t-value to test difference between study sites, degree of freedom (df), minimum (min) and maximum (max), calculated for the Koksu (KOK), Mongun (MOG), Ersin (HO), and Chadan (CH) study sites.
SitePeriodMeanSDConf. −95%Conf. +95%t-ValuedfMin iWUEMax iWUE
KOK1919–200590.628.6788.7392.4995.828368.28111.90
MOG1919–2016100.1010.3498.02102.1895.799786.24141.25
HO1919–2019103.378.92101.60105.14115.849990.89137.32
CH1919–201999.446.3998.17100.71155.919989.09117.63
Note: p-value < 0.0001.
Table 3. Statistical parameters of iWUE the iWUE chronologies from Koksu (KOK), Mongun (MOG), Ersin (HO), Chadan (CH) and averaged iWUE calculated for all studied sits for the Altai-Sayan Mountain Range (ASMR) for the common period from 1919 to 2005.
SiteRR2Fdfp-ValueCovari-AnceStd. ErrorSlope
(1919–1984)(1985–2005)(1919–2005)
KOK0.830.691861.820.00010.030.060.210.870.29
MOG0.300.098.191.850.0050.150.390.011.540.08
HO0.310.099.301.850.0030.200.44−0.011.070.07
CH0.510.2629.401.850.00010.300.540.090.650.09
Average ASMR0.670.4570.541.850.00010.180.420.071.030.13
Note: Significance level is defined as a p-value < 0.01.
Publisher’s Note: MDPI stays neutral with regard to jurisdictional claims in published maps and institutional affiliations.

