Article

CO2 Transfer Characteristics of Calcareous Humid Subtropical Forest Soils and Associated Contributions to Carbon Source and Sink in Guilin, Southwest China

1
Key Laboratory of Karst Dynamics, Institute of Karst Geology (CAGS), Ministry of Natural Resourses (MNR) and Guangxi, Guilin 541004, China
2
International Research Center on Karst, Under the Auspices of United Nations Educational, Scientific and Cultural Organization (UNESCO), Guilin 541004, China
3
School of Water Resources and Environment, China University of Geosciences (Beijing), Beijing 100083, China
*
Author to whom correspondence should be addressed.
Forests 2020, 11(2), 219; https://doi.org/10.3390/f11020219
Submission received: 4 January 2020 / Revised: 7 February 2020 / Accepted: 11 February 2020 / Published: 14 February 2020

Abstract

:
In karst landscapes, soil CO2 is a key factor in weathering processes and carbon cycling, where its distribution and migration characteristics directly affect fluxes in carbon source–sink dynamics. We measured the CO2 emission and dissolution rates of carbonate tablets in calcareous soil developed from limestone and red soil developed from clastic rock, in karst and non-karst subtropical forests, in Guilin, southwest China between 2015 and 2018, to analyze their CO2 transfer characteristics and source–sink effects. The results showed similar average soil respiration rates between calcareous soil and red soil, with an average CO2 emission flux of 1305 and 1167 t C km−2 a−1, respectively. Carbonate tablet dissolution rates were bidirectional with increasing depth and were greater in red soil than calcareous soil, averaging 13.88 ± 5.42 and 7.20 ± 2.11 mg cm−2 a−1, respectively. CO2 concentration was bidirectional with increasing soil depth, reaching a maximum at the base of the soil–atmosphere interface (50–60 cm), and the bidirectional gradient was more distinctive in red soil. Change in the carbon isotope value of soil CO2 was also bidirectional in calcareous soils, for which the overall average was 0.87‰ heavier in calcareous than red soil. The carbon sink in calcareous soil in karst regions was estimated to be 11.97 times that of red soil in non-karst regions, whereas its role as a carbon source is just 1.12 times that of red soil, thus indicating the key role of karst soil in the reduction of atmospheric CO2.

1. Introduction

As the largest carbon pool of the terrestrial ecosystem, the amount of total carbon stored in soil (2300 Pg) is about two times and three times higher than the amount stored in the atmosphere (750 Pg) and in living biomass (650 Pg), respectively [1]. Global soil CO2 emission rates are now up to approximately 98 ± 12 Pg a−1, which is an order of magnitude greater than total annual CO2 emissions from human activities (6.8 Pg a−1); thus, small fluctuations in soil CO2 emissions can greatly affect concentrations of atmospheric CO2 [2,3].
Notably, soil CO2 is soluble in water and readily forms carbonic acid, which can react with some types of bedrock (e.g., carbonate rock) to consume soil CO2 and act as an important carbon sink of atmospheric CO2 [4]. China has a karst area of 3.44 million km2 [5], and the net recovery of atmospheric CO2 from the weathering of carbonate rocks (karstifiction) can reach 36 million t C a−1 [6], accounting for 48% of China’s forest carbon sink (75 million t C a−1) [7] between 1981 and 2000. The karst area of eight provinces in southwest China totals 1.12 million km2, of which the bare karst area, depicted as carbonate rock exposed to the atmosphere directly, is 460,000 km2 [5].
According to previous studies, the karstification that occurred in the soil–rock interface has affected the carbon isotope value (δ13C) of CO2 from soil respiration and its distribution in the soil profile [8,9,10,11,12]. The CO2 concentration in the limestone soil profile has a bidirectional gradient, with CO2 concentration peaks typical in the middle layer [8,9,10,11]. In contrast, the CO2 concentration in the red soil profile has a unidirectional gradient; that is to say, the deeper the red soil layer, the higher the CO2 concentration [9]. However, unidirectional gradients with depth have also been recorded from 60 cm depths in limestone and dolomite soil profiles [12]. In the non-karst soil profile, the bidirectional gradient of CO2 distribution was also reported [13,14]. The CO2 concentration and amount of CO2 emitted from soil respiration in limestone soil are both lower in karst areas than those of red soil in non-karst areas [9]. The δ13C value of CO2 from soil respiration in the karst area is 4‰ heavier than that of the non-karst area [9]. This difference may be related to consummation and absorption of soil CO2 in the carbonate rock dissolution at the soil–rock interface of karst regions [9]. In the soil–atmosphere interface layer, the δ13C value of soil CO213C-CO2) decreased with an increase in soil depth; whereas, below the soil–atmosphere interface layer, the δ13C-CO2 is basically unchanged in a karst soil [15].
Analysis of the δ13C may be used to explore the source of CO2 in soil. If the karstification effect is sufficiently large enough to influence soil CO2 concentration distribution, it should first arouse the CO2 isotope’s response to the soil profiles, because the CO2 dissociated from bicarbonate formed by karstification is one of the sources of the soil CO2 in karst areas [12]. Therefore, to understand how it may affect δ13C-CO2 and the release of CO2, and evaluate the CO2 source and sink effect of karst soils, we determined the CO2 concentration and isotope value in three calcareous soil profiles, developed from limestone found in a subtropical forest, for three years, for which red soils developed from clastic rock of the same zone were chosen for comparison. The source of CO2 emission in calcareous soil was collected by the chamber method, and the sink produced by karstification was calculated by the standard carbonate tablet method.

2. Materials and Methods

2.1. Study Site

The study area was located near Maocun village, about 30 km southeastof Guilin (110°30′00″–110°33′45″ E, 25°10′11″–25°12′30″ N), in a typical karst peak cluster depression and valley landscape, with a catchment of about 10 km2 (Figure 1). The climate in the area is mid-subtropical humid monsoon, hot and humid summer, characterized by spatio–temporal variations in rainfall; the annual average temperature is 19.64–20.39 °C, and the annual average rainfall is 1160–1378 mm (Figure S1). The geology of karst areas consists of Upper Devonian Rongxian Formation (D3r) pure limestone. Vegetation in the studied sites was comprised of an evergreen broad-leaved forest dominated by Cyclobalanopsis glauca, Loropetalum chinense, Alchornea trewioides, and Nephrolepis auriculata, whose soil type was brown calcareous soil of the primosol order in the genetic soil classification of China (GSCC) [16], with a depth of 0.2–1 m. The geology of non-karst areas comprises iron clastic rock (D21). Vegetation in this studied site was comprised of an evergreen broad-leaved forest, dominated by Castanopsis fargesii, Schima superba, Itea chinensis, and a small amount of Miscanthus spp.; the soil type was red soil of the ferralosol order in GSCC [16], with a depth of >1 m [9].

2.2. Soil Physicochemical Properties

For each layer (10, 20, 30, 40, 50, 60, 80, and 100 cm) in the 1-m deep soil profiles, we recorded water volume concentration, conductivity, and temperature using a WET sensor and HH2 moisture meter (Delta, Wakefield, UK); the corresponding range and resolutions are 0–100%, 0.1%, 0–300 mS m−1, 1.0 mS m−1 and–5–+50 °C, 0.1 °C. Soil pH was measured by a US IQ150 (0.00–14.00, 0.01) soil in situ acidity meter on 24 March 2015. The water volume concentration, conductivity, and temperature of the surface calcareous soil and red soil were measured monthly for one year (Table 1; Figure 2). Soil organic matter was determined by the potassium dichromate volumetric method.

2.3. Soil CO2 Concentrations and Emissions

We installed a CO2 collection pipe in the calcareous (KP1) and red (NKP1) soil profiles in March 2015; two additional profiles in each soil type were included in January 2016 (KP2, KP3, and NKP2, NKP3), and monitoring points were separated by 5–50 m. Monthly monitoring continued from April 2015 to March 2018.
CO2 concentrations in the eight soil layers were measured and recorded monthly (April 2015–March 2018) using a self-made soil collection pipe, comprising a 100 mL test tube in which gas was collected using a vacuum pump (GAS-TECQ Kitagawa, Japan). If CO2 concentration >2.6%, we collected 50 mL of gas, and CO2 concentration was doubled to give a concentration per 100 mL of gas.
Soil respiration CO2 was collected from relatively flat ground, from which litter and weeds were removed to control for photosynthesis and the respiration of plants; the bare ground was immediately covered with a metal cylinder (25 cm diameter, 32 cm high), and the lower, open end of the cylinder was embedded 2 cm below the soil surface. A rubber tube was embedded in the soil within the cylinder and exposed to the atmosphere; a water stop clip was used to seal the end of the tube exposed to the atmosphere. Monthly atmospheric samples (April 2015–March 2018) were taken from the profiles at about 2 m above ground level to calculate background CO2 levels; 1 h later, 200 mL of gas in the cylinder was continuously collected using a 100 mL medical syringe and injected into a vacuumed aluminum foil gas sampling bag. CO2 concentration (ppm) was determined using an Agilent SP1 7890-0468 meteorological chromatograph (Agilent, Santa Clara, CA, USA) at the Ministry of Natural Resources/Guangxi Key Laboratory of Karst Dynamics, Guilin, Guangxi. Air pressure and temperature were simultaneously recorded. Sampling was done between 09:00 and 11:00, when soil respiration rates tend to reflect daily averages [17], to minimize diurnal variations in emissions. Soil CO2 concentration and respiration in KP1 and NKP1 were sampled 33 times, and 23 times from the remaining profiles.
The δ13C-CO2 was measured from the eight layers in the soil profiles in June and December 2015, and July 2017, where we used a vacuum to extract soil CO2 into sealed aluminum bags. The δ13C-CO2 analysis was completed at the isotope laboratory of the Chinese Academy of Agricultural Sciences, Beijing, China using a MAT253 mass spectrometer. Samples were collected from KP1 and NKP1 three times, and once from the remaining profiles.

2.4. Dissolution Rate of Carbonate Rock

The rate was acquired through the standard carbonate tablet method [18]. Carbonate tablets were determined from high purity, 4 cm diameter × 0.3 cm thick calcareous tablets that were washed and subsequently dried at 70 °C to constant weight after cooling, through a repeated dry-weigh process. In March 2015, in KP1 and NKP1, three tablets were placed 150 cm above the ground, at the soil surface, and inserted at the 20, 50, and 100 cm soil layers. In June, September, and December 2015, and March 2016, the tablets were recovered, analyzed, and re-buried following the washing and drying process described above.

2.5. Data Analysis

The units of CO2 measurement (ppm) were converted to mg m−3 using:
CO 2 = M 22.4 × ppm × 273 273 + T × Ba 101325
where M is the molecular weight of the gas; ppm is the measured volume concentration; T is the atmospheric temperature (°C); and, Ba is atmospheric pressure (Pa).
Soil respiration rate (VR; mg C m−2 h−1) was calculated as:
V R = ( C 1 C 0 ) × V S × h × 12 44
where C1 is CO2 concentration in the cylinder (mg m−3); C0 is the corresponding background CO2 concentration (mg m−3); V is the sampling box volume (m3); S is the area of sampled soil (m2); and, h is the monitoring time (h).
Annual soil CO2 emission flux (F; t C km−2 a−1) was calculated as:
F = i = 1 n V n × ( T n T n 1 ) × 24 × 10 3 ( T n T 1 ) 365
where Vn is the nth measured soil respiration rate (mg C m−2 h−1); Tn − Tn−1 and Tn − T1 are the nth and (n−1)th, the nth and 1st sampling intervals (d), respectively.
The annual dissolution rate of the carbonate tablet (ER; mg cm−2 a−1) was calculated as:
ER = ( W 1 W 2 ) × 1000 × T 365 × S
where W1 is the initial weight of the tablet (g); W2 is the weight after embedding (g); T is the embedding duration (d); and S is the tablet surface area (about 28.9 cm2).
CO2 recovery in calcareous soil (CRC; t C km−2 a−1) was calculated according to the stoichiometric coefficient ratio of the carbonate dissolution reaction:
CaCO3 + CO2 + H2O ↔ Ca2+ + HCO3
CR C = ER × 97 % × 12 100 × 10
where ER is the annual dissolution rate of the carbonate tablet (mg cm−2 a−1); 97% is the purity of the standard carbonate tablet.
The dissolution rate of carbonate rocks in calcareous soil is 23.8 times that of clastic rocks in red soil at the study site [19]. According to the clastic rock dissolution reaction:
2CO2 + 3H2O + CaSiO3 = Ca2+ + 2HCO3 + H4SiO4
the CO2 recovery in red soil (CRR; t C km−2 a−1) was calculated this way:
C R R = CR C 23.8 × 2
We used one-way analysis of variance (ANOVA) to analyze the differences in soil respiration rate, CO2 concentration, and δ13C-CO2 among the soil layers between the two soil types at p = 0.05. A Pearson correlation analysis was used to test for association between CO2 concentration and δ13C-CO2 in different layers. Analyses were performed in Statistical Package Social Science (SPSS ver. 20.0; IBM Crop., Armonk, NY, USA).

3. Results

3.1. Soil Respiration Rate and Flux

There was a single peak in the soil respiration rate in one year of the karst and non-karst soil profiles, and soil respiration rates varied among the three calcareous soil profiles (range: 9.02–437.33 mg C m−2 h−1, average: 134.84 mg C m−2 h−1), where they were greater in KP2 than KP1; there were no differences among the red soil profiles (range: 23.21–361.42 mg C m−2 h−1, average: 137.93 mg C m−2 h−1) (Figure 3). No difference in the mean soil respiration rate was found between the two soil types, but the variation was greater in calcareous soil. The average CO2 emission flux in calcareous soil and red soil was 1305 and 1167 t C km−2 a−2 (Table S1), being 12% higher in calcareous soil.

3.2. Variation in CO2 Concentration among Soil Layers

Consistent with changes in soil respiration rate, the seasonal variation in soil CO2 concentration in the layers tended to be unimodal, and concentrations were universally greater in summer and autumn than in winter and spring; an anomaly was the low value recorded in July 2015 and August 2016 (Figure 4). Overall, CO2 concentrations were greatest and most variable in KP2, and lowest in KP1. There were no differences in CO2 concentrations among the three red profiles.
Soil CO2 concentration in the calcareous soil and red soil profiles varied with depth, where it tended to be higher at 50–60 cm and lower in the upper and deeper layers; this pattern was clearer in the red soils (Figure 5). The mean CO2 concentrations in the three calcareous soils were 11% greater than in the red soils (Table S2).

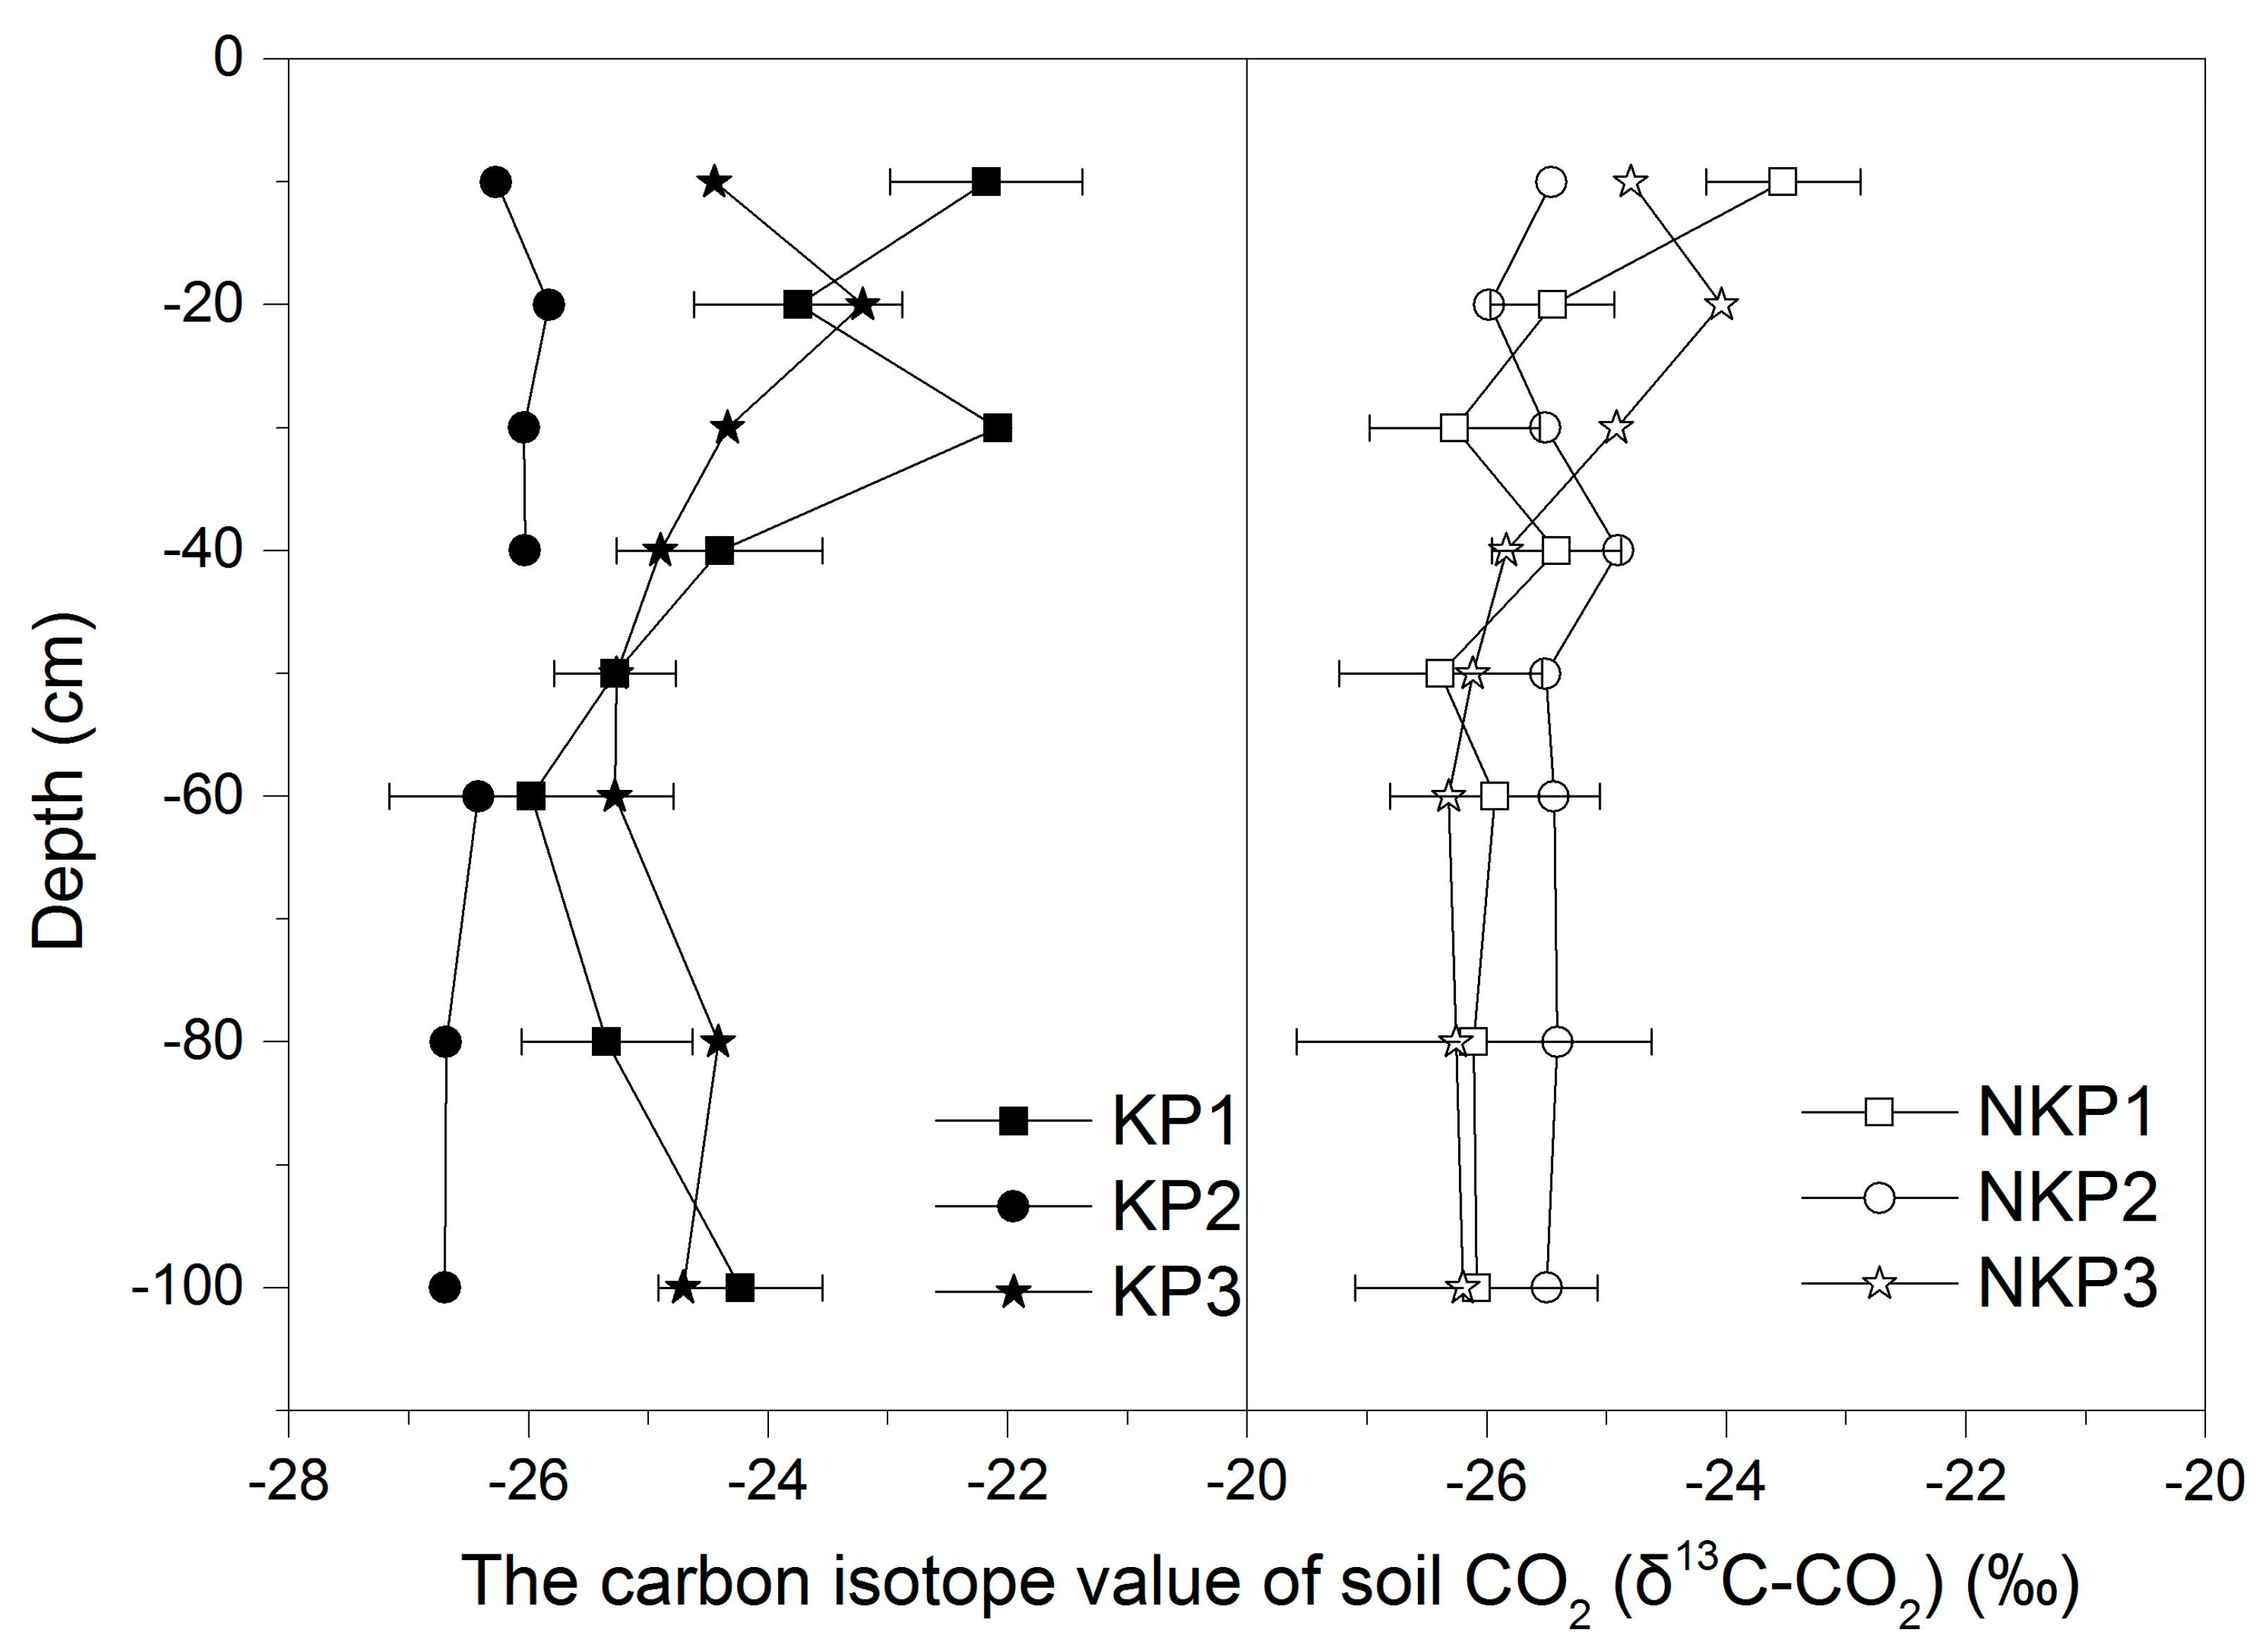
3.3. Changes in δ13C-CO2 among Soil Layers

In the calcareous soils, there was a bidirectional gradient of δ13C-CO2 with a depth in KP1 and KP3, and values at 60 cm were lighter than those of either the upper or deeper layers; the δ13C-CO2 values were lightest in KP2 and heaviest in KP1, with respective averages of −26.28‰ and −24.24‰ (Figure 6). In the red soils, δ13C-CO2 decreased with a depth of up to 50 cm, but it remained stable from 50 cm to 100 cm. The mean value of three plots for all layers was 0.87‰ heavier in calcareous soil than red soil (Table S3).

3.4. Dissolution Rates of the Carbonate Tablets in Different Layers

The dissolution rates of carbonate tablets were greater in the two soil types than in the air above the profiles, and their rates were greatest in the summer (Figure 7). The rates were bidirectional with increasing depth and were greater in red soil than calcareous soil, except in calcareous soil during summer. There was no difference in the mean rates in the air above the calcareous and red soils, with averages of 2.50 ± 0.91 and 2.03 ± 1.07 mg cm−2 a−1, respectively. The corresponding rates in the soil were 7.20 ± 2.11 and 13.88 ± 5.42 mg cm−2 a−1, being 48% lower in calcareous soil (Table S4).

4. Discussion

4.1. Bidirectional Gradient of Soil CO2 Concentrations and CO2 Emissions in Red and Calcareous Soil Profile

Wang [13] and Dai [14] found that soil concentrations of CO2 increased with a greater depth (up to 50 cm) but then diminished below 60 cm, due to the low associated organic carbon content. In our study, soil CO2 concentrations in the two soil types had a bidirectional gradient trend, though this was more pronounced in the red soil, where the maximum values were recorded in the 50–60 cm layer. Soil organic matter (SOM) on the surface of calcareous soil was clearly higher than that of red soil (Table 1), but it exhibited the opposite trend deeper in the profile. Additionally, there is only a single trend of a gradually decreasing SOM content in red soil, while calcareous soil has a tendency to increase slightly at 50–60 cm. Therefore, the distribution of SOM should be a major reason why the concentration of CO2 in deep layers of red soil decreases faster than in calcareous soil.
Our experiment showed that the diffusion input of atmospheric CO2 was greater until the 50–60 cm layer, indicating that the thickness of the soil–atmosphere interface layer was 50–60 cm, while soil CO2 in deeper layers was probably controlled by oxidative decomposition of organic matter. It is likely that the physical structure of soil particles and porosity, clay content, and soil flooding may also affect the thickness of the soil–atmosphere interface layer [20,21,22].
The annual soil respiration flux varies greatly in southwest China, ranging from 4.5 t C ha−1 a−1 (450 t C km−2 a−1) in Yaji, Guilin, Guangxi, to 150 mg C m−2 h−1 (1314 t C km−2 a−1) in Qingmuguan, Chongqing [9,23,24,25]. The results of our study are close to the largest value in those studies. The results were four to six times greater than those of typical meadow and dryland systems in a temperate continental monsoon climate zone (2.8–4.8 t C ha−1 a−1= 280–480 t C km−2 a−1) [22], perhaps due to lower temperatures in the temperate zone. Soil temperature, which is a key driver of soil respiration, is exponentially related to soil CO2 [26].
Soil moisture also drives the soil respiration rate, and directly and indirectly regulates soil CO2 emissions. It is believed that soil respiration increases with increasing soil moisture, until it reaches a threshold, after which it declines [20]. For example, when soil moisture is >60% in shallow soil, CO2 flux rapidly decreases, due to the restriction of gas transport by the moisture [21], and a soil water content of 25–45% is optimal for microbe activity [27]. Soil moisture in the profile of calcareous soil was horizontally and vertically higher than that of the profile of red soil (Table 1, Figure 2), which may have been responsible for the higher CO2 concentration and respiration characterizing the calcareous soil profile.

4.2. Soil CO2 Concentration and δ13C-CO2 Affected by Karstification

Consistent with our results, the CO2 produced in soil had a lighter mean δ13C value of −21 ± 1.5‰ than CO2 with heavier isotopes in the surface atmosphere did (−9.82‰) [15], indicating a greater exchange of soil and air CO2 at the soil–atmosphere interface. Therefore, δ13C-CO2 from the soil–atmosphere interface layer and upward gradually becomes heavier.
We found heavier δ13C-CO2 in the calcareous karst soils below 50–60 cm, due to two possible reasons. Firstly, karstification consumes soil CO2, and lighter C is moved downward; the nearer the bedrock, the greater the likelihood of consumption of lighter C, resulting in heavier δ13C-CO2 in the soil. Secondly, the δ13C of the rock is 0‰, and the theoretical CO2 isotope value for bicarbonate formed by karstification at the soil–rock interface dissociation into soil CO2 is −14‰ [28]; therefore, lighter δ13C-CO2 derived from root respiration, soil organic matter oxidative decomposition, and soil microbe activity could be mixed with this part of CO2, resulting in a decreased overall CO2 isotope value.
The δ13C-CO2 in the red soil below 50–60 cm tended to be stable; this finding is consistent with other studies in non-karst areas [29]. This stability with increasing soil depth may be attributed to the composition of stable carbon isotopes of CO2 produced from the soil or the limited impacts of the climate on the physical properties of deep soils. The lightest value of soil CO2 occurred at 50–60 cm, both in calcareous and red soils, which further corroborated that the 50–60 cm layer was the bottom of the soil–atmosphere interface layer.
Below the soil–atmosphere interface layer, karstification at the soil–rock interface consumes CO2 and drives the downward migration of CO2 [9]. This process may also have caused slow declines in CO2 concentration at the bottom profile of the calcareous soil, resulting in a less pronounced bidirectional gradient than in the red soil profile. The δ13C-CO2 in calcareous soil became heavier: both the CO2 concentration and its isotopes of calcareous soil show a bidirectional gradient due to the contribution from karstification, so a significant positive correlation arose between the CO2 concentration and its isotopes (Figure 8). However, this was not the case in the red soil profile.

4.3. Source–Sink Effect of Karst Soil Carbon Pools

In this study, the dissolution rate of the carbonate tablet in the red soil was found to be 1.93 times that of the calcareous soil (Table 2); however, soil CO2 concentration and soil respiration rates were not as high (1.16 and 1.42 times, respectively, for NKP1 versus KP1), possibly due to a lower soil pH in the red soil affecting the rate of soil organic matter decomposition and erosion by soil microorganisms [30].
Influenced by soil temperature, water, soil CO2, soil organic matter and pH, in addition to soil pores and other conditions [31], the dissolution rate of carbonate tablets in the soil in forests in karst areas in southwest China vary widely, ranging from 1.99 mg cm−2 a−1 in Yaji, Guilin, Guangxi [24], to 357.93 mg m−2 d−1 (13.06 mg cm−2 a−1) in Dalongdong, Hunan [32]. The corresponding value obtained in our study is in the middle of these (Table 2), which can be considered as a better representative. The dissolution rate of carbonate tablets in the air is mainly controlled by the concentration of atmospheric CO2 and rainfall intensity [18], and the difference between the data in this study (Table 2) and that from Jinfo Mountain, Chongqing, (21.4 t km−2 a−1 = 2.14 mg cm−2 a−1) [18] is not large.
According to Table 2, CO2 recovery accounts for 0.64% of the soil carbon source for calcareous soil. It is clear, then, that although karstification is an active weathering process, decomposition of soil organic matter and associated CO2 respiratory emissions dominate the transport and cycling of carbon in the soil system. Thus, karstification and its impact on the carbon cycle represent an Earth-surface carbon transfer process.
Although the carbon source of calcareous soil was 1.12 times that of red soil, its carbon sink effect is 11.97 times that of red soil, suggesting that karst soil contributes greatly to the reduction of atmospheric CO2. Nonetheless, the dissolution rate of carbonate tablets in the air could be indicative of the carbonate rock dissolution rate in bare karst areas, which is only 0.35 times that of calcareous soil. However, due to the wide distribution of bare karst in southwest China, its carbon sink potentiality cannot be ignored. The high carbonate dissolution rate in red soil also indicated the huge carbon sink potential of zonal red soil-intercalated carbonate rocks.

5. Conclusions

The CO2 concentrations in calcareous and red soil layers exhibited bidirectional responses to soil depth. The influence of the soil–atmosphere interface on CO2 exchange extended to a depth of 50–60 cm, where CO2 concentration increased with depth; below this, CO2 concentration decreases with depth and is mainly controlled by organic matter decomposition.
Soil δ13C-CO2 in the two soils was controlled by CO2 exchange at the soil–atmosphere interface and downward—where isotopes become lighter with depths of 50–60 cm; beyond this, δ13C-CO2 gradually became heavier in calcareous soil layers, being mainly controlled by karstification. The CO2 in the red clastic soils was derived from organic matter with stable isotopes, and so δ13C-CO2 values were stable at depths >50–60 cm. The overall average of δ13C-CO2 was 0.87‰ heavier in calcareous soils than red soils.
There were also bidirectional differences evident in the dissolution rates of carbonate rock in the two contrasting soils. The rates in the calcareous soil and red soil were 7.20 ± 2.11 and 13.88 ± 5.42 mg cm−2 a−1, and, thus, almost half as low (48% lower) in calcareous soil.
Although karstification is an active weathering process, the decomposition of soil organic matter and associated CO2 respiratory emissions dominate the transport and cycling of carbon in the system. The soil carbon sink only accounts for 0.64% of carbon sources in the karst areas. However, the CO2 recovery in karst soil is estimated to be 11.97 times that of the clastic rock area and 1.12 times the latter as a carbon source, indicating the key role of karst soil in reducing atmospheric CO2.

Supplementary Materials

The following are available online at https://www.mdpi.com/1999-4907/11/2/219/s1, Figure S1: Temperature and rainfall in Maocun village, Table S1: Respiration rates in calcareous and red soils, Table S2: CO2 Concentrations in different layers in calcareous and red soils, Table S3: δ13C-CO2 values at different depths of calcareous and red soils, Table S4: Seasonal carbonate dissolution rates in calcareous and red soils.

Author Contributions

Conceptualization, J.C.; writing—original draft preparation, F.H.; investigation, M.R. and M.F., writing—review and editing, J.C. and T.Z. All authors have read and agreed to the published version of the manuscript.

Funding

This study was supported by the National and Guangxi Natural Science Foundation of China (Grant Nos. 41772385, 2016GXNSFAA380034, 41530316), the National Key Research Projects (Grant No. 2016YFC05025), and the China Geological Survey (Grant No. DD20160305).

Acknowledgments

Special thanks go to the anonymous referees for their valuable comments and suggestions.

Conflicts of Interest

The authors declare no conflict of interest.

References

  1. Jobbagy, E.G.; Jackson, R. The Vertical Distribution of Soil Organic Carbon and Its Relation to Climate and Vegetation. Ecol. Appl. 2000, 10, 423–436. [Google Scholar] [CrossRef]
  2. Sheng, H.; Yang, Y.S.; Yang, Z.J.; Chen, G.S.; Xie, J.S.; Guo, J.F.; Zou, S.Q. The dynamic response of soil respiration to land-use changes in subtropical China. Glob. Chang. Biol. 2010, 16, 1107–1121. [Google Scholar] [CrossRef]
  3. Ben, B.L.; Allison, T. Temperature-associated increases in the global soil respiration record. Nature 2010, 464, 579–582. [Google Scholar]
  4. Cao, J.; Yang, H.; Kang, Z. Preliminary regional estimation of carbon sink flux by carbonate rock corrosion: A case study of the Pearl River Basin. Chin. Sci. Bull. 2011, 56, 3766–3773. [Google Scholar] [CrossRef] [Green Version]
  5. Li, D.; Luo, Y. Measurement of carbonate rocks distribution area in China. Carsologica Sin. 1983, 2, 147–150. (In Chinese) [Google Scholar]
  6. Liu, Z.; Wolfgang, D. Comparison of carbon sequestration capacity between carbonate weathering and forests: The necessity to change traditional ideas and methods of study of carbon sinks. Carsologica Sin. 2012, 31, 345–348. (In Chinese) [Google Scholar]
  7. Fang, J.; Guo, Z.; Piao, S.; Chen, A. Estimation of terrestrial vegetation carbon sink in China from 1981 to 2000. Sci. China Ser. D 2007, 37, 804–812. (In Chinese) [Google Scholar]
  8. Huang, Q.; Qin, X.; Liu, P.; Zhang, L.; SU, C. Proportion of pedogenic carbonates and the impact on carbon sink calculation in karst area with semiarid environment. Carsologica Sin. 2016, 35, 164–172. (In Chinese) [Google Scholar]
  9. Cao, J.; Zhou, L.; Yang, H.; Lu, Q.; Kang, Z. Comparison of carbon transfer between forest soils in karst and clasolite areas and the karst carbon sink effect in Maocun village of Guilin. Quat. Sci. 2011, 31, 431–437. (In Chinese) [Google Scholar]
  10. He, S.; Zhang, M.; Xu, S. Observation on soil CO2 concentration, hydrochemistry, and thier relationship with karst processes. Carsologica Sin. 1997, 16, 319–324. [Google Scholar]
  11. Xu, S.; He, S. The CO2 regime of soil profile and its drive to dissolution of carbonbate rock. Carsologica Sin. 1996, 15, 50–57. (In Chinese) [Google Scholar]
  12. Li, T.; Wang, S.; Zheng, L. Comparative study on sources of CO2 from overlying carbonate rocks and non-carbonate rocks, in the middle parts of Guizhou province. Sci. China Ser. D 2001, 31, 777–782. (In Chinese) [Google Scholar]
  13. Wang, C.; Huang, Q.; Yang, Z.; Huang, R.; Chen, G. Analysis of vertical profiles of soil CO2 efflux in Chinese fir plantation. Acta Ecol. Sin. 2011, 31, 5711–5719. (In Chinese) [Google Scholar]
  14. Dai, W.; Wang, Y.; Huang, Y.; Liu, J.; Zhao, L. Seasonal dynamic of CO2 concentration in lou soil and impact by environmental factors. Acta Pedol. Sin. 2004, 41, 827–831. (In Chinese) [Google Scholar]
  15. Zheng, L. The stable carbon isotope composition of soil CO2 in the karst areas, the middle parts of Guizhou province. Sci. Chin. Ser. D 1999, 29, 514–519. (In Chinese) [Google Scholar]
  16. Huang, C. Soil Science; China Agriculture Press: Beijing, China, 2000; pp. 224–227. (In Chinese) [Google Scholar]
  17. Bubier, J.; Crill, P.; Mosedale, A.; Frolking, S.; Linder, E. Peatland responses to varying interannual moisture conditions as measured by automatic CO2 chambers. Glob. Biogeochem. Cycles 2003, 17. [Google Scholar] [CrossRef] [Green Version]
  18. Zhang, C. Carbonate rock dissolution rates in different landuses and their carbon sink effect. Chin. Sci. Bull. 2011, 56, 2174–2180. [Google Scholar] [CrossRef] [Green Version]
  19. Huang, F.; Zhang, C.L.; Xie, Y.C.; Li, L.; Cao, J.H. Inorganic carbon flux and its source in the karst catchment of Maocun, Guilin, China. Environ. Earth Sci. 2015, 74, 1079–1089. [Google Scholar] [CrossRef]
  20. Gong, X.; Li, Y.; Wang, X.; Niu, Y.; Lian, J.; Luo, Y. Characteristics of soil CO2 emission in relation to hydrothermal factors during the growing season in horqin sandy land. Ecol. Environ. 2018, 27, 634–642. (In Chinese) [Google Scholar]
  21. Gabriel, C.E.; Kellman, L. Investigating the role of moisture as an environmental constraint in the decomposition of shallow and deep mineral soil organic matter of a temperate coniferous soil. Soil Biol. Biochem. 2014, 68, 373–384. [Google Scholar] [CrossRef]
  22. Jiang, C.; Hao, Q.; Song, C.; Hu, B. Effects of marsh reclamation on soil respiration in the Sanjiang Plain. Acta Ecol. Sin. 2010, 30, 4539–4548. (In Chinese) [Google Scholar]
  23. Wu, X.; Pan, M.; Zhu, X.; Zhang, M.; Bai, X.; Zhang, B. Precipitation effect on soil respiration in epikarst during summer. J. South. Agric. 2015, 46, 575–580. (In Chinese) [Google Scholar]
  24. Pan, G.; He, S.; Cao, J.; Tao, Y.; Sun, Y. Variation of δ13C value in karst soil system in the surface zone of Yaji Village, Guilin. Chin. Sci. Bull. 2001, 46, 1919–1922. (In Chinese) [Google Scholar]
  25. Li, L.; Xian, H.; Kuang, M.; Xie, S.; Zhang, Y.; Jiang, Y.; Liu, Y. The regularity of CO2 release from soils of the epikarst ecosystem in the Jinfu mountain, Chongqing. Acta Geosci. Sin. 2006, 27, 329–334. (In Chinese) [Google Scholar]
  26. Wang, X.; Wang, X.; Han, G.; Wang, J.; Song, W.; You, Z. Dynamics of soil CO2 concentration and CO2 efflux in non-growing season of the Yellow River Delta wetland. Chin. J. Ecol. 2018, 37, 2698–2706. [Google Scholar]
  27. Schindlbacher, A.; Zechmeister-Boltenstern, S.; Kitzler, B.; Jandl, R. Experimental forest soil warming: Response of autotrophic and heterotrophic soil respiration to a short-term 10 °C temperature rise. Plant Soil 2008, 303, 323–330. [Google Scholar] [CrossRef]
  28. Jiang, Y.J. The contribution of human activities to dissolved inorganic carbon fluxes in a karst underground river system: Evidence from major elements and delta δ13CDIC Nandong, Southwest China. J. Contam. Hydrol. 2013, 152, 1–11. [Google Scholar] [CrossRef]
  29. Ding, P.; Shen, C.; Wang, N.; Yi, W.; Ding, X.; Fu, D.; Liu, K.; Zhao, P. Carbon isotopic composition turnover and origins of soil of soil CO2 in a monsoon evergreen hroad leaf forest in Dinghushan Biosphere Reservior, South China. Chin. Sci. Bull. 2010, 55, 779–787. (In Chinese) [Google Scholar] [CrossRef]
  30. Zhao, R.; Lv, X.; Jiang, J.; Duan, Y. Factors affecting soil CO2 and karst carbon cycle. Acta Ecol. Sin. 2015, 35, 4257–4264. (In Chinese) [Google Scholar]
  31. Liu, W.; Zhang, Q.; Jia, Y. The influence of meteorological factors and soil physicochemical properties on karst processes in six land-use patterns in summer and winter in a typical karst valley. Acta Ecol. Sin. 2014, 34, 1418–1428. (In Chinese) [Google Scholar]
  32. Wang, W.; Lan, F.; Jiang, Z.; Qin, X.; Lao, W. Corrosion rate of carbonate tablet under diverse land use and lithology in the Dalongdong basin, Hunan. Carsologica Sin. 2013, 32, 29–33. (In Chinese) [Google Scholar]
Figure 1. Land use of study area and location of study sites.
Forests 11 00219 g001
Figure 2. Temperature, water volume concentration and conductivity in the calcareous and red soils.
Forests 11 00219 g002
Figure 3. Respiration rates in the calcareous and red soils.
Forests 11 00219 g003
Figure 4. Soil CO2 concentrations at 10–40 cm (a) and 50–100 cm (b) depths in calcareous and red soils.
Forests 11 00219 g004
Figure 5. Summary statistics of overall mean soil CO2 concentrations in calcareous and red soils. Open square: average; vertical line: median; box: upper and lower quartiles; horizontal lines: 1st and 99th percentiles; ×: minimum and maximum values. N = 168.
Forests 11 00219 g005
Figure 6. δ13C-CO2 values in different depth layers of the calcareous and red soils.
Forests 11 00219 g006
Figure 7. Dissolution rates in calcareous and red soils.
Forests 11 00219 g007
Figure 8. Association between δ13C-CO2 and the CO2 concentration in calcareous and red soils.
Forests 11 00219 g008
Table 1. Properties at different depths in calcareous and red soils.
Depth (cm)pHOrganic Matter (%)Water Content (%)Conductivity (mS m−1)Soil Temperature (°C)
Calcareous soil (KP1)107.324.57 ± 0.0526.79216.3
207.292.57 ± 0.0322.610616.4
307.351.92 ± 0.0423.411216.1
407.271.78 ± 0.0322.311516.1
507.251.89 ± 0.0822.211816.0
607.132.02 ± 0.0520.812316.0
807.211.34 ± 0.0126.211715.8
1007.240.86 ± 0.0032.211615.7
Red soil (NKP1)105.484.02 ± 0.0321.91217.1
205.963.67 ± 0.0523.31616.6
305.333.15 ± 0.0520.31216.6
405.402.72 ± 0.0322.01316.8
505.482.01 ± 0.0819.51117.0
605.361.65 ± 0.0018.11017.4
805.691.14 ± 0.0116.2717.6
1006.391.04 ± 0.0610.7717.5
Data are the mean ± standard deviation (SD). N = 3.
Table 2. The ratio of CO2 recovery to CO2 emission in calcareous soil and red soil.
Calcareous SoilRed Soil
Carbonate dissolution rate in air (mg cm−2 a−1)2.502.03
Carbonate dissolution rate in soil (mg cm−2 a−1)7.2013.88
CO2 recovery (t C km−2 a−1)8.380.70
Soil CO2 emission flux (t C km−2 a−1)13051167
CO2 recovery/CO2 emission (%)0.640.06

