Methane Emissions from Subtropical and Tropical Mangrove Ecosystems in Taiwan


Department of Life Sciences and Innovation and Development Center of Sustainable Agriculture, National Chung Hsing University, Taichung 40227, Taiwan
*
Author to whom correspondence should be addressed.
Forests 2020, 11(4), 470; https://doi.org/10.3390/f11040470
Submission received: 27 February 2020
/
Revised: 16 April 2020
/
Accepted: 16 April 2020
/
Published: 21 April 2020
(This article belongs to the Special Issue Climate Change Impacts on the Ecosystem Functions and Services of Mangrove Forests)
Abstract
:Mangroves are one of the blue carbon ecosystems. However, greenhouse gas emissions from mangrove soils may reduce the capacity of carbon storage in these systems. In this study, methane (CH4) fluxes and soil properties of the top 10 cm layer were determined in subtropical (Kandelia obovata) and tropical (Avicennia marina) mangrove ecosystems of Taiwan for a complete seasonal cycle. Our results demonstrate that CH4 emissions in mangroves cannot be neglected when constructing the carbon budgets and estimating the carbon storage capacity. CH4 fluxes were significantly higher in summer than in winter in the Avicennia mangroves. However, no seasonal variation in CH4 flux was observed in the Kandelia mangroves. CH4 fluxes were significantly higher in the mangrove soils of Avicennia than in the adjoining mudflats; this trend, however, was not necessarily recapitulated at Kandelia. The results of multiple regression analyses show that soil water and organic matter content were the main factors regulating the CH4 fluxes in the Kandelia mangroves. However, none of the soil parameters assessed show a significant influence on the CH4 fluxes in the Avicennia mangroves. Since pneumatophores can transport CH4 from anaerobic deep soils, this study suggests that the pneumatophores of Avicennia marina played a more important role than soil properties in affecting soil CH4 fluxes. Our results show that different mangrove tree species and related root structures may affect greenhouse gas emissions from the soils.
1. Introduction
Mangroves are distributed in tropical and subtropical coastal zones that provide many essential ecosystem services. Mangroves not only reduce anthropogenic nutrient loading from upstream inputs [1] but also protect the coastline, mitigate erosion from typhoons [2,3], and alleviate the economic losses of coastal residents [4]. Furthermore, mangroves provide coastal fishery resources for humans [5,6] and nursery places for marine organisms [7].
Carbon sequestration is one of the essential ecosystem services of mangroves [8]. Mcleod et al. [9] indicated that mangroves, seagrass beds, and salt marshes are the three main “blue carbon” ecosystems, and the estimated global carbon storage rate was 226 ± 39 g C m−2 yr−1. In addition, the carbon sequestration rate was approximately 1.26 Mg ha−1 yr−1 in mangroves, which was much greater than that of seagrass beds (0.36 Mg ha−1 yr−1) and salt marshes (0.39 Mg ha−1 yr−1) in Australia [10]. Thus, mangroves can play an important role in regulating climate and mitigating global warming.
Anaerobic conditions often develop in the frequently flooded soils of coastal wetlands such as mangroves due to the curtailed supply of atmospheric oxygen into the soils. As a result, oxygen is rapidly depleted, soil oxidation reduction potential (Eh) is reduced, and other oxidants are used as electron acceptors for further respiration [11,12,13]. Anaerobic processes that follow aerobic respiration (O2→CO2) include (1) denitrification (NO3−→NO2−→NO→N2O→N2), (2) manganese reduction (Mn4+→Mn2+), (3) iron reduction (Fe3+→Fe2+), (4) sulfate reduction (SO42−→H2S), and (5) methanogenesis (CO2→CH4). The greenhouse gases such as CO2, N2O, and CH4 are produced in a chain of reduction reactions by microbial metabolism. Furthermore, since sulfate can be directly acquired from seawater, the reduction reaction of sulfate is generally stronger than methanogenesis at sites immersed in high-salinity seawater, such as mangroves [13]. Consequently, CH4 emissions from mangroves have been reported to be affected by temperature and soil parameters, e.g., salinity, redox potential (ORP), pH, water content, and sulfate content [14,15]. However, other factors regulating greenhouse gas emissions from mangroves have seldom been discussed.
Previous studies established the carbon budgets in mangrove ecosystems [16,17]. Nonetheless, neglecting the emissions of greenhouse gas in the carbon budgets could possibly overestimate the carbon storage capacity. Based on an Intergovernmental Panel on Climate Change (IPCC) report [18], the global warming potential of CH4 is 28 times higher than that of carbon dioxide (CO2) over 100 years. Thus, to precisely estimate the carbon storage capacity, CH4 emissions should be quantified in mangrove ecosystems [19,20].
There are large areas of mangroves distributed along the western coast of Taiwan. Four mangrove species (Avicennia marina, Kandelia obovata, Lumnizera racemosa, and Rhizophora stylosa) are present in Taiwan. The dominant species are Kandelia obovata and Avicennia marina on the northwest (subtropical) and southwest (tropical) coasts, respectively. The root structures of the two mangrove species differ. Kandelia obovata possesses prop roots, whereas vertical roots or pneumatophores are observed in Avicennia marina. In this study, we hypothesized that CH4 fluxes from the soils of mangrove ecosystems were different among seasons, between habitat types (mangroves and adjoining mudflats), and between mangrove species (Kandelia obovata and Avicennia marina). The main objectives in this study were to (1) determine seasonal variations in soil CH4 flux, (2) compare CH4 fluxes and soil parameters between the mangroves and adjoining mudflats, and (3) compare CH4 fluxes and soil parameters between the mangroves of Kandelia obovata and Avicennia marina.
2. Materials and Methods
2.1. Study Sites
The four study sites (Figure 1), from north to south, were (1) Xinfeng (XF) (24°54′ N, 120°58′ E), (2) Zhunan (ZN) (24°40′ N, 120°50′ E), (3) Budai (BD) (23°21′ N, 120°7′ E), and (4) Beimen (BM) (23°17′ N, 120°6′ E), where the climate is rainy and hot in summer and dry and mild in winter (Table 1). The dominant mangrove species were Kandelia obovata at XF and ZN (subtropical) and Avicennia marina at BD and BM (tropical). Both tree height and density were higher in the Kandelia mangroves than in the Avicennia mangroves (Table 1).
Tides were predominantly semidiurnal off the western coast of Taiwan, and the tidal range increased from the southwest (tropical) to the northwest (subtropical; Table 1). The immersion time during flood tides at the four sites averaged 11.5–13.5 h/day. The extended mudflats were wider in the Avicennia mangroves than in the Kadelia mangroves. As a result, the area ratios of mangroves to mudflats were higher in the Kadelia mangroves than in the Avicennia mangroves. The mangroves at XF were highly affected by excessive nutrient loading (PO43−: 1.30–72.30 µM and NO3−: 41.48–753.84 µM) as a consequence of urban sewage (Figure 1 and Table 1). The mangroves at BD were categorized into an important wetland reserve, which became a habitat for migratory birds and waterfowl. There were several shellfish farms distributed near the mangroves at BM.
2.2. Methane Flux Measurement
We determined CH4 fluxes and soil parameters for a complete seasonal cycle in February (winter), April (spring), July (summer), and October (fall) in 2019. An in situ closed-path chamber connected with an ultraportable greenhouse gas analyzer (LGR915-0001, Los Gatos Research, San Jose, CA, USA) was used to quantify the CH4 fluxes from the soils in mangrove ecosystems (mangroves and adjoining mudflats) at the four sites during emersion. Measurements of CH4 flux were carried out in 3–5 replicate (5 in most cases) mangrove and adjoining mudflat soil samples (5 in most cases) at each site in each season. The replicated sites for measurements were chosen randomly within the mangroves and mudflats to represent each habitat type. To avoid any potential disturbance, the distance between two replicated sites was at least 5 m. In the field, a semicircular transparent acrylic chamber with a stainless-steel ring (30 cm in diameter and 16 cm in height) connected with the gas analyzer through a polyvinyl chloride (PVC) tube was pushed into the soil to a depth of 10 cm. The chamber enclosed 10.6 L of air over a 0.071 m2 surface area. CH4 concentration exchanges between the soil and the atmosphere were monitored by the gas analyzer and recorded by a data logger with a 20 s logging frequency for 10 min. The CH4 fluxes were calculated by Equation (1).
where, F: CH4 fluxes (µmol CH4 m−2 day−1), S: slope of the linear regression line between CH4 concentrations (ppm) and recorded frequency (20 s), V: chamber volume (L), R: ideal gas constant = 0.082 (L atm K−1 mol−1), T: absolute temperature (K), A: the area of the bottom part of the chamber (m2), 180: time transformation constant = (1 h × (60 min/hour) × ((60 s/min)/20 s), and 24: 1 day = 24 h.
2.3. Soil and Water Sampling
After CH4 measurements at each site in each season, soil parameters in the top 10 cm layer were determined in 5 replicates in the mangroves and 2 replicates in the adjoining mudflats during emersion. Soil temperature and redox potential (ORP) were measured by a redox potential meter (ORP30, CLEAN L’eau, Taoyuan City, Taiwan), and soil pH was determined by a portable pH meter (WD-35634-40, OAKTON Instruments, Vernon Hills, IL, USA) in situ at the four sites during each field visit.
For soil bulk density and water and organic matter content, we collected soil samples by using stainless cores with a 7 cm diameter and 80 cm length. The top 10 cm of the soil core samples were then retrieved as subsamples by applying syringes 2.9 cm in diameter and 5 cm in length (syringe volume = 33.0 cm3). The subsamples were stored in 50 mL centrifuge tubes and placed with ice in a portable cooler for laboratory analysis. Each soil subsample was placed on a tin plate (W0) and weighed as W1. The sample with the tin plate was placed in an oven at 60 °C until a constant dry weight was attained (W2). The water content and bulk density were calculated by Equations (2) and (3), respectively [17].
Then, the subsample was placed in an oven at 450 °C for 4 h and weighed as W3 as the ash-dried weight. The organic matter content was obtained by Equation (4) [17].
Since the soil was too dry to measure the salinity in situ, another subsample was collected from the original core sample and placed in a sealed plastic bag for laboratory analysis. A syringe was used to extract the pore water from the subsample, and the salinity of the pore water was measured by a portable refractometer (Refractometer FG-201, Hangzhou Chincan Trading Co., Ltd., Hangzhou city, Zhejiang province, China).
At the high tide before CH4 measurements at each site in each season, water samples collected for nutrient analysis were filtered in the field through 0.45 µm cellulose nitrate membrane filters (GN-6 Metricel, PALL Corporation, Port Washington, NY, USA) and transported back to the laboratory on ice. At the laboratory, these samples were analyzed by a spectrophotometer (U-2001, Hitachi, Japan) for the concentrations of NO2− [22], NO3− [23], NH4+ [24], and PO43− [25].
2.4. Statistical Analyses
Based on the results of the Shapiro–Wilk test, the data of CH4 flux and soil parameters were not normally distributed (p-value < 0.05). Thus, the Kruskal–Wallis test was applied to evaluate seasonal variations in CH4 flux and soil parameters at each site. If the results indicated significance at the 0.05 probability level, the Tukey’s honestly significant difference (HSD) test and the Bonferroni correction for the significance level were used to determine which levels differed. The Wilcoxon rank-sum test was used to compare the differences in CH4 flux and soil parameters between (1) mangroves and adjoining mudflats, and (2) the mangroves of Kandelia obovata and Avicennia marina. Multiple regression analysis was implemented to identify the soil parameters that most affected CH4 flux in the mangroves. The statistically significant level was p < 0.05. The statistical tests in this study were carried out using R software (Version 3.6.1, https://www.r-project.org/) [26].
3. Results
3.1. CH4 Flux and Soil Parameters
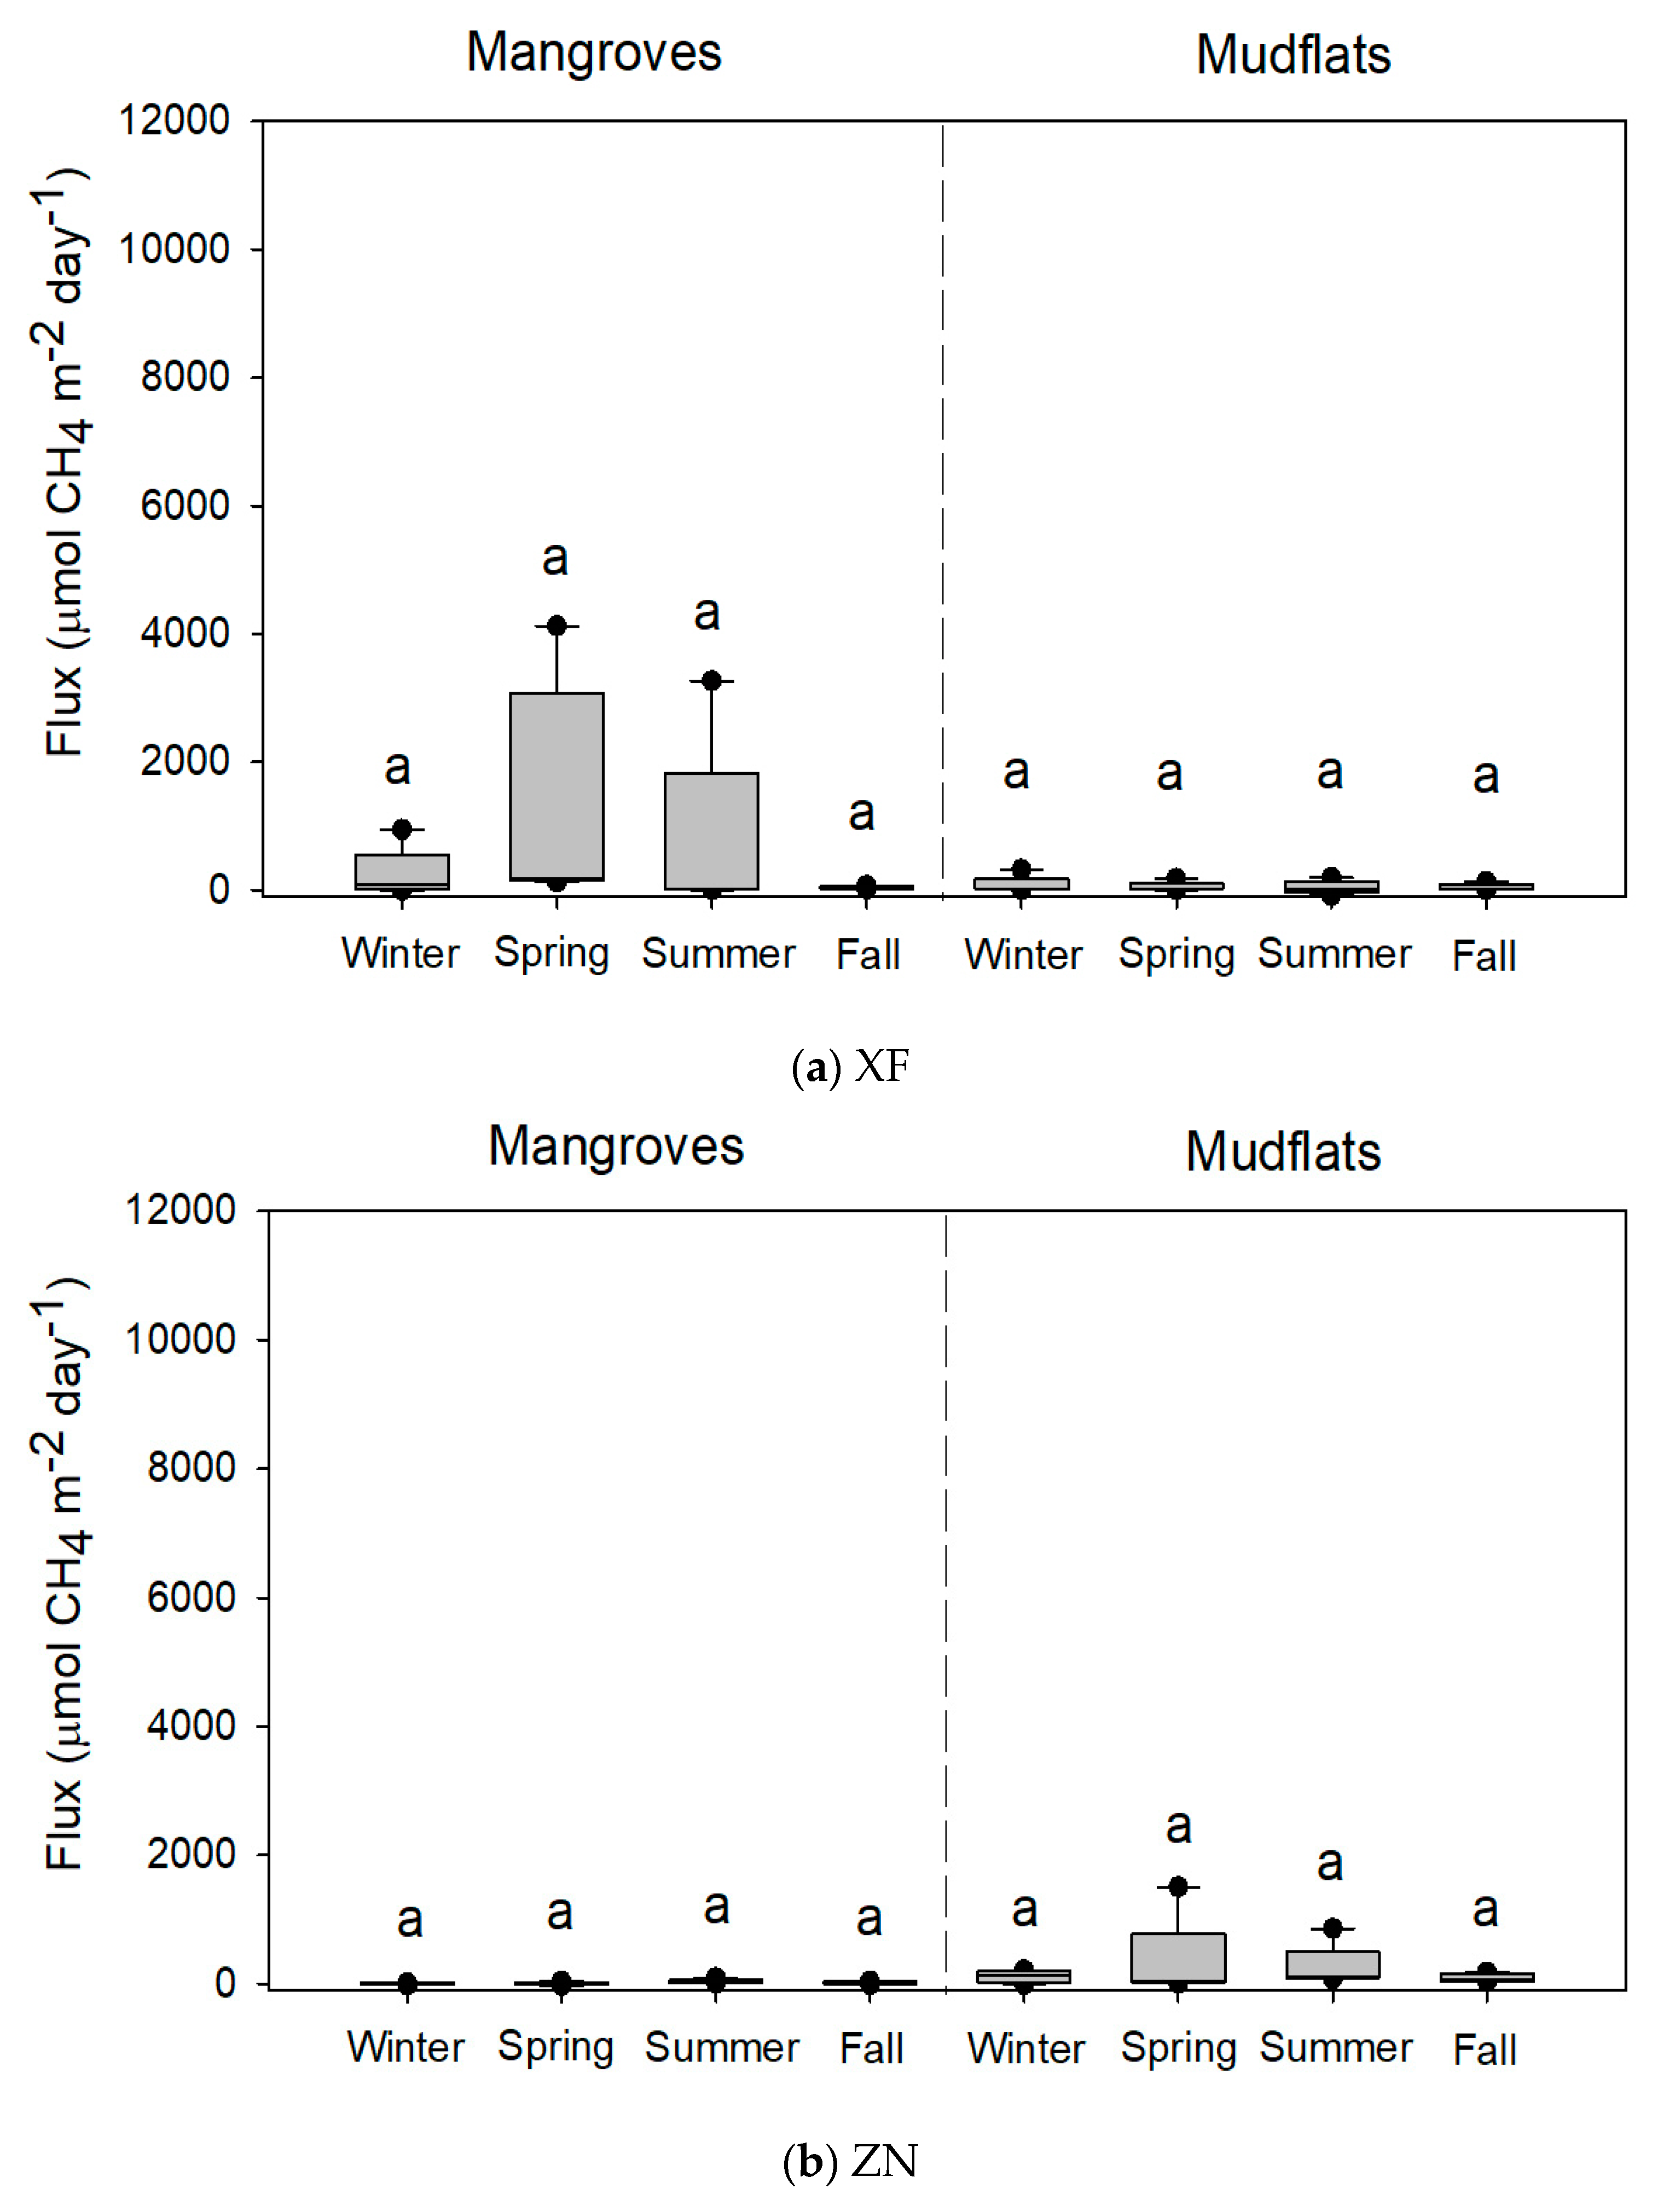
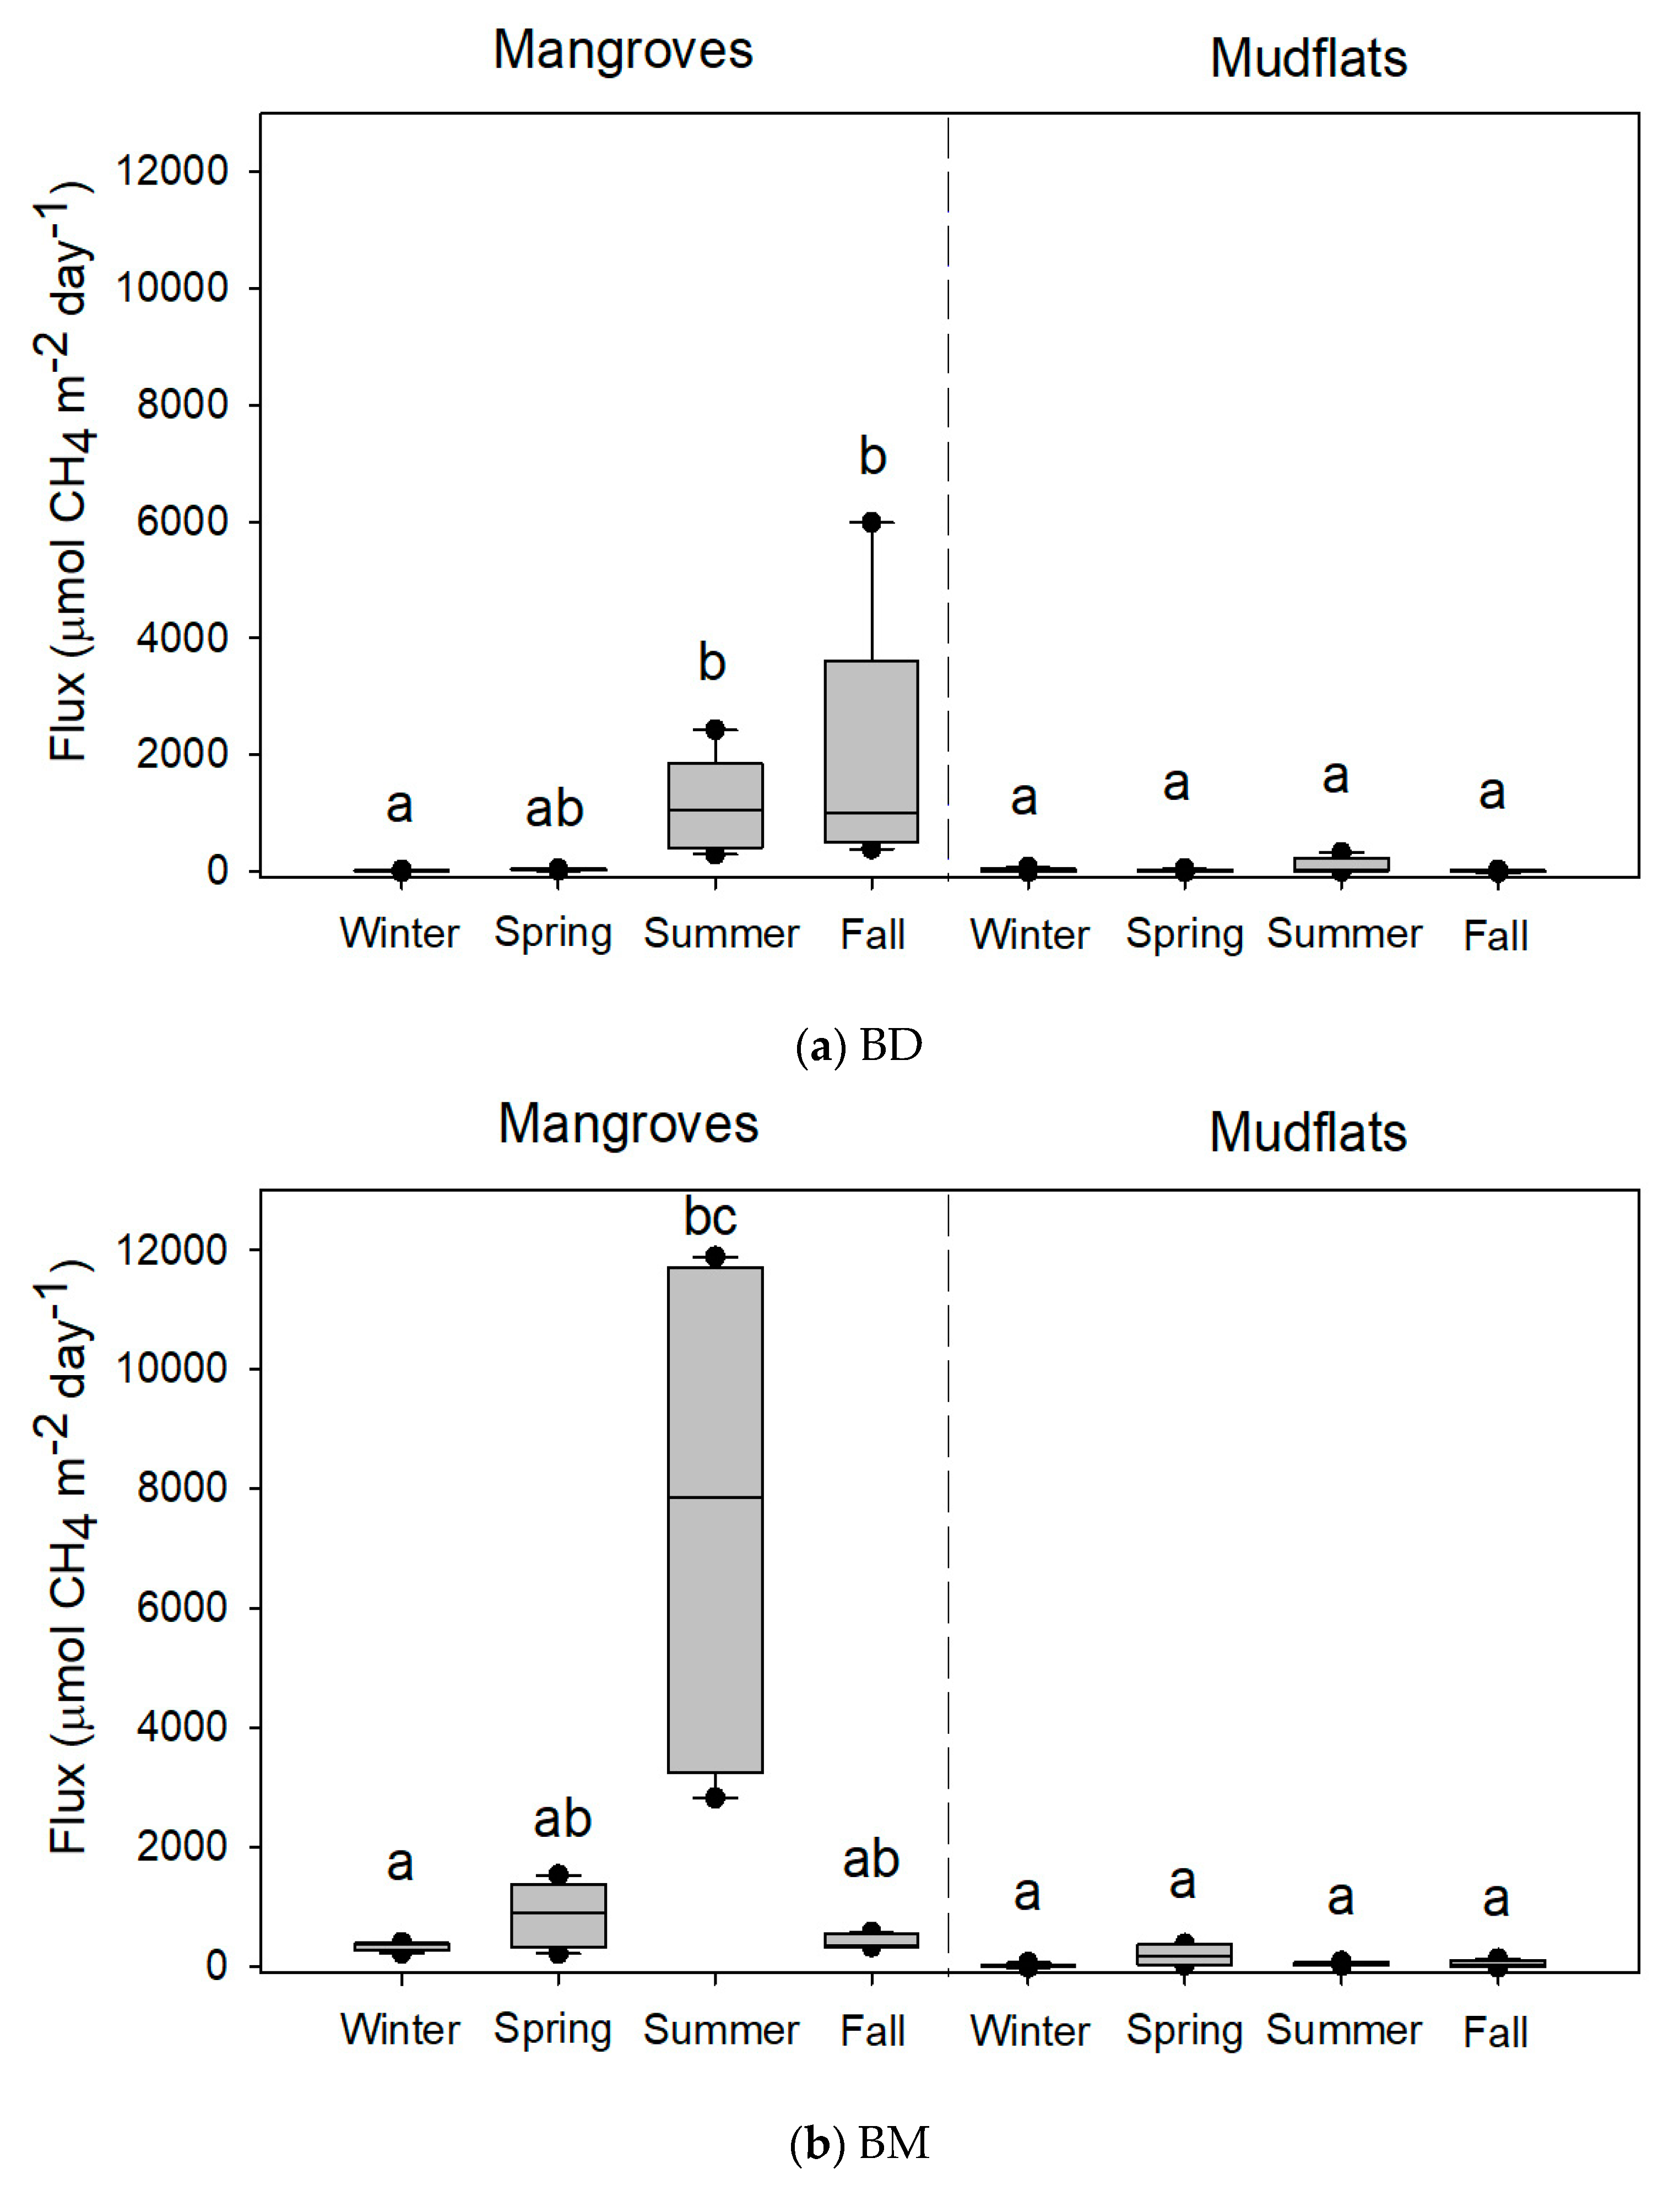
The variations in CH4 flux from the mangrove soils were high: 42.4–1326.6, 1.3–39.3, 10.1–1847.8, and 337.6–7606.6 µmol-CH4 m−2 day−1 at XF, ZN, BD, and BM, respectively (Table 2). There were no significant seasonal variations in CH4 flux from the soils of XF and ZN mangroves (Figure 2). However, CH4 fluxes from the soils of mangroves were significantly higher in summer than in winter at BD and BM (Figure 3). At XF, ZN, and BM, almost all soil parameters were significantly different among seasons (Table 2). At BD, however, there were no significant seasonal variations in many soil parameters.
CH4 fluxes from the soils of mudflats were 45.2–79.1, 93.9–334.5, 6.6–102.8, and 14.3–192.7 µmol-CH4 m−2 day−1 at XF, ZN, BD, and BM, respectively (Table 3). Seasonal variations in the CH4 flux and soil parameters in the mudflats were smaller than the variations in the mangroves at the four sites.
3.2. Comparisons of Methane Flux and Soil Parameters under Various Conditions
Soil CH4 fluxes were significantly higher in the mangroves than in the adjoining mudflats at XF, BD, and BM, but not at ZN (Figure 4). Many soil parameters differed between the mangroves and the mudflats at XF and BD (Table 4). Only soil ORP was significantly lower in the mudflats than in the mangroves at ZN. There were no significant differences in the soil parameters between the two habitats at BM.
CH4 fluxes were significantly higher in the soils of Avicennia mangroves than in the soils of Kandelia mangroves (Figure 5). ORP and bulk density were lower in the soils of Avicennia mangroves than in the soils of Kandelia mangroves (Table 5). However, pH, salinity, and water content were higher in the soils of Avicennia mangroves than in the soils of Kandelia mangroves. There was no significant difference in organic matter content between the soils of two mangrove species.
The results of multiple regressions indicate that water content (p-value = 0.030) and organic matter content (p-value = 0.038) significantly affected the CH4 fluxes in the soils of Kandelia mangroves. However, none of the soil parameters were detected to significantly influence the CH4 fluxes in the soils of Avicennia mangroves.
4. Discussion
A significant amount of CH4 was emitted from the studied mangrove soils, which indicates that mangrove soils might act as CH4 sources. Seasonal variations in CH4 flux and soil parameters were detected in the mangrove soils at BD and BM. Previous studies also reported a seasonal pattern in other mangrove soils [15,27,28]. The highest and lowest CH4 fluxes were observed in warm seasons (spring and summer) and in winter respectively, in this study and in other studies [13,14,29]. Previous findings stated that temperature was the main physical factor that affected the amount of CH4 emission [15,27,30,31]. However, the present study demonstrates that CH4 fluxes did not vary distinctly among seasons in the mangrove soils at XF and ZN or in the mudflats at the four studied sites. Since seasonal variations in the soil parameters were not detected in the mudflats, it can be expected that the variations in CH4 fluxes (6.6–334.5 µmol-CH4 m−2 day−1) from the mudflats were small when compared with those from the mangrove soils (Table 2 and Table 3).
In the present study, when comparing the CH4 fluxes from the mangrove soils with the adjoining mudflats, there were no clear patterns in the studied mangroves. Each mangrove might have its own characteristics. Since greenhouse gases from soils are produced during microbial processes and respiration, the soil parameters (temperature, redox potential, pH, salinity, density, water content, and organic matter content) related to microbial activities are essential [15,31,32,33,34]. At XF, although a lower ORP was found in the mudflats (mudflat: −62.0–62.5 mV, forest: 160.6–218.2 mV), organic matter content (mudflats: 3.2%–3.9%, mangroves: 3.9%–5.5%) was greater in the mangrove soils, which indicates that more organic compounds were decomposed and more CH4 was produced from the mangrove soils. Allen et al. [27] also found that the degradation of more organic matter contents induced a higher production of CH4. Furthermore, CH4 emissions might be inhibited by the higher salinity in the mudflats (mudflats: 1.7–3.4, mangroves: 0.4–1.2). Several studies demonstrated that higher salinity had an inhibitory effect on methanogenic bacterial activities [14,15,27,28,35,36].
At ZN, the higher ORP in the soils of mangroves under aerobic conditions (mudflat: −196.0–−19.0 mV, mangrove: −3.6–152.2 mV) might play a major role in affecting the CH4 fluxes in the mangroves. Previous studies have identified that redox potential has inverse effects on CH4 emissions [35,37]. At BD, the lower ORP (mudflats: −54.5 to 98.5 mV, mangroves: −340.8 to −274.4 mV) and bulk densities (mudflats: 1.4 to 2.8 g cm−3, mangroves: 0.5 to 1.1 g cm−3) and the higher water content (mudflats: 15.9% to 23.8%, mangroves: 37.8% to 58.0%) and organic matter (mudflats: 0.7% to 1.5%, mangroves: 5.3% to 8.4%) led to anaerobic conditions in the mangrove soils, and this then resulted in more CH4 emissions from the mangrove soils than from the mudflats. Nevertheless, in the present study, the key environmental factors influencing the differences in CH4 fluxes between the mangrove soils and the mudflats were not found at BM. It appeared that different mangrove tree species might affect CH4 emissions. Our results show that CH4 emissions were significantly higher in the mangrove soils of Avicennia than in the adjoining mudflats; this trend, however, was not necessarily recapitulated at Kandelia.
The results in the present study demonstrate that CH4 fluxes might be different for the same mangrove species. Since there were more anthropogenic activities at XF than at ZN, higher nutrients and more organic compounds were input from the upstream river to the Kandelia mangroves. As a result, a large amount of CH4 was emitted from the mangrove soils at XF. Previous findings also verified that anthropogenic activities caused a greater amount of nutrient input (total organic carbon, total nitrogen, and total phosphorus) that accumulated in mangrove soils; thus, there might be more organic matter that was taken up by microbial metabolism and produced more CH4 [13,31,38]. A previous study demonstrated that different mangrove species and related root structures affected greenhouse gases emission [14,27]. The pneumatophores of Avicennia marina might become a pathway that transported CH4 from deeper soils to the atmosphere [14,27,35,39]. In addition, Allen et al. [27] observed that the redox potential of Avicennia marina soils was negative, which led to the development of an anaerobic environment in the soils. The results of previous studies support our findings that the soils of Avicennia mangroves produced more CH4 than the soils of Kandelia mangroves. The results of multiple regression analyses show that water and organic matter content in the soils were the main factors regulating CH4 emissions from the Kandelia mangroves. In addition, since bulk density was related to water content in the soils, which might affect the redox potential, this suggests that soil conditions with lower bulk density presented higher water content. As a result, the water and organic matter content contributed significantly to the CH4 emissions in the Kandelia mangroves. However, the results of multiple regression analyses indicate that the assessed soil parameters did not influence the CH4 emissions significantly in the Avicennia mangroves. Since the pneumatophores can transport CH4 from anaerobic deep soils, it is likely that the pneumatophores of Avicennia marina played a more important role than soil parameters in affecting soil CH4 fluxes. Nevertheless, these results are inconsistent with other research which demonstrated that pneumatophores reduced CH4 emissions [40,41]. The role of pneumatophores and the mechanisms of transporting CH4 warrant further investigation.
When comparing this study with other mangrove studies, soil CH4 fluxes (Kandelia obovata: 0.9–884.4, Avicennia marina: 6.7–5071.1 µg m−2 h−1) in this study and other mangroves were comparable (Table 6). Thus, the CH4 fluxes in mangrove ecosystems cannot be neglected when constructing the carbon budgets and estimating the carbon storage capacity.
5. Conclusions
In this study, CH4 fluxes and soil properties of the top 10 cm layer were determined in subtropical (Kandelia obovata) and tropical (Avicennia marina) mangrove ecosystems of Taiwan for a complete seasonal cycle. CH4 emissions were observed in the studied mangrove soils, which indicates that mangrove soils might act as CH4 sources. This suggests that CH4 fluxes in mangrove ecosystems cannot be neglected when constructing the carbon budgets and estimating the carbon storage capacity. Our results also indicated that CH4 fluxes were significantly greater in summer than in winter from the Avicennia soils, but no seasonal variation was detected from the Kandelia soils. CH4 fluxes were significantly higher in the mangrove soils of Avicennia than in the adjoining mudflats; this trend, however, was not necessarily recapitulated at Kandelia. Multiple regression analyses demonstrated that water and organic matter content were the key factors regulating the CH4 fluxes from the Kandelia soils. However, the assessed soil parameters did not significantly influence the CH4 fluxes from the Avicennia soils. Since pneumatophores can transport CH4 from anaerobic deep soils, this study suggests that the pneumatophores of Avicennia marina played a more important role than soil properties in soil CH4 fluxes. Our results indicated that different mangrove tree species and related root structures may affect soil greenhouse gas emissions.
Author Contributions
Conceptualization, H.-J.L.; Data curation, C.-W.L., Y.-C.K., M.-C.C., H.-H.W., and C.-W.H.; Formal analysis, C.-W.L. and C.-W.H.; Funding acquisition, H.-J.L.; Investigation, C.-W.L., Y.-C.K., M.-C.C., H.-H.W., and C.-W.H.; Methodology, H.-J.L.; Project administration, H.-J.L.; Supervision, H.-J.L.; Validation, C.-W.H. and H.-J.L.; Writing, C.-W.L. and H.-J.L. All authors have read and agreed to the published version of the manuscript.
Funding
The study was granted by the Ministry of Science and Technology (MOST) of Taiwan (106-2621-M-005-005-MY3) and the “Innovation and Development Center of Sustainable Agriculture” from The Featured Areas Research Center Program within the Higher Education Sprout Project by the Ministry of Education (MOE) of Taiwan.
Acknowledgments
We are grateful for the support of the Ministry of Science and Technology (MOST) of Taiwan under grant no. 106-2621-M-005-005-MY3. This work was also financially supported in part by the “Innovation and Development Center of Sustainable Agriculture” from The Featured Areas Research Center Program within the Higher Education Sprout Project by the Ministry of Education (MOE) of Taiwan.
Conflicts of Interest
The authors declare no conflicts of interest.
References
- Lin, B.B.; Dushoff, J. Mangrove filtration of anthropogenic nutrients in the Rio Coco Solo, Panama. Manag. Environ. Qual. Int. J. 2004, 15, 131–142. [Google Scholar] [CrossRef]
- Vermaat, J.E.; Thampanya, U. Mangroves mitigate tsunami damage: A further response. Estuar. Coast. Shelf Sci. 2006, 69, 1–3. [Google Scholar] [CrossRef]
- Guannel, G.; Arkema, K.; Ruggiero, P.; Verutes, G. The power of three: Coral reefs, seagrasses and mangroves protect coastal regions and increase their resilience. PLoS ONE 2016, 11, e0158094. [Google Scholar] [CrossRef] [PubMed] [Green Version]
- Hochard, J.P.; Hamilton, S.; Barbier, E.B. Mangroves shelter coastal economic activity from cyclones. Proc. Natl. Acad. Sci. USA 2019, 116, 12232–12237. [Google Scholar] [CrossRef] [Green Version]
- Barbier, E.B. Valuing the environment as input: Review of applications to mangrove-fishery linkages. Ecol. Econ. 2000, 35, 47–61. [Google Scholar] [CrossRef]
- Diele, K.; Koch, V.; Saint-Paul, U. Population structure, catch composition and CPUE of the artisanally harvested mangrove crab Ucides cordatus (Ocypodidae) in the Caeté estuary, North Brazil: Indications for overfishing? Aquat. Living Resour. 2005, 18, 169–178. [Google Scholar] [CrossRef] [Green Version]
- Mumby, P.J.; Edwards, A.J.; Arias-González, J.E.; Lindeman, K.C.; Blackwell, P.G.; Gall, A.; Gorczynska, M.I.; Harborne, A.R.; Pescod, C.L.; Renken, H.; et al. Mangroves enhance the biomass of coral reef fish communities in the Caribbean. Nature 2004, 427, 533–536. [Google Scholar] [CrossRef] [Green Version]
- Donato, D.C.; Kauffman, J.B.; Murdiyarso, D.; Kurnianto, S.; Stidham, M.; Kanninen, M. Mangroves among the most carbon-rich forests in the tropics. Nat. Geosci. 2011, 4, 293–297. [Google Scholar] [CrossRef]
- Mcleod, E.; Chmura, G.L.; Bouillon, S.; Salm, R.; Björk, M.; Duarte, C.M.; Lovelock, C.E.; Schlesinger, W.H.; Silliman, B.R. A blueprint for blue carbon: Toward an improved understanding of the role of vegetated coastal habitats in sequestering CO2. Front. Ecol. Environ. 2011, 9, 552–560. [Google Scholar] [CrossRef] [Green Version]
- Serrano, O.; Lovelock, C.E.; Atwood, T.B.; Macreadie, P.I.; Canto, R.; Phinn, S.; Arias-Ortiz, A.; Bai, L.; Baldock, J.; Bedulli, C.; et al. Australian vegetated coastal ecosystems as global hotspots for climate change mitigation. Nat. Commun. 2019, 10, 1–10. [Google Scholar] [CrossRef]
- Li, C.; Mosier, A.; Wassmann, R.; Cai, Z.; Zheng, X.; Huang, Y.; Tsuruta, H.; Boonjawat, J.; Lantin, R. Modeling greenhouse gas emissions from rice-based production systems: Sensitivity and upscaling. Glob. Biogeochem. Cycles 2004, 18. [Google Scholar] [CrossRef]
- Alongi, D.M.; Wattayakorn, G.; Pfitzner, J.; Tirendi, F.; Zagorskis, I.; Brunskill, G.J.; Clough, B.F. Organic carbon accumulation and metabolic pathways in sediments of mangrove forests in southern Thailand. Mar. Geol. 2001, 179, 85–103. [Google Scholar] [CrossRef]
- Nóbrega, G.N.; Ferreira, T.O.; Neto, M.S.; Queiroz, H.M.; Artur, A.G.; Mendonça, E.D.S.; Silva, E.D.O.; Otero, X.L. Edaphic factors controlling summer (rainy season) greenhouse gas emissions (CO2 and CH4) from semiarid mangrove soils (NE-Brazil). Sci. Total Environ. 2016, 542, 685–693. [Google Scholar] [CrossRef] [PubMed] [Green Version]
- Allen, D.; Dalal, R.C.; Rennenberg, H.; Schmidt, S. Seasonal variation in nitrous oxide and methane emissions from subtropical estuary and coastal mangrove sediments, Australia. Plant Biol. 2011, 13, 126–133. [Google Scholar] [CrossRef] [PubMed]
- Chen, G.; Chen, B.; Yu, D.; Tam, N.F.; Ye, Y.; Chen, S. Soil greenhouse gas emissions reduce the contribution of mangrove plants to the atmospheric cooling effect. Environ. Res. Lett. 2016, 11, 124019. [Google Scholar] [CrossRef]
- Bouillon, S.; Borges, A.V.; Castañeda-Moya, E.; Diele, K.; Dittmar, T.; Duke, N.C.; Kristensen, E.; Lee, S.Y.; Marchand, C.; Middelburg, J.J.; et al. Mangrove production and carbon sinks: A revision of global budget estimates. Glob. Biogeochem. Cycles 2008, 22. [Google Scholar] [CrossRef] [Green Version]
- Li, S.B.; Chen, P.H.; Huang, J.S.; Hsueh, M.L.; Hsieh, L.Y.; Lee, C.L.; Lin, H.J. Factors regulating carbon sinks in mangrove ecosystems. Glob. Chang. Boil. 2018, 24, 4195–4210. [Google Scholar] [CrossRef]
- IPCC. Climate Change: The Physical Science Basis. In Contribution of Working Group I to the Fifth Assessment Report of the Intergovernmental Panel on Climate Change; Stocker, T.F., Qin, D., Plattner, G.K., Tignor, M., Allen, S.K., Boschung, J., Nauels, A., Xia, Y., Bex, V., Midgley, P.M., Eds.; Cambridge University Press: Cambridge, UK; New York, NY, USA, 2013; 1535p. [Google Scholar]
- Cameron, C.; Hutley, L.B.; Friess, D.A. Estimating the full greenhouse gas emissions offset potential and profile between rehabilitating and established mangroves. Sci. Total Environ. 2019, 665, 419–431. [Google Scholar] [CrossRef] [PubMed]
- Sasmito, S.D.; Taillardat, P.; Clendenning, J.N.; Cameron, C.; Friess, D.A.; Murdiyarso, D.; Hutley, L.B. Effect of land-use and land-cover change on mangrove blue carbon: A systematic review. Glob. Chang. Boil. 2019, 25, 4291–4302. [Google Scholar] [CrossRef]
- Faunce, C.H.; Layman, C.A. Sources of variation that affect perceived nursery function of mangroves. In Nagelkerken I (ed) Ecological Connectivity Among Tropical Coastal Ecosystems; Media, B.V., Ed.; Springer: New York, NY, USA, 2009; pp. 401–421. [Google Scholar]
- Pai, S.C.; Yang, C.C.; Riley, J.P. Formation kinetics of the pink azo dye in the determination of nitrite in natural waters. Anal. Chim. Acta 1990, 232, 345–349. [Google Scholar] [CrossRef]
- Jenkins, D.; Medsker, L.L. Brucine Method for the Determination of Nitrate in Ocean, Estuarine, and Fresh Waters. Anal. Chem. 1964, 36, 610–612. [Google Scholar] [CrossRef]
- Pai, S.C.; Tsau, Y.J.; Yang, T.I. pH and buffering capacity problems involved in the determination of ammonia in saline water using the indophenol blue spectrophotometric method. Anal. Chim. Acta 2001, 434, 209–216. [Google Scholar] [CrossRef]
- Murphy, J.A.M.E.S.; Riley, J.P. A modified single solution method for the determination of phosphate in natural waters. Anal. Chim. Acta 1962, 27, 31–36. [Google Scholar] [CrossRef]
- R Core Team. R: A Language and Environment for Statistical Computing. Available online: http://www.R-project.org (accessed on 11 February 2020).
- Allen, D.E.; Dalal, R.C.; Rennenberg, H.; Meyer, R.L.; Reeves, S.; Schmidt, S. Spatial and temporal variation of nitrous oxide and methane flux between subtropical mangrove sediments and the atmosphere. Soil Biol. Biochem. 2007, 39, 622–631. [Google Scholar] [CrossRef]
- Chauhan, R.; Datta, A.; Ramanathan, A.L.; Adhya, T.K. Factors influencing spatio-temporal variation of methane and nitrous oxide emission from a tropical mangrove of eastern coast of India. Atmos. Environ. 2015, 107, 95–106. [Google Scholar] [CrossRef]
- Chen, G.C.; Nora, F.Y.; Tamb, Y.Y. Spatial and seasonal variations of atmospheric N2O and CO2 fluxes from a subtropical mangrove swamp and their relationships with soil characteristics. Soil Biol. Biochem. 2012, 48, 175–181. [Google Scholar] [CrossRef]
- Purvaja, R.; Ramesh, R. Natural and anthropogenic methane emission from coastal wetlands of South India. Environ. Manag. 2001, 27, 547–555. [Google Scholar] [CrossRef]
- Chen, G.C.; Tam, N.F.Y.; Ye, Y. Summer fluxes of atmospheric greenhouse gases N2O, CH4 and CO2 from mangrove soil in South China. Sci. Total Environ. 2010, 408, 2761–2767. [Google Scholar] [CrossRef]
- Kreuzwieser, J.; Buchholz, J.; Rennenberg, H. Emission of methane and nitrous oxide by Australian mangrove ecosystems. Plant Biol. 2003, 5, 423–431. [Google Scholar] [CrossRef]
- Lekphet, S.; Nitisoravut, S.; Adsavakulchai, S. Estimating methane emissions from mangrove area in Ranong Province, Thailand. Songklanakarin J. Sci. Technol. 2005, 27, 153–163. [Google Scholar]
- Huang, B.; Yu, K.; Gambrell, R.P. Effects of ferric iron reduction and regeneration on nitrous oxide and methane emissions in a rice soil. Chemosphere 2009, 74, 481–486. [Google Scholar] [CrossRef] [PubMed]
- Livesley, S.J.; Andrusiak, S.M. Temperate mangrove and salt marsh sediments are a small methane and nitrous oxide source but important carbon store. Estuar. Coast. Shelf Sci. 2012, 97, 19–27. [Google Scholar] [CrossRef]
- Rosentreter, J.A.; Maher, D.T.; Erler, D.V.; Murray, R.; Eyre, B.D. Factors controlling seasonal CO2 and CH4 emissions in three tropical mangrove-dominated estuaries in Australia. Estuar. Coast. Shelf Sci. 2018, 215, 69–82. [Google Scholar] [CrossRef]
- Yu, K.; Faulkner, S.P.; Patrick, W.H., Jr. Redox potential characterization and soil greenhouse gas concentration across a hydrological gradient in a Gulf coast forest. Chemosphere 2006, 62, 905–914. [Google Scholar] [CrossRef]
- Kristensen, E.; Bouillon, S.; Dittmar, T.; Marchand, C. Organic carbon dynamics in mangrove ecosystems: A review. Aquat. Bot. 2008, 89, 201–219. [Google Scholar] [CrossRef] [Green Version]
- Krithika, K.; Purvaja, R.; Ramesh, R. Fluxes of methane and nitrous oxide from an Indian mangrove. Curr. Sci. 2008, 94, 218–224. [Google Scholar]
- Kristensen, E.; Flindt, M.R.; Ulomi, S.; Borges, A.V.; Abril, G.; Bouillon, S. Emission of CO2 and CH4 to the atmosphere by sediments and open waters in two Tanzanian mangrove forests. Mar. Ecol. Prog. Ser. 2008, 370, 53–67. [Google Scholar] [CrossRef] [Green Version]
- He, Y.; Guan, W.; Xue, D.; Liu, L.; Peng, C.; Liao, B.; Hu, J.; Yang, Y.; Wang, X.; Zhou, G. Comparison of methane emissions among invasive and native mangrove species in Dongzhaigang, Hainan Island. Sci. Total Environ. 2019, 697, 133945. [Google Scholar] [CrossRef]
- Chen, G.C.; Ulumuddin, Y.I.; Chen, S.Y.; Chen, B.; Ye, Y.; Ou, D.Y.; Ma, Z.Y.; Huang, H.; Wang, J.K. Rich soil carbon and nitrogen but low atmospheric greenhouse gas fluxes from North Sulawesi mangrove swamps in Indonesia. Sci. Total Environ. 2014, 487, 91–96. [Google Scholar] [CrossRef]
Figure 1.
Map of studied mangrove sites at Xinfeng (XF), Zhunan (ZN), Budai (BD), and Beimen (BM) in Taiwan. The urban areas near XF (15,991 ha) and ZN (3807 ha) are shown by the white polygons. Non-urban area was observed near BD or BM. (Map sources: Left: QGIS 2.18.14; Right: Google Earth).
Figure 1.
Map of studied mangrove sites at Xinfeng (XF), Zhunan (ZN), Budai (BD), and Beimen (BM) in Taiwan. The urban areas near XF (15,991 ha) and ZN (3807 ha) are shown by the white polygons. Non-urban area was observed near BD or BM. (Map sources: Left: QGIS 2.18.14; Right: Google Earth).

Figure 2.
Methane fluxes (n = 5) from the soils of mangroves of Kandelia obovata and adjoining mudflats at (a) Xinfeng (XF) and (b) Zhunan (ZN). Same letters indicate no significant seasonal differences with the Kruskal–Wallis test and Tukey’s honestly significant difference (HSD) test and the Bonferroni correction for the significance level in mangroves and mudflats, respectively.

Figure 3.
Methane fluxes (n = 5 except at BM, where n = 4 in the summer of mangroves and n = 3 in the spring of mudflats) from the soils of mangroves of Avicennia marina and adjoining mudflats at (a) Budai (BD) and (b) Beimen (BM). Different letters indicate significant seasonal differences with the Kruskal-Wallis test and Tukey’s honestly significant difference (HSD) test and the Bonferroni correction for the significance level in mangroves and mudflats, respectively.

Figure 4.
Comparisons of methane fluxes between mangroves and adjoining mudflats at (a) Xinfeng (XF), (b) Zhunan (ZN), (c) Budai (BD), and (d) Beimen (BM). Different letters indicate a significant difference (p < 0.05) with the Wilcoxon rank-sum test.
Figure 4.
Comparisons of methane fluxes between mangroves and adjoining mudflats at (a) Xinfeng (XF), (b) Zhunan (ZN), (c) Budai (BD), and (d) Beimen (BM). Different letters indicate a significant difference (p < 0.05) with the Wilcoxon rank-sum test.

Figure 5.
Comparison of methane fluxes between the mangroves of Kandelia obovata and Avicennia marina. Different letters indicate a significant difference (p = 1.25 × 10⁻⁵) with the Wilcoxon rank-sum test.
Figure 5.
Comparison of methane fluxes between the mangroves of Kandelia obovata and Avicennia marina. Different letters indicate a significant difference (p = 1.25 × 10⁻⁵) with the Wilcoxon rank-sum test.


Table 1.
Meteorological conditions, mangrove features, soil texture, and water nutrient concentrations at the four mangrove sites: Xinfeng (XF), Zhunan (ZN), Budai (BD), and Beimen (BM).
Table 1.
Meteorological conditions, mangrove features, soil texture, and water nutrient concentrations at the four mangrove sites: Xinfeng (XF), Zhunan (ZN), Budai (BD), and Beimen (BM).
| Site | XF | ZN | BD | BM | |
|---|---|---|---|---|---|
| Monthly rainfall (mm) | February (Winter) | 41 | 30.5 | 9.5 | 9.5 |
| April (Spring) | 185 | 169.5 | 78 | 72 | |
| July (Summer) | 47 | 67.5 | 334 | 545 | |
| October (Fall) | 9 | 17 | 0 | 0 | |
| Mean temperature (°C) | February (Winter) | 16.3 | 17.1 | 20.2 | 20.3 |
| April (Spring) | 22.1 | 23.1 | 24.6 | 24.5 | |
| July (Summer) | 28.6 | 29.4 | 28.8 | 28.6 | |
| October (Fall) | 23.7 | 24.8 | 25.6 | 25.6 | |
| Mean tidal range (cm) | 366 | 388 | 181 | 136 | |
| Mean immersion time during flood tides (hours/day) | 11.5 | 12.0 | 11.3 | 13.5 | |
| Major mangrove species | Kandelia obovata | Kandelia obovata | Avicennia marina | Avicennia marina | |
| Presence of pneumatophores | No | No | Yes | Yes | |
| Mangrove classification (Faunce and Layman [21]) | High tide fringe mangroves | Low tide riverine mangroves | Riverine mangroves | High tide fringe mangroves | |
| Total area of mangrove forests and mudflats (ha) | 9.37 | 19.59 | 30.2 | 5.48 | |
| Area ratio of mangroves to mudflats | 7.37 | 2.85 | 1.27 | 0.37 | |
| Width of extended mudflats (m) | 13–20 | 7–10 | 25–70 | 60–90 | |
| Mean tree height (m) | 5.1 | 5.0 | 4.0 | 3.2 | |
| Mean tree density (trees m−1) | 2.4 | 1.9 | 0.9 | 0.6 | |
| Mean diameter at breast height (DBH) (cm) | 5.6 | 5.9 | 5.4 | 6.2 | |
| Soil texture | Fine sand | Very fine sand | Fine sand | Very fine sand | |
| PO43− (µM) | Range | 1.30–72.30 | 2.89–18.30 | 0.91–5.23 | 1.46–6.93 |
| Mean ± standard error | 29.94 ± 5.28 | 8.33 ± 1.16 | 3.07 ± 0.30 | 3.40 ± 0.39 | |
| NO3− (µM) | Range | 41.48–753.84 | 2.64–17.09 | 0.07–8.97 | 3.24–22.85 |
| Mean ± standard error | 300.24 ± 43.51 | 8.20 ± 1.04 | 4.18 ± 0.57 | 11.39 ± 1.07 | |
| NO2− (µM) | Range | 5.57–97.82 | 0.66–35.22 | 0.12–2.09 | 1.99–6.79 |
| Mean ± standard error | 30.06 ± 6.10 | 13.92 ± 2.28 | 0.74 ± 0.14 | 3.74 ± 0.27 | |
| NH4+ (µM) | Range | 26.10–100.84 | 93.21–203.75 | 2.42–17.66 | 10.62–38.99 |
| Mean ± standard error | 56.08 ± 4.81 | 129.94 ± 6.12 | 8.59 ± 0.87 | 24.16 ± 1.76 | |
Table 2.
Seasonal variations in methane fluxes and soil physiochemical parameters (Mean ± standard error) of the four mangrove sites. Different letters indicate significant seasonal differences with the Kruskal–Wallis test and Tukey’s honestly significant difference (HSD) test and the Bonferroni correction for the significance level for each mangrove site. ORP: redox potential.
| Site | Season | Methane Fluxes | Temperature | ORP | pH | Salinity | Bulk Density | Water Content | Organic Matter |
|---|---|---|---|---|---|---|---|---|---|
| (µmol-CH4 m−2 day−1) | (°C) | (mV) | (g cm−3) | (%) | (%) | ||||
| XF | Winter | 241.6 ± 178.1 a | 17.5 ± 0.3 a | 218.2 ± 16.2 a | 6.4 ± 0.1 a | 0.4 ± 0.1 a | 1.5 ± 0.0 b | 25.9 ± 1.5 ab | 3.9 ± 0.5 a |
| Spring | 1326.6 ± 786.9 a | 20.5 ± 0.1 ab | 171.6 ± 9.5 a | 6.2 ± 0.0 a | 0.9 ± 0.1 ab | 1.0 ± 0.0 a | 32.9 ± 1.5 b | 5.2 ± 0.4 a | |
| Summer | 742.5 ± 635.3 a | 28.6 ± 0.2 c | 160.6 ± 22.9 a | 6.4 ± 0.1 a | 0.9 ± 0.1 ab | 1.0 ± 0.1 a | 34.4 ± 1.4 b | 5.5 ± 0.4 a | |
| Fall | 42.4 ± 9.1 a | 25.1 ± 0.5 bc | 183.6 ± 9.9 a | 6.2 ± 0.1 a | 1.2 ± 0.1 b | 1.2 ± 0.0 ab | 22.7 ± 1.2 a | 5.5 ± 1.0 a | |
| ZN | Winter | 1.3 ± 3.4 a | 17.4 ± 0.1 a | 139.2 ± 29.8 ab | 6.6 ± 0.1 ab | 2.4 ± 0.3 a | 1.6 ± 0.0 b | 23.7 ± 1.0 ab | 4.1 ± 0.4 a |
| Spring | 10.0 ± 9.5 a | 22.8 ± 0.4 ab | 152.2 ± 2.7 b | 6.6 ± 0.1 ab | 2.2 ± 0.2 a | 1.2 ± 0.0 a | 31.1 ± 0.8 b | 4.0 ± 0.2 a | |
| Summer | 39.3 ± 13.3 a | 27.5 ± 0.1 c | −3.6 ± 20.5 a | 6.4 ± 0.1 a | 3.1 ± 0.3 a | 1.3 ± 0.0 a | 29.2 ± 0.9 b | 3.8 ± 0.2 a | |
| Fall | 14.5 ± 9.3 a | 25.7 ± 0.5 bc | 133.6 ± 10.6 ab | 7.0 ± 0.1 b | 3.1 ± 0.2 a | 1.4 ± 0.0 ab | 19.7 ± 0.6 a | 4.3 ± 0.4 a | |
| BD | Winter | 10.1 ± 5.5 a | 23.0 ± 0.0 a | −274.4 ± 28.0 a | 7.1 ± 0.1 b | 2.9 ± 0.1 ab | 1.1 ± 0.2 b | 43.5 ± 7.5 a | 5.3 ± 1.1 a |
| Spring | 32.0 ± 5.9 ab | 27.9 ± 0.2 bc | −285.0 ± 9.2 a | 6.7 ± 0.0 ab | 4.5 ± 0.3 c | 1.1 ± 0.1 b | 58.0 ± 2.1 a | 7.2 ± 0.4 a | |
| Summer | 1116.6 ± 372.3 b | 30.5 ± 0.4 c | −340.8 ± 13.9 a | 6.6 ± 0.1 ab | 2.5 ± 0.3 a | 0.5 ± 0.1 a | 57.6 ± 2.3 a | 8.4 ± 0.9 a | |
| Fall | 1847.8 ± 1045.4 b | 24.5 ± 0.1 ab | −290.2 ± 24.0 a | 6.6 ± 0.2 a | 3.8 ± 0.2 abc | 0.8 ± 0.1 ab | 37.8 ± 5.5 a | 6.5 ± 0.5 a | |
| BM | Winter | 337.6 ± 31.7 a | 20.1 ± 0.3 a | 33.0 ± 37.4 a | 6.7 ± 0.0 a | 3.6 ± 0.4 ab | 1.3 ± 0.0 ab | 25.5 ± 3.6 a | 4.3 ± 0.4 b |
| Spring | 865.0 ± 244.5 ab | 27.6 ± 0.2 bc | −8.4 ± 10.8 a | 6.7 ± 0.1 a | 5.6 ± 0.8 b | 2.2 ± 0.0 b | 30.8 ± 1.2 a | 2.6 ± 0.2 a | |
| Summer | 7606.6 ± 2304.8 bc | 30.1 ± 0.4 c | −151.4 ± 54.1 a | 7.0 ± 0.1 a | 3.1 ± 0.1 a | 1.0 ± 0.0 a | 38.2 ± 2.7 a | 3.5 ± 0.2 ab | |
| Fall | 424.7 ± 54.5 ab | 23.7 ± 0.2 ab | −148.0 ± 50.3 a | 6.6 ± 0.1 a | 4.2 ± 0.4 ab | 1.2 ± 0.1 ab | 29.5 ± 3.8 a | 3.3 ± 0.2 ab |
Table 3.
Seasonal variations in methane fluxes and soil physiochemical parameters (Mean ± standard error) of the four adjoining mudflats. No significant seasonal difference was detected for all variables at each mudflat site with the Kruskal–Wallis test and Tukey’s honestly significant difference (HSD) test and the Bonferroni correction for the significance level. ORP: redox potential.
| Site | Season | Methane Fluxes | Temperature | ORP | pH | Salinity | Bulk Density | Water Content | Organic Matter |
|---|---|---|---|---|---|---|---|---|---|
| (µmol-CH4 m−2 day−1) | (°C) | (mV) | (g cm−3) | (%) | (%) | ||||
| XF | Winter | 79.1 ± 61.6 | 17.5 ± 0.4 | −15.5 ± 30.5 | 7.1 ± 0.2 | 1.7 ± 0.0 | 1.1 ± 0.0 | 39.9 ± 0.4 | 3.2 ± 0.0 |
| Spring | 56.3 ± 32.1 | 24.7 ± 0.9 | −62.0 ± 36.0 | 6.6 ± 0.0 | 2.9 ± 0.2 | 1.0 ± 0.0 | 36.5 ± 2.1 | 3.9 ± 0.1 | |
| Summer | 45.2 ± 46.7 | 28.6 ± 0.1 | 62.5 ± 86.5 | 6.9 ± 0.1 | 1.8 ± 0.0 | 1.1 ± 0.0 | 37.8 ± 0.9 | 3.8 ± 0.1 | |
| Fall | 48.9 ± 22.4 | 24.5 ± 0.1 | 47.5 ± 15.5 | 7.4 ± 0.2 | 3.4 ± 0.3 | 1.1 ± 0.1 | 31.9 ± 1.0 | 3.7 ± 0.4 | |
| ZN | Winter | 113.5 ± 40.8 | 20.2 ± 0.0 | −19.0 ± 64.0 | 7.0 ± 0.1 | 1.7 ± 0.0 | 1.3 ± 0.1 | 33.2 ± 1.8 | 3.6 ± 0.3 |
| Spring | 334.5 ± 293.2 | 21.6 ± 0.4 | −31.5 ± 45.5 | 6.8 ± 0.1 | 3.7 ± 0.9 | 1.1 ± 0.0 | 34.5 ± 0.1 | 3.6 ± 0.0 | |
| Summer | 257.9 ± 150.8 | 27.9 ± 0.0 | −196.0 ± 4.0 | 7.2 ± 0.0 | 1.7 ± 0.0 | 1.1 ± 0.0 | 36.2 ± 1.9 | 3.4 ± 0.1 | |
| Fall | 93.9 ± 29.1 | 26.3 ± 0.1 | −54.5 ± 1.5 | 7.3 ± 0.1 | 3.3 ± 0.1 | 1.1 ± 0.0 | 30.8 ± 0.6 | 4.4 ± 0.2 | |
| BD | Winter | 17.0 ± 14.0 | 24.7 ± 0.1 | −54.5 ± 15.5 | 7.5 ± 0.1 | 1.9 ± 0.0 | 1.8 ± 0.0 | 18.8 ± 0.3 | 0.7 ± 0.1 |
| Spring | 11.3 ± 10.5 | 29.5 ± 0.1 | 98.5 ± 5.5 | 6.9 ± 0.3 | 4.8 ± 0.0 | 2.8 ± 0.0 | 21.2 ± 0.2 | 0.8 ± 0.1 | |
| Summer | 102.8 ± 61.6 | 34.4 ± 1.7 | −20.0 ± 30.0 | 7.3 ± 0.1 | 1.7 ± 0.0 | 1.4 ± 0.0 | 23.8 ± 2.1 | 1.5 ± 0.1 | |
| Fall | 6.6 ± 7.4 | 22.6 ± 0.1 | −51.0 ± 27.0 | 7.3 ± 0.3 | 2.3 ± 0.0 | 1.5 ± 0.1 | 15.9 ± 0.2 | 0.8 ± 0.1 | |
| BM | Winter | 14.3 ± 13.5 | 21.8 ± 0.2 | −40.0 ± 7.0 | 7.0 ± 0.1 | 4.3 ± 0.2 | 1.0 ± 0.1 | 41.1 ± 2.5 | 4.8 ± 0.2 |
| Spring | 192.7 ± 102.2 | 28.0 ± 0.1 | −281.0 ± 3.0 | 6.8 ± 0.0 | 7.5 ± 0.5 | 2.1 ± 0.1 | 32.4 ± 0.1 | 1.7 ± 0.0 | |
| Summer | 37.4 ± 12.1 | 30.3 ± 0.6 | −73.5 ± 222.5 | 7.3 ± 0.1 | 1.7 ± 0.1 | 1.3 ± 0.0 | 25.3 ± 1.6 | 1.6 ± 0.0 | |
| Fall | 49.0 ± 25.7 | 24.9 ± 0.2 | 22.0 ± 13.0 | 7.1 ± 0.1 | 3.0 ± 0.5 | 1.4 ± 0.1 | 27.4 ± 0.3 | 2.1 ± 0.2 |
Table 4.
Comparisons of methane fluxes and soil parameters between mangroves and adjoining mudflats at the four sites with the Wilcoxon rank-sum test (a significant difference at p < 0.05; n.s. = no significance). ORP: redox potential.
Table 4.
Comparisons of methane fluxes and soil parameters between mangroves and adjoining mudflats at the four sites with the Wilcoxon rank-sum test (a significant difference at p < 0.05; n.s. = no significance). ORP: redox potential.
| Parameters | XF | ZN | ||
| p-Value | Note | p-Value | Note | |
| CH4 flux | 3.15 × 10⁻² | Mangrove > Mudflat | 1.25 × 10⁻⁵ | Mangrove < Mudflat |
| Temperature | 1.00 | n.s. | 0.89 | n.s. |
| ORP | 3.04 × 10⁻² | Mangrove > Mudflat | 3.04 × 10⁻² | Mangrove > Mudflat |
| pH | 2.84 × 10⁻² | Mangrove < Mudflat | 0.08 | n.s. |
| Salinity | 2.94 × 10⁻² | Mangrove < Mudflat | 1.00 | n.s. |
| Bulk density | 0.88 | n.s. | 0.07 | n.s. |
| Water content | 0.11 | n.s. | 0.06 | n.s. |
| Organic matter content | 4.08 × 10⁻² | Mangrove > Mudflat | 0.31 | n.s. |
| Parameters | BD | BM | ||
| p-Value | Note | p-Value | Note | |
| CH4 flux | 1.01 × 10⁻³ | Mangrove > Mudflat | 6.76 × 10⁻⁷ | Mangrove > Mudflat |
| Temperature | 0.89 | n.s. | 0.67 | n.s. |
| ORP | 3.04 × 10⁻² | Mangrove < Mudflat | 0.89 | n.s. |
| pH | 0.06 | n.s. | 0.08 | n.s. |
| Salinity | 0.31 | n.s. | 0.89 | n.s. |
| Bulk density | 2.94 × 10⁻² | Mangrove < Mudflat | 0.88 | n.s. |
| Water content | 3.04 × 10⁻² | Mangrove > Mudflat | 1 | n.s. |
| Organic matter content | 2.94 × 10⁻² | Mangrove > Mudflat | 0.31 | n.s. |
Table 5.
Comparisons of methane fluxes between the mangroves of Kandelia obovata and Avicennia marina with the Wilcoxon rank-sum test (a significant difference at p < 0.05; n.s. = no significance). ORP: redox potential.
Table 5.
Comparisons of methane fluxes between the mangroves of Kandelia obovata and Avicennia marina with the Wilcoxon rank-sum test (a significant difference at p < 0.05; n.s. = no significance). ORP: redox potential.
| Parameters | p-Value | Note |
|---|---|---|
| CH4 flux | 1.56 × 10⁻⁵ | K < A |
| Temperature | 4.94 × 10⁻³ | K < A |
| ORP | 4.14 × 10⁻¹³ | K > A |
| pH | 9.33 × 10⁻⁶ | K < A |
| Salinity | 1.61 × 10⁻⁹ | K < A |
| Bulk density | 1.17 × 10⁻² | K > A |
| Water content | 1.81 × 10⁻⁵ | K < A |
| Organic matter content | 0.84 | n.s. |
Table 6.
Comparisons of soil CH4 flux in the mangroves of this study and other studies.
| Site | Climate | Dominant Mangrove Species | CH4 Fluxes (μg m−2 h−1) | References |
|---|---|---|---|---|
| XF and ZN | Subtropical | Kandelia obovata | 0.9–884.4 | This study |
| BD and BM | Tropical | Avicennia marina | 6.7–5071.1 | |
| North Sulawesi, Indonesia | Equatorial | Rhizophora apiculate and Bruguiera gymnorrhiza | 0–210.24 | [42] |
| Dar es Salaam, Tanzania | Humid tropical | Sonneratia alba, Avicenniamarina, Ceriops tagal, Rhizophora mucronata | 7–233 | [40] |
| Ceará state, NE-Brazil | Tropical | Rhizophora spp. | 0.7–8.8 | [13] |
| Odisha state, India | Tropical | Avicennia spp. | 80–2300 | [28] |
| Queensland, Australia | Tropical | NA | 26.7–698 | [36] |
| Shenzhen, China | Subtropical monsoonal | Kandelia obovata | 190.6–4390.9 | [31] |
| Moreton Bay, Australia | Subtropical | Avicennia marina | 20–350 | [32] |
| Chelmer, Australia | Subtropical | Avicennia marina | 3.0–17,370.0 | [27] |
| Southeast Queensland, Australia | Subtropical | Avicennia spp. | 47–1570 | [14] |
Note: Table was adapted from Nóbrega et al. [13].
© 2020 by the authors. Licensee MDPI, Basel, Switzerland. This article is an open access article distributed under the terms and conditions of the Creative Commons Attribution (CC BY) license (http://creativecommons.org/licenses/by/4.0/).
Share and Cite
MDPI and ACS Style
Lin, C.-W.; Kao, Y.-C.; Chou, M.-C.; Wu, H.-H.; Ho, C.-W.; Lin, H.-J. Methane Emissions from Subtropical and Tropical Mangrove Ecosystems in Taiwan. Forests 2020, 11, 470. https://doi.org/10.3390/f11040470
AMA Style
Lin C-W, Kao Y-C, Chou M-C, Wu H-H, Ho C-W, Lin H-J. Methane Emissions from Subtropical and Tropical Mangrove Ecosystems in Taiwan. Forests. 2020; 11(4):470. https://doi.org/10.3390/f11040470
Chicago/Turabian StyleLin, Chiao-Wen, Yu-Chen Kao, Meng-Chun Chou, Hsin-Hsun Wu, Chuan-Wen Ho, and Hsing-Juh Lin. 2020. "Methane Emissions from Subtropical and Tropical Mangrove Ecosystems in Taiwan" Forests 11, no. 4: 470. https://doi.org/10.3390/f11040470
Note that from the first issue of 2016, this journal uses article numbers instead of page numbers. See further details here.