
The Contribution of Trees Outside of Forests to Landscape Carbon and Climate Change Mitigation in West Africa


1
Global Observatory for Ecosystem Services, Department of Forestry, Michigan State University, East Lansing, MI 48823, USA
2
Senegalese Institute of Agricultural Research, Saint Louis BP 240, Senegal
3
Future Africa Institute, University of Pretoria, Hatfield 0028, South Africa
*
Author to whom correspondence should be addressed.
Forests 2021, 12(12), 1652; https://doi.org/10.3390/f12121652
Submission received: 20 September 2021
/
Revised: 20 November 2021
/
Accepted: 25 November 2021
/
Published: 28 November 2021
(This article belongs to the Section Forest Inventory, Modeling and Remote Sensing)
Abstract
:While closed canopy forests have been an important focal point for land cover change monitoring and climate change mitigation, less consideration has been given to methods for large scale measurements of trees outside of forests. Trees outside of forests are an important but often overlooked natural resource throughout sub-Saharan Africa, providing benefits for livelihoods as well as climate change mitigation and adaptation. In this study, the development of an individual tree cover map using very high-resolution remote sensing and a comparison with a new automated machine learning mapping product revealed an important contribution of trees outside of forests to landscape tree cover and carbon stocks in a region where trees outside of forests are important components of livelihood systems. Here, we test and demonstrate the use of allometric scaling from remote sensing crown area to provide estimates of landscape-scale carbon stocks. Prominent biomass and carbon maps from global-scale remote sensing greatly underestimate the “invisible” carbon in these sparse tree-based systems. The measurement of tree cover and carbon in these landscapes has important application in climate change mitigation and adaptation policies.
1. Introduction
Closed canopy forests have been an important focal point for land cover change monitoring for the last twenty years, and as a result, considerable progress has been made to develop tools and methods applied to these forest ecosystems [1,2,3]. These high carbon ecosystems have been undergoing significant changes due to land use conversion. Globally, deforestation and degradation of closed canopy tropical forests are important sources of carbon emissions. However, there has been less consideration and analysis given to carbon stocks and monitoring of landscapes of trees outside of forests (TOF) [4]. Here, we considered TOF to include occurrences of (1) sparse woodlands and savannas with canopy cover less than the forest definition; (2) agricultural landscapes with individual remnant or planted trees on farms; and (3) agro-forestry systems that combine perennial trees with annual crops. Although the carbon density of these tree systems is low, they usually have significant livelihood dependencies for economically poor rural communities in marginal landscapes that are particularly vulnerable to climate change.
The geographic distribution of TOF systems is globally extensive [5,6]. In Africa, many farmers plant trees or maintain remnant trees on their farms because they recognize the multiple benefits that trees provide for land productivity and household incomes, thereby providing substantial benefits to rural dwellers, national economies, and food security [7]. While the area of forests is declining in developing countries, tree cover on farms is found to be increasing in many parts of Africa and the world, as farmers use trees for products formerly available in local forests [5,8,9]. In sub-Saharan Africa, the majority (87%) of agriculturally dominated landscapes has a tree cover of more than 10% [10].
Systems of TOF are important sustainable land management systems and climate-smart farming systems that create opportunities for climate change mitigation and adaptation [11]. In terms of climate change actions, these systems have great potential to link both mitigation and adaptation in a single intervention [11,12]. Moreover, widespread adoption of TOF by farmers provides an opportunity to act simultaneously on two economic development problems—climate change vulnerability and rural poverty—since TOF products can achieve higher value chains than most annual crops. Through innovations in landscape management using TOF practices, millions of farmers could be important participants in climate change mitigation actions, while also enhancing their livelihoods at the same time.
However, before TOF can be fully integrated into the international frameworks for climate change mitigation and sustainable development, it is necessary to develop tools that provide robust and rigorous measurement and monitoring methods across large areas of the rural landscape. In this paper, we assessed the contribution of TOF systems in West Africa to landscape carbon stocks, while demonstrating a framework for measurement, reporting, and verification (MRV) applicable to national REDD+ program requirements. This paper is focused on MRV that can directly support building capacity for the National Forest Monitoring System (NFMS) in countries that are making forest-related contributions to climate change mitigation as part of their commitments following the Paris Agreement on the United Nations Framework Convention on Climate Change (UNFCCC). The international climate agreements arising from the 2015 Paris Conference of the Parties to the UNFCCC (COP21) have brought forest and agricultural landscapes into prominence in efforts for greenhouse gas emission mitigation. TOF systems are important for their role as natural climate solutions, especially for atmospheric removals, and because these landscapes are significant to the livelihoods of millions of rural people.
Our aim was to evaluate the magnitude and spatial distribution of aboveground biomass and carbon stocks in individual trees of savanna landscapes in Senegal using very high resolution (VHR) remote sensing data for mapping the crowns of individual trees, upon which a crown-area allometric scaling model was used to estimate tree diameters so that it may be used by standard allometric equations for the region. The development of a diameter at breast height (DBH) estimator is useful for including individual tree maps in national inventory and accounting programs for climate change mitigation. Using canopy parameters to estimate DBH, we assessed an approach to mapping landscape carbon and demonstrated a measurement framework that supports the requirements of REDD+ national forest monitoring systems for both activity data (AD) and emission factors (EF).
This study asks the following questions: (1) How important is the contribution of TOF to landscape tree cover and carbon stocks? (2) How well does high resolution mapping of TOF cover compare to estimate from global-scale medium resolution mapping, such as [1]? (3) How well does high resolution mapping of TOF carbon stocks compare to estimates from global-scale coarse resolution estimates? (4) How effectively can measurements of canopy area from remote sensing be used to estimate tree stem diameters and be used with existing allometric equations for these landscapes?
2. Materials and Methods
2.1. Study Region
This study takes place in an important area of the Sahelian-Sudanian ecoregion of West Africa (Figure 1). The climate is semi-arid with annual rainfall from 400 to 1000 mm, but can reach up to 1845 mm. The rainy season usually lasts three months from July to September. The area is important for agriculture, a part of the so-called peanut basin of Senegal where thousands of communities depend on agroforestry and other tree-based production systems.
These landscapes are also important for their climate and carbon dynamics. For the last several decades, the total amount of precipitation has been increasing, resulting in an increase in vegetation productivity and biomass [13,14]. Multitemporal analyses provide evidence of a general greening trend in West Africa, although not in all locations and periods [13,14]. Notable increases in primary productivity can be attributed to tree cover [15,16] and overall woody cover, in part driven by climatic factors such as an increase in the frequency of heavy rainfall events and extra-seasonal rainfall [17,18,19,20]. Across the broader Sahel, there is evidence that farmers in arid and semi-arid Sahelian lands are promoting medium-to-high woody cover in their fields and around settlements, which may even exceed that of the surrounding natural savannas [21]. A combination of increasing productivity and farmer-assisted agroforestry may have combined to create what most evidence suggests as a net carbon sink over the last 30 years [11].
This project focused on the Fatick region of Senegal. This is the southern part of the so-called peanut basin of Senegal, characterized by a savanna landscape. This savanna landscape is a mosaic of remnant savanna trees, cultivated individual trees, and plantation clusters of Anacardium occidentale and Eucalyptus. This study site has seen both increases in biomass in TOF around villages and extensive land degradation as trees are removed for fuelwood and cropland conversion.
2.2. Basic Approach: Mapping Individual Trees and Estimating Diameter from Crown Area
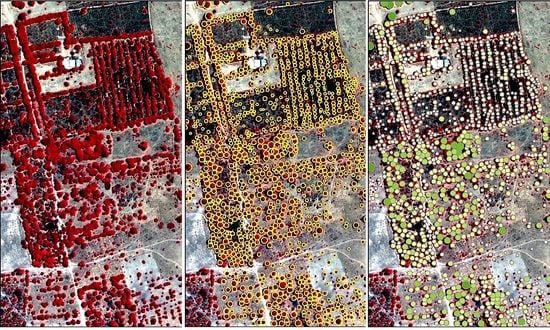
The first step in analysis was to acquire very high resolution (VHR) remote sensing data using the Worldview products for a 36 km2 test site (Figure 2). We reprocessed 2-m resolution multi-spectral data by sharpening with 0.5 m panchromatic data. These data are used to manually derive individual crown polygons for all trees in the test site and estimate tree cover and density parameters, which can be compared to tree crown products that use automated methods [22] and to global tree cover products using Landsat data [1].
Within the test site, we deployed a field inventory to collect individual tree data on crown areas, standard allometric parameters (cf. diameter at breast height and crown projected area), species and landscape descriptions, and tree location information co-registered to the tree map products. A sample frame inventory was deployed using standard operating procedures for forest carbon inventories [23]. Allometric measurements from field plots were used to estimate diameter at breast height (DBH) from crown projected area (CPA) using linear ordinary least squares regression. The estimated DBH was used as an input parameter in the standard, local allometric equation to estimate tree biomass. The aim of estimating DBH from remote sensing, rather than directly estimate carbon, is so our approach is compatible with national forest inventory practices in the Senegal that routinely use tree and forest inventories from existing allometric equations.
2.3. Tree Cover Mapping with Very High Resolution Remote Sensing Data
The project acquired VHR data (2 m multispectral, 0.5 m panchromatic) from commercial sources and the NASA Commercial Data archive for the study test site in which individual tree crowns were mapped (Figure 3). The VHR data were processed for geometric registration, and atmospheric correction. Panchromatic sharpening of the 2-m multispectral bands to the 0.5 m panchromatic bands was used to maximize spatial resolution and this product was used as the basic tree crown mapping dataset. Two methods were tested for the mapping of individual tree crowns and measurement crown geometry. First, all trees with CPAs greater than 5 m2 were mapped using heads-up digitizing [24], which is a common method used in Senegal and in many other countries [25]. This manual digitizing also has the advantage in that an individual tree and its landscape context can be immediately assessed by the analyst to prevent false clustering of overlapping crowns, which assured that we did not obtain multiple crowns merged into single polygons, which could skew the outputs from the allometric scaling model since it is non-linear. It also allows distinguishing trees from shrubs. It replicates the measurement protocol that would be deployed in field measurements, which calls for defining a circle or ellipse based measurement on the long-axis and its perpendicular axis. To capture the CPA polygon, each tree crown was digitized using the Arc/GIS Construction tool. A large area of forest in the study site, which was also used for grazing livestock, was excluded from tree mapping.
We recognize that covering extremely large areas may require automated processing. Therefore, we additionally examined the automated detection algorithm developed by Brandt et al. [22] using their published dataset. This dataset is available from a publicly accessible repository at the Oak Ridge National Laboratory Distributed Active Archive (ORNL-DACC). It covers a very large area of Sahelian West Africa and includes mapping of individual trees with crown areas greater than 3 m2. It was produced using an automated machine learning algorithm as described by Brandt et al. [22] using Worldview VHR satellite data. The area of our study site was clipped from two tiles of this dataset and the trees within woodland or forest areas were masked out.
2.4. Field Sampling
The remote sensing mapping of trees and the field inventory was developed in a topographically level semi-arid landscape in southern Senegal close to the community of Sokone, as shown in Figure 1 and in detail in Figure 2. The area measures 36 km2 in an area bounded by a 6 × 6 km rectangular perimeter. The area contains both plantations of Anacardium occidentale (cashew) and scattered individual trees. Individual trees include Anacardium as well as other natural and individually planted tree types. Farmers in the region use or maintain a limited range of tree species including Cordyla pinnata, Cola cordifolia, Mangifera indica, Combretum glutinosum, Cordila pinnata, Pterocarpus erinaceus, Adansonia digitata, Zizyphus mauritiana, Diospyros mespiliformis, Prosopis africana, and Parkia biglobosa. Cultivated land associated with rainfed agriculture consists mostly of peanuts (Arachis hypogaea), millet (Pennisetum typhoides), and cashew (Anacardium occidentale) production.
Although the remote sensing analysis covered the entire test site area, the field parameters were collected on a sample basis. The VHR data were segmented into nine blocks of 400 ha each. Within the nine blocks comprising the study area, we selected three blocks with the highest tree densities to sample individual trees (Figure 2). In these sample blocks, we established 105 random sample plots in agricultural TOF land with isolated trees. Sample plots for plantations were 0.1 ha in size, while sample plots for isolated agricultural trees were 1.0 ha. All trees in each sample plot with DBH > 10 cm were measured for allometric parameters following standard forest inventory methods: DBH, tree height, crown height, crown long axis diameter, and crown perpendicular axis diameter. Critical descriptor data were also recorded including species, stand plot type, block number, and tree location by GPS. The field sampling resulted in a dataset of 377 trees. The regression model used here did not use trees in block-plantations of Anacardium (cashew), resulting in 127 trees for regression analysis. These trees covered a CPA range from 5–300 m2.
The sampling protocol followed the standard operating principles provided in [23] for 1 ha rectangular plots with a randomly determined centroid, which is widely used in Senegal and other countries for their national forest inventory. Location of trees was determined using a Trimble GeoXT with TerraSync Pro software and were co-located with trees in high resolution photo maps produced from temporally concurrent processed 0.5 m resolution VHR imagery. Tree canopy projected area was measured in the field using the ellipsoid major–minor axis measurement method in which the long axis of the dripline was measured with a distance tape first, followed by its perpendicular axis, in meters. Stem diameter was measured at 1.3 m height using a Ben Meadows standard diameter tape in centimeters. Tree height was determined using a paired measure using a Suunto clinometer and a MDL Laser-Ace hypsometer.
Figure 2 shows the locations of the blocks with sample plots, where each location of one or more plots is identified with the number of sampled trees. This sample transect represented the best spatial gradient of tree cover in the most densely treed blocks. The entire 36 km2 test site was mapped with remote sensing for all trees using semi-automated polygon mapping using the ARC GIS software.
The project established a paired validation site outside the test site around the community of Karang (Figure 1). VHR satellite data were used to randomly select 143 trees and the DBH was measured estimated using the same methods and estimated using a DBH–CPA linear relationship from the test site data analysis.
2.5. Estimation of Tree Stem Diameters from Crown Projected Area
A map of all tree crowns was created from the VHR remote sensing dataset by heads-up digitizing or clipped from the deep learning dataset of Brandt et al. [22]. Areas of woodland forests were masked out. An ordinary least squares linear regression was estimated from the field-measured DBH and remote sensing CPA using the sample tree data. This produces a simple model to estimate DBH from remote sensing CPA, which can be used in standard allometric equations based on DBH. Once the estimator is applied to each tree across the test landscape, the allometric equation from Mbow et al. [26] is applied to estimate biomass for each tree in the landscape. The allometric equation from Mbow et al. [26] was developed specifically for this Senegalese landscape. The equation is generalized for a range of tree species. Only trees with crown projected areas from 5–300 m2 were included. This is the valid limit of the allometric equation and is consistent with the analysis by Rassmussen at al. [27]. This removes trees, which are outside the range of the field-based sampling as well as polygon clusters of trees than can occur in the automated deep learning dataset. Our analysis suggests this clustering represents less than 2% of the trees. We then compared this carbon map against maps similarly produced using the allometry from the IPCC default for tropical dry forest, and open-grown trees from Kuyah et al. [28]. The aboveground biomass estimates were converted to total carbon using a shoot–root expansion factor of 1.26 and a carbon conversion factor of 0.5. Parameters for the estimation of biomass and carbon are provided in Table 1.
In these equations, AGB is the tree biomass estimate in kg, BGB is belowground biomass, and Ctree is the estimated carbon stock of trees. DBH is the remote sensing estimated diameter at breast height for the tree and Crs is the remote sensing mapped crown projected area.
Allometric equations are commonly used to estimate biomass and carbon stocks, however, there is limited reporting on allometric models for TOF, especially in African savannas and woodlands [32]. The estimation of carbon stocks in sub-Saharan Africa is frequently based on allometric models in conjunction with forest inventory data [33,34]. For West African savanna ecosystems, studies have developed allometric scaling models based on stem diameters [35], height [36], or other parameters [37,38], but few with consideration of crown parameters [39]. Most have focused on the estimation of aboveground biomass of closed forest ecosystems, specific tree species, or plantations [34,40]. The study from Kuyah et al. [28] is one of a few that have focused on the estimation of aboveground biomass in agricultural landscapes from destructive sampling of open grown trees. The study by Mbow et al. [26] is one of the few that has developed allometric equations for savannas, both for dominant species in our study area and general multi-species equations.
For this study, we used the allometric scaling model from Mbow et al. [26] because it is a local equation developed using destructive sampling in the same region of Senegal as this study. For comparative purposes, we also used the IPCC tropical dry equation [29] and the equations from Kuyah et al. [28,41], which includes crown allometry. The IPCC equation is important because it is an often-used default allometry. Kuyah et al. [28] and [41] are important because they present allometric models for open-spaced trees using diameter and crown parameters in the same tree inventory.
2.6. Statistical Metrics
To evaluate comparative statistical measures for the linear regression of CPA to estimate DBH and its validation performance, we computed the following statistics following [42]. The accuracy of each model was assessed according to the coefficient of determination (R2), absolute and relative root mean square error (RMSE and %RMSE, respectively), and absolute and relative bias (%bias).
where = estimated tree attribute for the i-th tree; = observed tree attribute for the i-th tree; Y = observed mean tree attribute; and n = number of observations. We also include the computation of the Pearson correlation coefficient, r.
These measures allow our OLS regression to be compared to other estimates, providing measures of performance which are shown as graphical results. To evaluate whether to use a linear or higher order regression, we compared the linear to a second order polynomial, which produces a slightly better coefficient of determination. However, using the Akaike information criterion (AIC) there was no important increase in information content, so we selected a linear OLS. All computations of statistics were performed using the R software package.
3. Results
3.1. Landscape Mapping of TOF Cover
Figure 3 shows two representative sections of the study area with individual tree crowns, where the size of the crown represents its CPA determined by VHR remote sensing. We mapped 29,836 trees in the study area, with canopy areas ranging from 5.5 to 298 m2. This represents an average of eight trees per hectare, which is lower than what Brandt et al. [25] mapped with 30 trees per hectare across a large area of the West African semi-arid region of the Sahel. Within our study area only, Brandt et al. reported 12 trees per hectare, an estimate that includes small trees with crown areas (3–5 m2), which was less than our minimum of 5.5 m2, but comprising only approximately 3% of their total tree inventory (Table 2).
The total canopy cover for the entire study areas was 1.92 × 10⁶ m2, which represents 5% canopy cover and would be considered under the definition used by the United Nations Food and Agricultural Organization to be a true TOF landscape rather than sparse woodlands (Figure 4). By comparison, the analysis by Brandt et al. [25] found 2.416 × 10⁶ m2 of total crown cover in this study area, representing 7% canopy cover and would also be considered under the FAO definition to be TOF areas (Table 2). The mean cover area per tree in our analysis was 65 m2 with a median value of 56 m2 (Table 3).
The mapping of tree cover demonstrates that while the cover is very sparse, there is measurable tree density that may have been overlooked by global scale mapping and analyses. One of the characteristics of TOF cover in this region is its spatial and density-class distribution. As shown in Figure 4, the TOF cover is spatially diverse and clumped. Indeed, as noted in other studies, and demonstrated here, TOF is concentrated in areas of human settlement and areas of active agricultural production. This results in a robust pattern on a per hectare basis as show in Figure 4, where the range in values of carbon density in individual grid cells is very wide and spatially uneven, with a highly asymmetrical distribution (mean = 688 m2 ha−1, median = 381 m2 ha−1, mode = 73 m2 ha−1, skewness = 1.9).
3.2. Estimation of Tree Diameter from Remote Sensing Crown Projected Area
To evaluate these tree cover results in carbon terms, CPA measurements taken from VHR remote sensing data were regressed against field-measured stem diameter (DBH) from individual trees to produce a model that estimates DBH from remote sensing CPA. The linear OLS regression that was estimated from remote sensing CPA and field measured DBH is shown in Figure 5. The estimate range extended from 2 to 300 m2 CPA, with a coefficient of determination (R2) of 0.84 (p < 0.001) which is reasonably good. The root mean square error (RMSE) and relative root mean square error (%RMSE) were 10 cm and 21, respectively. The linear relationship bias and relative bias were close to zero. The Person’s r was 0.92. An alternative formulation using a second-degree polynomial would improve the model, but based on our evaluation using the Akaike information criteria (AIC), it would only improve from 566 (linear) to 573 (polynomial), so it was deemed parsimonious to keep the linear formulation. Six of the largest trees in the sample were statistical outliers, but we used them to capture larger trees that would have important carbon contributions in the landscape. Using this model to predict the allometric parameter of DBH appears to be reasonable.
We established an additional field site for validation in a savanna landscape in the vicinity of Karang to the south of the Sokone test site. We measured tree stem DBH in the field and tested the CPA model against this independent set of tree samples. Figure 6 presents the regression of DBH predicted from remote sensing CPA in the test site model and field measured DBH values in the Karang validation site. The correlation coefficient was depressed slightly compared to the model with the coefficient of determination (R2) of 0.70 and a Person’s r of 0.83, but the relationship was significant (p < 0.01). The RSME for the validation set was 15.6 cm and the %RMSE was 24.5, which is nominally good but by standards of forest inventory that use more parameters such as height was somewhat low. An estimate of bias was close to zero and is close to the few other published estimates for TOF systems (cf. [41]).
The validation landscape is slightly different from the test site with respect to species composition and tree sizes. The test site in Sokone is dominated by two species, Anacardium spp. and Cordila pinata, with a few large Ficus spp. and some Acacia spp. The validation landscape has a more heterogeneous species composition, dominated by Cordila and four others: Danielia, Posposis, Parkia, and Anacardium, in order. As such, the results are encouraging since the model appears to be robust across varied landscapes. The regression model is applicable to trees with CPA of less than 300 m2. There were few measured trees with CPA values this large, but if they were mapped by remote sensing, they were not used in calculations of tree cover or carbon stocks.
3.3. Carbon Stocks of Landscape Wide TOF
Generally, the local equation from Mbow et al. [26] overestimates the other two equations by approximately 60% across the full range of field-sampled tree sizes; however, the largest difference occurs at higher DBH values. In the 15–50 cm range of DBH values, the local equation was underestimated by about 10%. Most of our trees were in this range. The allometric models we derived, along with other equations for carbon estimation, are shown in Table 1. The derived model that estimates DBH from remote sensing CPA can be inverted so that the dependent variable, or output, is the estimated DBH, and this is shown in the table. Both the linear form of the model and the second order polynomial are provided.
Using the TOF cover map of individual trees in the Sokone study area and the allometric scaling model, a carbon map was created as well as geospatial estimates of tree-based parameters (Table 2 and Table 3). Figure 7 presents the same selected sites as shown in Figure 3, with tree CPA magnitude represented as the size of the crown circle and the carbon estimate represented as a green color tone (darker tones represent higher carbon values). The sum of carbon in individual trees is the landscape-wide carbon stock. The total carbon stock for this landscape was 44.28 × 10³ MgC, or 14 MgC ha−1. The estimate using the alternative Brown–IPCC default allometry was 29.60 × 10³ MgC (9 MgC ha−1) and using Kuyah et al. was 37.721 × 10³ MgC (11 MgC ha−1).
A representative value for carbon density in Senegal based on field studies [43], ranges from 10 MgC ha−1 to 36 MgC ha−1. One reason why our estimates may be lower is that our landscape-wide analysis covers a range of conditions from cropland with few trees to degraded savannas to dense tree cover areas, while biomass studies tend to establish sample plots in areas with tree cover, which may not be representative of larger landscapes. Our mapping produces a more accurate landscape-wide carbon density estimate. The IPCC default values [30,31] for growing stock carbon in Senegal landscapes are 14 tC ha−1, which was close to our estimates for this specific landscape.
We compared our results to those produced by Brandt et al. [22] using their published individual tree cover dataset with our allometry. This study was approximately 40% lower in carbon density and total landscape carbon (Table 2). This is largely due to the greater number of trees in the Brandt et al. dataset, which produced 25% more total canopy cover. However, the mean per tree carbon stock for Brandt was only 13% higher than this study, and our mean tree cover and estimated DBH were actually higher than Brandt (Table 2).
4. Discussion
4.1. Application of Standard Allometric Equations for Carbon Estimation
One of the main objectives of this study was to produce a regression model that allows for the use of remote sensing CPA to estimate tree DBH, so that it can be used with regular national inventories based on ground plot sampling. These inventories use measures of DBH, and sometimes other tree parameters, to estimate tree and landscape carbon stocks using standard allometric equations based on DBH. Although the linear model estimating DBH from CPA is reasonable, the selection of the allometric equation could present other complexities, not only for this type of an approach, but any model using individual tree estimators such as LiDAR methodologies that could be used to estimate height parameters in a similar way.
Using the locale allometric equation from Mbow et al. [26], our estimate of the total carbon across the study’s landscape was higher than if we used either of the alternative allometric equations. Our estimate was 47% higher than an estimate using the dry tropical forest equation from Brown [29], which is the IPCC default equation for this area. Our estimate was 16% higher than an estimate using the allometric equation developed by Kuyah et al. [28], which was based on destructive sampling of open-grown trees in agricultural areas in western Kenya. However, our equation was locally derived, and therefore is likely better suited to this area than the global default from IPCC or one derived in landscapes in East Africa. All are general equations developed using sampling of a wide range of tree species across a wide range of size classes. Most of the carbon differences between estimates from different allometric equations were due to the larger tree size classes (cf. >50 cm DBH), especially those greater than 100 cm DBH. Unlike closed tropical moist forests in which a few very large trees comprise as much as 60% of the carbon per hectare [44,45], semi-arid trees are more evenly distributed across size classes. Nonetheless, the large trees may contribute to differences between estimates, and thus the uncertainty in the total carbon stock.
Among other considerations of allometric scaling, this non-linear-large-tree characteristic of most standard allometric scaling equations presents sensitivities, and perhaps error or uncertainty, for any tree-based measurement using a remote sensing-based estimator including LiDAR. We cannot over-state the importance of the selection of the allometric scaling model. The difference in results from different allometries is as important as the difference due to remote sensing mapping approaches, as shown in Table 2. While remote sensing methods for quantification of biomass and carbon are converging, there remains considerable work to be done in refining and selecting appropriate allometric models.
One issue is that the allometric scaling models have been adopted from pre-existing studies and prior assessments, rather than developed in tandem with the mapping activity. Ideally, it would be advisable to develop the mapping model for a specific landscape and use it to deploy an appropriate tree carbon inventory and destructive sampling scheme using a sampling allocation that accommodates the mapping parameters, landscape features, and ecology of the area, particularly the canopy size distribution, tree-type or species distribution, and land uses. Another issue is that the greatest difference in the results from allometry occurs with big trees, the size range where most allometric equations diverge considerably. Better use of large area remote sensed-based mapping would likely be achieved using segmented allometric equations in multiple, narrow size classes.
Our analysis is in part based on a comparison of remote sensing-derived CPA with field measured CPA. The remote sensing measurement of CPA delineates the whole crown as a polygon. The field-based estimate is derived from a geometric method that uses two diameter measurements to estimate the area of a uniform ellipse. Field crown diameter measurements can be difficult to obtain consistently and with an accurate representation of the projected area. Therefore, it is not certain that the ground measurement of CPA is more precise and accurate than the high-resolution remote sensing measurement, especially when using satellite data with its very high spatial resolution and radiometric fidelity.
We tried to minimize this problem by constructing the allometric scaling model directly from remote-sensing CPA and field DBH without having to consider field measured CPA. Nonetheless, the field techniques for allometry are standardized and widely used, so for practical application, it makes sense to test and calibrate the remote sensing measurement to field measures. This was not undertaken in this study, since we directly modeled the DBH relationship from the remotely sensed canopy area. Our prediction of DBH from remote sensing CPA was remarkably good, but the variance did result in different carbon estimates than the results using the field measured DBH. Improvements in the method could likely be achieved by adding more specificity to the scaling model by adding additional parameters such as height if it can be derived from remote sensing, or segmentation of the model into narrower species groups, tree-types, or size classes. It also makes sense to consider alternative models for carbon estimation that might be based on non-allometric parameters such as tree cover directly.
4.2. Other Studies and Other Tree Parameters
There is interest in developing relationships between remote sensing measurements and individual tree attributions because robust models that use tree parameters visible to remote sensing to estimate standard allometric parameters [46]. To evaluate the contribution of TOF systems to tree cover and carbon continuously across West African savanna landscapes, we deployed a remote sensing approach for estimation of tree stem diameters. This approach used VHR data to map tree crowns of individual trees, thus providing a direct estimate of landscape cover area. These data were used to estimate tree stem diameter. Other parameters such as tree height could similarly be mapped using other remote sensing sources such as LiDAR [47]. The relationship between tree height and stem diameter might be a better predictor than using crown areas, and recent evidence suggests it does not [48] due to several factors related to growth dynamics and species variations [49], especially for larger trees, which may contribute more to landscape biomass than small trees and where model sensitivities for larger trees create allometric uncertainties. Crown measures offer a critical starting point for the estimation of stem diameter in naturally growing trees; while height growth tends to slow rapidly in large trees, lateral crown expansion does not [49]. There is evidence that crown area is strongly related to stem diameter, even in large trees [50].
Using a global airborne laser scanning dataset, Juker et al. [49] found that joining both crown diameter and tree height produced a better model of stem diameter than either one alone. Adding height data from another sensor, or perhaps shadow length from the sensors used in this study, would be something to consider and test in the future. Nonetheless, the allometric estimate of stem diameter in [49] using both height and crown diameter resulted in a RMSE of 9.7 cm and a bias of −0.012, which is comparable to our estimates that used crown area only and had a RSME of 10 cm and a bias very close to 0.0. Isolating the crown diameter only in [49] had a higher RMSE (17 cm) and bias (−0.045) than our crown area model.
However, the validation of our model in a similar but more mixed species landscape had a RMSE of 15.6 cm. This level of RMSE for the validation is close to the value (16.6 cm) found in [49] for their model of stem diameter using only crown diameter, suggesting that the model performance can vary from landscape to landscape, which is consistent with the pan-tropical findings of [51], which notes the importance of stand, site, and geographic variation, but generally at a global scale, and that savannas tend to have higher scaling exponents for crown–stem relationship for that of forests. In our case, we found this variation in performance to be reasonable. The national datasets within the very extensive dataset collected and analyzed in [51] present a range of topical savanna crown–stem diameter relationships, ranging in R2 from very low ~0.3 to high ~0.8, suggesting our model is good compared to other locations, but cautions that these relationships might not be universally applied with success.
The most similar analysis of crown based allometric scaling was Kuyah et al. [28] in western Kenya for trees on farms. These are not savanna systems, and the regression analysis were from destructive sampling. Those results were similar to our model, in that the Kenyan farm TOF model of stem diameter (x) and crown area (y) had a R2 of 0.83, which was close to our R2 of 0.84. A similar study by Kuyah et al. [41] that focused on a model estimating stem diameter from crown area in individual trees on farms had a significant R2 of 0.86 to 0.89, while the relationship between crown area and height was not significant with R2 from 0.38–0.41. Adding height to crown area to a model of stem diameter improved the coefficient of determination by 6%. The relationship between crown area is a good correlate of biomass in open landscapes due to different growing conditions than for dense trees and forests, and its inclusion improves allometric models based on stem diameter alone or other parameters such as height.
4.3. Comparison of Our Dataset with That of Brandt et al.
We compared our results with the automated mapping reported by Brandt et al. [22] in the same landscape and during approximately the same year (2010–2012). This provides insight into the sensitivity of the mapping method, as opposed to the sensitivity of the allometric mode. Brandt et al. [22] used automated processing of VHR data with deep machine learning algorithms. Our total carbon estimate for the study area was 44.28 × 10³ MgC compared to 73.35 × 10³ MgC from the Brandt et al. dataset, which was 66% higher than ours. The difference appears to be due to three factors: Case 1: detection of trees; Case 2: spatial mapping and size determination of tree crowns; and Case 3: multi-tree crown clustering, which creates oversized trees.
In Case 1, we evaluated the total tree inventories of our study against the Brandt et al. dataset. In our study site, Brandt et al. detected more trees overall than we did (29,835 for this study compared to 44,070 for Brandt). The Brandt dataset includes small trees in the 3–5.5 m2 CPA range that we excluded from our method. However, the number was small, only 1852 trees. This represents only 4% of their inventory and being small trees, is a negligible amount of carbon. However, their analysis also detected a larger number of trees in other small tree classes (cf. 5.5 < CPA < 50 m2). The distribution of CPA and tree carbon in both datasets are shown in Figure 8 and Figure 9. The difference in the shape of the distributions between the two studies is obvious. This study’s distribution of tree CPA was modal around 50 m2 with two tails in the distribution. The Brandt dataset is skewed to the left, mapping many more small trees compared to larger trees. However, because the allometry returned low estimates of carbon in this smaller class and is insensitive in this range of the non-linear function, the carbon contribution does not represent a large carbon difference (Figure 10). Only an additional 1582 MgC was attributable to these smaller trees. The carbon content in each interval of tree size was similar across most classes, and these medium size trees accounted for an additional 6339 MgC in Brandt compared to our analysis (Figure 10).
However, while the number of trees was relatively low in the highest size class compared to other classes (Figure 8), there were more trees in Brandt’s larger size class (cf. CPA > 250 m2), which includes almost 4-fold more trees than our analysis (380 trees vs. 96 trees). In this size class, the non-linear allometric equation is very sensitive and slight tree size differences can create large differences in total carbon (Figure 10). Indeed, the carbon difference in this size class accounts for a significant amount of the difference between the two datasets. The inclusion, or exclusion, of large trees matters to carbon estimation in these semi-arid tree landscapes.
The distribution of individual trees that are common to both datasets is presented in Table 4. This was determined by spatial overlay analysis. Only 6279 trees (14%) mapped by Brandt also had an associated tree in our mapping, largely due to Brandt’s very large contribution of trees in the smaller size classes. In our map, 7211 trees spatially overlapped with the Brandt dataset, representing a larger proportion of our dataset or 24%. However, it appears that there are a large number of trees in each dataset that were unique to that dataset. When we overlaid our trees on Brandt’s crown polygons and used a contingency matrix to identify omission and co-mission differences in carbon estimates, we found that there was 31.87 × 10³ MgC in trees that we mapped that were not mapped in Brandt and 32.67 × 10³ MgC in crown polygons in Brandt that we did not map.
This is indeed a large incongruity between the two mapping analyses. However, it is difficult to evaluate. A large amount of the difference appears to be based on the dates of imagery, which were not the same. Additionally, automated processing may detect more shrubs with large crowns than our analysis, although without a direct comparison of the automated analysis with extensive field validation, it is difficult to determine how important it is. Having other data such as height measures would help evaluate the distinction between shrubs and trees. In terms of carbon, the omission and commission differences were nearly the same in magnitude, so they resulted in a small contribution to the difference in carbon estimates between the two analyses (1325 MgC more in Brandt).
For Case 2, we evaluated how crowns were spatially and geometrically delineated and the differences in tree crown size estimation. The automated detection method appeared to create larger crowns than our method for any given tree, except the smallest ones. This likely reflects the difference between the forester’s canopy measurement protocol using diameter axis measurements to estimate the area based on a circle or ellipse and the automated mapping, which produces a polygon based on the canopy properties in the image data. To evaluate this further, we spatially mapped all centroids of tree crowns in our dataset onto the map of tree crown polygons in the Brandt dataset. This spatial overlay process allowed us to evaluate the spatial geometry and size of all trees in common between the two datasets. Here, we identified Brandt crown polygons where the centroid of only one of our trees overlaid, so as not to be confused by multi-tree clusters.
Table 5 presents by canopy size class the total number of trees in common—the same trees mapped in both datasets—and the carbon estimates for those trees. The first column presents the instances in which one tree centroid from our dataset overlaid a crown polygon in the Brandt dataset. These occurrences represent cases where both datasets mapped the same tree, and we can examine the crown size and carbon estimates of each. Overall, 5497 tree crowns were coincidently mapped and, with the exception of the smallest crown-area class, the Brandt dataset presented larger mapped crowns, and thus had higher carbon estimates. The Brandt dataset included 17,640 MgC more than our study for trees that were mapped in common.
We examined Case 3, where multi-tree cluster polygons were created in automated processing of overlapping tree crowns, resulting in oversized trees. We observed that the automated processing could over-produce large crowns in this way. A visual inspection of the automated processing product revealed that many of the large size trees were in fact several individual crowns. These augmented large tree crowns will result in very high carbon estimates due to the nonlinear nature of the allometric equations and the extremely high sensitivity in the larger DBH classes. Indeed, clustering can occur in our method, but less frequently; actually, when encountering groupings of closely grown trees, our method seemed to underestimate the individual tree crown size, producing more trees with smaller DBH, which resulted in lower carbon stock estimates from the allometry.
We conducted a spatial overlay analysis to map instances in which the centroid of two or more of our mapped trees overlaid a crown polygon in Brandt’s dataset. The results are presented in Table 5. These results represent trees in the Brandt inventory, which had crown areas less than 300 m2, a restriction imposed due to the valid limits of our allometric equation. This limit of 300 m2 reduced the number of multi-tree clusters, but some clusters were found in other crown size classes. Where Brandt clusters were present, we substituted our individual crowns and used those to compute the difference between the datasets attributed to cluster effects. In terms of carbon, clusters accounted for 10.1 × 10³ MgC of the difference in estimates from our analysis.
The total difference between our dataset and the Brandt dataset was 29.07 × 10³ MgC. The case overlay analysis suggests that 61% (17.64 × 10³ MgC) could be attributed to Case 2 issues related to spatial mapping and tree size measurement, and 35% (10.1 × 10³ MgC) was attributed to Case 3 issues related to clustering of multiple tree crowns. An additional 4% (1325 MgC) was attributed to Case 1 aspects and tree detection, but this was a small net difference of large commission and omission quantities. The Brandt dataset mapped more trees, estimated larger crown areas, and created multi-tree clusters, all with the net effect to estimate higher carbon stocks. Both datasets contained a significant, but nearly equal, number of trees not found in the other dataset.
4.4. Comparison with Prominent Medium and Coarse Resolution Biomass Datasets
Although technical differences between these two methods for mapping TOF with VHR data exist, they both demonstrate a new way to measure carbon in sparse tree landscapes that have heretofore been minimized or omitted by most carbon accounting and climate change mitigation efforts. One feature of a VHR satellite-based approach is that it captures trees whose carbon stocks are not detected or resolved in coarse resolution remote sensing methods. For instance, we compared the map of carbon from Baccini et al. [52], which used a MODIS optical data and regression tree analysis built from a suite of ground biomass measurements and checked with ICESAT GLAS LiDAR data. The Baccini et al. [52] analysis was produced across the African continent at a spatial resolution of 500 m (25 ha grid) as a carbon density map of aboveground live biomass. We converted their biomass data to total carbon using a standard IPCC expansion factor of 1.26 and a carbon conversion factor of 0.5 to be compatible with our analysis. We aggregated our individual tree carbon maps to the 25 ha grid resolution of the Baccini dataset.
The coarse resolution mapping underestimated our total carbon in the study area and exhibited markedly different spatial distribution. Our estimate of 44.28 × 10³ MgC was 30% higher than their estimate of 33.6 × 10³ MgC. Furthermore, as shown in Figure 11, the spatial distribution of carbon stocks in our study was very different from the Baccini dataset, as is the range of tree carbon stocks. The mean density of carbon in our 25 ha aggregated dataset was 14 MgC ha−1, extending across a robust range of 0.02 to 70 MgC ha−1. On the other hand, the Baccini dataset mean density was 10 MgC ha−1, extending across a narrow range of 6–14 MgC ha−1. The range in carbon stock density in our original 0.5 m VHR dataset aggregated to 1 ha was even more pronounced, which was 0.02 to 209 MgC ha−1. Thus, there was much more variation in the carbon stocks in this landscape than can be revealed by coarse resolution global map products. In terms of the relevance of these datasets for use in carbon interventions, projects, and markets, these variations are important, because location specificity is required for activity data and the smoothed, average carbon values in coarse maps are inadequate values for emission factors.
The 500 m resolution biomass mapping has been updated to 30 m resolution from Zarin et al. [53], which was based on Baccini et al. [54]. Even at this increased resolution, these datasets do not map individual trees, but produce a continuous fields fractional cover product based on Landsat rather than MODIS. In a comparison between our dataset of individual trees and the 30 m dataset from Zarin [53] aggregated to 1 ha, we were surprised to see that the differences were more pronounced than with the 500 m resolution product (Figure 11). Our estimate of 44.3 × 10³ MgC for the study area was 448% higher than the 30 m resolution estimate from Zarin et al. [53] of 9.9 × 10³ MgC. Part of the discrepancy can be attributed to different methods for scaling tree cover to carbon, but as is clearly apparent in Figure 11, the mapping in the Zarin et al. data product was also very different. The mean carbon density in [53] for the study area was a low 3 MgC ha−1 (compared to 14 MgC ha−1 in our analysis), ranging from 0.5 to 44 MgC ha−1, compared to 0.02 to 209 MgC ha−1 in our assessment. By not explicitly mapping individual trees, a considerable amount of carbon was undetected and unaccounted.
We did not test other similar coarse resolution data such as Saatchi et al. [55] and Spawn et al. [56], but we expected similar results. We recognize that the comparison was over a relatively small area, but the results are indicative. It is clear from these cases that coarse resolution data omit the “invisible” TOF cover and associated carbon stocks in landscapes where TOFs are significant such as these African drylands and in agricultural areas. TOF areas or even sparse woodlands and savannas can be overlooked in carbon measurement and reporting efforts, and these landscapes and their communities are thus at risk of being excluded from climate change mitigation and actions.
This is further elaborated by reviewing the tree cover dataset from Hansen et al. [1], one of the most widely used and cited datasets (Figure 12). Hansen et al. was produced using regression tree analysis of fractional cover based on 30 m Landsat data. In Figure 12, red-colored areas are tree cover as mapped by Hansen et al. [1], where tree cover is between 10% and 20% (no areas were found to have tree cover more than 20%). Grey shaded areas were all tree cover classes specified in the dataset from 1% to <10%. Green-colored areas were individually mapped trees from our assessment. Total tree cover area in the study site, measured as total crown area, was 192.4 ha for our analysis compared to 97.5 ha in the Hansen dataset. The spatial pattern observed in the two datasets was very different; tree cover in the Hansen dataset was mapped more extensively including in many areas with no trees. The Landsat total cover was quantitatively less than the VHR total cover, which is able to map areas of high concentration of tree cover and areas with more spatial variation in tree densities.
As the Landsat fractional cover mapping does not capture the spatial variation in tree density, it would be insensitive to temporal variation due to land use change. This is likely to be a characteristic problem for mapping changes in tree cover in sparse tree landscapes and in landscapes with low carbon stocking densities. One of the most useful features of mapping with VHR data in these TOF landscapes is its ability to inventory individual trees and thus estimate change in carbon density more accurately. This feature is critically important for monitoring in landscape restoration projects and programs.
4.5. Limitations and Other Remarks
To increase the accuracy of the carbon mapping, future work should be directed at the refinement of the allometric model for large tree size classes, or by developing stratified or segmented sets of separate equations for multiple tree size classes, and for separate equations by tree type. Moreover, this study demonstrates how important it is to deploy the remote sensing mapping of tree cover with the development of field-based allometric equations for both the CPA–DBH relationship and the carbon estimation. We relied on existing allometric carbon equations, which is what most national inventories would also have to do, but an integrated mapping and inventory framework for future analysis would better inform the ground sample design and model specificity.
Improvements in the allometric scaling could be made with additional parameters. An additional measurement of tree height has been shown by others [28,41,49] to improve the allometry. The use of LiDAR might be a way to integrate more accurate estimation into the allometric scaling. The use of a height measure would be useful for extending the generalization of the models to more landscapes. It might also be useful for landscapes in which TOF are found associated with dense forest and woodland cover. Moreover, height would improve the stratification of tree types and sizes for more specific allometric models.
Although the scaling of canopy area to diameter was robust, the sensitivity of the carbon allometric equations themselves, especially for larger tree size classes, introduced important uncertainty. In future studies, a more in-depth examination of non-allometric models could be important, especially frameworks that estimate carbon directly from cover. This is because to scale to larger areas, as demonstrated by the dataset from Brandt et al. [22], automated mapping would be needed. In these methods, as we show, there is an additional crown clustering that needs to be resolved. Thus, an alternative to the CPA allometry may be a model based directly on tree cover rather than individual tree allometry since the clustering does not affect the performance of tree cover estimates.
By comparing our field-intensive analysis with an automated remote sensing method using machine learning, we believe that these new tools can greatly advance our ability to map individual tree crowns over large areas. The most important challenges to carbon mapping using automated processing of cover at this stage is the problem of crown clustering, which confounds the allometric approach. The other issue is having an accurate means to separate tree versus shrub crowns, so that a specific and measurable definition of tree cover and tree carbon can be well specified and consistently applied. Additional parameters such as height could be extremely useful in this regard.
5. Conclusions
Mapping individual trees outside of forests in sparse landscapes reveals more cover and more carbon than is often expected and shows the importance of considering TOF in carbon measurement and climate change mitigation actions. The use of VHR data for individual tree carbon estimation also revealed more carbon and a more robust spatial heterogeneity than the often-used coarse resolution global datasets. There is demonstrated potential for mapping carbon stocks of individual trees in landscapes with widely scattered trees such as savannas and woodlands, and in systems of trees outside of forests (TOF) such as agroforestry. This approach produces more accurate and spatially representative carbon estimates in landscapes of TOF than previous coarse resolution global vegetation and tree-cover datasets, capturing important and heretofore invisible carbon stock. It is an important improvement over most fractional cover products for very sparse woodlands, savannas, and trees outside of forests. Our analysis revealed important carbon in tree-based systems in agricultural areas and as a result, suggests that we re-think the sector-based partitioning of natural climate solutions that has dominated the mitigation and adaptation policy dialog related to forests.
Having robust measurement methods for mapping carbon stocks and changes in these landscapes has the important potential to bring into consideration large areas of the world for natural climate solutions that have heretofore been overlooked in favor of closed forest systems [57]. Although these TOF landscapes have relatively low carbon densities, they are vast in area. Large areas in Africa contain TOF that have great potential for engaging many more countries in international efforts to mitigate carbon emissions from agriculture, forestry, and other land uses. Furthermore, these same systems have direct connections to livelihoods and therefore are also important for economic development, poverty alleviation, and climate change resilience and adaptation. Many countries that are actively participating in international programs for climate change mitigation are implementing forest landscape restoration (FLR) measures aimed at increasing tree carbon stocks outside of forests such as the Bonn Challenge [58,59] or AFR100, the African contribution to the Bonn Challenge, which has set high targets for increasing tree cover over the next two decades. One critically needed element of FLR programs is a robust framework for monitoring [60], assessing impact, and scaling [61]. This study suggests such a framework and demonstrates potential for it to be based on individual tree carbon mapping.
Author Contributions
Conceptualization, D.L.S. and M.D.; Methodology, D.L.S., M.D. and C.M.; Software, J.H.S.; Validation, M.D. and D.L.S.; Formal analysis, D.L.S. and J.H.S.; Data curation, J.H.S. and M.D.; Writing—original draft preparation, D.L.S.; Writing—review and editing, D.L.S., C.M., M.D. and J.H.S.; Visualization, J.H.S.; Supervision, D.L.S. and C.M. All authors have read and agreed to the published version of the manuscript.
Funding
This research was funded by the Land Cover and Land Use Change (LCLUC) Program at the National Aeronautics and Space Administration, USA (grant number 80NSSC21K0315). The APC was funded by NASA grant 80NSSC21K0315 and Michigan State University.
Data Availability Statement
All results from the data analysis needed to evaluate this report are available in the main text or in the tables and figures. The very high-resolution satellite data were commercially provided. The remote sensing–derived products, spatial data layer products, validation data, and Excel spreadsheets of spatial analysis are available from the Tropical Rain Forest Information Center, a NASA ESIP Data Center, now maintained by the Global Observatory for Ecosystem Services at Michigan State University (https://goeslab.us/senegaldata (accessed on 26 October 2021)), and from the NASA Land Cover and Land Use Change Program data server (https://lcluc.umd.edu/content/metadata (accessed on 26 October 2021)). Data were visualized using the GOES map server, https://arcg.is/0ajqvS (accessed on 26 October 2021). High resolution tree maps from the study by Brandt et al. (2020) are available from the Oak Ridge Distributed Active Archives Center (DAAC) maintained for NASA by the Oak Ridge National Laboratory.
Acknowledgments
We acknowledge Michigan State University, the Future Africa Institute at the University of Pretoria, and the Alliance for African Partnership for strengthening the pre-existing collaborative partnership between American, Senegalese, and South African co-investigators during the global pandemic. We also acknowledge the tireless efforts of Katie James for her efforts to configure effective international science management arrangements during the pandemic.
Conflicts of Interest
The authors declare no conflict of interest.
References
- Hansen, M.C.; Potapov, P.V.; Moore, R.; Hancher, M.; Turubanova, S.A.; Tyukavina, A.; Thau, D.; Stehman, S.V.; Goetz, S.J.; Loveland, T.R.; et al. High-resolution global maps of 21st-century forest cover change. Science 2013, 342, 850–853. [Google Scholar] [CrossRef] [Green Version]
- Fischer, R.; Taubert, F.; Müller, M.S.; Groeneveld, J.; Lehmann, S.; Wiegand, T.; Huth, A. Accelerated forest fragmentation leads to critical increase in tropical forest edge area. Sci. Adv. 2021, 7, 7012. [Google Scholar] [CrossRef]
- Vancutsem, C.; Achard, F.; Pekel, J.F.; Vieilledent, G.; Carboni, S.; Simonetti, D.; Gallego, J.; Aragao, L.E.; Nasi, R. Long-term (1990–2019) monitoring of forest cover changes in the humid tropics. Sci. Adv. 2021, 7, 1603. [Google Scholar] [CrossRef]
- Miller, D.C.; Muñoz-Mora, J.C.; Christiaensen, L. Prevalence, economic contribution, and determinants of trees on farms across Sub-Saharan Africa. Forest Policy Econ. 2017, 84, 47–61. [Google Scholar] [CrossRef] [Green Version]
- Zomer, R.J.; Neufeldt, H.; Xu, J.; Ahrends, A.; Bossio, D.; Trabucco, A.; Van Noordwijk, M.; Wang, M. Global Tree Cover and Biomass Carbon on Agricultural Land: The contribution of agroforestry to global and national carbon budgets. Sci. Rep. 2016, 6, 29987. [Google Scholar] [CrossRef] [PubMed]
- Schnell, S.; Altrell, D.; Ståhl, G.; Kleinn, C. The contribution of trees outside forests to national tree biomass and carbon stocks—a comparative study across three continents. Environ. Monit. Assess. 2015, 187, 4197. [Google Scholar] [CrossRef] [PubMed]
- Mbow, C.; Van Noordwijk, M.; Luedeling, E.; Neufeldt, H.; Minang, P.A.; Kowero, G. Agroforestry solutions to address food security and climate change challenges in Africa. Curr. Opin. Environ. Sustain. 2014, 6, 61–67. [Google Scholar] [CrossRef] [Green Version]
- Beckschäfer, P.; Schnell, S.; Kleinn, C. Monitoring and Assessment of Trees Outside Forests (TOF). In Agroforestry; Dagar, J.C., Tewari, V.P., Eds.; Springer Nature: Singapore, 2017; pp. 137–161. [Google Scholar]
- Brandt, M.; Rasmussen, K.; Hiernaux, P.; Herrmann, S.; Tucker, C.J.; Tong, X.; Tian, F.; Mertz, O.; Kergoat, L.; Mbow, C.; et al. Reduction of tree cover in West African woodlands and promotion in semi-arid farmlands. Nat. Geosci. 2018, 11, 328–333. [Google Scholar] [CrossRef] [PubMed]
- Zomer, R.J.; Trabucco, A.; Coe, R.; Place, F. Trees on Farm: Analysis of Global Extent and Geographical Patterns of Agroforestry; ICRAF Working Paper-World Agroforestry Centre 89; World Agroforestry Centre: Nairobi, Kenya, 2009. [Google Scholar]
- Mbow, C.; Smith, P.; Skole, D.; Duguma, L.; Bustamante, M. Achieving mitigation and adaptation to climate change through sustainable agroforestry practices in Africa. Curr. Opin. Environ. Sustain. 2014, 6, 8–14. [Google Scholar] [CrossRef] [Green Version]
- Verchot, L.V.; Van Noordwijk, M.; Kandji, S.; Tomich, T.; Ong, C.; Albrecht, A.; Mackensen, J.; Bantilan, C.; Anupama, K.V.; Palm, C. Climate change: Linking adaptation and mitigation through agroforestry. Mitig. Adapt. Strateg. Glob. Chang. 2007, 12, 901–918. [Google Scholar] [CrossRef] [Green Version]
- Dardel, C.; Kergoat, L.; Hiernaux, P.; Mougin, E.; Grippa, M.; Tucker, C.J. Re-greening Sahel: 30 years of remote sensing data and field observations (Mali, Niger). Remote Sens. Environ. 2014, 140, 350–364. [Google Scholar] [CrossRef]
- Sitch, S.; Friedlingstein, P.; Gruber, N.; Jones, S.D.; Murray-Tortarolo, G.; Ahlström, A.; Doney, S.C.; Graven, H.; Heinze, C.; Huntingford, C.; et al. Recent trends and drivers of regional sources and sinks of carbon dioxide. Biogeosciences 2015, 12, 653–679. [Google Scholar] [CrossRef] [Green Version]
- Brandt, M.; Mbow, C.; Diouf, A.A.; Verger, A.; Samimi, C.; Fensholt, R. Ground-and satellite-based evidence of the biophysical mechanisms behind the greening Sahel. Glob. Chang. Biol. 2015, 21, 1610–1620. [Google Scholar] [CrossRef] [Green Version]
- Mbow, C.; Brandt, M.; Ouedraogo, I.; De Leeuw, J.; Marshall, M. What four decades of earth observation tell us about land degradation in the Sahel? Remote Sens. 2015, 7, 4048–4067. [Google Scholar] [CrossRef] [Green Version]
- Brandt, M.; Rasmussen, K.; Peñuelas, J.; Tian, F.; Schurgers, G.; Verger, A.; Mertz, O.; Palmer, J.R.; Fensholt, R. Human population growth offsets climate-driven increase in woody vegetation in sub-Saharan Africa. Nat. Ecol. Evol. 2017, 1, 81. [Google Scholar] [CrossRef] [PubMed] [Green Version]
- Brandt, M.; Tappan, G.; Diouf, A.A.; Beye, G.; Mbow, C.; Fensholt, R. Woody vegetation die off and regeneration in response to rainfall variability in the West African Sahel. Remote Sens. 2017, 9, 39. [Google Scholar] [CrossRef] [Green Version]
- Brandt, M.; Hiernaux, P.; Rasmussen, K.; Tucker, C.J.; Wigneron, J.P.; Diouf, A.A.; Herrmann, S.M.; Zhang, W.; Kergoat, L.; Mbow, C.; et al. Changes in rainfall distribution promote woody foliage production in the Sahel. Commun. Biol. 2019, 2, 133. [Google Scholar] [CrossRef]
- Zhang, W.; Brandt, M.; Guichard, F.; Tian, Q.; Fensholt, R. Using long-term daily satellite based rainfall data (1983–2015) to analyze spatio-temporal changes in the Sahelian rainfall regime. J. Hydrol. 2017, 550, 427–440. [Google Scholar] [CrossRef] [Green Version]
- Brandt, M.; Wigneron, J.P.; Chave, J.; Tagesson, T.; Penuelas, J.; Ciais, P.; Rasmussen, K.; Tian, F.; Mbow, C.; Al-Yaari, A.; et al. Satellite passive microwaves reveal recent climate-induced carbon losses in African drylands. Nat. Ecol. Evol. 2018, 2, 827–835. [Google Scholar] [CrossRef] [Green Version]
- Brandt, M.; Tucker, C.J.; Kariryaa, A.; Rasmussen, K.; Abel, C.; Small, J.; Chave, J.; Rasmussen, L.V.; Hiernaux, P.; Diouf, A.A.; et al. An unexpectedly large count of trees in the West African Sahara and Sahel. Nature 2020, 587, 78–82. [Google Scholar] [CrossRef]
- Walker, S.M.; Pearson, T.R.H.; Casarim, F.M.; Harris, N.; Petrova, S.; Grais, A.; Swails, E.; Netzer, M.; Goslee, K.M.; Brown, S. Standard Operating Procedures for Terrestrial Carbon Measurement; Version February 2018; Winrock International: Washington, DC, USA, 2012. [Google Scholar]
- Dons, K.; Smith-Hall, C.; Meilby, H.; Fensholt, R. Operationalizing measurement of forest degradation: Identification and quantification of charcoal production in tropical dry forests using very high resolution satellite imagery. Int. J. Appl. Earth Obs. Geoinf. 2015, 39, 18–27. [Google Scholar] [CrossRef]
- Niang-Diop, F.; Christensen, S.N.; Barfod, A.S.; Sambou, B.; Diop, M.; Goudiaby, A.; Padonou, E.A.; Lykke, A.M. Trees on farmlands in the western central part of Senegal: Implications for a carbon project. Int. J. Biol. Chem. Sci. 2020, 14, 1294–1307. [Google Scholar] [CrossRef]
- Mbow, C.; Verstraete, M.M.; Sambou, B.; Diaw, A.T.; Neufeldt, H. Allometric models for aboveground biomass in dry savanna trees of the Sudan and Sudan–Guinean ecosystems of Southern Senegal. J. For. Res. 2014, 19, 340–347. [Google Scholar] [CrossRef]
- Rasmussen, M.O.; Göttsche, F.M.; Diop, D.; Mbow, C.; Olesen, F.S.; Fensholt, R.; Sandholt, I. Tree survey and allometric models for tiger bush in northern Senegal and comparison with tree parameters derived from high resolution satellite data. Int. J. Appl. Earth Obs. Geoinf. 2011, 13, 517–527. [Google Scholar] [CrossRef]
- Kuyah, S.; Dietz, J.; Muthuri, C.; Jamnadass, R.; Mwangi, P.; Coe, R.; Neufeldt, H. Allometric equations for estimating biomass in agricultural landscapes: II. Aboveground biomass. Agric. Ecosyst. Environ. 2012, 158, 216–224. [Google Scholar] [CrossRef]
- Brown, S. Estimating Biomass and Biomass Change of Tropical Forests: A Primer; Forestry Paper 134; Food and Agriculture Organization of the United Nations: Rome, Italy, 1997. [Google Scholar]
- IPCC. Good Practice Guidance for Land Use, Land-Use Change and Forestry; Penman, J., Gytarsky, M., Hiraishi, T., Krug, T., Kruger, D., Pipatti, R., Buendia, L., Miwa, K., Ngara, T., Tanabe, K., et al., Eds.; IPCC National Greenhouse Gas Inventories Programme, Institute for Global Environmental Strategies: Hayama, Japan, 2003; 593p. [Google Scholar]
- IPCC. 2006 IPCC Guidelines for National Greenhouse Gas Inventories; Eggleston, H.S., Buendia, L., Miwa, K., Ngara, T., Tanabe, K., Eds.; IPCC National Greenhouse Gas Inventories Programme, Institute for Global Environmental Strategies: Hayama, Japan, 2006. [Google Scholar]
- Chabi, A.; Lautenbach, S.; Tondoh, J.E.; Orekan, V.O.A.; Adu-Bredu, S.; Kyei-Baffour, N.; Mama, V.J.; Fonweban, J. The relevance of using in situ carbon and nitrogen data and satellite images to assess aboveground carbon and nitrogen stocks for supporting national REDD+ programmes in Africa. Carbon Balance Manag. 2019, 14, 12. [Google Scholar] [CrossRef] [PubMed]
- Chave, J.; Réjou-Méchain, M.; Búrquez, A.; Chidumayo, E.; Colgan, M.S.; Delitti, W.B.; Duque, A.; Eid, T.; Fearnside, P.M.; Goodman, R.C.; et al. Improved allometric models to estimate the aboveground biomass of tropical trees. Glob. Chang. Biol. 2014, 20, 3177–3190. [Google Scholar] [CrossRef]
- Henry, M.; Picard, N.; Trotta, C.; Manlay, R.; Valentini, R.; Bernoux, M.; Saint-André, L. Estimating tree biomass of sub-Saharan African forests: A review of available allometric equations. Silva Fenn. 2011, 45, 477–569. [Google Scholar] [CrossRef] [Green Version]
- Balima, L.H.; Nacoulma, B.M.I.; Bayen, P.; Dimobe, K.; Kouamé, F.N.G.; Thiombiano, A. Aboveground biomass allometric equations and distribution of carbon stocks of the African oak (Afzelia africana Sm.) in Burkina Faso. J. For. Res. 2020, 31, 1699–1711. [Google Scholar] [CrossRef] [Green Version]
- Ganamé, M.; Bayen, P.; Ouédraogo, I.; Balima, L.H.; Thiombiano, A. Allometric models for improving aboveground biomass estimates in West African savanna ecosystems. Trees For. People 2021, 4, 100077. [Google Scholar] [CrossRef]
- Sawadogo, L.; Savadogo, P.; Tiveau, D.; Dayamba, S.D.; Zida, D.; Nouvellet, Y.; Oden, P.C.; Guinko, S. Allometric prediction of above-ground biomass of eleven woody tree species in the Sudanian savanna-woodland of West Africa. J. For. Res. 2010, 21, 475–481. [Google Scholar] [CrossRef]
- Chabi, A.; Lautenbach, S.; Orekan, V.O.A.; Kyei-Baffour, N. Allometric models and aboveground biomass stocks of a West African Sudan Savannah watershed in Benin. Carbon Balance Manag. 2016, 11, 16. [Google Scholar] [CrossRef] [Green Version]
- Bayen, P.; Noulèkoun, F.; Bognounou, F.; Lykke, A.M.; Djomo, A.; Lamers, J.P.; Thiombiano, A. Models for estimating aboveground biomass of four dryland woody species in Burkina Faso, West Africa. J. Arid. Environ. 2020, 180, 104205. [Google Scholar] [CrossRef]
- Moussa, M.; Mahamane, L.; Saadou, M. Allometric equations for biomass estimation of woody species and organic soil carbon stocks of agroforestry systems in West African: State of current knowledge. Int. J. Res. 2015, 2, 17–33. [Google Scholar]
- Kuyah, S.; Muthuri, C.; Jamnadass, R.; Mwangi, P.; Neufeldt, H.; Dietz, J. Crown area allometries for estimation of aboveground tree biomass in agricultural landscapes of western Kenya. Agrofor. Syst. 2012, 86, 267–277. [Google Scholar] [CrossRef]
- Leite, R.V.; Silva, C.A.; Mohan, M.; Cardil, A.; Almeida, D.R.A.D.; Jaafar, W.S.W.M.; Guerra-Hernández, J.; Weiskittel, A.; Hudak, A.T.; Broadbent, E.N. Individual Tree Attribute Estimation and Uniformity Assessment io Fast-Growiog Eucalyptus spp. Forest Plantations Usiog Lidar and Lioear Mixed-Effects Models. Remote Sens. 2020, 12, 3599. [Google Scholar] [CrossRef]
- Woomer, P.L.; Touré, A.; Sall, M. Carbon stocks in Senegal’s Sahel transition zone. J. Arid. Environ. 2004, 59, 499–510. [Google Scholar] [CrossRef]
- Lutz, J.A.; Furniss, T.J.; Johnson, D.J.; Davies, S.J.; Allen, D.; Alonso, A.; Anderson-Teixeira, K.J.; Andrade, A.; Baltzer, J.; Becker, K.M.; et al. Global importance of large-diameter trees. Glob. Ecol. Biogeogr. 2018, 27, 849–864. [Google Scholar] [CrossRef] [Green Version]
- Ali, A.; Lin, S.L.; He, J.K.; Kong, F.M.; Yu, J.H.; Jiang, H.S. Big-sized trees overrule remaining trees’ attributes and species richness as determinants of aboveground biomass in tropical forests. Glob. Chang. Biol. 2019, 25, 2810–2824. [Google Scholar] [CrossRef]
- Latifi, H.; Heurich, M. Multi-scale remote sensing-assisted forest inventory: A glimpse of the state-of-the-art and future prospects. Remote Sens. 2019, 11, 1260. [Google Scholar] [CrossRef] [Green Version]
- Almeida, D.R.A.D.; Stark, S.C.; Chazdon, R.; Nelson, B.W.; César, R.G.; Meli, P.; Gorgens, E.B.; Duarte, M.M.; Valbuena, R.; Moreno, V.S.; et al. The effectiveness of lidar remote sensing for monitoring forest cover attributes and landscape restoration. For. Ecol. Manag. 2019, 438, 34–43. [Google Scholar] [CrossRef]
- Muller-Landau, H.C.; Condit, R.S.; Chave, J.; Thomas, S.C.; Bohlman, S.A.; Bunyavejchewin, S.; Davies, S.; Foster, R.; Gunatilleke, S.; Gunatilleke, N.; et al. Testing metabolic ecology theory for allometric scaling of tree size, growth and mortality in tropical forests. Ecol. Lett. 2006, 9, 575–588. [Google Scholar] [CrossRef]
- Jucker, T.; Caspersen, J.; Chave, J.; Antin, C.; Barbier, N.; Bongers, F.; Dalponte, M.; van Ewijk, K.Y.; Forrester, D.I.; Haeni, M.; et al. Allometric equations for integrating remote sensing imagery into forest monitoring programmes. Glob. Chang. Biol. 2017, 23, 177–190. [Google Scholar] [CrossRef]
- Hemery, G.E.; Savill, P.S.; Pryor, S.N. Applications of the crown diameter–stem diameter relationship for different species of broadleaved trees. For. Ecol. Manag. 2005, 215, 285–294. [Google Scholar] [CrossRef]
- Loubota Panzou, G.J.; Fayolle, A.; Jucker, T.; Phillips, O.L.; Bohlman, S.; Banin, L.F.; Lewis, S.L.; Affum-Baffoe, K.; Alves, L.F.; Antin, C.; et al. Pantropical variability in tree crown allometry. Glob. Ecol. Biogeogr. 2021, 30, 459–475. [Google Scholar] [CrossRef]
- Baccini, A.; Laporte, N.; Goetz, S.J.; Sun, M.; Dong, H. A first map of tropical Africa’s above-ground biomass derived from satellite imagery. Environ. Res. Lett. 2008, 3, 045011. [Google Scholar] [CrossRef] [Green Version]
- Zarin, D.J.; Harris, N.L.; Baccini, A.; Aksenov, D.; Hansen, M.C.; Azevedo-Ramos, C.; Azevedo, T.; Margono, B.A.; Alencar, A.C.; Gabris, C.; et al. Can carbon emissions from tropical deforestation drop by 50% in 5 years? Glob. Chang. Biol. 2016, 22, 1336–1347. [Google Scholar] [CrossRef] [Green Version]
- Baccini, A.G.S.J.; Goetz, S.J.; Walker, W.S.; Laporte, N.T.; Sun, M.; Sulla-Menashe, D.; Hackler, J.; Beck, P.S.A.; Dubayah, R.; Friedl, M.A.; et al. Estimated carbon dioxide emissions from tropical deforestation improved by carbon-density maps. Nat. Clim. Chang. 2012, 2, 182–185. [Google Scholar] [CrossRef]
- Saatchi, S.S.; Harris, N.L.; Brown, S.; Lefsky, M.; Mitchard, E.T.; Salas, W.; Zutta, B.R.; Buermann, W.; Lewis, S.L.; Hagen, S.; et al. Benchmark map of forest carbon stocks in tropical regions across three continents. Proc. Natl. Acad. Sci. USA 2011, 108, 9899–9904. [Google Scholar] [CrossRef] [PubMed] [Green Version]
- Spawn, S.A.; Sullivan, C.C.; Lark, T.J.; Gibbs, H.K. Harmonized global maps of above and belowground biomass carbon density in the year 2010. Sci. Data 2020, 7, 112. [Google Scholar] [CrossRef] [PubMed]
- Skole, D.L.; Mbow, C.; Mugabowindekwe, M.; Brandt, M.S.; Samek, J.H. Trees outside of forests as natural climate solutions. Nat. Clim. Chang. 2021, 11. [Google Scholar] [CrossRef]
- Verdone, M.; Seidl, A. Time, space, place, and the Bonn Challenge global forest restoration target. Restor. Ecol. 2017, 25, 903–911. [Google Scholar] [CrossRef]
- Stanturf, J.A.; Kleine, M.; Mansourian, S.; Parrotta, J.; Madsen, P.; Kant, P.; Burns, J.; Bolte, A. Implementing forest landscape restoration under the Bonn Challenge: A systematic approach. Ann. For. Sci. 2019, 76, 50. [Google Scholar] [CrossRef]
- Guariguata, M.R.; Evans, K. A diagnostic for collaborative monitoring in forest landscape restoration. Restor. Ecol. 2020, 28, 742–749. [Google Scholar] [CrossRef]
- Mansourian, S.; Dudley, N.; Vallauri, D. Forest landscape restoration: Progress in the last decade and remaining challenges. Ecol. Restor. 2017, 35, 281–288. [Google Scholar] [CrossRef]
Figure 1.
Location of the study site in the Sudano-Sahelian zone of Senegal. (A) The red box indicates the location of the data collection in the vicinity of Sokone. (B) The blue box indicates the location of validation, vicinity of Karang.
Figure 1.
Location of the study site in the Sudano-Sahelian zone of Senegal. (A) The red box indicates the location of the data collection in the vicinity of Sokone. (B) The blue box indicates the location of validation, vicinity of Karang.

Figure 2.
The test site for remote sensing mapping and field data collection. The test site measures 3366 ha in a square area that is divided into nine blocks for field sampling. Field data collection of tree parameters from individual open grown trees outside of forests was conducted along a north–south transect of three blocks. One hectare sample plots were identified and all trees within sample plots were measured. The yellow circles show the location of one or more sample plots and the number of trees sampled.

Figure 3.
Example components of the landscape from VHR data (left) and processed crown projected areas for individual trees (right). The size of the circle represents the crown projected area (m2). All trees in the 3336 ha test site were processed for crown projected area.
Figure 3.
Example components of the landscape from VHR data (left) and processed crown projected areas for individual trees (right). The size of the circle represents the crown projected area (m2). All trees in the 3336 ha test site were processed for crown projected area.

Figure 4.
Tree cover mapping for the entire test site from mapping individual tree crown areas. (A) Individual trees mapped at the original 0.5 m spatial resolution, color-coding represents the cover area per tree (m2 per tree). (B) Mapping cover density at the 1 ha level, produced by the summation individual tree crown projected area for all trees in the 1 ha grid cell (m2 ha−1).

Figure 5.
Constructed model of the OLS linear regression of field measured tree diameter at breast height (DBH) and the remote sensing derived crown projected area (CPA).
Figure 5.
Constructed model of the OLS linear regression of field measured tree diameter at breast height (DBH) and the remote sensing derived crown projected area (CPA).

Figure 6.
Assessment of the accuracy of the predicted DBH against field measured DBH values. The one-to-one correspondence line is a solid line and the linear fit to the data is a dashed line.
Figure 6.
Assessment of the accuracy of the predicted DBH against field measured DBH values. The one-to-one correspondence line is a solid line and the linear fit to the data is a dashed line.
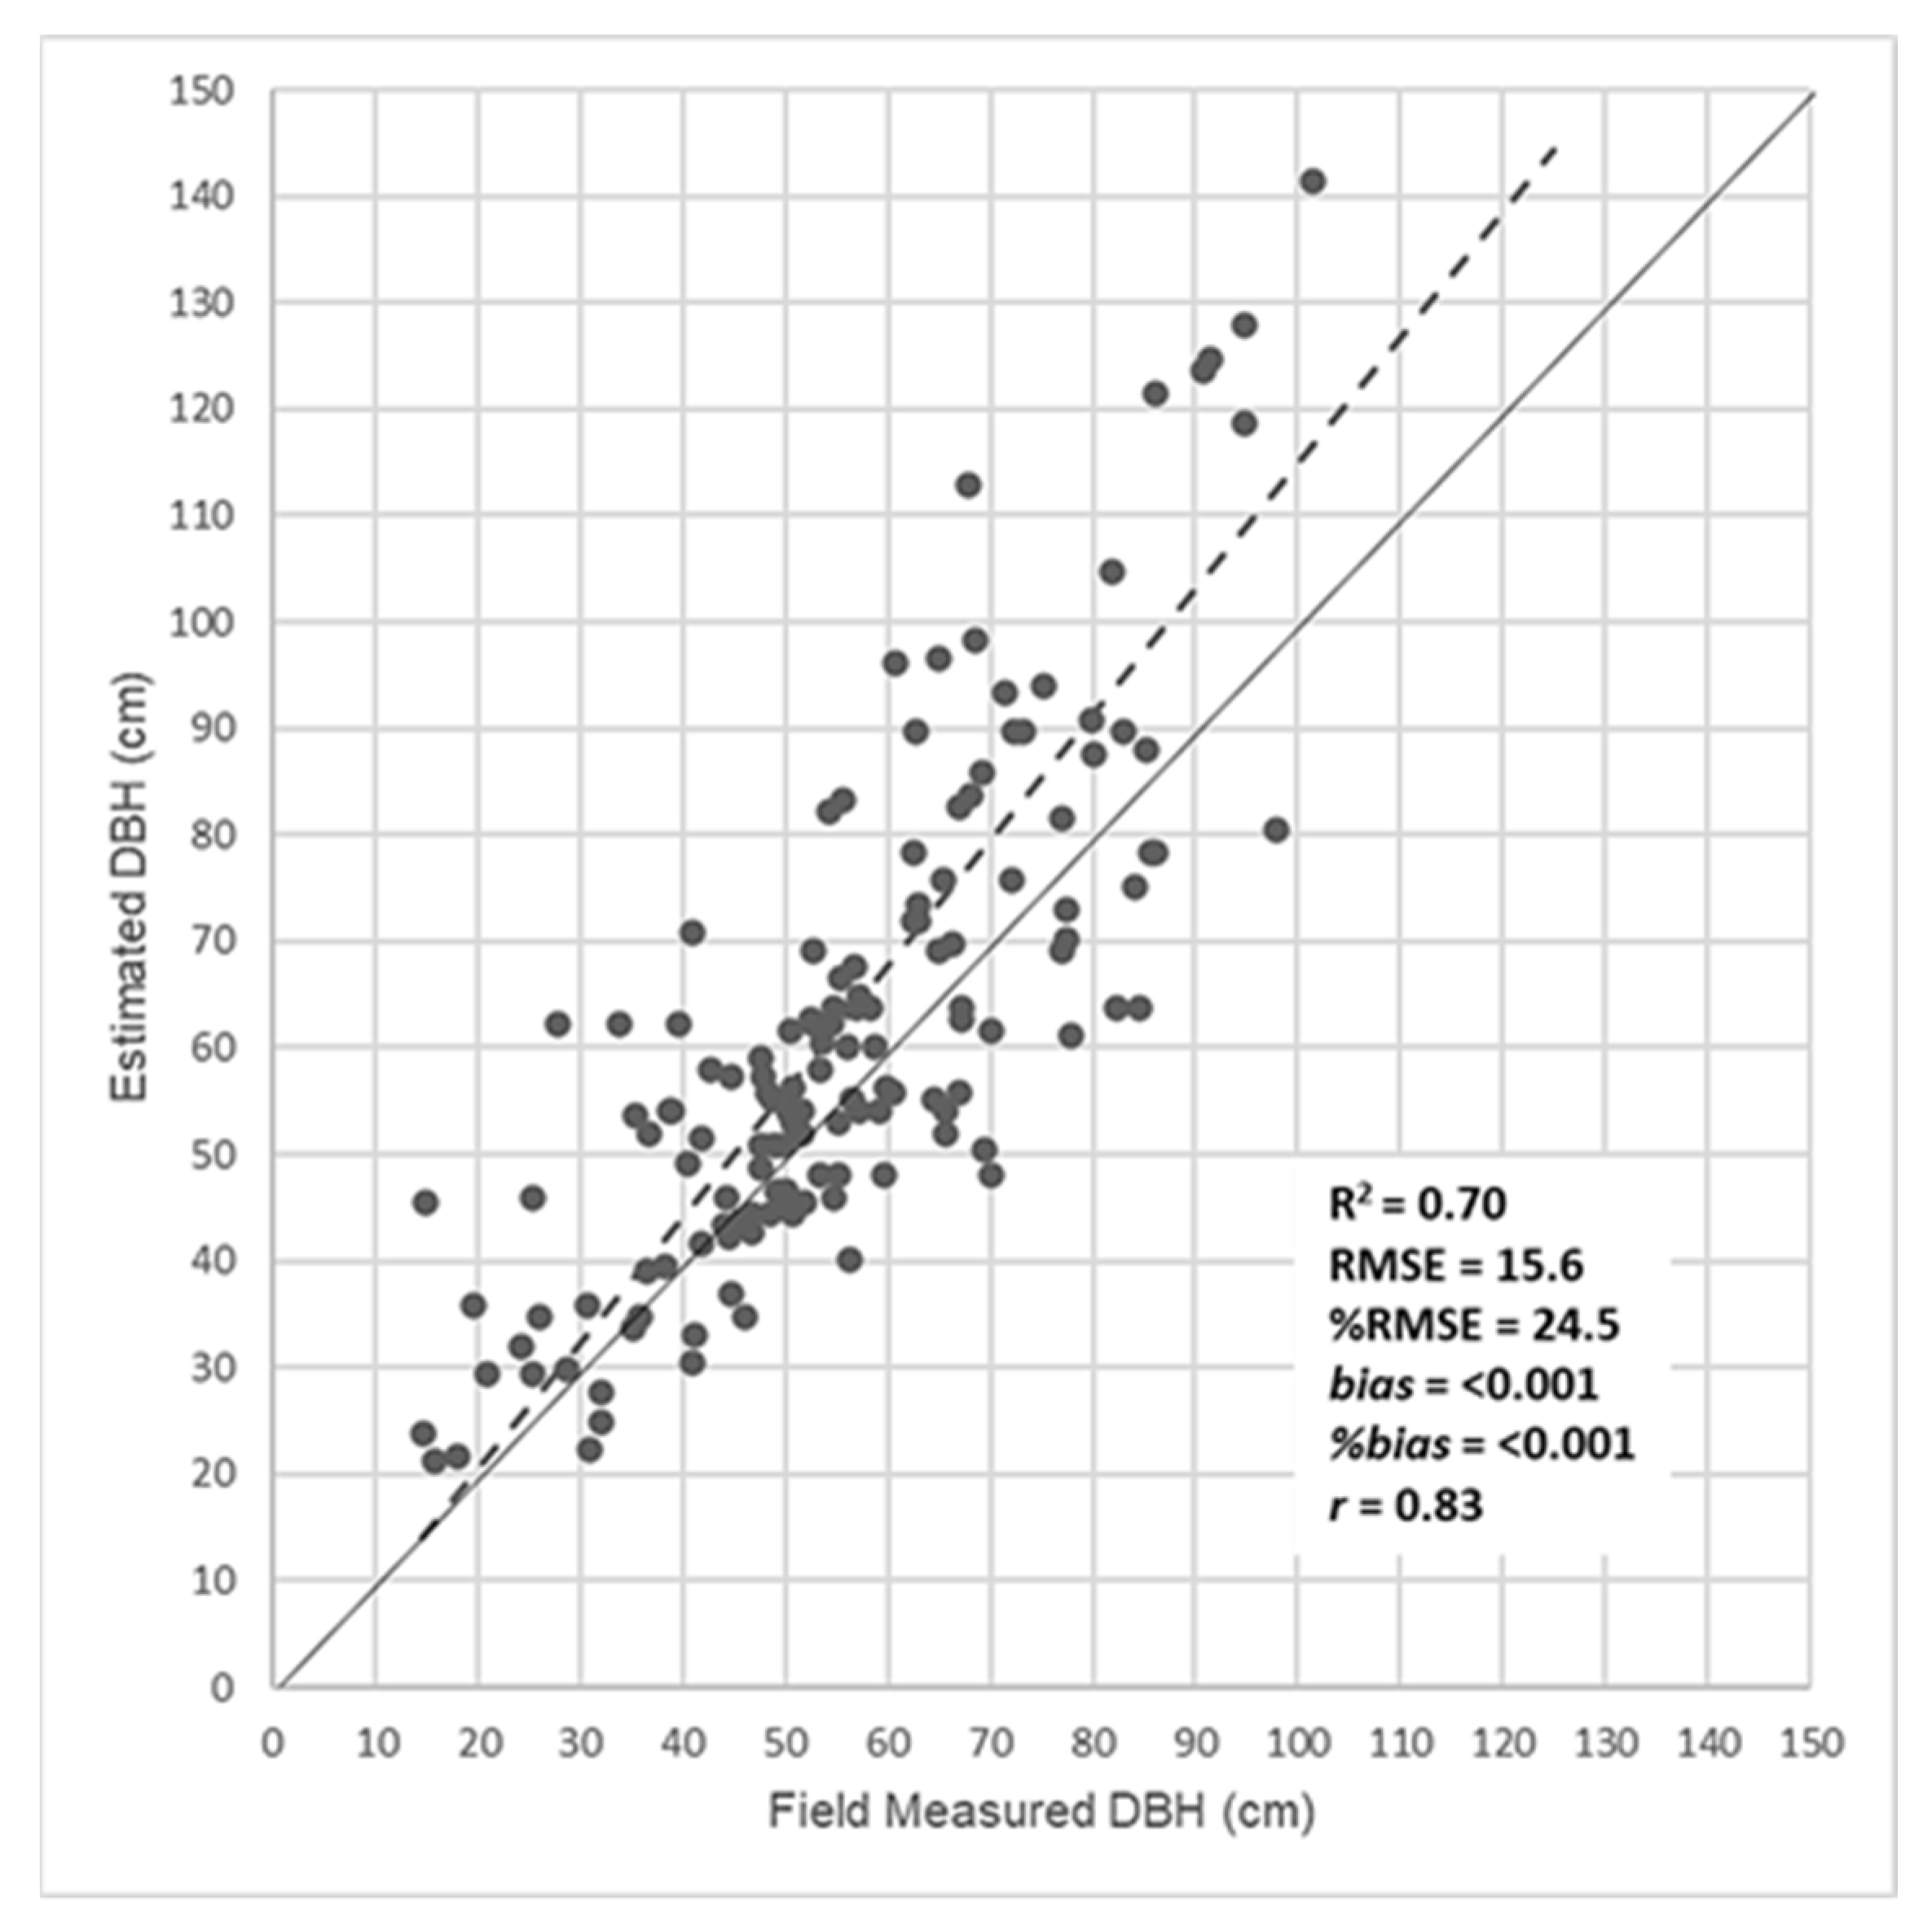
Figure 7.
Examples of VHR remote sensing tree carbon mapping product. The area of the crown is mapped by the size of the polygons and carbon stock per tree is colored in a green shade, where darker color indicates higher carbon.
Figure 7.
Examples of VHR remote sensing tree carbon mapping product. The area of the crown is mapped by the size of the polygons and carbon stock per tree is colored in a green shade, where darker color indicates higher carbon.
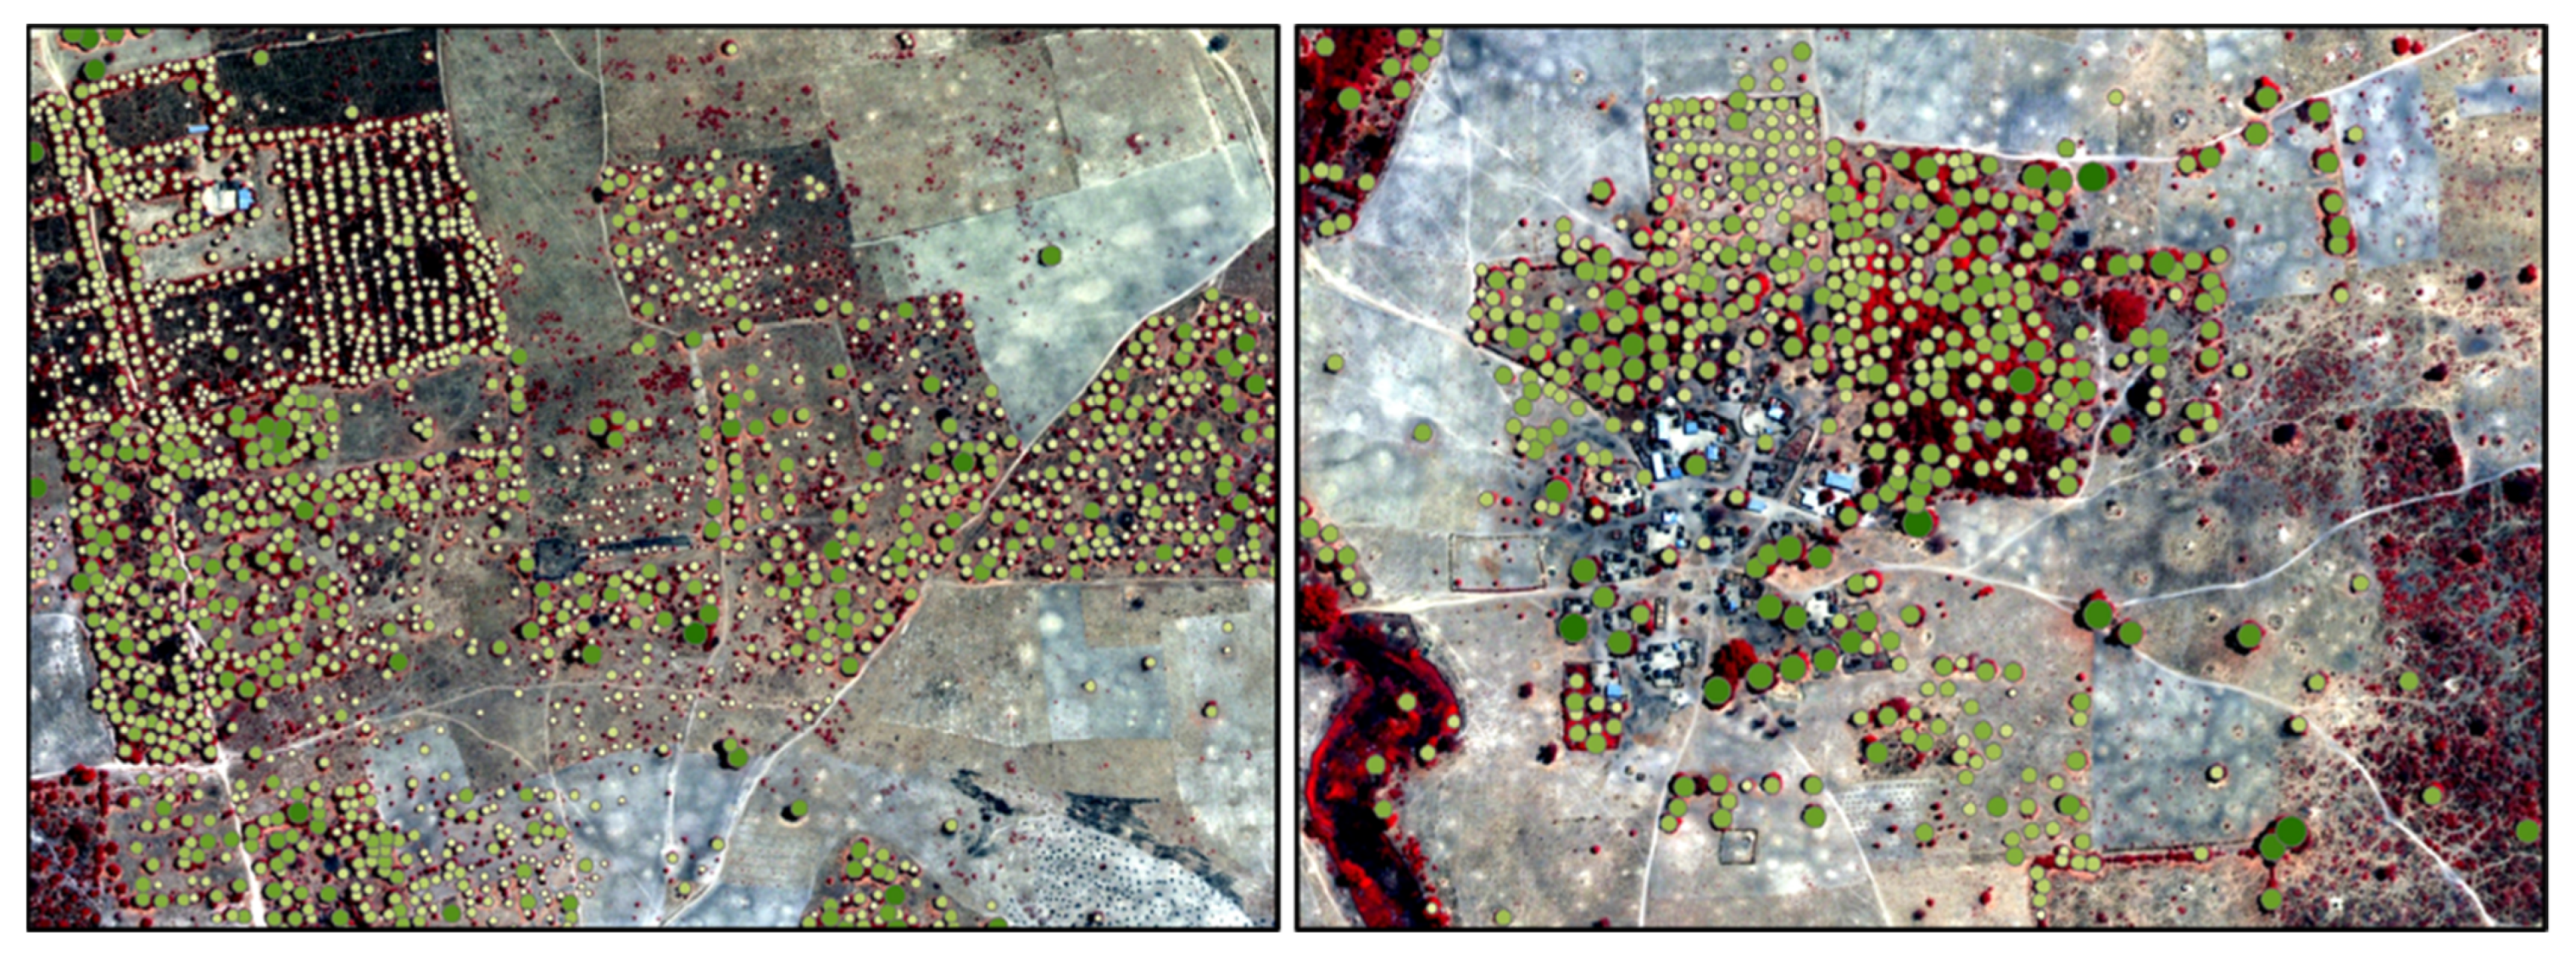
Figure 8.
Size class distribution of mapped CPA. (A) The distribution of the number of individual trees from this study by class of tree-CPA (m2) and (B) comparison with the automated mapping from Brandt et al. Both the number of trees overall and the shape of the distribution differed, with the highest frequency class for this analysis centered on medium size trees while considerably more small trees were mapped by Brandt et al.

Figure 9.
The distribution of tree carbon (Mg), where (A) is from this study and (B) is from the data presented in Brandt et al. The majority of trees were in the low carbon stock classes in the Brandt et al. dataset while medium size trees were the most frequent in this study.
Figure 9.
The distribution of tree carbon (Mg), where (A) is from this study and (B) is from the data presented in Brandt et al. The majority of trees were in the low carbon stock classes in the Brandt et al. dataset while medium size trees were the most frequent in this study.

Figure 10.
Contribution to the total landscape carbon (Mg) by trees in different size classes. Shown are results from this study compared to Brandt et al. for trees in a sequence of 50 m2 CPA intervals. The largest differences were trees in the 251–300 m2 CPA interval.
Figure 10.
Contribution to the total landscape carbon (Mg) by trees in different size classes. Shown are results from this study compared to Brandt et al. for trees in a sequence of 50 m2 CPA intervals. The largest differences were trees in the 251–300 m2 CPA interval.

Figure 11.
Comparison between landscape carbon estimates from this study and notable coarse resolution data. (A) Carbon from Baccini et al. using MODIS, 500 m data 25 ha grid. (B) This study when aggregated to 25 ha. (C) Carbon from Zarin et al. [53] using Landsat 30 m data, aggregated to 1 ha. (D) This study when individual tree measurements were aggregated at 1 ha.

Figure 12.
Tree cover from Landsat data for the landscapes in our study area from Hansen et al. (left) and with trees from this study overlaid (right). Individual trees from the present study are shown in green.
Figure 12.
Tree cover from Landsat data for the landscapes in our study area from Hansen et al. (left) and with trees from this study overlaid (right). Individual trees from the present study are shown in green.


Table 1.
Biomass allometry and carbon estimation parameters.
| Estimate of Tree Diameter, DBH | DBH = 0.5389 × Crs + 15.835 |
|---|---|
| Aboveground Biomass [26] | AGB = 1.929 × DBH − 0.116 × DBH2 + 0.013 × DBH3 |
| Aboveground Biomass [29,30,31] | AGB = EXP(−1.996 + 2.32 × ln(DBH)) |
| Aboveground Biomass [28] | AGB = 0.091 × DBH2.472 |
| Belowground Biomass Factor | BGB = AGB × 0.26 |
| Biomass–Carbon Conversion | C = (AGB + BGB) × 0.5 |
Table 2.
Carbon stock estimates. Results of this study analysis and compared using the alternative tree cover map from Brandt et al. and carbon stocks using two alternative allometric equations.
Table 2.
Carbon stock estimates. Results of this study analysis and compared using the alternative tree cover map from Brandt et al. and carbon stocks using two alternative allometric equations.
| Study Area (ha) | Total Trees | Total Tree Cover (m2) | Stem Density (trees ha−1) | Tree Cover Percent | Carbon Density (MgC ha−1) | Total Carbon (MgC) 1 | |
|---|---|---|---|---|---|---|---|
| This study | 3336 | 29,835 | 1.923 × 10⁶ | 8 | 5.0 | 13 | 44.28 × 10³ |
| Brandt et al. [22] | 3336 | 44,070 | 2.416 × 10⁶ | 12 | 7.0 | 22 | 73.35 × 10³ |
| Brown [29] | 9 | 29.60 × 10³ | |||||
| Kuyah et al. [28] | 11 | 37.72 × 10³ |
1 Note: Total carbon in this study and Brandt used the allometric equations from Mbow. Total carbon entered for Brown and Kuyah used the tree cover map data from this study.
Table 3.
Tree crown area (m2), DBH (cm), and carbon (Mg) descriptive statistics.
| This Study | Brandt et al. 2020 | |||||
|---|---|---|---|---|---|---|
| Tree Crown | Tree Diameter | Tree Carbon | Tree Crown | Tree Diameter | Tree Carbon | |
| Mean | 64.48 | 50.59 | 1.48 | 52.61 | 44.18 | 1.67 |
| Standard Error | 0.208 | 0.112 | 0.017 | 0.238 | 0.128 | 0.019 |
| Median | 56.07 | 46.05 | 0.70 | 36.75 | 35.64 | 0.30 |
| Mode | 49.23 | 42.37 | 0.54 | 5.50 | 19.07 | 0.03 |
| Kurtosis | 5.821 | 5.82 | 67.49 | 4.321 | 4.32 | 23.813 |
| Skewness | 1.86 | 1.86 | 7.08 | 1.94 | 1.94 | 4.515 |
| Minimum | 5.47 | 18.78 | 0.05 | 3.00 | 17.45 | 0.022 |
| Maximum | 298.13 | 176.50 | 42.97 | 299.50 | 177.24 | 35.17 |
| Sum | 1,924,000 | 1,509,281 | 44,283 | 2,318,555 | 1,947,318 | 73,912 |
| Count | 29,835 | 29,835 | 29,835 | 44,070 | 44,070 | 44,070 |
Table 4.
Comparison of Brandt with this study.
| CPA Size Class (m2) | Number of Brandt Trees | Number of Brandt Trees also Mapped by This Study | % of Brandt Trees also Mapped by This Study | MSU Centroids That Overlap Brandt |
|---|---|---|---|---|
| 251–300 | 380 | 322 | 84.7% | 514 |
| 201–250 | 738 | 582 | 78.8% | 846 |
| 151–200 | 1445 | 967 | 66.9% | 1207 |
| 101–150 | 3473 | 1591 | 45.8% | 1735 |
| 51–100 | 10,484 | 1923 | 18.3% | 2010 |
| 1–50 | 27,550 | 894 | 3.2% | 899 |
Table 5.
Sources of carbon estimation differences between this study and the Brandt et al. dataset.
| CPA Size Class (m2) | 1 Tree with Overlap (MgC) Case 2: Size Measure | 2 Trees with Overlap (MgC) Case 3: Clustering | 3–5 Trees with Overlap (MgC) Case 3: Clustering |
|---|---|---|---|
| 250–300 | 4540 | 3095 | 1408 |
| 200–250 | 5078 | 2747 | 868 |
| 150–200 | 4915 | 1432 | 232 |
| 100–150 | 3435 | 304 | 33 |
| 50–100 | 158 | −11 | 2 |
| 0–50 | −486 | −4 | −1 |
| Total | 17640 | 7563 | 2542 |
Publisher’s Note: MDPI stays neutral with regard to jurisdictional claims in published maps and institutional affiliations. |
© 2021 by the authors. Licensee MDPI, Basel, Switzerland. This article is an open access article distributed under the terms and conditions of the Creative Commons Attribution (CC BY) license (https://creativecommons.org/licenses/by/4.0/).
Share and Cite
MDPI and ACS Style
Skole, D.L.; Samek, J.H.; Dieng, M.; Mbow, C. The Contribution of Trees Outside of Forests to Landscape Carbon and Climate Change Mitigation in West Africa. Forests 2021, 12, 1652. https://doi.org/10.3390/f12121652
AMA Style
Skole DL, Samek JH, Dieng M, Mbow C. The Contribution of Trees Outside of Forests to Landscape Carbon and Climate Change Mitigation in West Africa. Forests. 2021; 12(12):1652. https://doi.org/10.3390/f12121652
Chicago/Turabian StyleSkole, David L., Jay H. Samek, Moussa Dieng, and Cheikh Mbow. 2021. "The Contribution of Trees Outside of Forests to Landscape Carbon and Climate Change Mitigation in West Africa" Forests 12, no. 12: 1652. https://doi.org/10.3390/f12121652
Note that from the first issue of 2016, this journal uses article numbers instead of page numbers. See further details here.