
Mapping and Monitoring Forest Plantations in São Paulo State, Southeast Brazil, Using Fraction Images Derived from Multiannual Landsat Sensor Images
 ,
,  , ,
, ,  , ,
, ,
Abstract
:1. Introduction
2. Materials and Methods
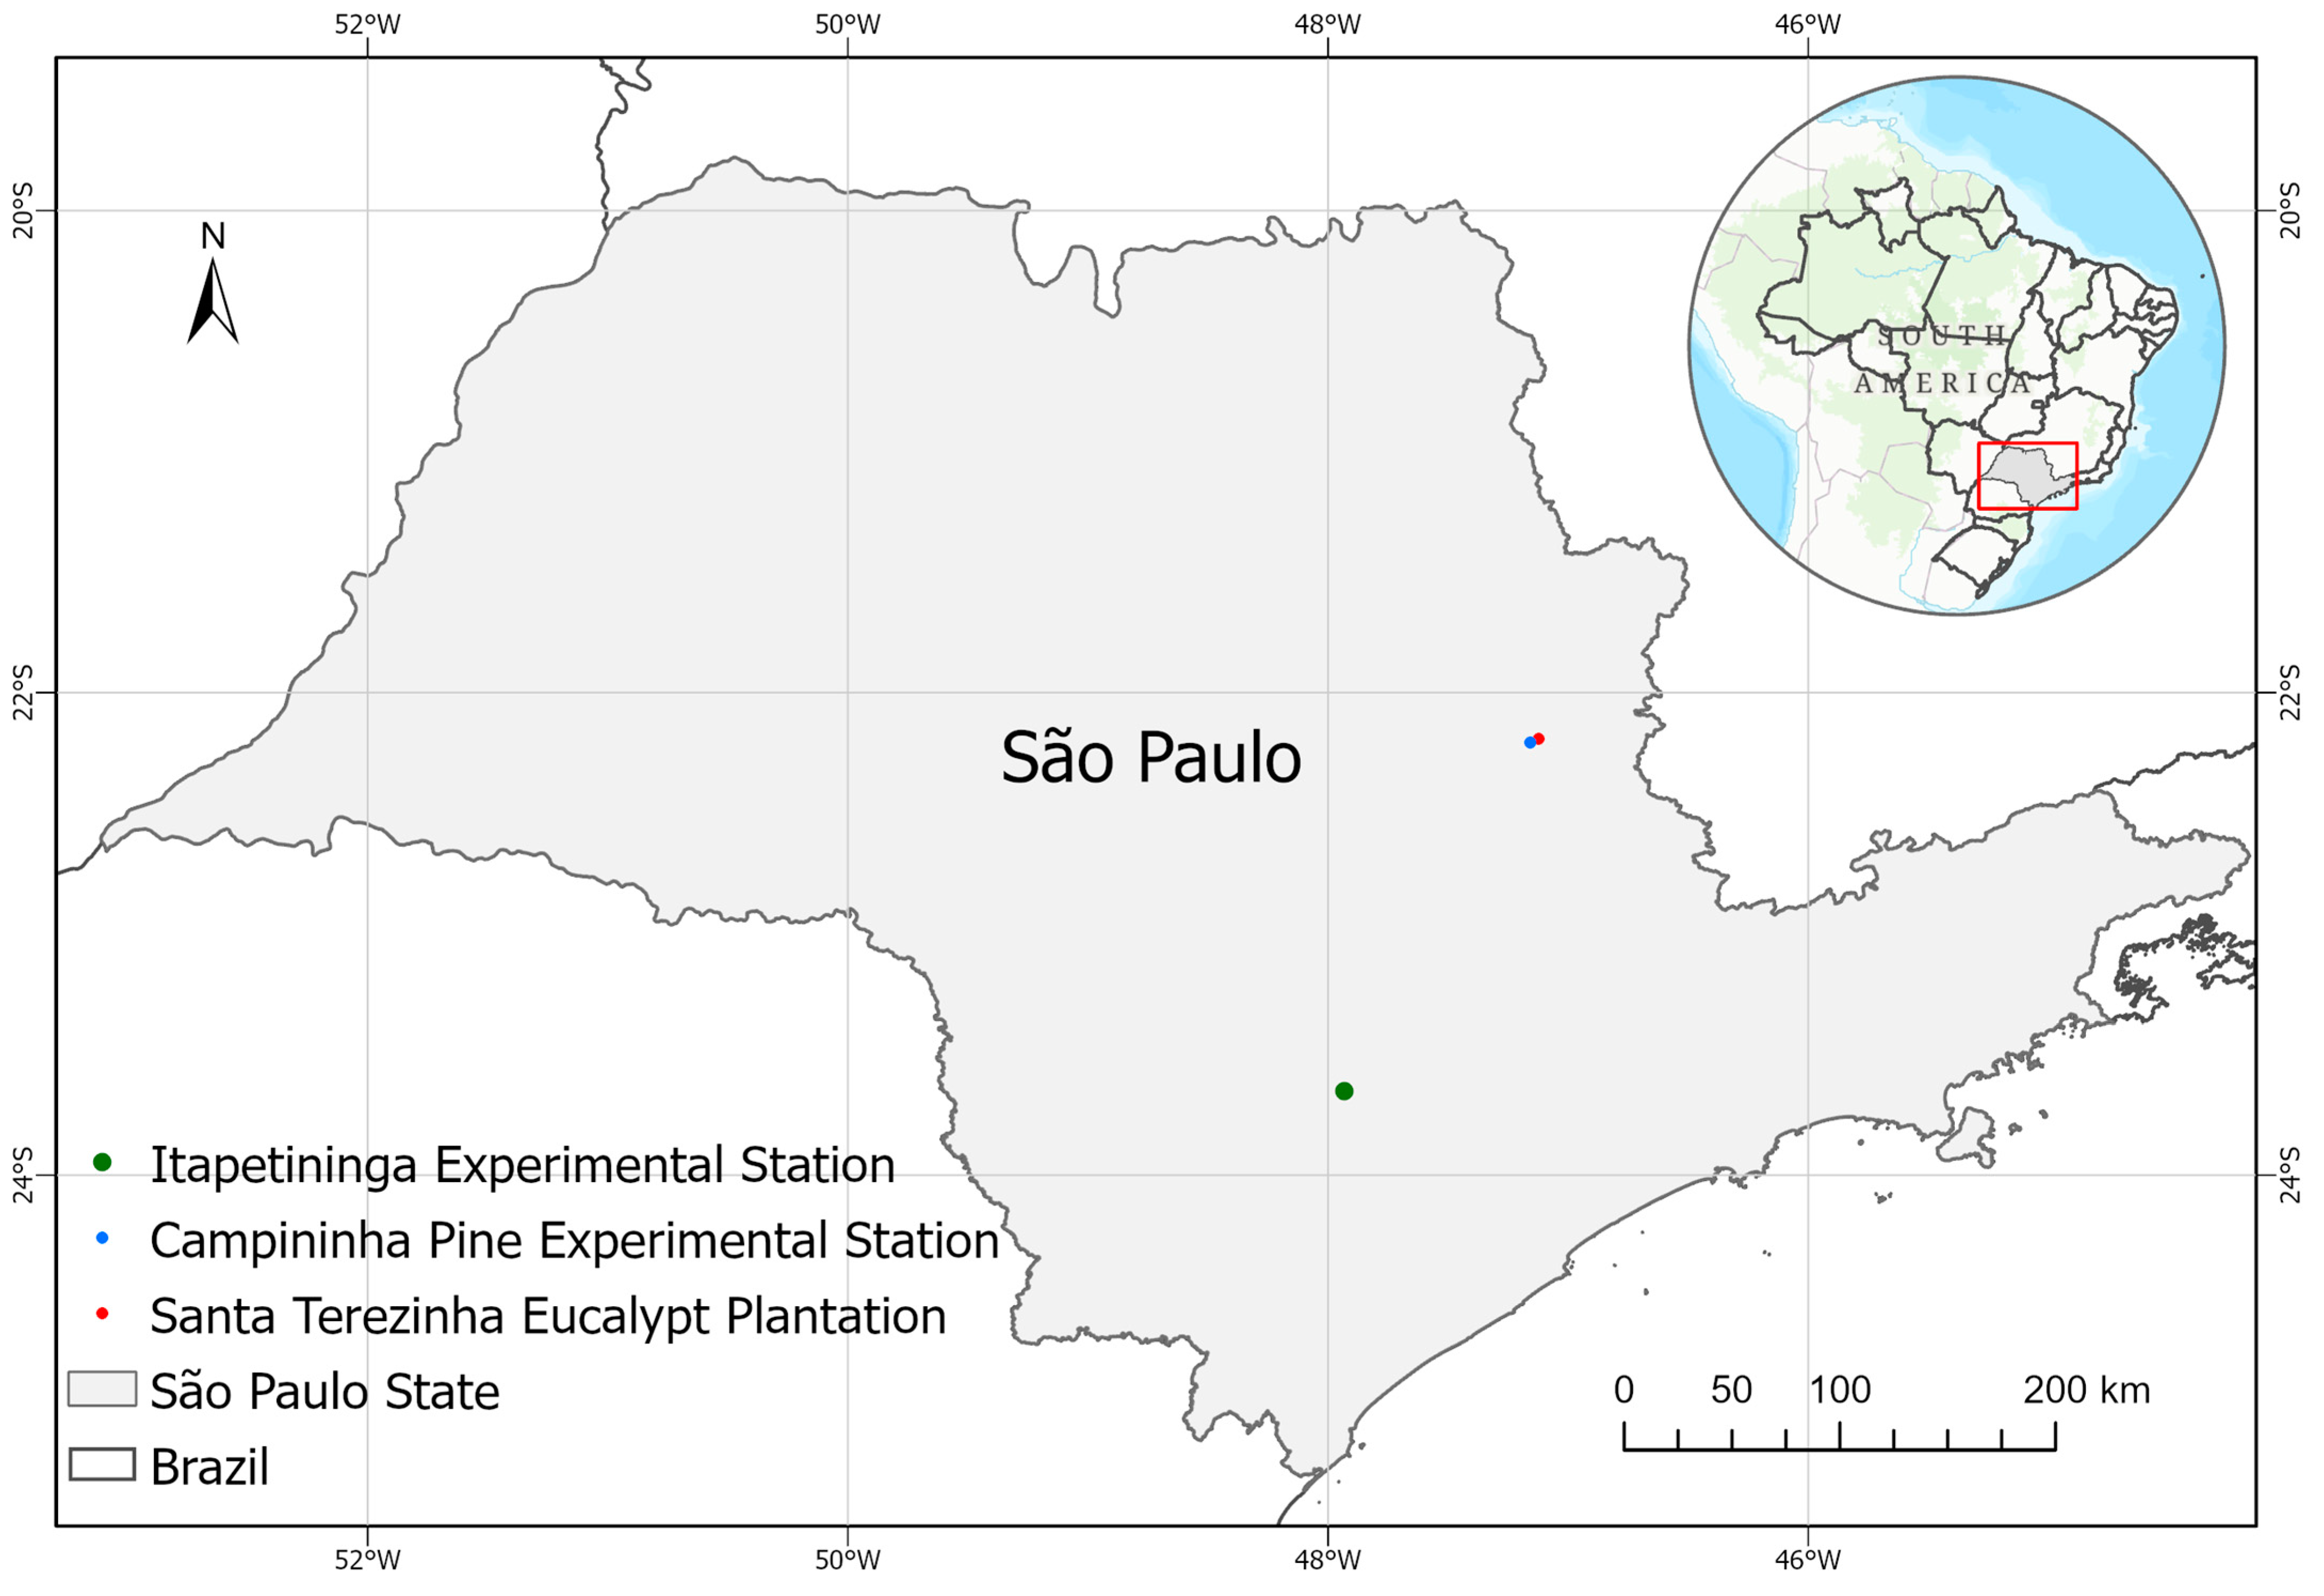
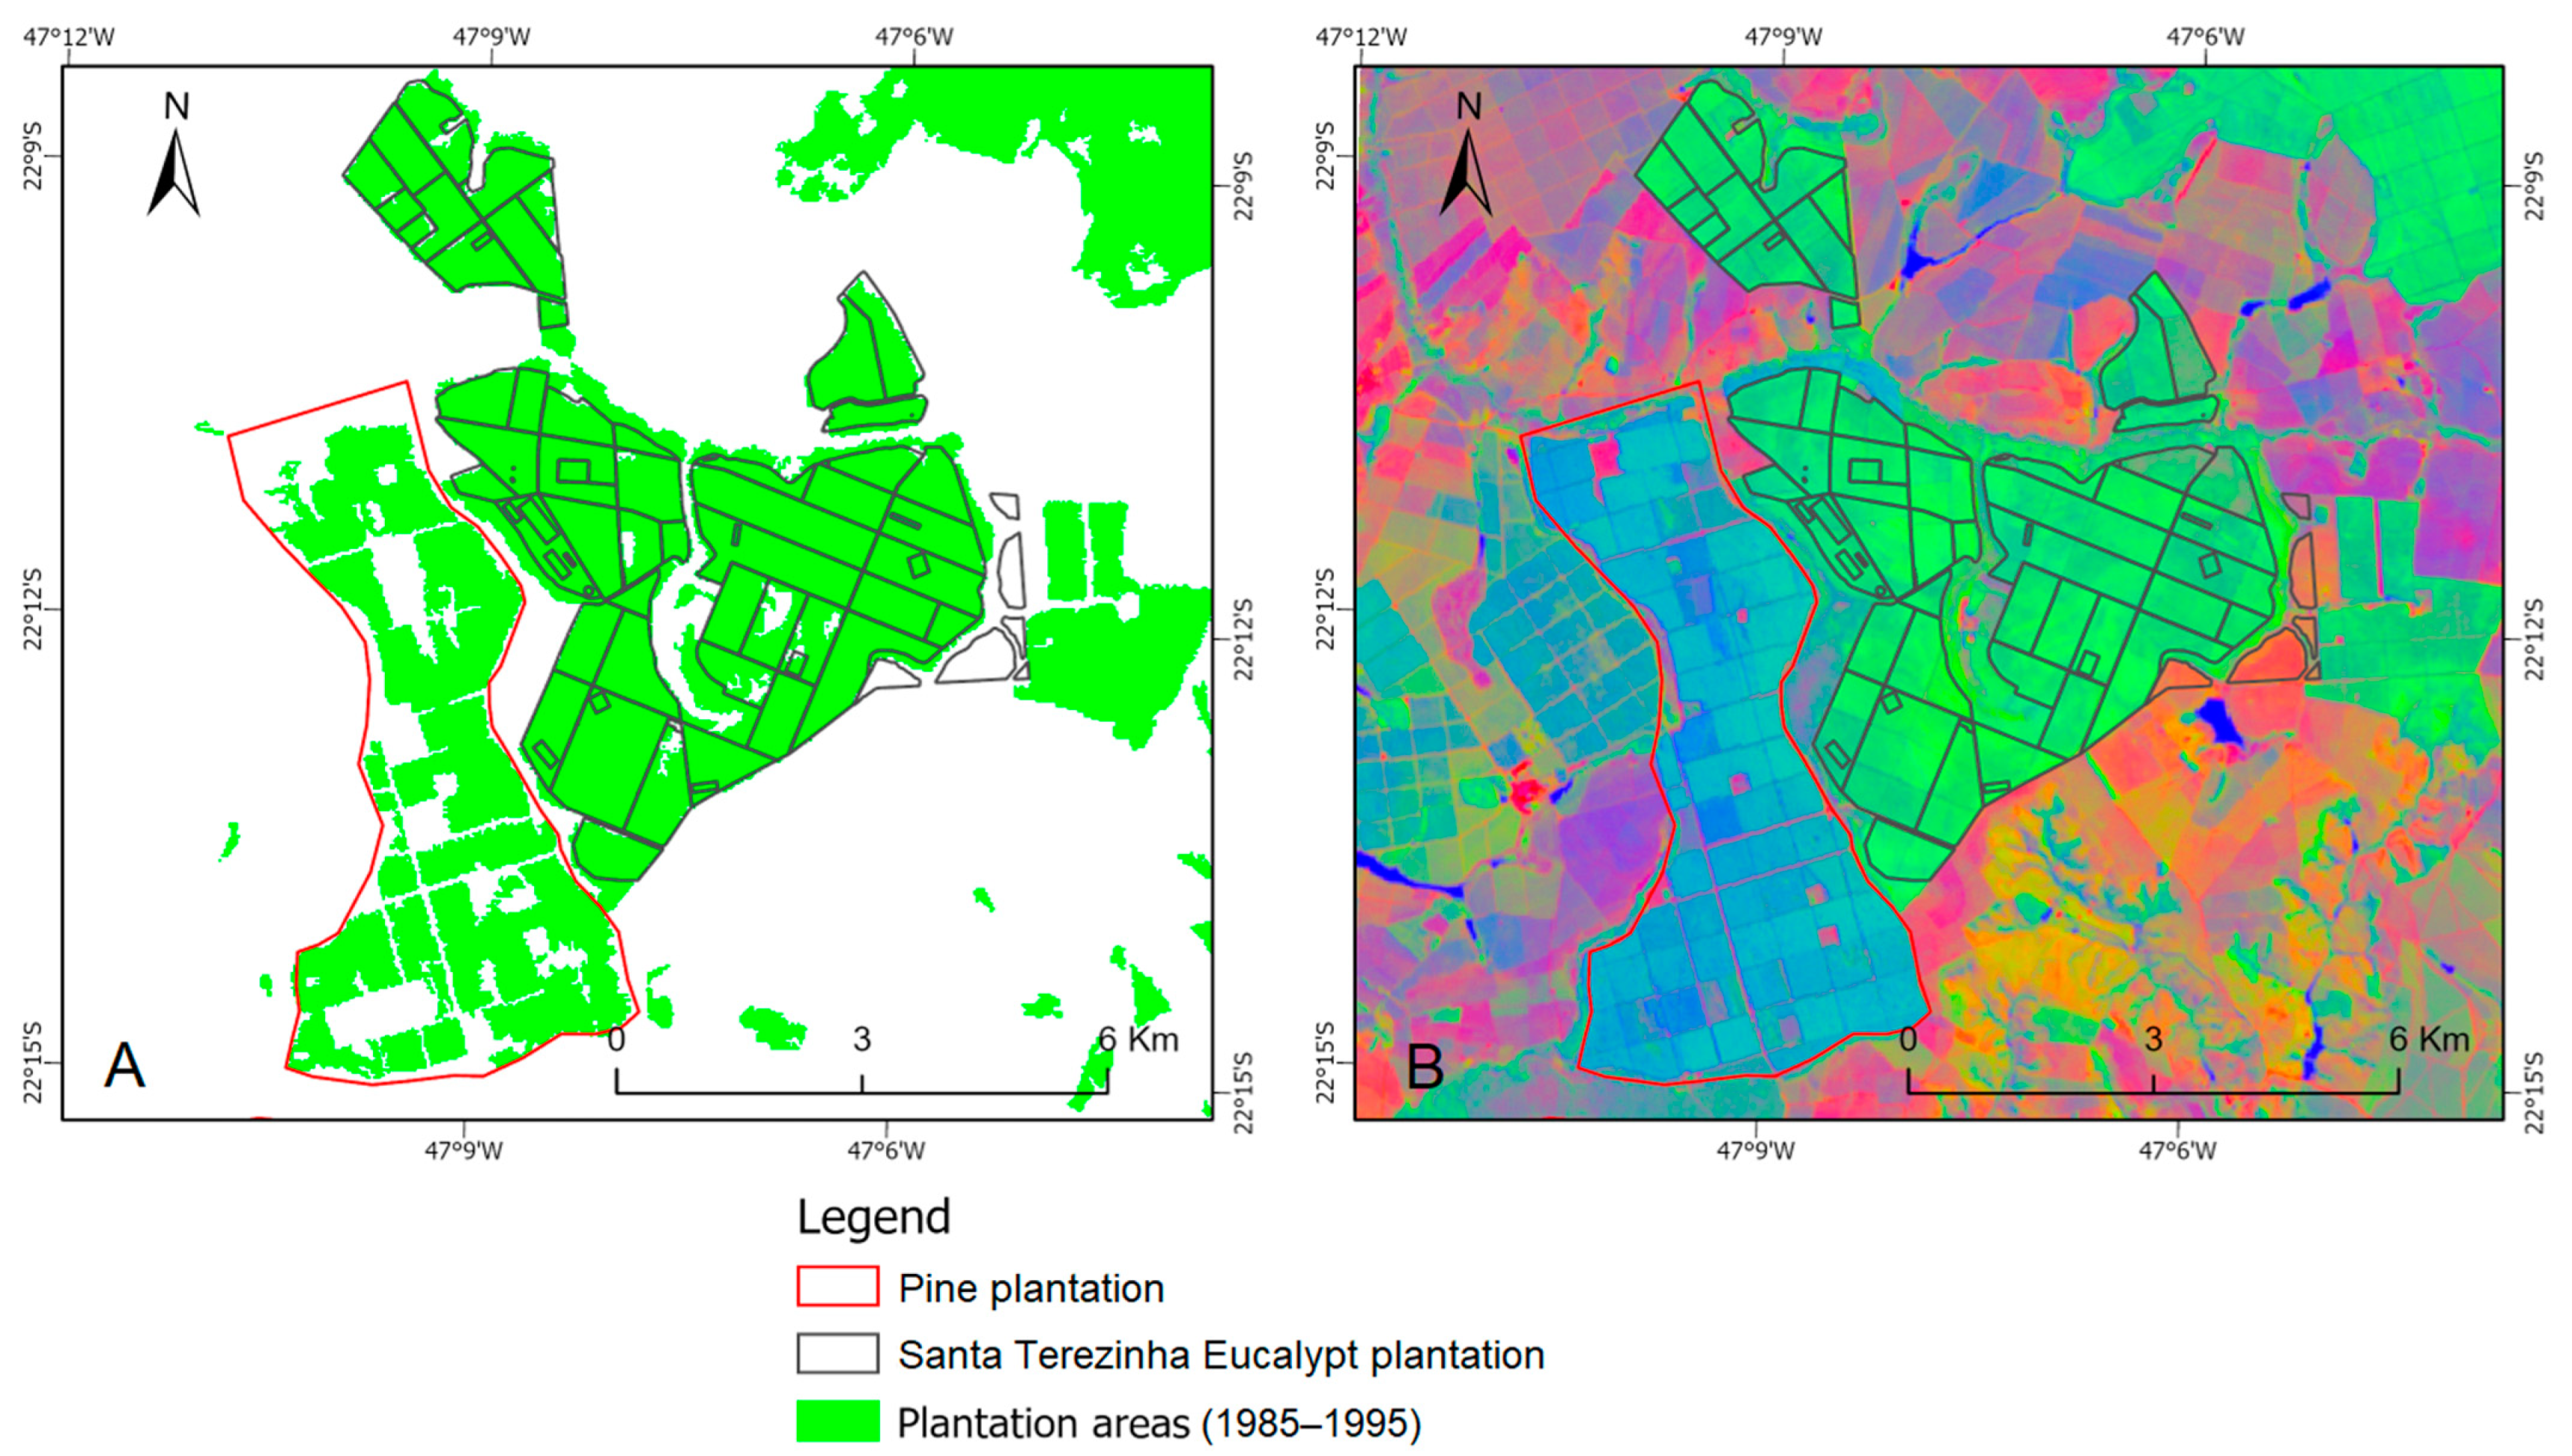
2.1. Study Area
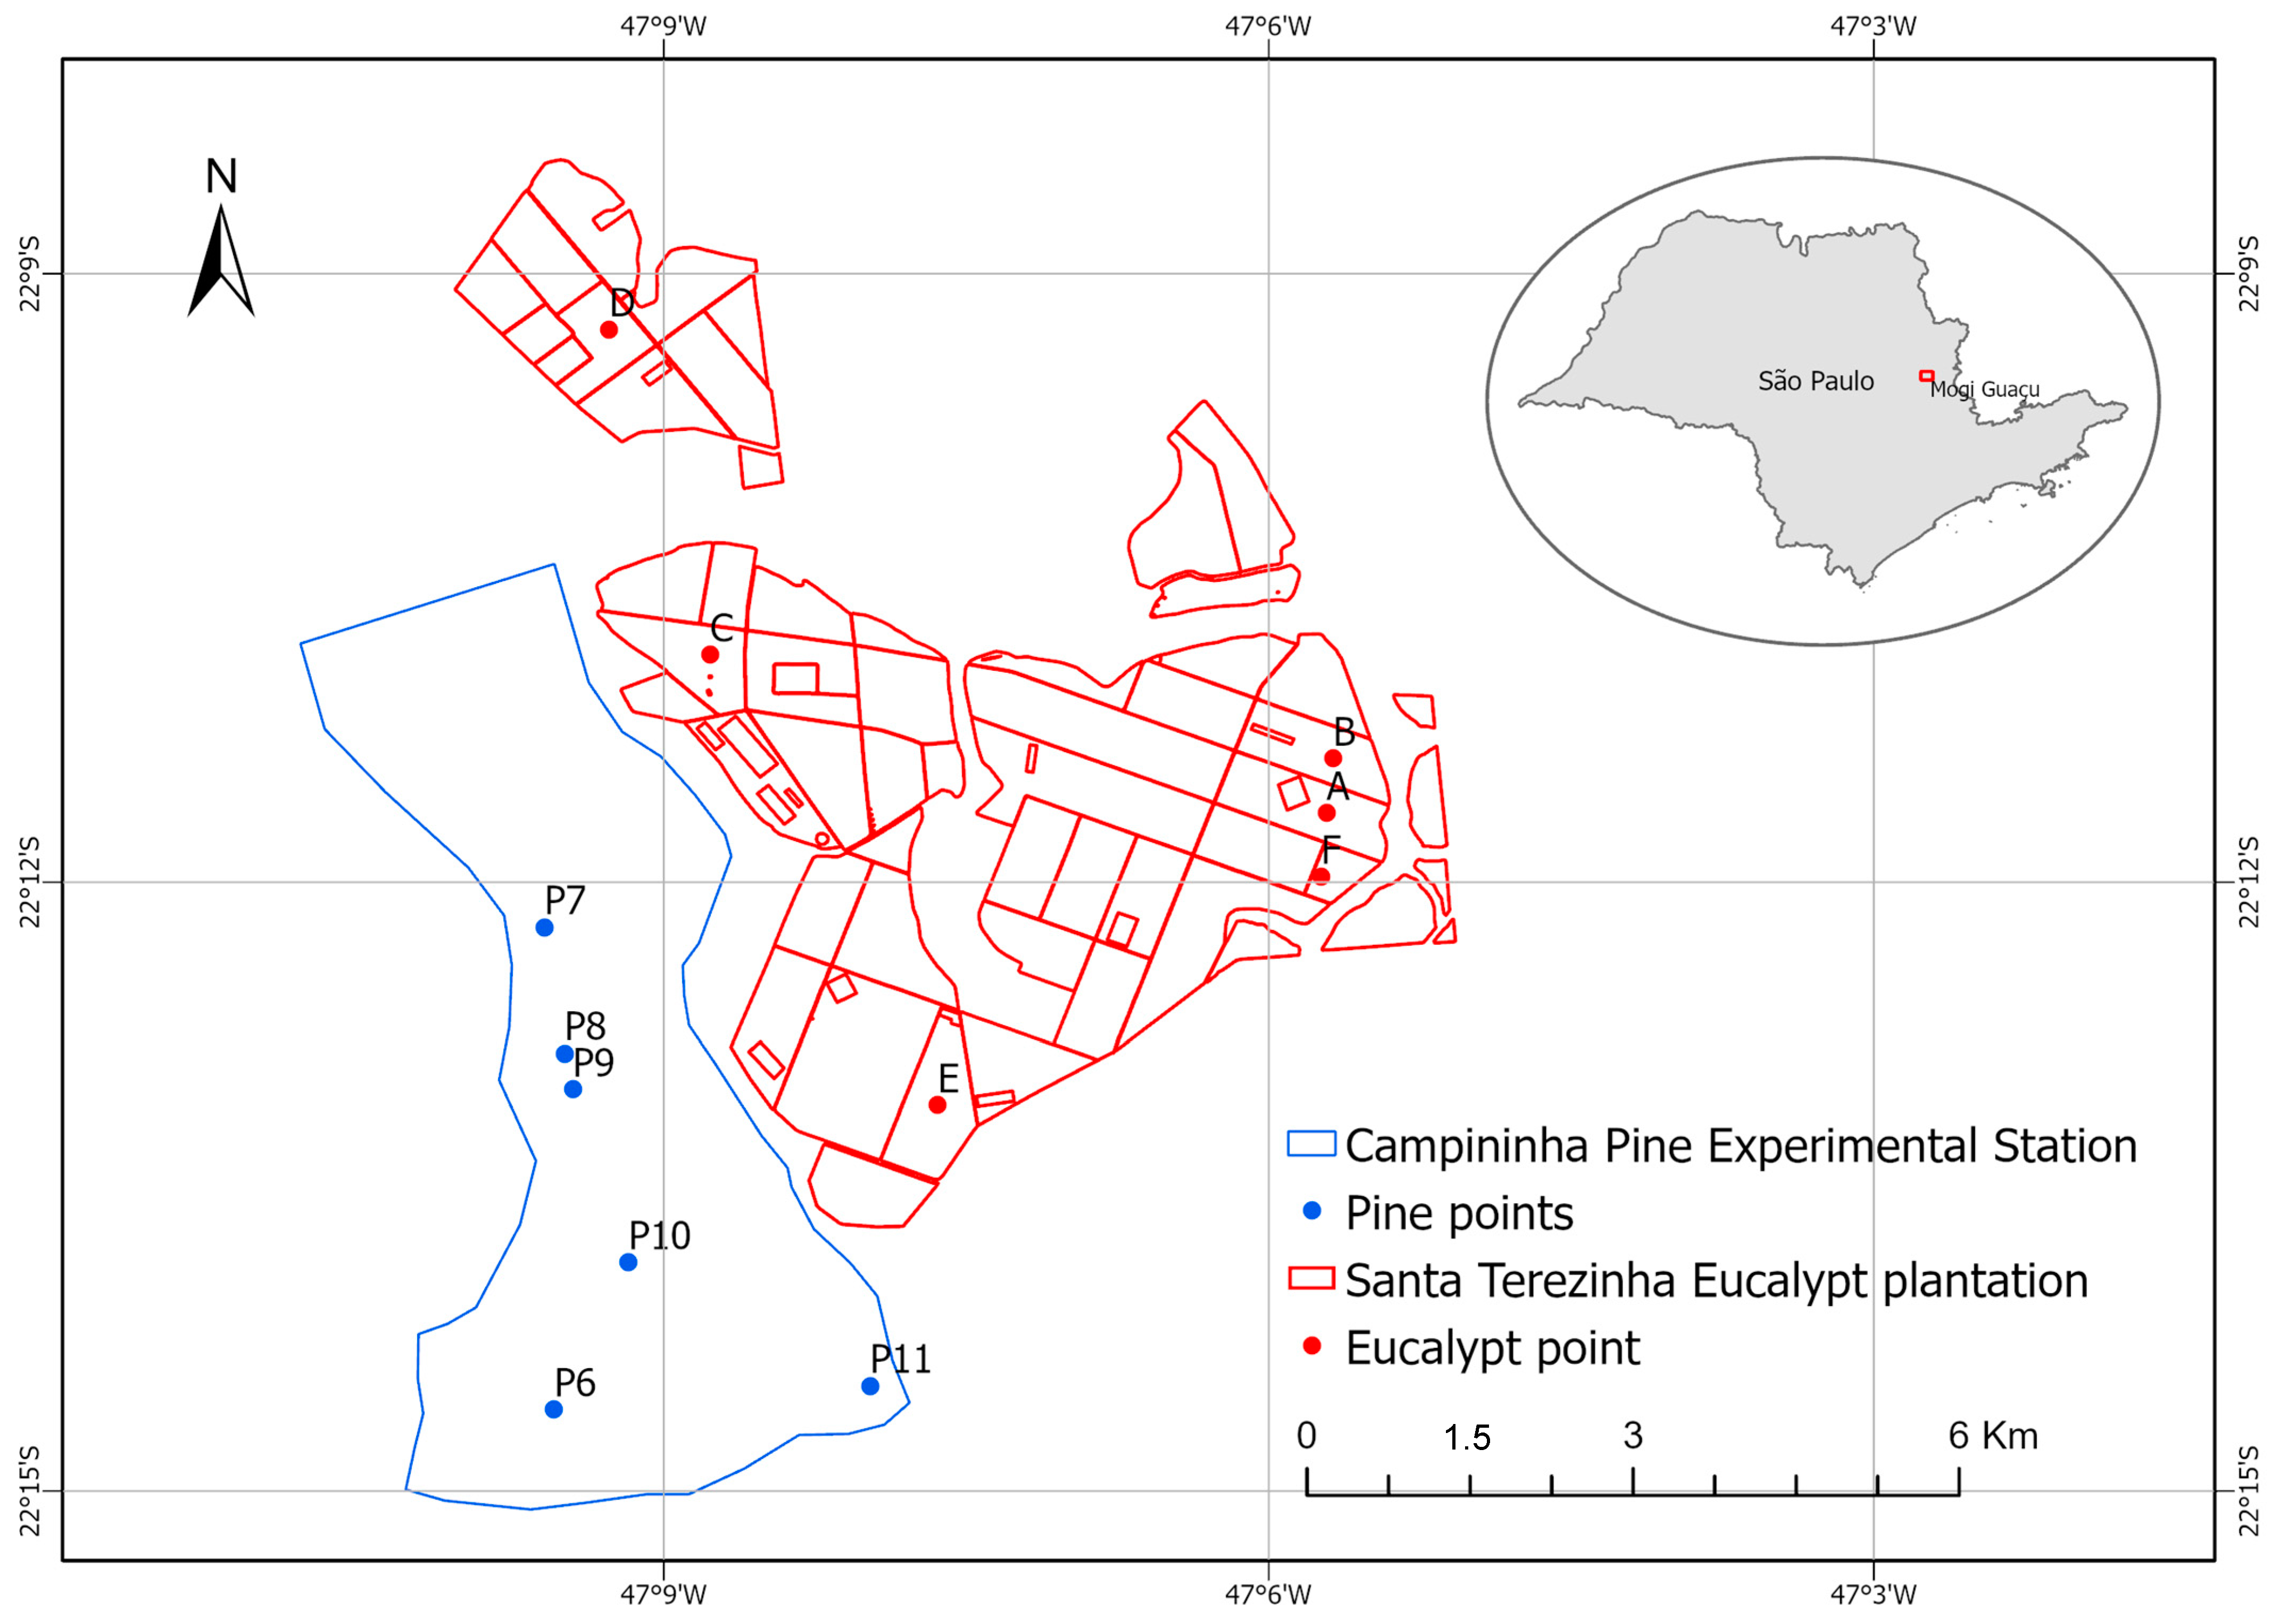
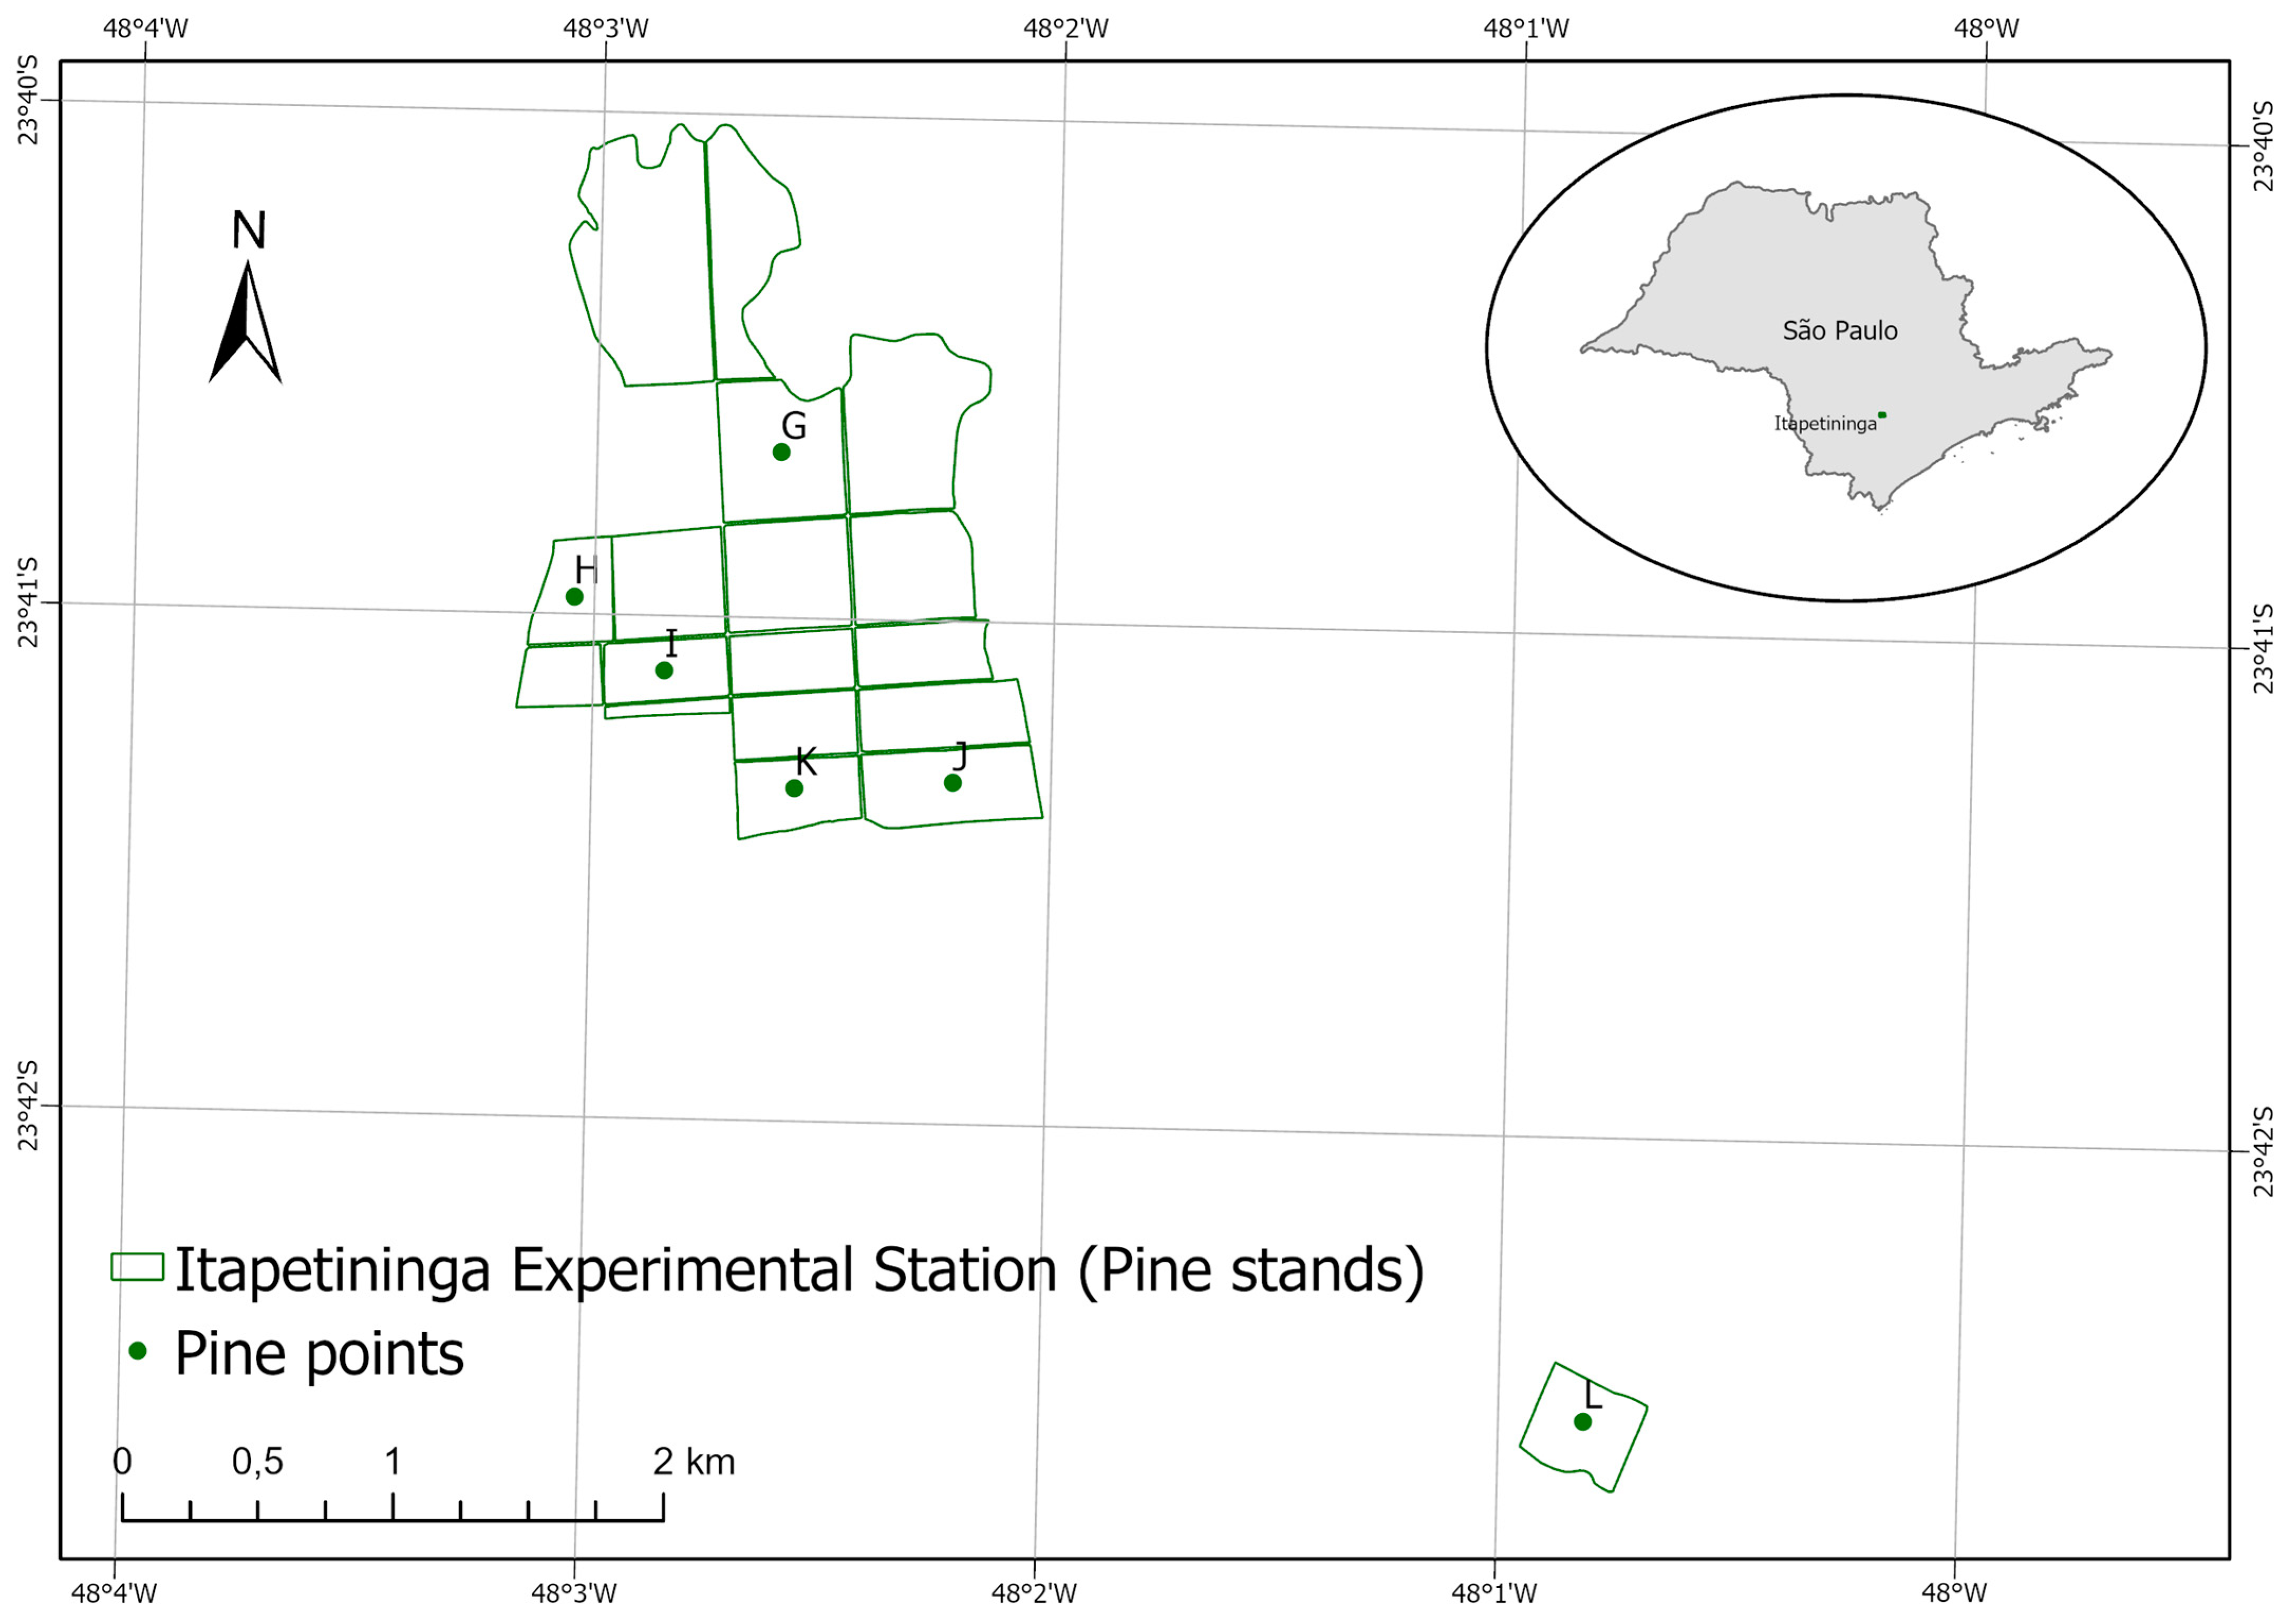
2.2. Pilot Areas
2.3. Landsat TM and OLI Images
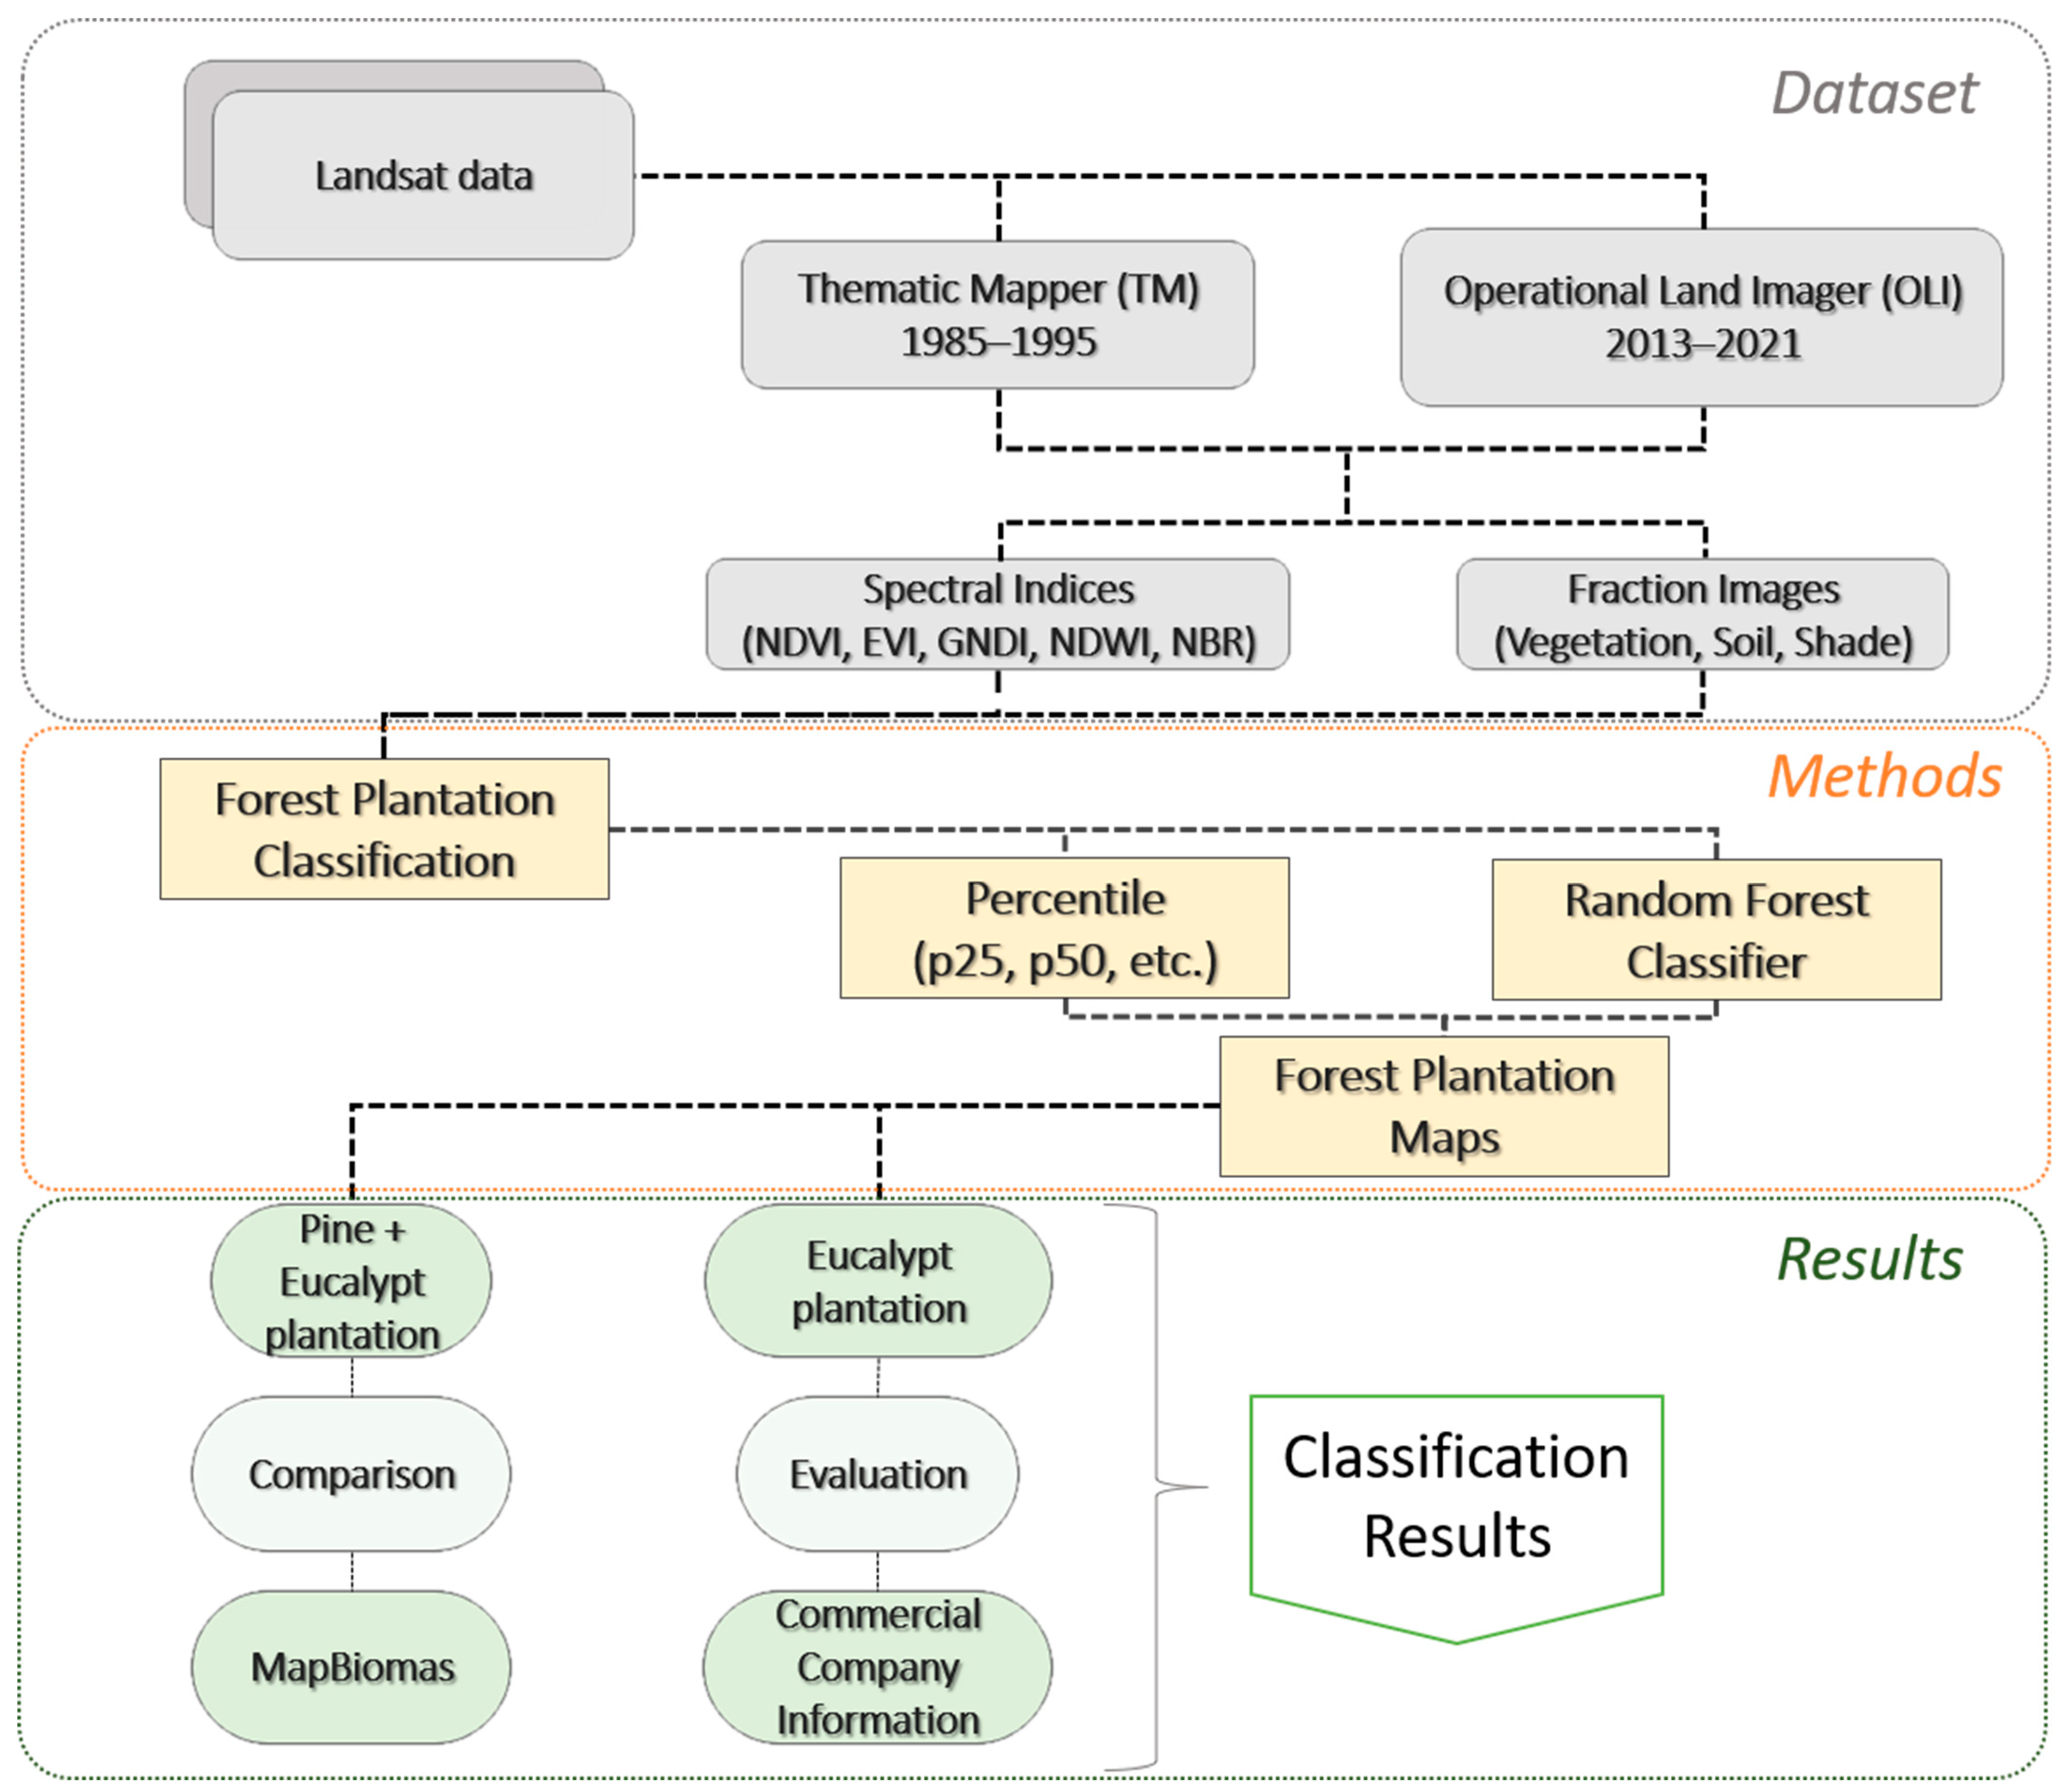
2.4. Methodological Approach
2.4.1. Spectral Indices
2.4.2. Fraction Images
2.4.3. Classification of Forest Plantations
2.5. Validation of the Classification
3. Results
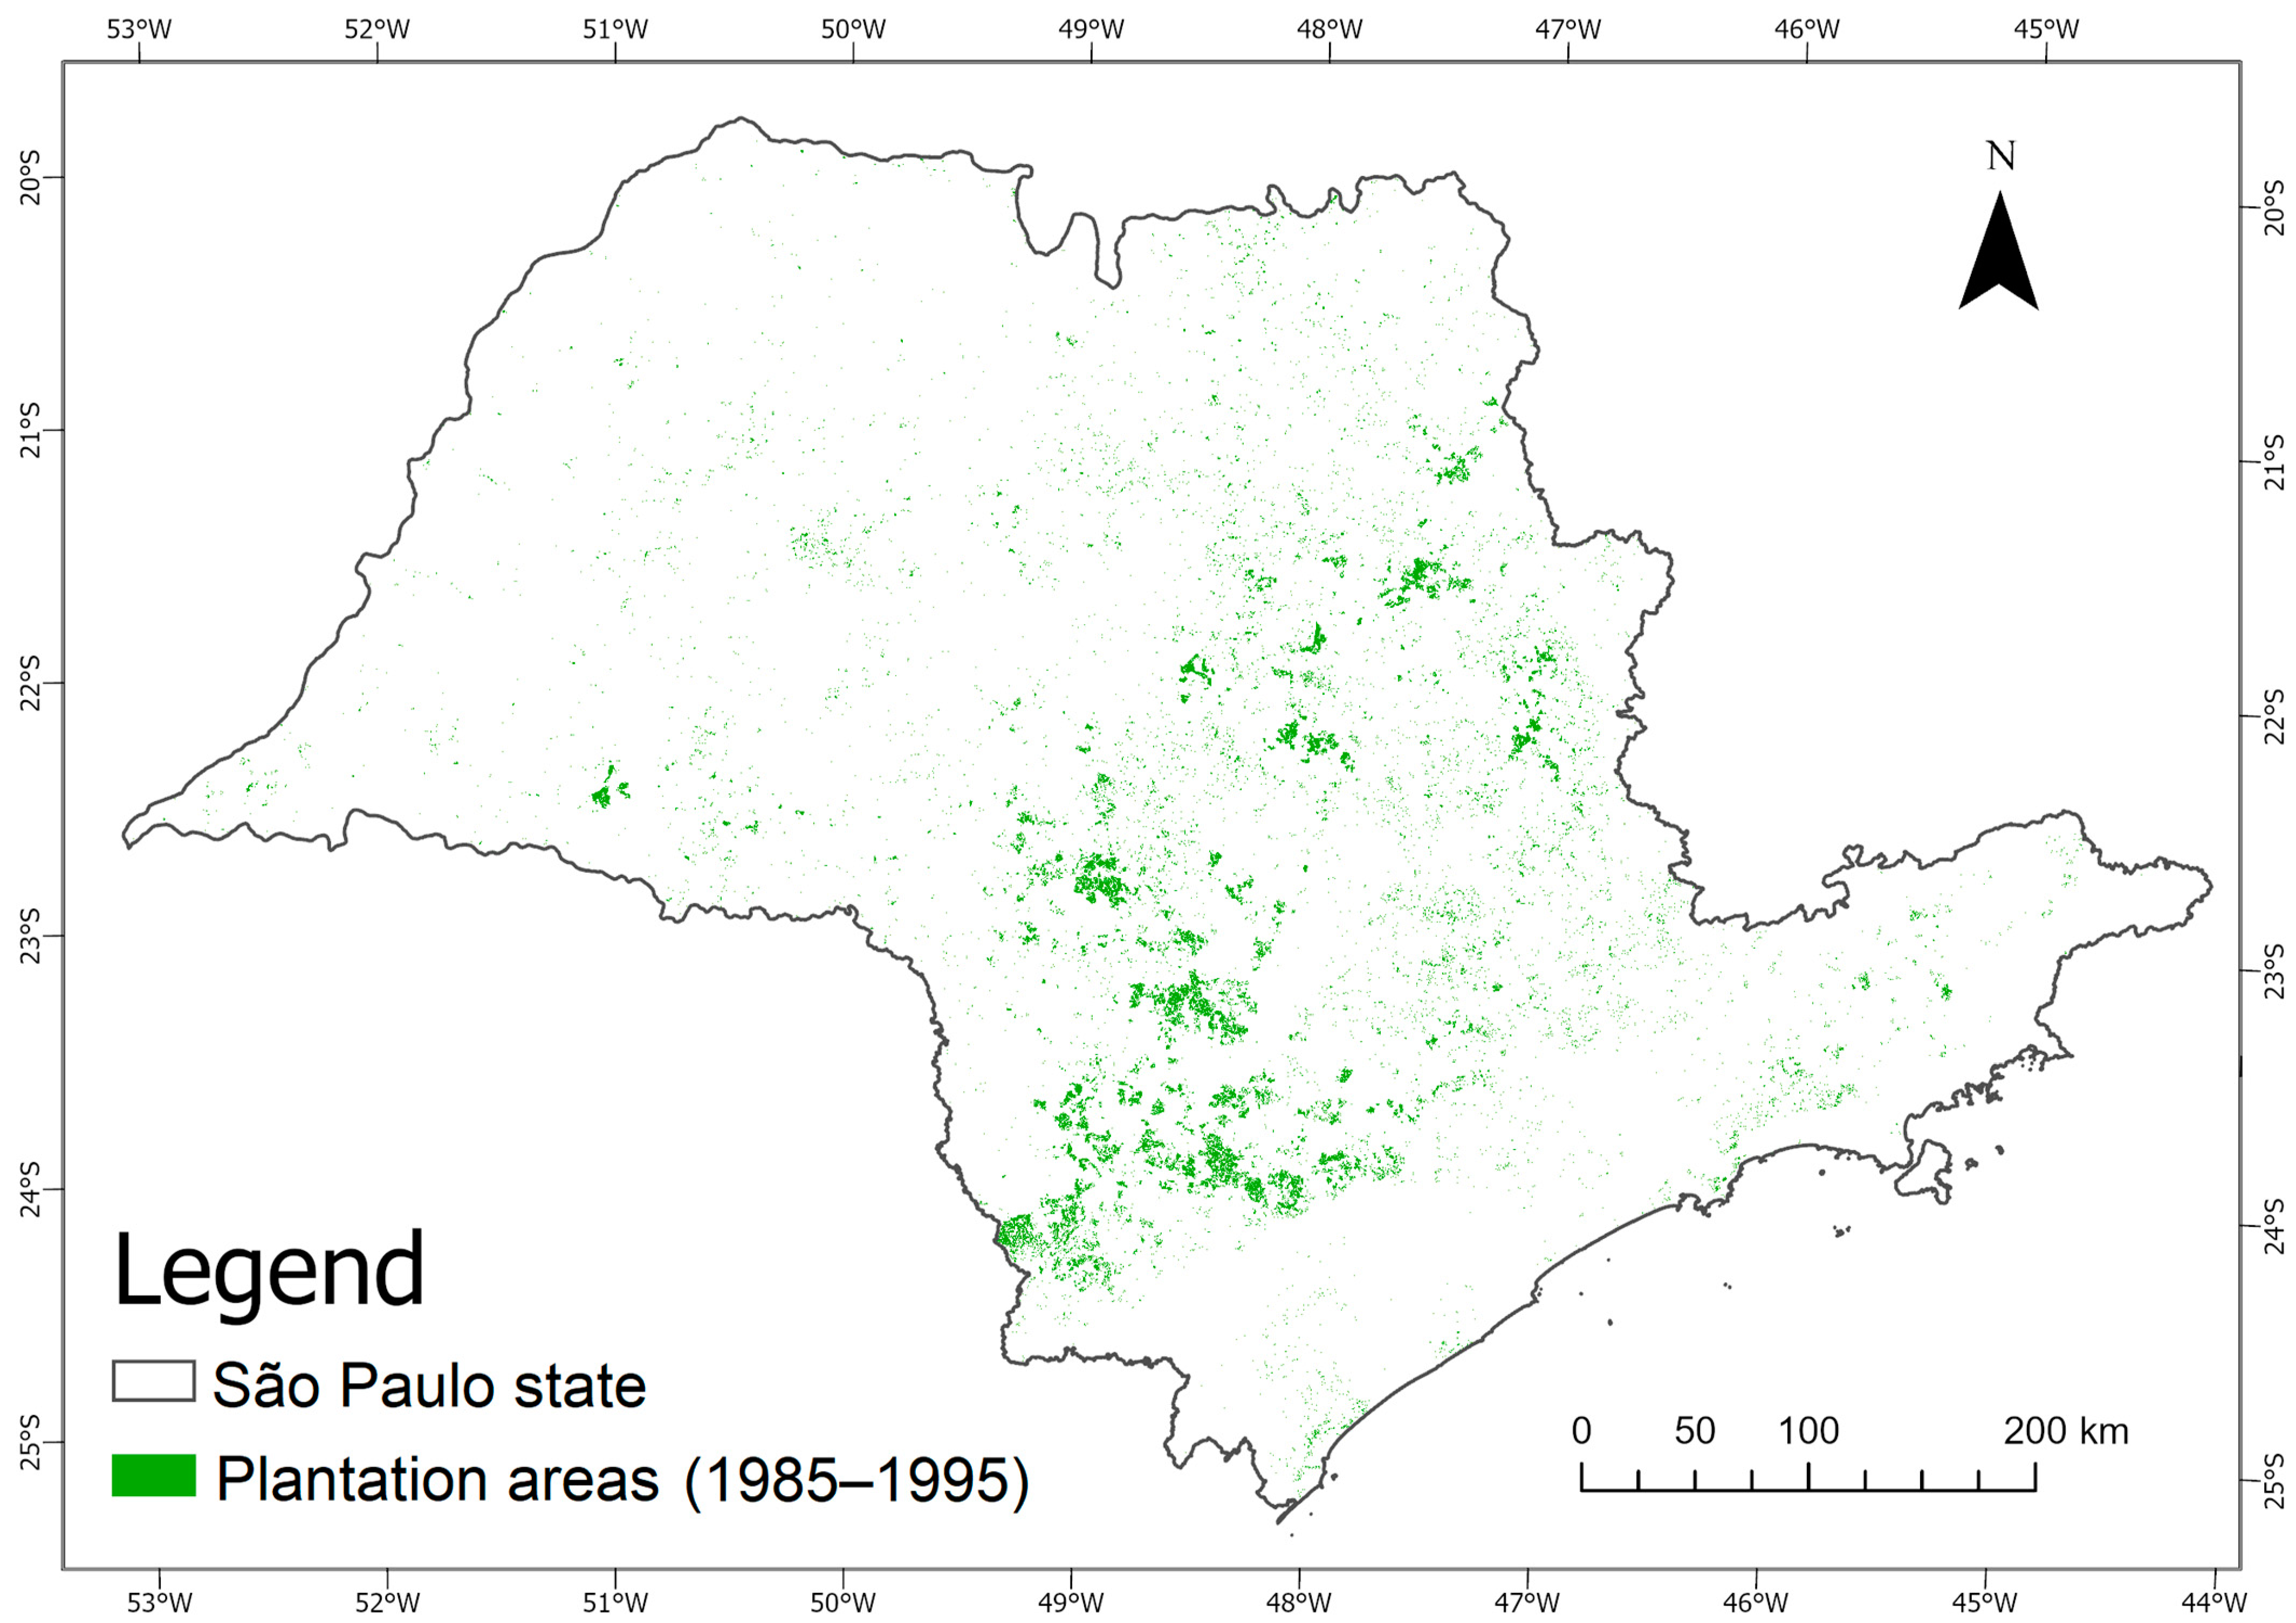
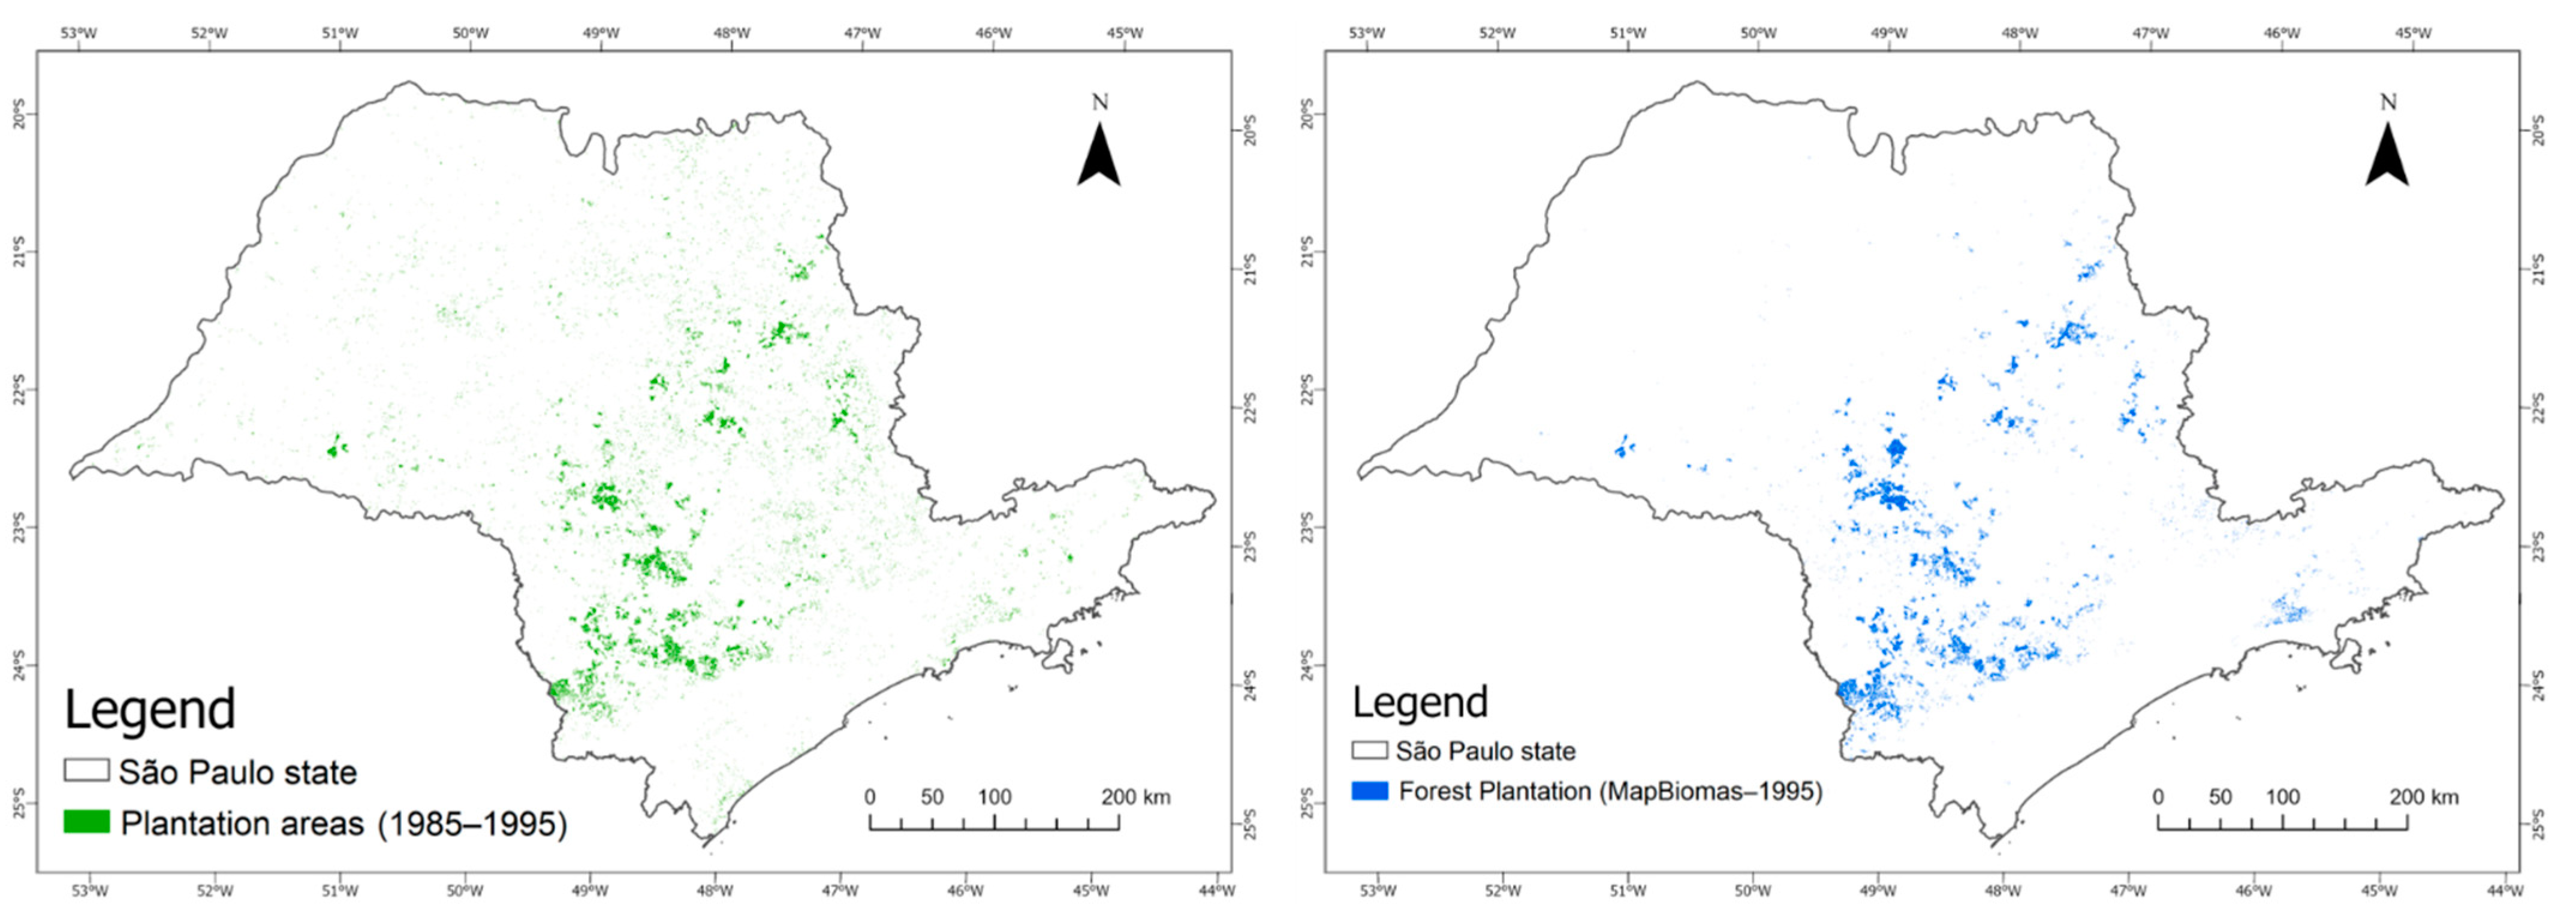
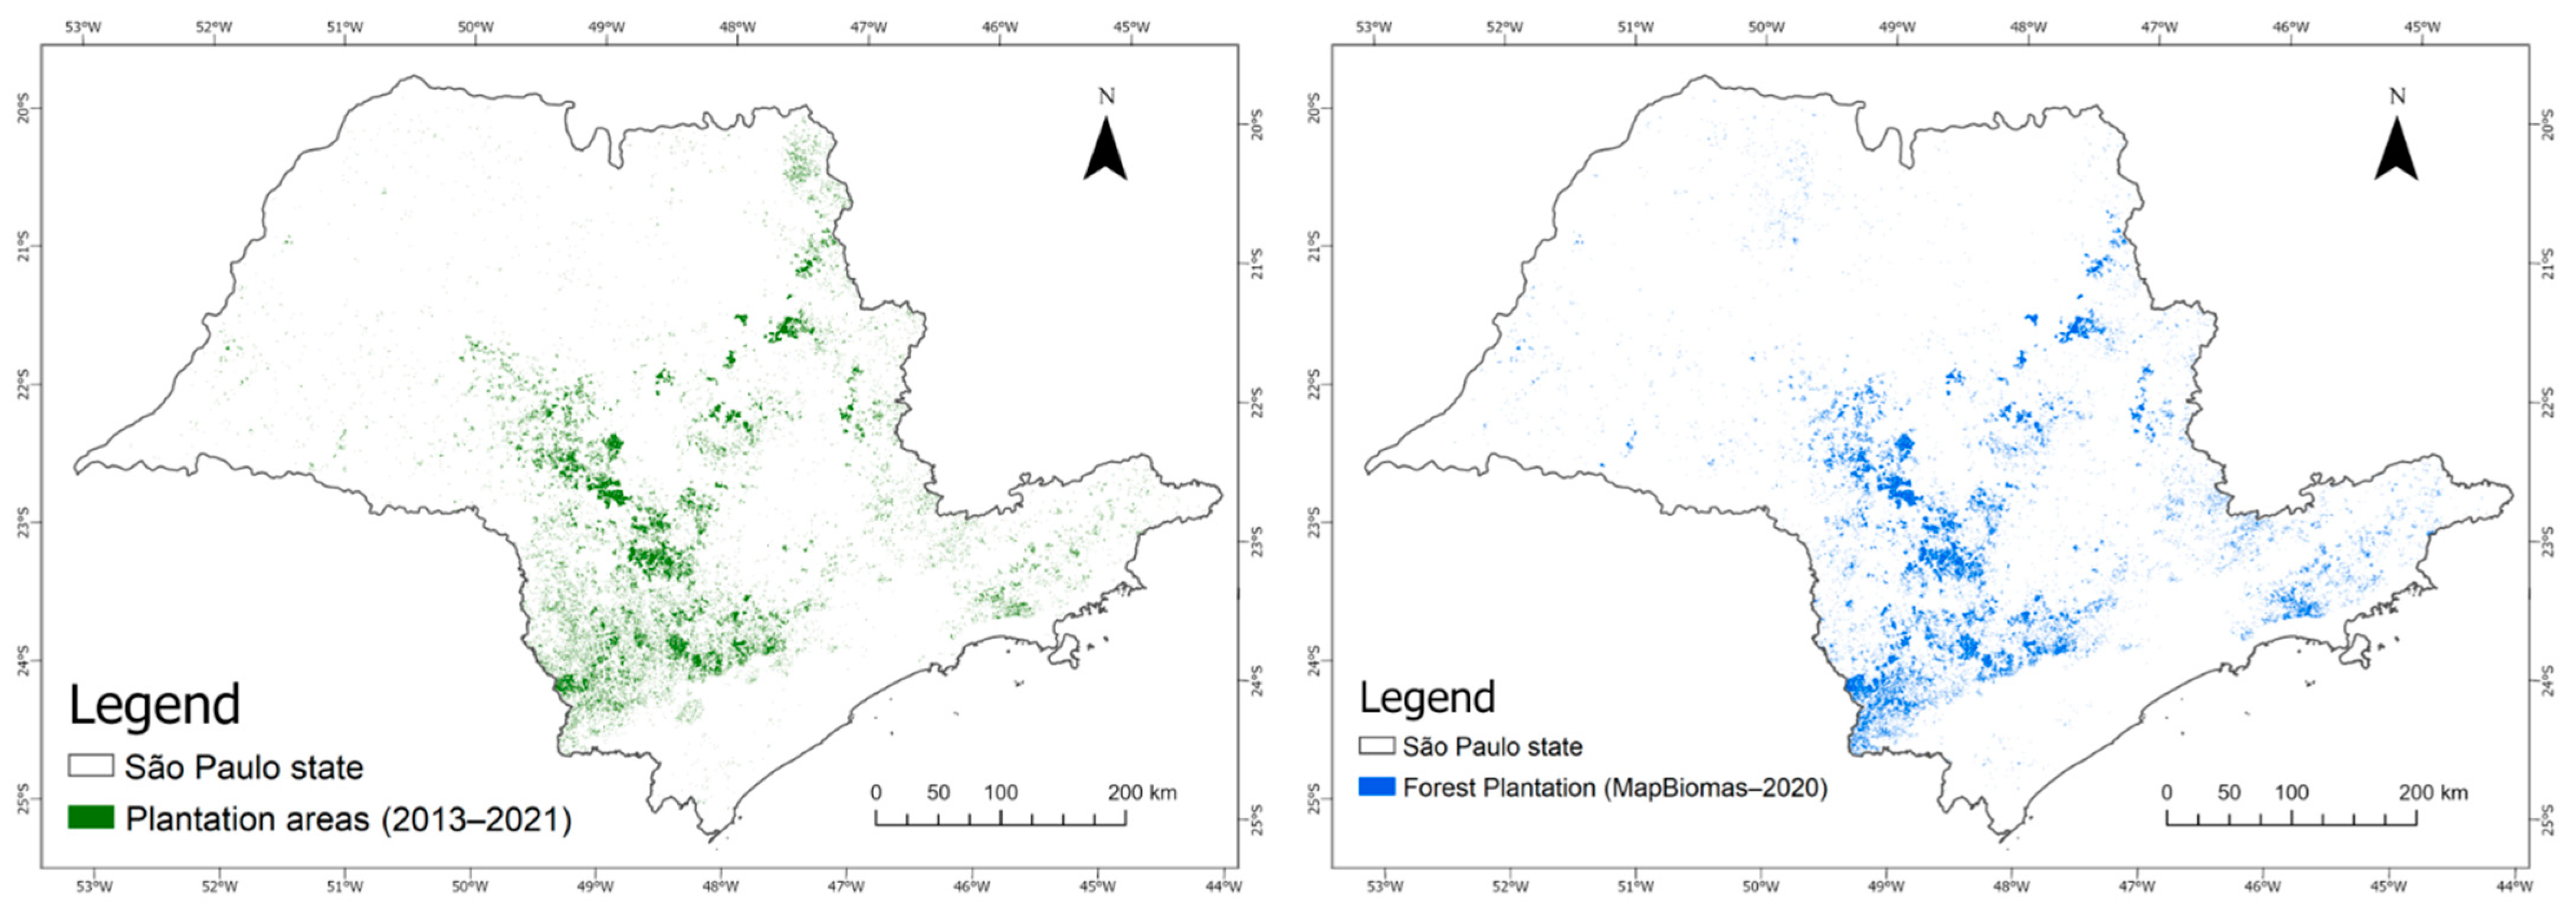
3.1. Study Area
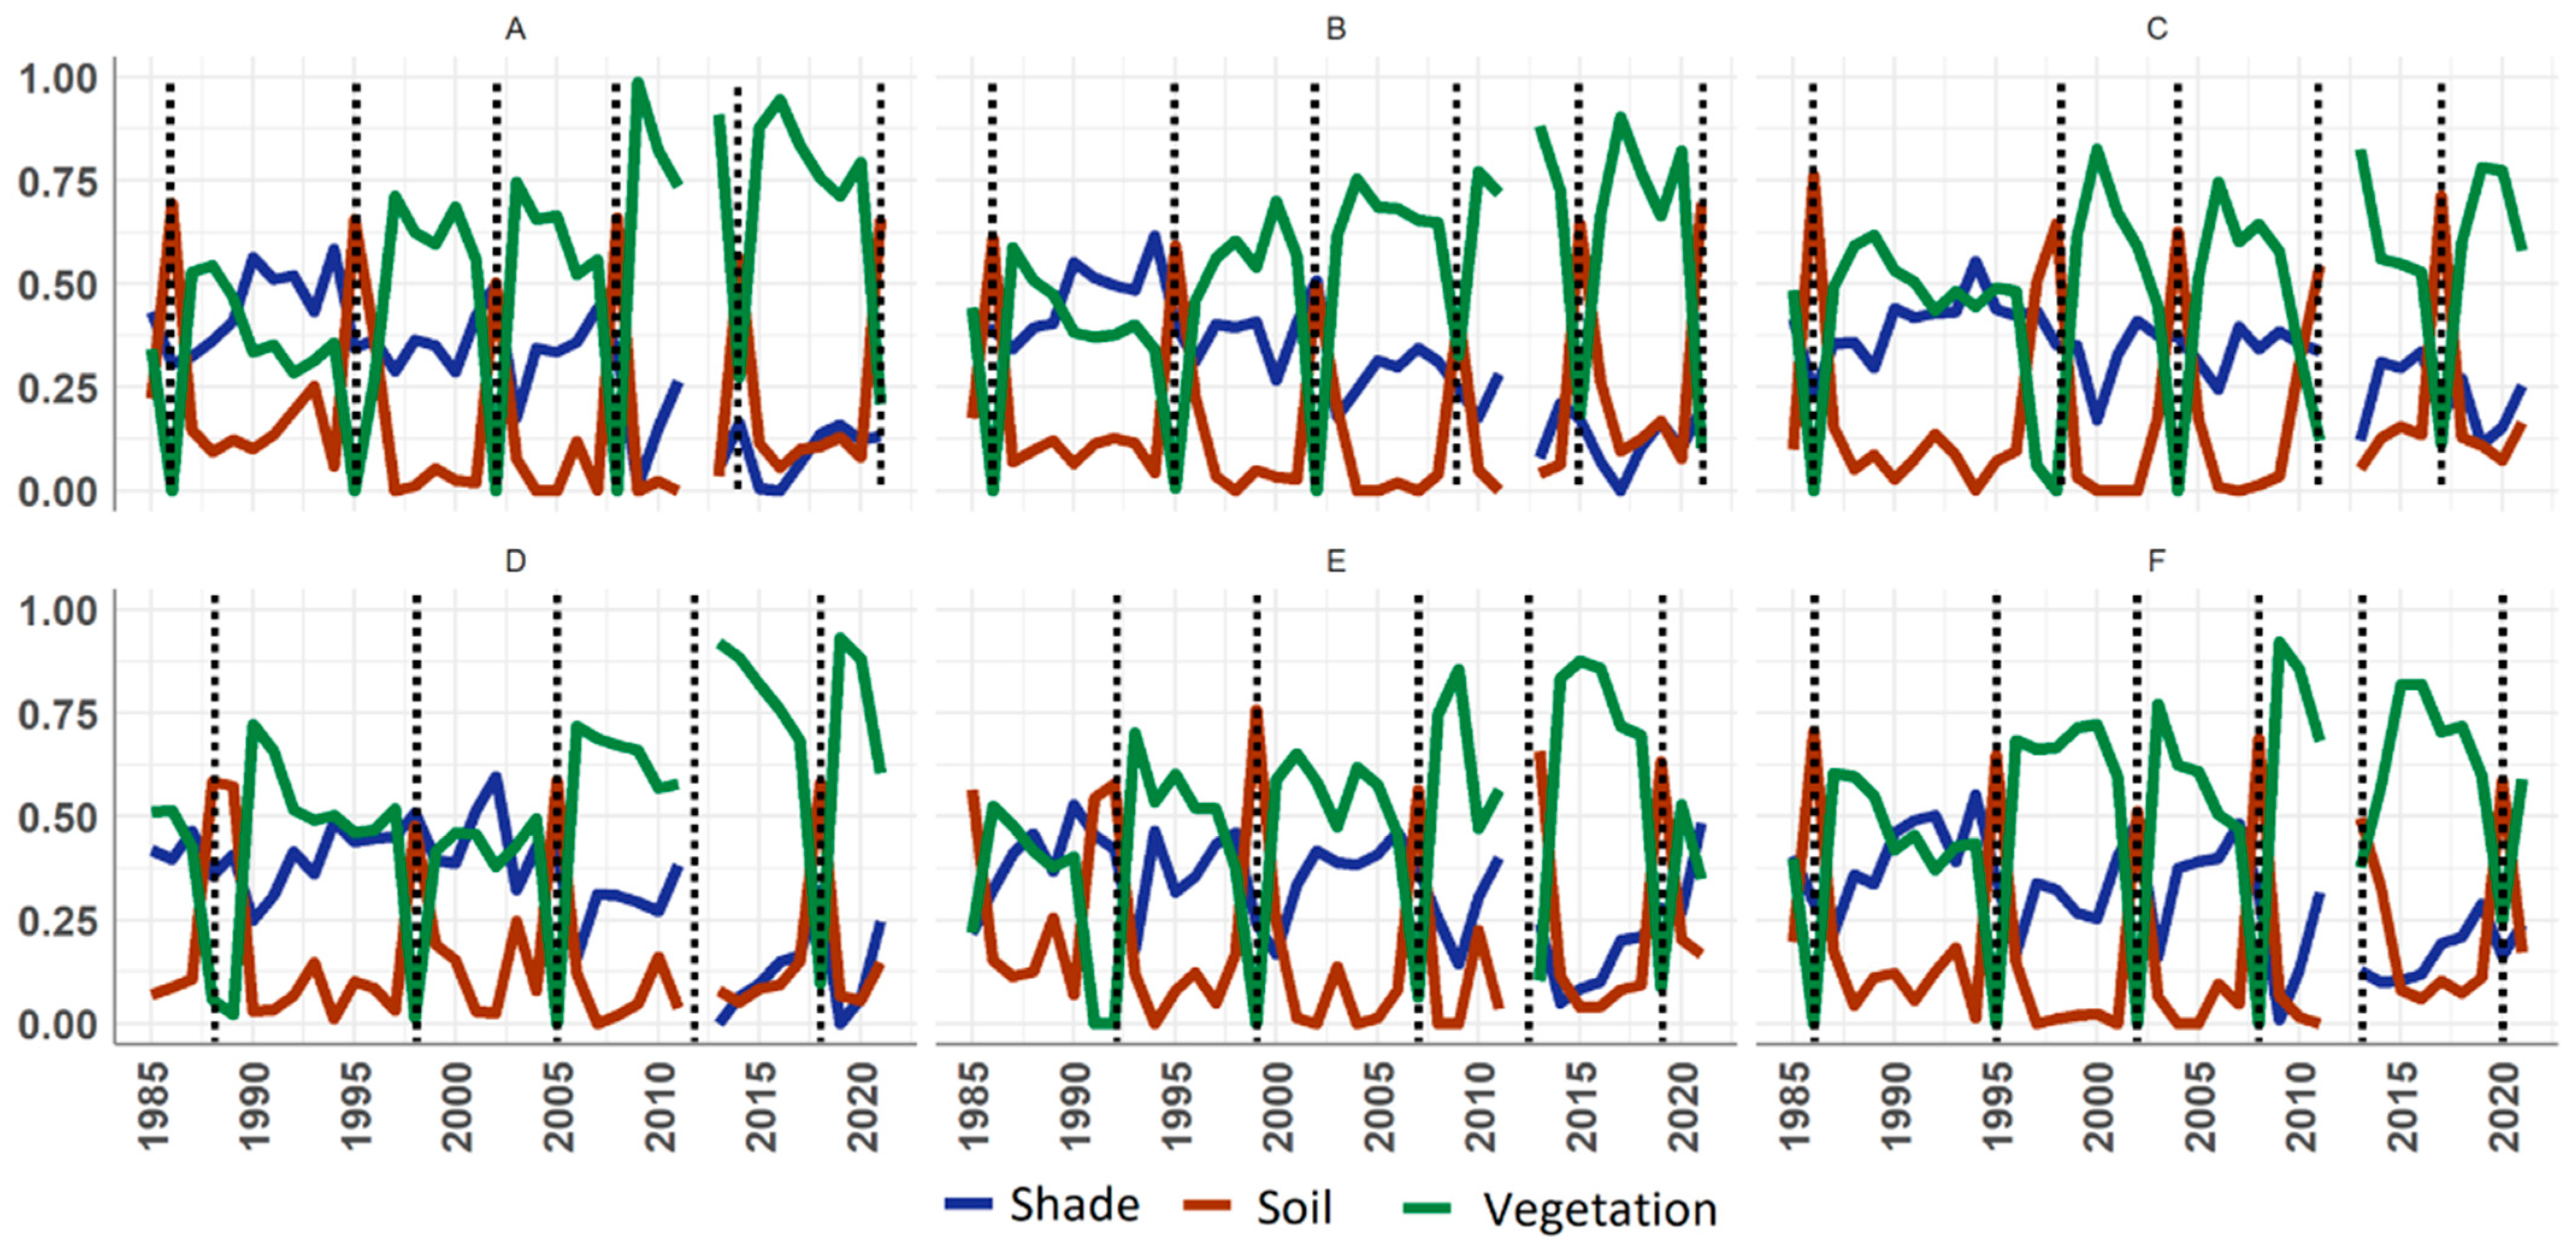
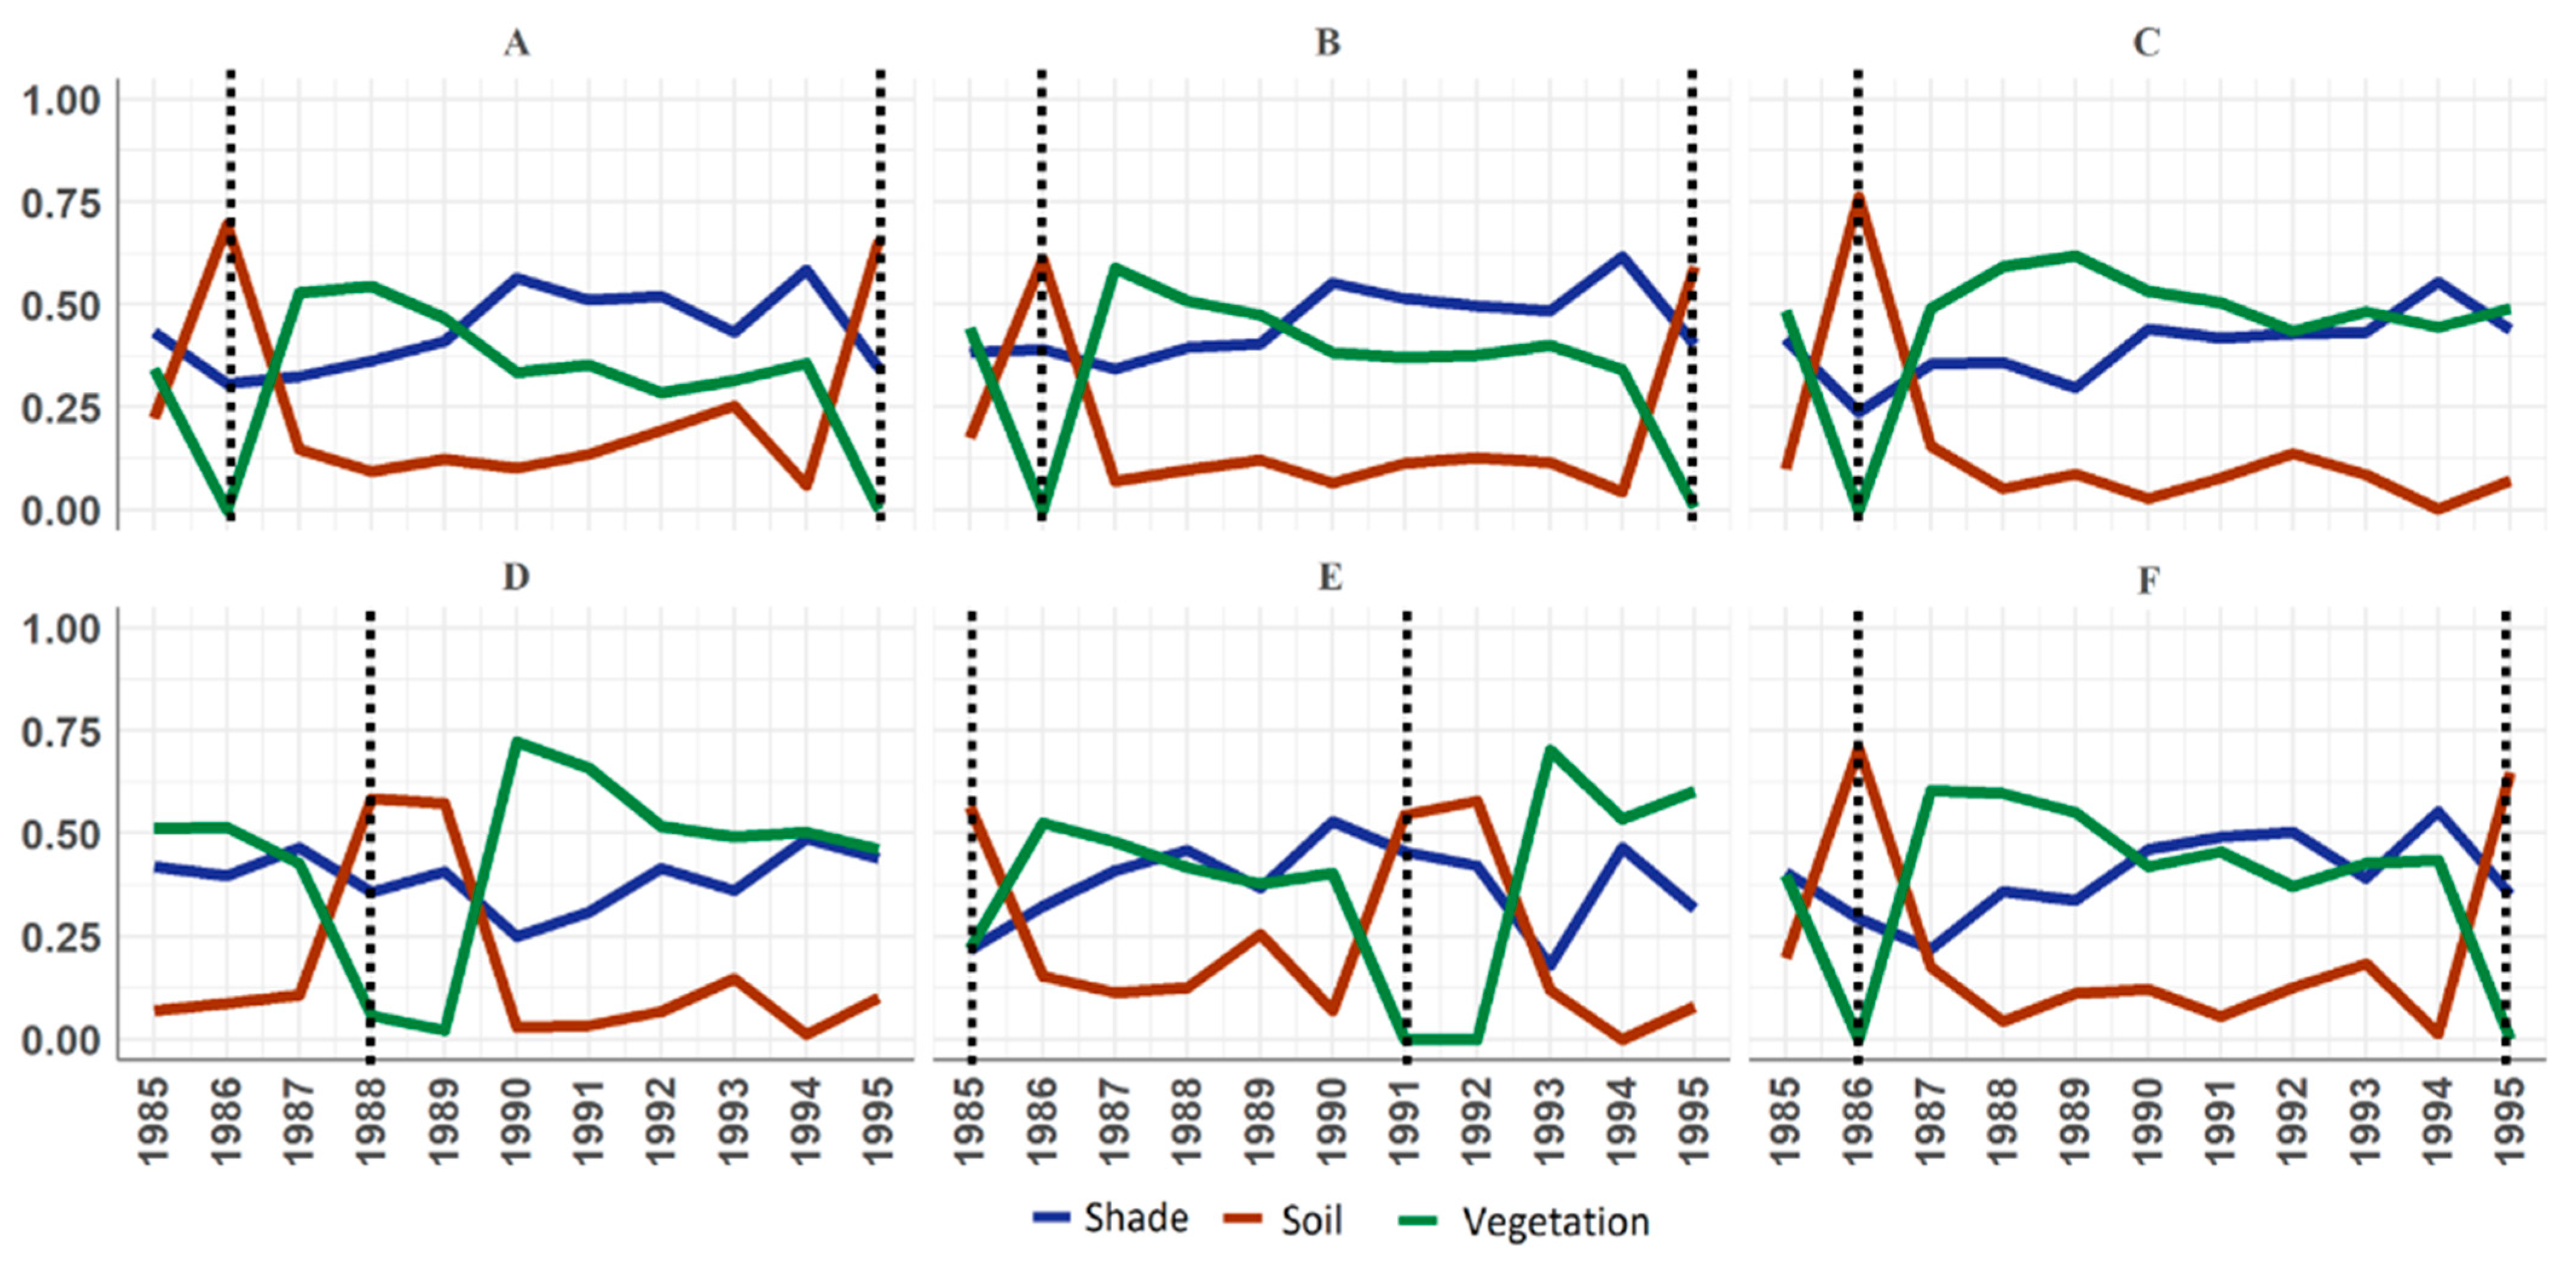
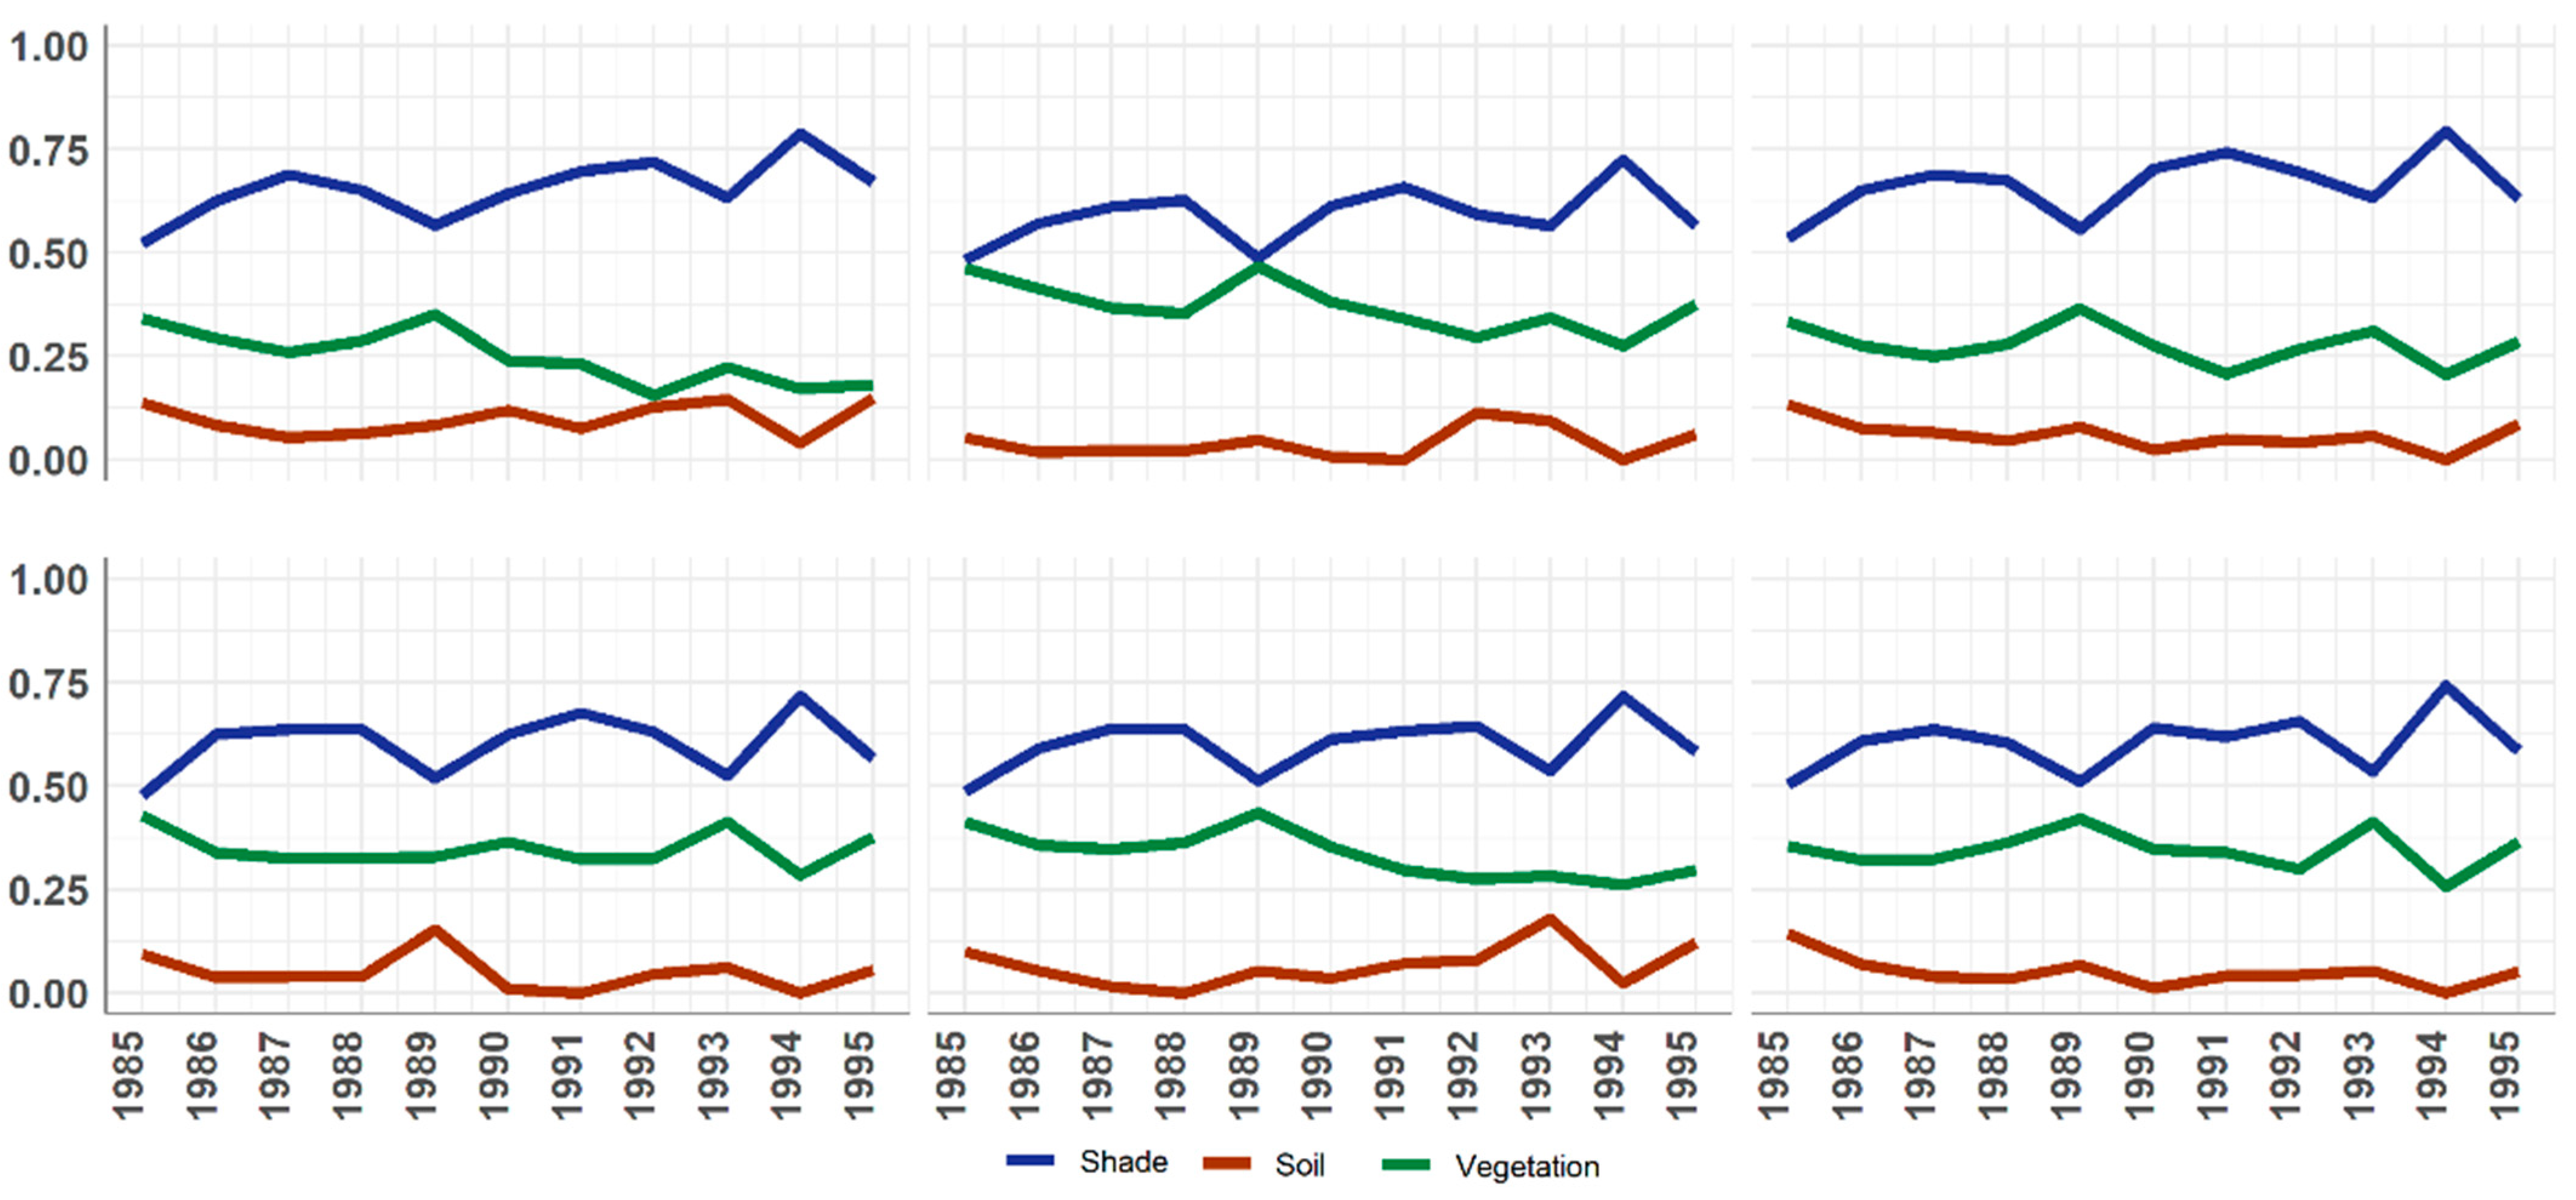
- Eucalypt and Pine phenological assessment
3.2. Pilot Area
- Eucalypt and Pine plantation classifications
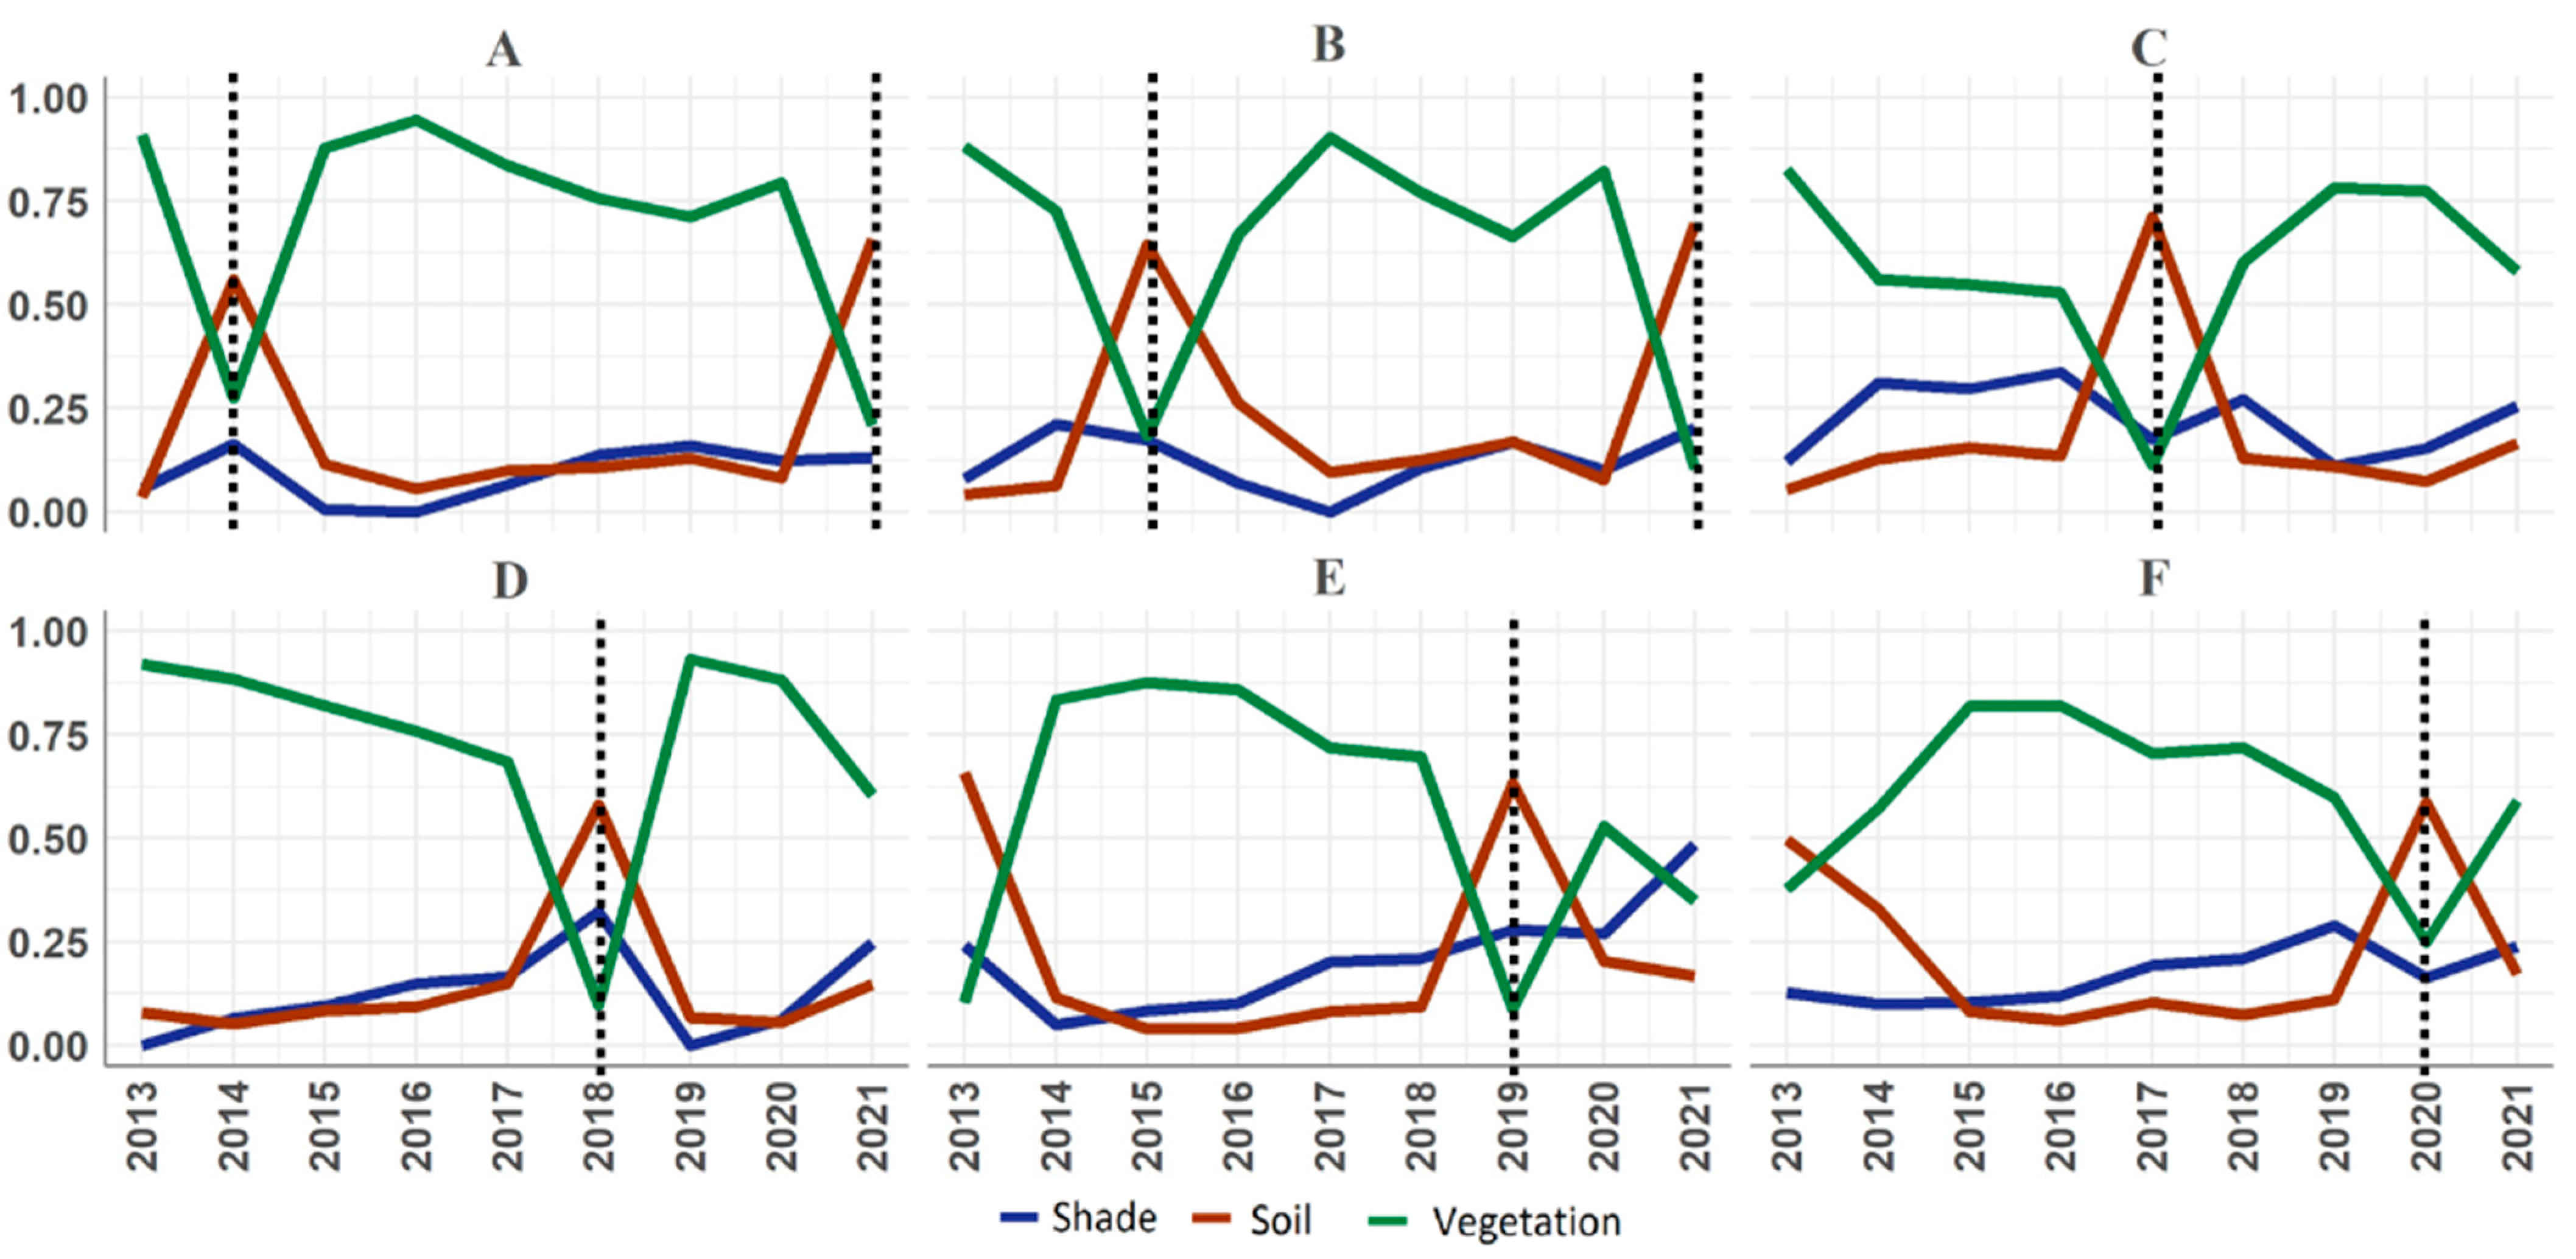
- Eucalypt and Pine phenological assessment
4. Discussion
5. Conclusions
Author Contributions
Funding
Institutional Review Board Statement
Informed Consent Statement
Data Availability Statement
Acknowledgments
Conflicts of Interest
References
- McCloy, K.R. Development and Evaluation of Phenological Change Indices Derived from Time Series of Image Data. Remote Sens. 2010, 2, 2442–2473. [Google Scholar] [CrossRef] [Green Version]
- Lunetta, R.S.; Knight, J.F.; Ediriwickrema, J.; Lyon, J.G.; Worthy, L.D. Land-cover change detection using multi-temporal MODIS NDVI data. Remote Sens. Environ. 2006, 105, 142–154. [Google Scholar] [CrossRef]
- Wardlow, B.D.; Kastens, J.H.; Egbert, S.L. Using USDA crop progress data for the evaluation of greenup onset date calculated from MODIS 250-meter data. Photogramm. Eng. Remote Sens. 2006, 72, 1225–1234. [Google Scholar] [CrossRef] [Green Version]
- Arai, E.; Sano, E.E.; Dutra, A.C.; Cassol, H.L.G.; Hoffmann, T.B.; Shimabukuro, Y.E. Vegetation fraction images derived from PROBA-V data for rapid assessment of annual croplands in Brazil. Remote Sens. 2020, 12, 1152. [Google Scholar] [CrossRef] [Green Version]
- Cassol, H.L.G.; Arai, E.; Eyji Sano, E.; Dutra, A.C.; Hoffmann, T.B.; Shimabukuro, Y.E. Maximum Fraction Images Derived from Year-Based Project for On-Board Autonomy-Vegetation (PROBA-V) Data for the Rapid Assessment of Land Use and Land Cover Areas in Mato Grosso State, Brazil. Land 2020, 9, 139. [Google Scholar] [CrossRef]
- le Maire, G.; Dupuy, S.; Nouvellon, Y.; Loos, R.A.; Hakamada, R. Mapping short-rotation plantations at regional scale using MODIS time series: Case of eucalypt plantations in Brazil. Remote Sens. Environ. 2014, 152, 136–149. [Google Scholar] [CrossRef]
- le Maire, G.; Marsden, C.; Nouvellon, Y.; Grinand, C.; Hakamada, R.; Stape, J.-L.; Laclau, J.-P. MODIS NDVI time-series allow the monitoring of Eucalyptus plantation biomass. Remote Sens. Environ. 2011, 115, 2613–2625. [Google Scholar] [CrossRef]
- Busetto, L.; Meroni, M.; Colombo, R. Combining medium and coarse spatial resolution satellite data to improve the estimation of sub-pixel NDVI time series. Remote Sens. Environ. 2008, 112, 118–131. [Google Scholar] [CrossRef]
- Shimabukuro, Y.E.; Smith, J.A. The Least-Squares Mixing Models to Generate Fraction Images Derived From Remote Sensing Multispectral Data. IEEE Trans. Geosci. Remote Sens. 1991, 29, 16–20. [Google Scholar] [CrossRef]
- Qiao, H.; Wu, M.; Shakir, M.; Wang, L.; Kang, J.; Niu, Z. Classification of Small-Scale Eucalyptus Plantations Based on NDVI Time Series Obtained from Multiple High-Resolution Datasets. Remote Sens. 2016, 8, 117. [Google Scholar] [CrossRef]
- Indústria Brasileira de Árvores. Relatório Anual IBÁ 2021. In Relatório Anual IBÁ. Available online: https://www.iba.org/datafiles/publicacoes/relatorios/relatorioiba2021-compactado.pdf (accessed on 3 August 2022).
- Deng, X.; Guo, S.; Sun, L.; Chen, J. Identification of Short-Rotation Eucalyptus Plantation at Large Scale Using Multi-Satellite Imageries and Cloud Computing Platform. Remote Sens. 2020, 12, 2153. [Google Scholar] [CrossRef]
- Instituto Florestal. Inventário Florestal da Vegetação Natural do Estado de São Paulo—Mapeamento da Cobertura Nativa. 2020. Available online: https://smastr16.blob.core.windows.net/home/2020/07/inventarioflorestal2020.pdf (accessed on 4 August 2022).
- Shimabukuro, Y.E.; Hernandez Filho, P.; Koffler, N.F.; Chen, S.C. Automatic Classification of Reforested Pine and Eucalyptus Using Landsat Data. Photogramm. Eng. Remote Sens. 1980, 46, 209–2016. [Google Scholar]
- Rouse, J.W.; Haas, R.H.; Schell, J.A.; Deering, D.W. Monitoring vegetation systems in the great plains with Earth Resources Technology (ERTS) Satellite. In Proceedings of 3rd Earth Resources Technology Satellite Symposium, Greenbelt, MD, USA, 10–14 December 1974. [Google Scholar]
- Liu, H.Q.; Huete, A. A feedback based modification of the NDVI to minimize canopy background and atmospheric noise. IEEE Trans. Geosci. Remote Sens. 1995, 33, 457–465. [Google Scholar] [CrossRef]
- Gitelson, A.A.; Kaufman, Y.J. MODIS NDVI Optimization To Fit the AVHRR Data Series—Spectral Considerations. Remote Sens. Environ. 1998, 66, 343–350. [Google Scholar] [CrossRef]
- Gao, B. NDWI—A normalized difference water index for remote sensing of vegetation liquid water from space. Remote Sens. Environ. 1996, 58, 257–266. [Google Scholar] [CrossRef]
- Key, C.; Benson, N. Landscape Assessment: Remote Sensing of Severity, the Normalized Burn Ratio; and Ground Measure of Severity, the Composite Burn Index. In FIREMON: Fire Effects Monitoring and Inventory System; RMRS-GTR; USDA Forest Service, Rocky Mountain Research Station: Ogden, UT, USA, 2005. [Google Scholar]
- Teluguntla, P.; Thenkabail, P.S.; Oliphant, A.; Xiong, J.; Gumma, M.K.; Congalton, R.G.; Huete, A. A 30-m landsat-derived cropland extent product of Australia and China using random forest machine learning algorithm on Google Earth Engine cloud computing platform. ISPRS J. Photogramm. Remote Sens. 2018, 144, 325–340. [Google Scholar] [CrossRef]
- Souza, C.M., Jr.; Z. Shimbo, J.; Rosa, M.R.; Parente, L.L.; A. Alencar, A.; Rudorff, B.F.T.; Hasenack, H.; Matsumoto, M.; G. Ferreira, L.; Souza-Filho, P.W.M.; et al. Reconstructing Three Decades of Land Use and Land Cover Changes in Brazilian Biomes with Landsat Archive and Earth Engine. Remote Sens. 2020, 12, 2735. [Google Scholar] [CrossRef]


| Index | NDVI | EVI | GNDVI | NDWI | NBR |
|---|---|---|---|---|---|
| Equation (TM) | |||||
| Equation (OLI) |
| Band | B3 | B5 | NDVI | GNDVI | NDWI | NBR | F_shade | F_vege |
|---|---|---|---|---|---|---|---|---|
| Percentile | p25 | p90 | p50 | p50 | p50 | p75 | p10 | p50 |
| p50 | p90 | p75 | p90 | p75 | ||||
| p90 | p90 |
| Reference (MapBiomas) | |||||
|---|---|---|---|---|---|
| Others | Forest Plantation | Total | User Accuracy | ||
| Classification | Others | 19,423 | 104 | 19,527 | 0.99 |
| Forest Plantation | 256 | 217 | 473 | 0.46 | |
| Total | 19,679 | 321 | 20,000 | Overall accuracy = 98.2% | |
| Producer Accuracy | 0.99 | 0.67 | Kappa = 0.54 | ||
| Reference (MapBiomas) | |||||
|---|---|---|---|---|---|
| Others | Forest Plantation | Total | User Accuracy | ||
| Classification | Others | 19,000 | 204 | 19,204 | 0.99 |
| Forest Plantation | 251 | 545 | 769 | 0.69 | |
| Total | 19,251 | 749 | 20,000 | Overall accuracy = 97.7% | |
| Producer Accuracy | 0.99 | 0.73 | Kappa = 0.69 | ||
| Plot | Cycles | Plantation | Harvesting | Age |
|---|---|---|---|---|
| A | Cycle 1 | 01/November/1977 | 06/June/1983 | 7 years and 7 months |
| A | Cycle 2 | 23/October/1986 | 25/September/1995 | 8 years and 11 months |
| A | Cycle 3 | 14/February/1996 | 24/December/2001 | 5 years and 10 months |
| A | Cycle 4 | 21/June/2002 | 19/May/2008 | 5 years and 10 months |
| A | Cycle 5 | 30/June/2008 | 25/December/2013 | 5 years and 5 months |
| A | Cycle 6 | 25/August/2014 | 22/January/2021 | 6 years and 4 months |
| A | Cycle 7 | 14/October/2021 | - | - |
| B | Cycle 1 | 06/August/2002 | 09/December/2008 | 6 years and 4 months |
| B | Cycle 2 | 28/January/2009 | 18/April/2015 | 6 years and 2 months |
| B | Cycle 3 | 09/December/2015 | 09/March/2021 | 5 years and 3 months |
| B | Cycle 4 | 04/October/2021 | - | - |
| C | Cycle 1 | 27/October/1998 | 20/May/2004 | 5 years and 6 months |
| C | Cycle 2 | 23/August/2004 | 25/October/2010 | 6 years and 2 months |
| C | Cycle 3 | 21/February/2011 | 19/January/2017 | 5 years and 10 months |
| C | Cycle 4 | 07/June/2017 | - | - |
| D | Cycle 1 | 21/May/1998 | 05/February/2005 | 6 years and 8 months |
| D | Cycle 2 | 25/May/2005 | 12/January/2012 | 6 years and 7 months |
| D | Cycle 3 | 31/July/2012 | 23/January/2018 | 5 years and 5 months |
| D | Cycle 4 | 18/May/2018 | - | - |
| E | Cycle 1 | 31/October/1999 | 15/January/2007 | 7 years and 2 months |
| E | Cycle 2 | 10/February/2007 | 09/April/2012 | 5 years and 1 month |
| E | Cycle 3 | 26/June/2013 | 15/November/2018 | 5 years and 4 months |
| E | Cycle 4 | 25/June/2019 | - | - |
| F | Cycle 1 | 11/November/1977 | 13/June/1983 | 5 years and 7 months |
| F | Cycle 2 | 25/October/1986 | 15/July/1995 | 8 years and 8 months |
| F | Cycle 3 | 19/September/1995 | 28/December/2001 | 6 years and 3 months |
| F | Cycle 4 | 20/April/2002 | 15/May/2008 | 6 years |
| F | Cycle 5 | 24/June/2008 | 20/March/2013 | 4 years and 8 months |
| F | Cycle 6 | 09/December/2013 | 29/December/2019 | 6 years |
| F | Cycle 7 | 20/March/2020 | - | - |
Publisher’s Note: MDPI stays neutral with regard to jurisdictional claims in published maps and institutional affiliations. |
© 2022 by the authors. Licensee MDPI, Basel, Switzerland. This article is an open access article distributed under the terms and conditions of the Creative Commons Attribution (CC BY) license (https://creativecommons.org/licenses/by/4.0/).
Share and Cite
Shimabukuro, Y.E.; Arai, E.; da Silva, G.M.; Dutra, A.C.; Mataveli, G.; Duarte, V.; Martini, P.R.; Cassol, H.L.G.; Ferreira, D.S.; Junqueira, L.R. Mapping and Monitoring Forest Plantations in São Paulo State, Southeast Brazil, Using Fraction Images Derived from Multiannual Landsat Sensor Images. Forests 2022, 13, 1716. https://doi.org/10.3390/f13101716
Shimabukuro YE, Arai E, da Silva GM, Dutra AC, Mataveli G, Duarte V, Martini PR, Cassol HLG, Ferreira DS, Junqueira LR. Mapping and Monitoring Forest Plantations in São Paulo State, Southeast Brazil, Using Fraction Images Derived from Multiannual Landsat Sensor Images. Forests. 2022; 13(10):1716. https://doi.org/10.3390/f13101716
Chicago/Turabian StyleShimabukuro, Yosio E., Egidio Arai, Gabriel M. da Silva, Andeise C. Dutra, Guilherme Mataveli, Valdete Duarte, Paulo R. Martini, Henrique L. G. Cassol, Danilo S. Ferreira, and Luís R. Junqueira. 2022. "Mapping and Monitoring Forest Plantations in São Paulo State, Southeast Brazil, Using Fraction Images Derived from Multiannual Landsat Sensor Images" Forests 13, no. 10: 1716. https://doi.org/10.3390/f13101716