Article

Assessment of the Effects of Artificial Fungi Inoculations on Agarwood Formation and Sap Flow Rate of Aquilaria malaccensis Lam. Using Sonic Tomography (SoT) and Sap Flow Meter (SFM)

by
Abd-Majid Jalil
1,2,*,
Hazandy Abdul-Hamid
2,3,
Sahrim-Lias
1,
Mohd-Khairun Anwar-Uyup
1,
Paridah Md-Tahir
3,
Sheriza Mohd-Razali
2,
Ahmad-Azaruddin Mohd-Noor
1,
Samsuddin Ahmad Syazwan
1,
Alliesya-Shamelia Shamsul-Anuar
2,
Mohamad Roslan Mohamad Kasim
3,
Johar Mohamed
3 and
Rambod Abiri
3
1
Forest Research Institute Malaysia, Kuala Lumpur 52109, Malaysia
2
Laboratory of Bioresource Management, Institute of Tropical Forestry and Forest Products, Universiti Putra Malaysia, Seri Kembangan 43400, Malaysia
3
Department of Forestry Science and Biodiversity, Faculty of Forestry and Environment, Universiti Putra Malaysia, Seri Kembangan 43400, Malaysia
*
Author to whom correspondence should be addressed.
Forests 2022, 13(10), 1731; https://doi.org/10.3390/f13101731
Submission received: 20 September 2022 / Revised: 15 October 2022 / Accepted: 16 October 2022 / Published: 20 October 2022
(This article belongs to the Special Issue Fungal–Plant Interactions: Latest Advances and Prospects)

Abstract

:
Agarwood is a valuable aromatic resinous wood that is biosynthesised when a fungal attack injures the healthy wood tissue of the Aquilaria tree. The magnitude of infection related to sap flow (SF) is one of the most critical functional traits to evaluate the tree’s response to various adverse conditions. Therefore, the objective of this study was to investigate the reliability of sonic tomography (SoT) and sap flow meter (SFM) in studying the influence of inoculation fungi Pichia kudriavzevii Boidin, Pignal and Besson, and Paecilomyces niveus Stolk and Samson, on deteriorated wood (Dt) and SF rate in Aquilaria malaccensis Lam. A. malaccensis trees with small, medium, and large diameters were inoculated with each fungus separately at the bottom, middle, and top positions of the tree and the area of sapwood was measured after 6, 12, and 24 months to stimulate the agarwood formation. Furthermore, the SF rate was assessed using SFM in the position of the selected trees. There was a significant difference (p ≤ 0.05) in Dt% and SF rate between inoculated and uninoculated trees. The Dt percentage in trees inoculated with P. kudriavzevii, P. niveus, and control trees was 25.6%, 25.7%, and 15.0%, respectively. The SF rate was lower in P. kudriavzevii, with 207.7 cm3/h, than in the control trees, with 312.9 cm3/h in the small-diameter class. In summary, the results of this study emphasise the importance of inoculation duration (24 months) and the effects of water conductivity, especially tree diameter class (small), on the biosynthetic response of resinous substance.

1. Introduction

Aquilaria species (family Thymelaeaceae) are one of the main sources of valuable fragrant wood, known as agarwood [1,2]. Agarwood is commonly used as incense, traditional medicine, and fragrance. For medicinal purposes, incense treats thyroid cancer, asthma, colic, diarrhoea, stomach ailments, etc. [3,4]. The high demand for agarwood has led to a supply shortage of Aquilaria from native forests [5,6]. Aquilaria species have been listed in Appendix II of the Convention on International Trade in Endangered Species of Wild Fauna and Flora (CITES) since 2004 to ensure the sustainability of the genus [7].
It is commonly reported that agarwood is produced only in infected trees by natural and/or artificial invasion of fungi [5]. In a natural forest, only 7%–10% of the trees contain agarwood [8]. Therefore, the lack of sufficient natural resources for Aquilaria sp. has led most agarwood-producing countries to cultivate trees and produce agarwood through artificial injury using inducing agents [9]. Although, there are different chemical and biological inducers, it has been well demonstrated that biological inducers are safer, more environmentally friendly, and popular. Artificial inoculation involves introducing cultures of microbial flora (for example, yeast and fungi) into the tree to mimic the pathological condition [10]. Most inoculation methods use a device that functions as a drip to slowly deliver the fungi inoculants into the tree through a drilled hole. The fungi are transported into the trees via the tree’s hydraulic system [11,12]. Fusarium sp., Trichoderma sp., Curvularia sp., Aspergillus sp., Lasiodiplodia sp., and Penicillium sp. are amongst the fungi that have been used for artificial induction of agarwood [8,10,13,14].
The living cells (parenchyma) in the secondary xylem of woody plants can response dynamically to xylem infection and mechanical damage by fungi. In Aquilaria sp., microbial invasion of plant tissue is considered an infection; therefore, the plant cells produce a phytoalexin compound [15]. The production of phytoalexin compounds in woody plants, such as Aquilaria sp., is part of the defence mechanism against disease or pathogens invasion. Phytoalexin compounds can be found in brown colour and fragrant resin, and accumulate in the xylem and phloem vessels to prevent the spread of wounds to other tissues [16].
Traditionally, agarwood determination relied on the natural signs visible on the tree’s outer parts. The traditional and unfavourable method of determining the presence of agarwood is to cut the Aquilaria sp. This method can destroy healthy trees without confirming the internal conditions [17]. Furthermore, the percentage of agarwood yield was unpredictable and, in some cases, less than expected in destroyed Aquilaria sp. [5]. As a result, an environmentally friendly approach is needed to investigate agarwood formation. There are several non-invasive or non-destructive imaging techniques, such as X-ray tomography [18], magnetic induction tomography (MIT) [19], acoustic techniques, and non-invasive sonic tomography (SoT) technology [20], which estimate the volume of agarwood resin embedded in a tree [19]. Amongst the mentioned techniques, SoT has been introduced as the simplest and least expensive technique. The system converts the velocities into percentages and interprets the percentages by tomogram colour images that match the internal condition of the trunk [17,19,21,22].
The interaction of fungi pathogenicity with the SF rate could be highlighted as a physiological indicator in the agarwood industry. Most prior studies indicated that environmental factors strongly influenced SF [11,23]. Abiotic factors, including light, temperature, and drought, have influenced the sap flux rate. For example, higher irradiance, higher water deficit, higher vapour pressure deficit, and lower soil moisture decreased the rate of sap flux [23,24]. Similarly, previous studies’ results showed that the biotic invasion could cause a reduction in the sap flux and water usage, leading to plants being susceptible to pathogens attack [25,26]. For instance, a reduction in the sap flux rate was reported in the infected Acacia implexa trees by Uromycladium tepperianum [27]. Likewise, it has been demonstrated that the SF rate gradually decreased in the Ulmus glabra (Wych elm) trees after 16 days of inoculation by Ophiostoma novoulmi [26].
Additionally, the SF rate was reduced in Carya cordiformis when the tree was inoculated with Ceratocystis smalleyi [28]. A sap flow meter (SFM) can measure the SF rate and greatly advance the knowledge of the hydraulic function for water conduction and consumption of Aquilaria trees under biotic stress conditions. On the other hand, studying the influence of fungal invasion on agarwood formation is an interesting aspect of the plant-defence mechanism. Therefore, interpreting the fungi–agarwood interaction and studying the fungi pathogenicity–sap flow rate interface may open a new perspective towards a better understanding of the role of SF rate as an indirect marker in agarwood formation.
Malaysia is one of the world’s most important agarwood-producing countries [29], especially in Southeast Asia. Due to the high demand for this valuable resinous wood, the current stock of natural agarwood is insufficient to meet the demand in the international market [10]. Therefore, Malaysia needs to produce agarwood consistently to have the sufficient raw material for the generation of agarwood by-products and a sustainable agarwood industry. It is not practical to continue to rely on native forests alone, and thus, Aquilaria production needs to be more stable with forest plantation establishment [30]. Aquilaria, like some other woody plants, produces resins through the tree’s defence mechanism in response to stimuli, such as fungal infections, lightning strikes, fires, and insect attacks [31], and produces high-quality agarwood. However, the quality is inconsistent because the period of formation varies. Several artificial wounding methods, including chopping, nailing, holing, and trunk breaking have been used to produce agarwood to address this issue. However, these methods often take a long time, with inadequate and low-quality agarwood production [32]. In addition, the conventional measurement of agarwood is a destructive and critical task that may negatively impact the quality and quantity of agarwood.
Therefore, understating the quality and quantity of agarwood and determining the best part of the tree with a higher agarwood level are worth investigating. Therefore, the objective of this study was to investigate the reliability of sonic tomography (SoT) and sap flow meter (SFM) in studying the influence of inoculation fungi Pichia kudriavzevii Boidin, Pignal and Besson, and Paecilomyces niveus Stolk and Samson, on deteriorated wood (Dt) and SF rate in Aquilaria malaccensis Lam., trees. To the best of the authors’ knowledge, the current study is the first attempt to examine SF rate as an indirect identification marker for agarwood formation in A. malaccensis under pathogen invasion.

2. Materials and Methods

2.1. Study Area

An experiment was conducted on a cultivated Aquilaria malaccensis plantation (longitude of 3.6383° N and latitude of 102.8052° E, 100 m above sea level) at the FRIM Research Station, Maran, Pahang, Malaysia (Figure 1). An area of 2.5 ha was planted with A. malaccensis at a planting density of 625 trees ha−1 (4 m × 4 m spacing) in 2008. The sources of planting material were seedlings. The seedlings were sown in polybags before being transplanted into the plots. The topography of the study area was flat to hilly. The study was conducted from February 2018 to June 2020. Monthly report by the FRIM Maran Weather Station report showed that mean annual rainfall, temperature, and humidity for 2020 were 155.4 mm, 33 °C, and 78%, respectively.

2.2. Tree Selection Method

A total of 27 trees for non-invasive sonic tomography (SoT) technology and 15 for SF rate were selected for measurements. The trees were randomly chosen using a normal distribution statistical method based on their diameter classes (DC), namely, small-diameter breast height class (DC1 < 15 cm), medium-diameter breast height class (15 cm < DC2 < 25 cm), and large-diameter breast height class (DC3 > 25 cm). In the SoT study, data were recorded using a mobile device that allowed observation of 27 trees in an experimental design: 3 treatments × 3 diameter classes × 3 inoculation positions. In contrast, in the SF study, the number of sensors for the thermal dissipation probe (TDP) and the distance between trees were large. Therefore, the experimental design was as follows: 2 inoculations × 3 diameter classes × 2 replicates + 3 control trees. Table 1 shows the diameter classes and treatment types used in the SoT study.

2.3. Identification of Fungi

Two types of biological fungal inoculants were obtained from local agarwood inducers, labelled as Inoculant A and Inoculant B. For fungus identification, the inoculant samples were sent to the Mycology and Pathology Laboratory at the Forest Research Institute Malaysia (FRIM). The samples were isolated on Difco® potato dextrose agar (PDA) (BD Diagnostics, Franklin Lakes, NJ, USA) media fortified with 1% of streptomycin sulphate to suppress bacterial growth (Sigma Aldrich Co, St. Louis, MO, USA). For identification, the growing fungi were re-isolated on the PDA and given the isolate numbers FRIM1421 and FRIM1419 for the fungi that were isolated from Inoculant A and Inoculant B, respectively. Morphology identifications were observed using an Olympus BX61 compound microscope (Olympus Corporation, Tokyo, Japan) and using the available keys based on the morphological features of the fungus under 1000× magnification. Single spore cultures were produced from each fungal isolate on Difco® potato dextrose agar (PDA) according to the standard protocols for DNA-based identification [33]. Fungal colonies that grew during incubation were identified by their growth rate and characteristic colony morphology. For both inoculants, colony-forming units (CFU) were counted in the sample of the original solution. Cell counts were standardized to 107 CFU/mL for each inoculated fungus. For each inoculated hole, 108 CFU of the inoculated fungus were estimated in 10 mL of solution.
The isolated fungi were of the cosmopolitan kind, which was prevalent in the environment. Pichia kudriavzevii was recognised as the fungus isolated from Inoculant A (FRIM1421), whereas Paecilomyces niveus was identified as the fungus recovered from Inoculant B (FRIM1419). BLAST searches revealed that the findings for FRIM1421 and FRIM1419 were 100% identical to P. kudriavzevii (MT233404; MT138566; MT102788) and P. niveus (MT792005; GQ241275), respectively. The acquired DNA sequences from FRIM1421 and FRIM1419 isolates were deposited in GenBank under the accession numbers OP295049 and OP295048, respectively.

2.4. Inoculation Treatments

The inoculants containing P. kudriavzevii and P. niveus were dripped into the tree according to a predetermined class using inoculation accessories (Figure 2A). Each inoculation position was drilled using a 6 mm diameter drill and 6 cm depth into the trunk and tilted slightly at an angle of 30° (Figure 2B). Then, the holes for each position were filled with 10 mL of inoculant into a rubber tube using a syringe (Figure 2C). On individual trees, the inoculation positions (PT) were set up at the bottom (PT1—30 cm), middle (PT2—130 cm), and top (PT3—200 cm) from the ground (Figure 2D). The inoculation treatment was carried out by three replicates for each diameter class (Table 2).

2.5. Observation of the Effects of Inoculations

The effect of inoculation was observed after 6, 12, and 24 months. The observations were conducted by using two methods: (1) visually and (2) through a non-invasive sonic tomograph (SoT). The height of the affected area was measured using the measuring tape on the wood surface by peeling the bark. The discolouration was recorded using a digital camera (Canon EOS M50) to see the changes. A few trees (9 trees) were selected for visual observation to avoid the natural fungi invasion of the wood surface. The visual observations were only performed in the medium diameter class (DC2) at the middle position (PT2).
The PiCUS® Sonic Tomograph (Argus Electronic GmbH, Rostock, Germany) was used to measure the percentage of the healthy wood or solid zone (So), affected wood or deteriorated zone (Dt), and the area between healthy/affected wood known as intermediate zone (Im). Usually, the PiCUS Tomograph measured the velocity of sonic waves in wood to detect decay and cavities in the standing trees. The collected sound-wave velocity transmission data were set up as shown in Figure 3. Six to ten sensors were used for this study, placed parallel to the tree vertically near the point of inoculation (Figure 3A). The sensors were magnetically attached at specific heights (Figure 3B).
The system converted the velocities into percentages and interpreted the percentages by tomogram colour images, matching the trunk’s internal condition. The tomogram image’s colour represented the fungus attack’s effect on the standing tree. The colour legend and its definition also indicate the solid (So), intermediate (Im), and deteriorated (Dt) wood (Table 3).

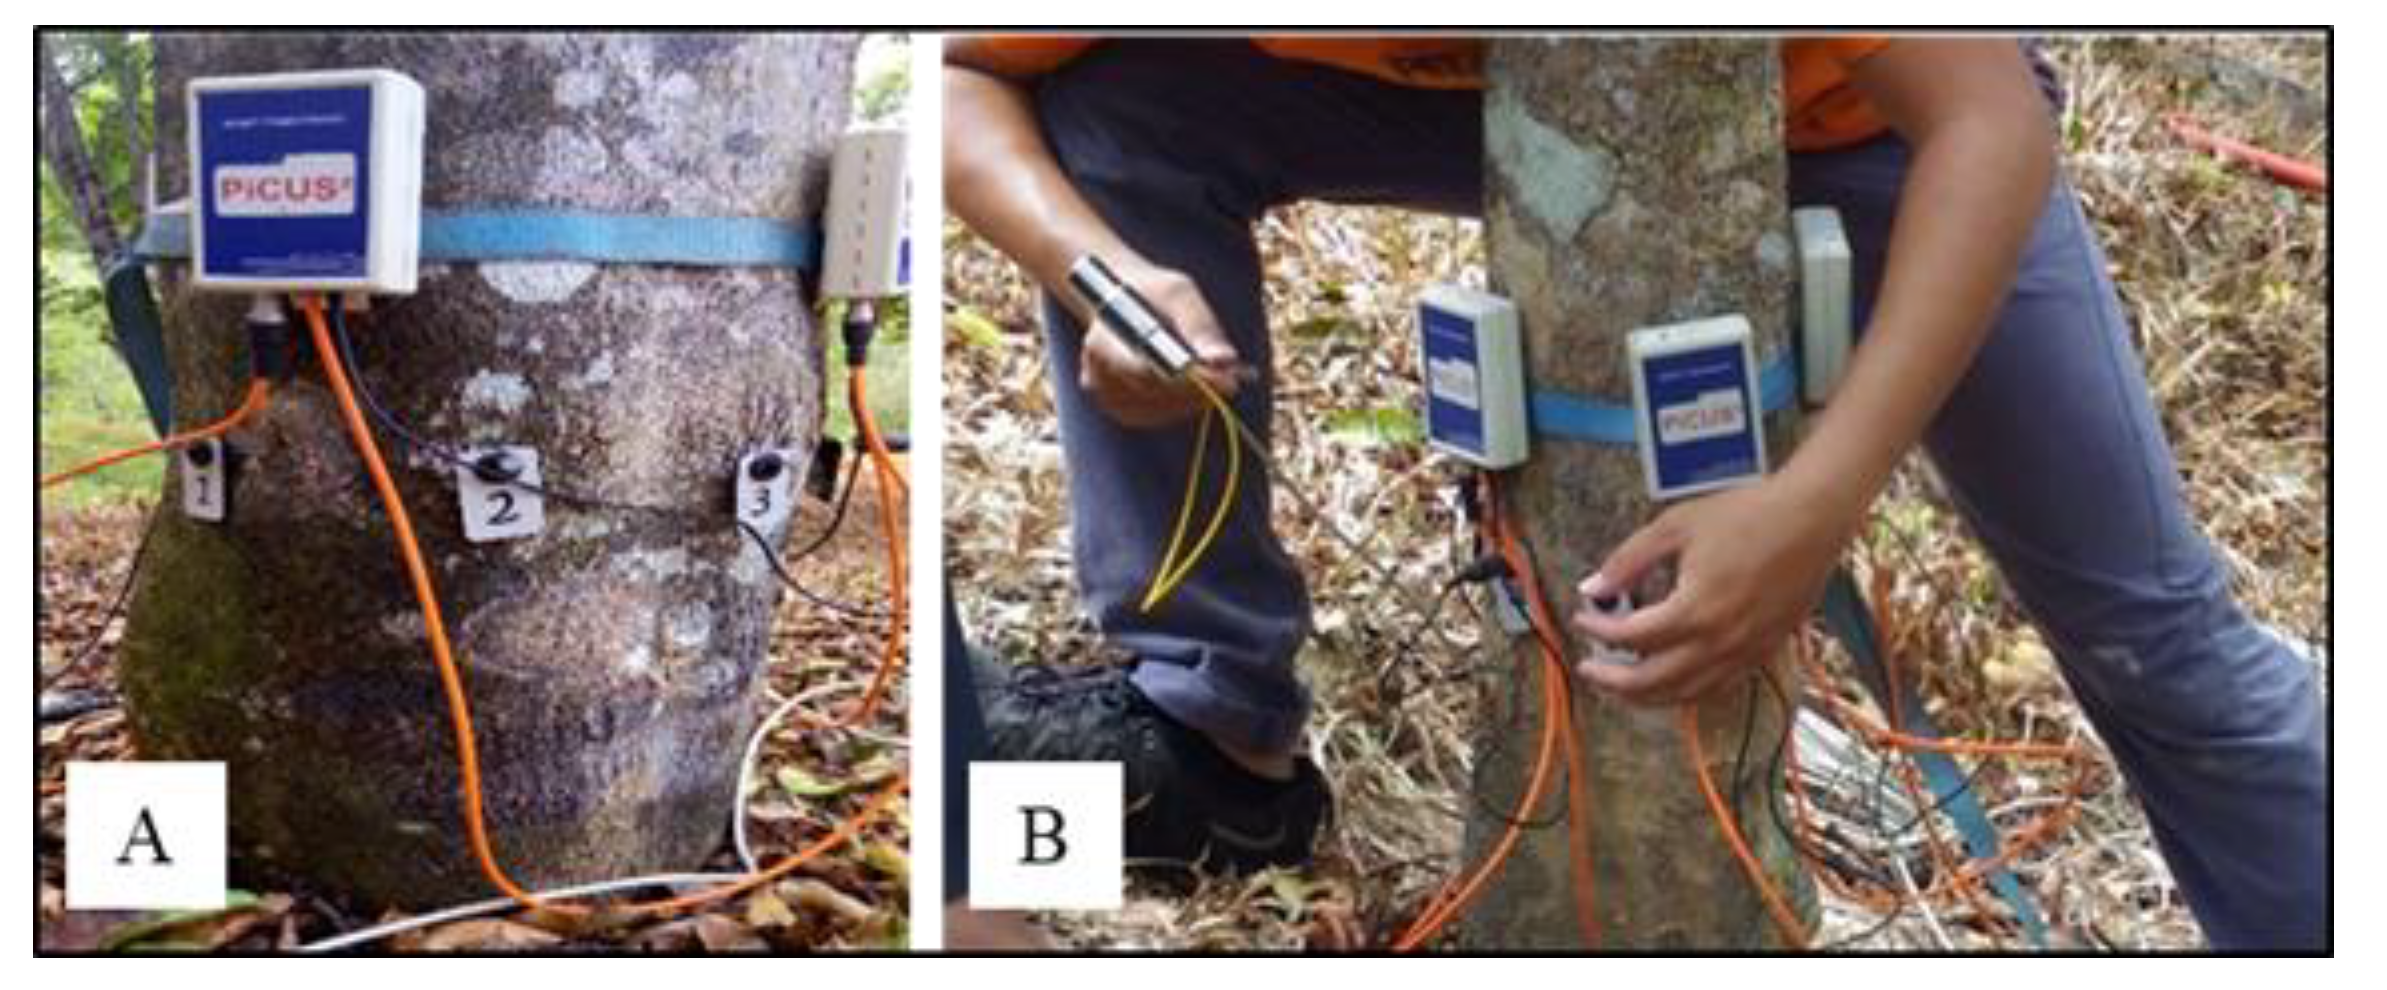
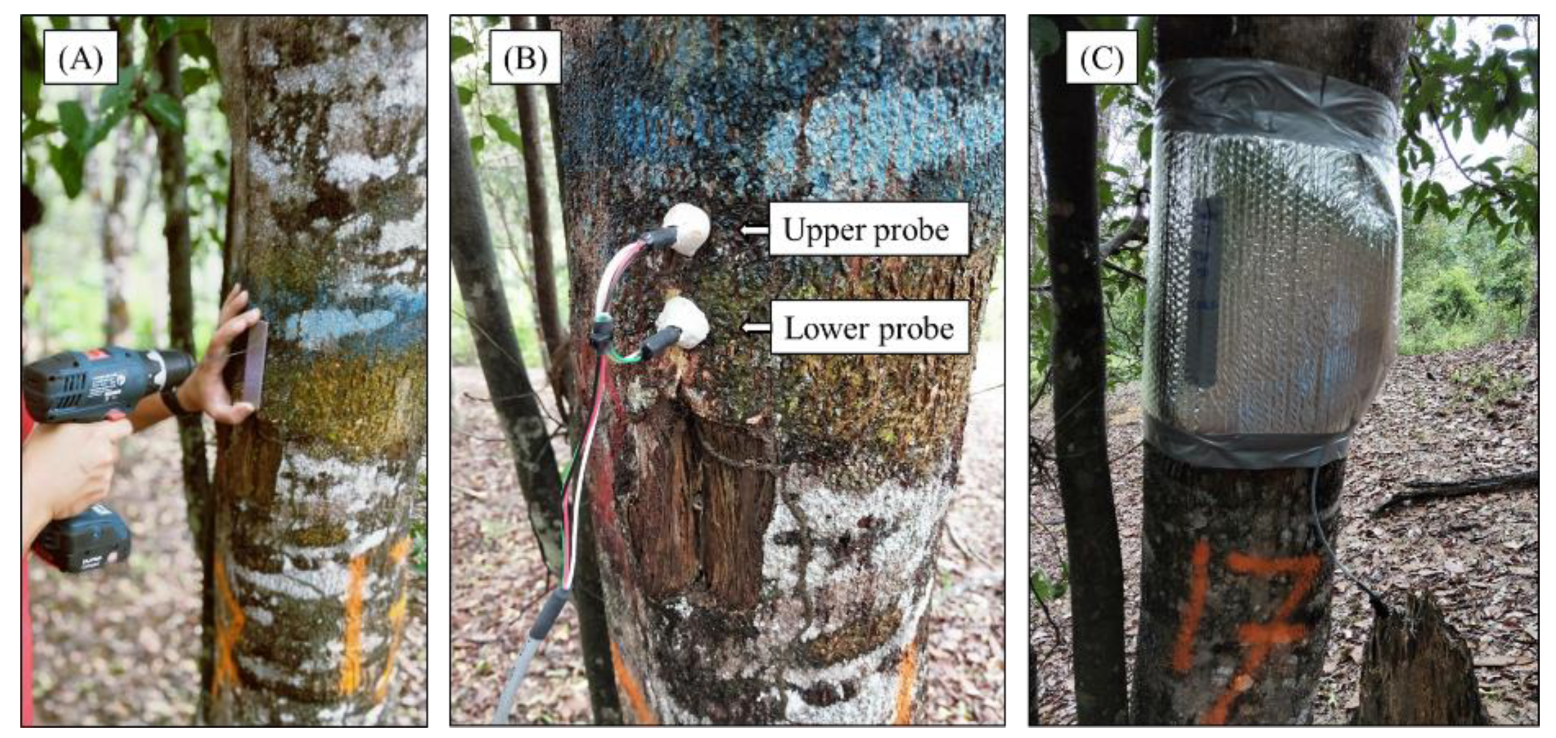
2.6. Observation of the Effects of Sap Flow (SF) Rate

The sap flow (SF) rate measurements were performed at the middle position (PT2). A total of 15 TDP thermocouples, representing each diameter class, was connected to a differential channel of the CR1000 advanced data logger. The collected data were supported by PC400 software that facilitates programming, communication, and reliable data exchange between a PC and a CR1000 data logger.
Two small holes were appropriately drilled on the south-facing side (to avoid radiant heat from the sun) of the stem, at 5 cm above the inoculation point (130 cm from the ground) (Figure 4A). A selection of appropriate TDP (TDP-30, TDP-50, and TDP-100) between diameter classes was inserted into the drilled holes. This ensured proper thermal contact between the probes and the xylem. This method used two cylindrical probes with a diameter of 2 mm and an effective measuring length of 20 mm. The two probes were inserted into the hydro-active xylem of the tree stem with a vertical spacing of 10 cm to 15 cm (Figure 4B). The upper probe was heated with constant energy (200 mW DC). It contained an electric heater, which was dissipated as heat into the sapwood and vertical SF surrounding the probe. The lower probe was left unheated to monitor the ambient temperature of sapwood. Both thermocouples were connected at the constantan end and thus gave an output representing the temperature difference between the two probes (1 °C = 40 µVolt for copper-constantan at 20 °C).
All sensors were connected to the data loggers and heater boxes. Data were recorded every 60 s and stored every 60 min. The sensors were then covered with an aluminium box and an insulating film was placed around the tree boot to protect them from the rainfall and the effects of radiant heat and convective heat loss (Figure 4C).
Hydraulic conductivity was measured with an SF meter and recorded over time [34,35]. SF was measured using the FLGS-TDP XM1000 Sap Velocity System, a complete CR1000-based logger system for 32 TDP probes (Dynamax, Inc., Houston, TX, USA). SF velocity measurements were made using the Thermal Dissipation Probe (TDP) transpiration sensor, and then converted to volumetric flow rates. The probe needles measured the temperature difference (dT) between the heated needle and the ambient temperature of the sapwood. The variable dT and the maximum dTm at zero flow allowed a direct conversion to the sap velocity, u.
SF density u (cm s−1) was calculated based on [36] as follows:
u = 119 × 10−6.K1.231
where 119 × 10−6 and 1.231 are empirical constants from the calibration, and K is the SF index that is related to the temperature difference between the two probes as calculated below:
K = Δ T m Δ T Δ T
where m is the temperature difference, ∆T, at zero flow (u = 0). The total SF (F) of a tree (cm3 cm−2 s−1) is estimated as follows:
F = u . A s w × 3600
where Asw is the cross-sectional area of sapwood at the point of insertion of the heated probe. These SF values were then multiplied by 3600 to obtain units per hour. The unit was then simplified as cm3/h.

2.7. Statistical Analysis

This study was conducted on a 10-year-old Aquilaria malaccensis plantation. Trees to be inoculated with fungi were randomly selected and included three different diameter classes; this method was intended to represent the study area. Therefore, the statistical analysis was conducted using SAS version 9.3 (SAS Institute, Inc., Cary, NC, USA). Analysis of variance (ANOVA) was employed to analyse any differences in the data studied. A Tukey multiple comparison test, for post hoc analyses, was used to confirm the differences between means of multiple groups.

3. Results and Discussion

This study was conducted on A. malaccensis plantation at the FRIM research station. This study visually observed the effects on the outer wood of selected inoculated and control trees. A non-invasive SoT measured the areas affected by the sapwood. Further investigation was conducted on the damaging effects of the interaction between inoculation types, diameter classes, and position levels within 24 months.

3.1. Visual Observation

The effects of discolouration at the infected sites were observed visually by peeling the bark around the inoculation area. The size of the infected area was measured perpendicular to the trunk (Table 4). The infected tissue was visible on the wood surface infested by P. kudriavzevii. Discolouration on the trunk surface was observed at lengths of 9.2 cm, 6.8 cm, and 3.2 cm after 6, 12, and 24 months, respectively. The colour of the wood tissue changed from pale brown to yellow-brown and slightly darker around the copper tube after six months (Figure 5A1). The discolouration around the inoculation hole disappeared after 12 months (Figure 5A2) and turned to the original wood colour after 24 months (Figure 5A3).
In the trees inoculated with P. niveus, the lengths of the infested area after 6, 12, and 24 months were 11.8 cm, 10.6 cm, and 11.5 cm, respectively. The wood surface discoloured from pale brown to yellow brown after six months and was surrounded by a dark brown margin (Figure 5B1). The discolouration disappeared after 12 months but was left with scars (Figure 5B2). After 24 months, the scars were even darker (Figure 5B3). The control tree’s surface retained the wood’s original colour during the observed months (Figure 5C1–C3).
It is well known that the invasion of pathogens can cause wounds on the tree surface and the transmission of stress signals triggers the plant’s self-defence mechanism. When wounding, the secondary wall forms a barrier zone that restricts the pathogen’s spread in both vertical and lateral directions. Later, the barrier zone of parenchyma cells undergoes a series of changes before the new tissues can resume their development after successful wound division [36]. These anatomical structures are also responsible for producing, storing, and distributing chemical components to the wounded area, replenishing the compartments, and impregnating the resins in the cell wood [37]. This process is the basis for the development of agarwood formation in the wounded area. The discolouration was visible in the first six months after inoculation of P. kudriavzevii and P. niveus (Figure 5A1,B1) when a barrier zone developed, and fungal spread was limited around the inoculation hole. According to [14], a resinous zone developed around the wound as early as one month after inoculation and expanded three to six months after inoculation. Both inoculants exhibited discolouration patterns; the wound area of P. kudriavzevii recovered, while P. niveus maintained the size of the injury. Therefore, discolouration due to fungal inoculation may not have the same effect concerning the wood’s injury. In their previous study, it was suggested that the duration of wood cell stress determined the extent of response of A. malaccensis trees [13]. The observation showed that the discolouration began to disappear after 12 months (Figure 5A2,B2) and completely disappeared after 24 months (Figure 5A3,B3) as the cells formed new tissues in the cambium.

3.2. Non-Destructive Observation

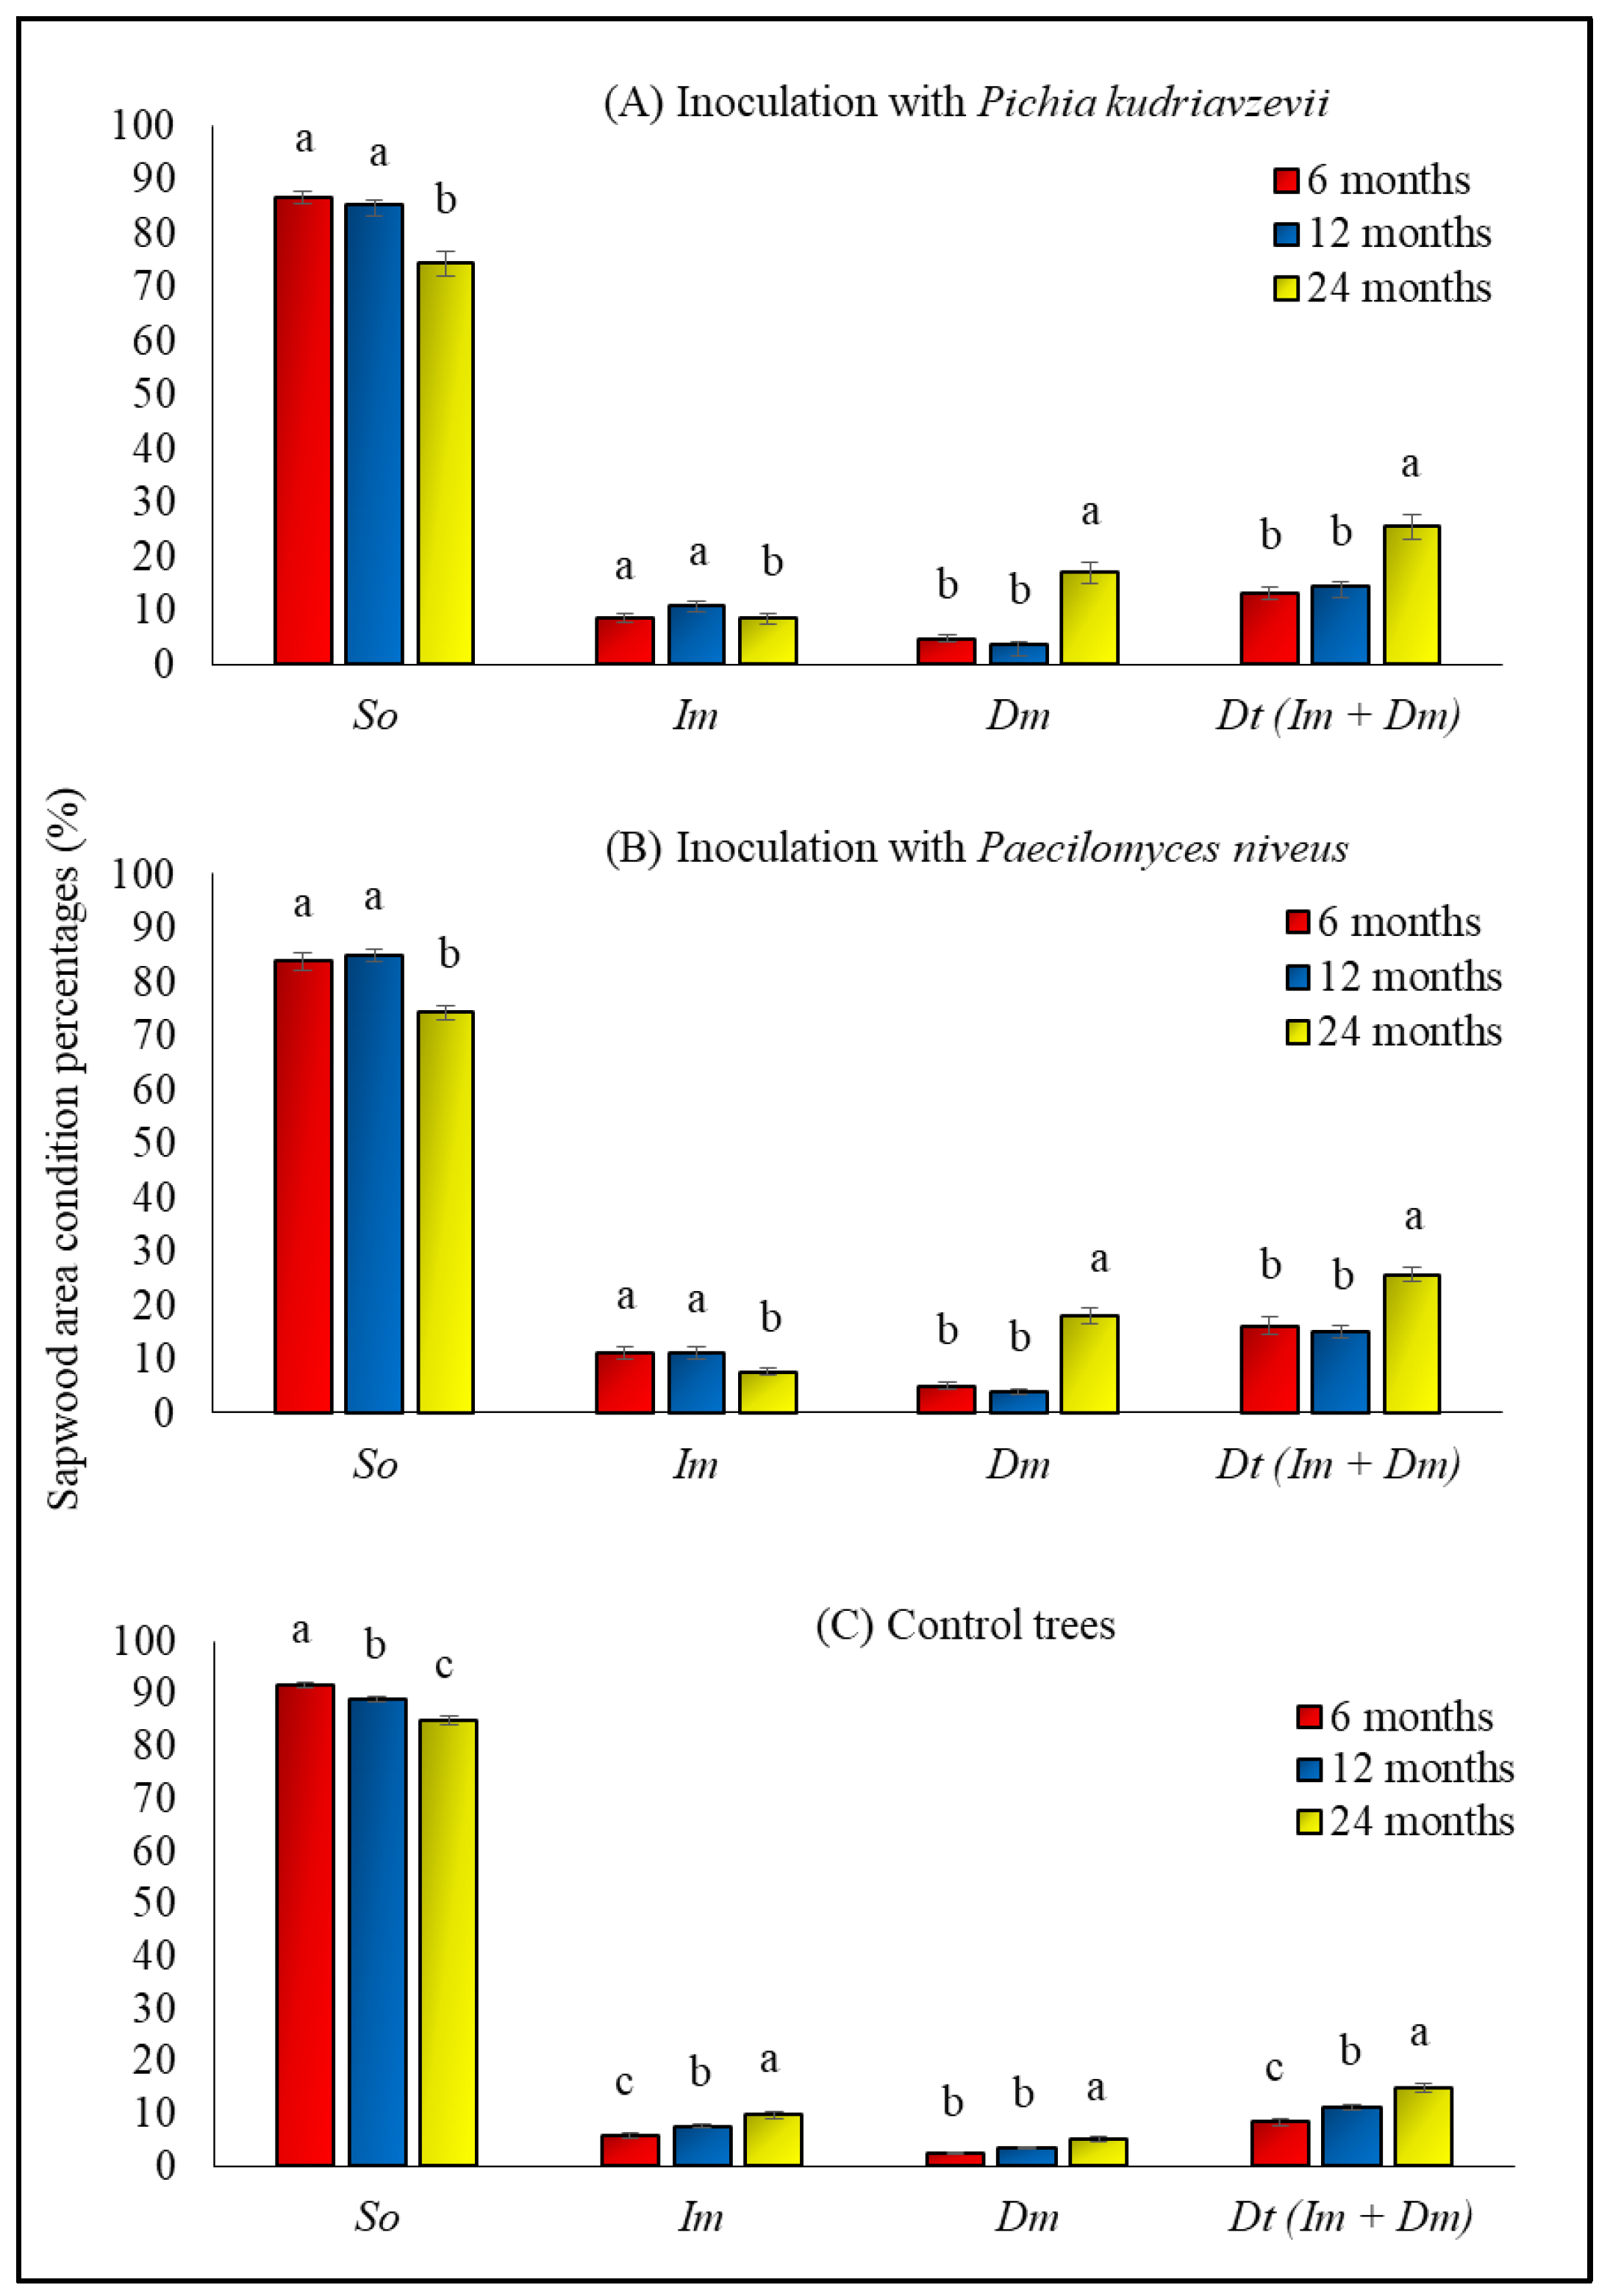
3.2.1. Sapwood Area Condition Effects

The results of ANOVA and Tukey’s multiple comparison test showed significant differences (p ≤ 0.05) in So% and Dt% in the trees inoculated with P. kudriavzevii in the measured months (Figure 6A). The highest and lowest So% were observed after 6 and 24 months, with 86.7% and 74.4%, respectively. On the other hand, the highest and lowest Dt% were observed after 24 and 6 months, with 25.6% and 13.3%, respectively (Figure 6A).
The ANOVA test result showed significant differences (p ≤ 0.05) in So% and Dt% in the trees inoculated with P. niveus in the measured months (Figure 6B). The highest and lowest So% were observed after 12 and 24 months, with 85.0% and 74.3%, respectively. On the other hand, the highest and lowest Dt% were observed after 24 and 12 months, with 25.7% and 15.0%, respectively (Figure 6B).
The ANOVA test result showed significant differences (p ≤ 0.05) in So% and Dt% in control trees at the measured months (Figure 6C). The highest and lowest So% were observed after 6 and 24 months, with 91.6% and 85.0%, respectively. On the other hand, the highest and lowest Dt% were observed after 24 and 6 months, with 15.0% and 8.4%, respectively (Figure 6C).
P. kudriavzevii and P. niveus inoculants effectively influenced the So% and Dt% during 24 months of inoculation. Although Dt% was reported in control trees, the affected area was significantly lower compared to P. kudriavzevii and P. niveus inoculated trees. Several studies claimed that the fungal inoculant played an important role in influencing the extent of the affected zone in the sapwood area [38,39]. It has been reported that the So% had reduced due to fungal growth in the sapwood area, resulting in dynamic live cell composition [36]. As a result, secondary metabolites in P. kudriavzevii and P. niveus have become active around the inoculation area.
The enlargement of hyphae within the cell wall and towards the microfibrils resulted in the formation of cavities in the form of oval or round holes in secondary cells [36]. Both fungi trigger plant defence mechanisms by preferentially degrading cellulose structure and leaving lignin mostly intact. The aforementioned changes can activate tree biosynthesis by producing phytoalexin compounds that act as a defence against disease or pathogens and prevent their spread to other cell woods. Phytoalexin compounds can be found in brown colour and fragrant resin and accumulate in the xylem and phloem vessels to prevent the spread of wounds to other tissues [16,40]. As a result, the accumulation of phytoalexin in the form of a resinous substance later became known as agarwood in the infected area [41].
These results indicated that the tree response to inoculation occurred several months after inoculation. It was reported that 30 months after Fusarium solani invasion on the 11-year-old A. malaccensis, 88% of the tree zone was healthy (So). Simultaneously, the zone with healthy wood was 89% in control (uninoculated) trees [17]. Nevertheless, the percentage of deteriorated (Dt) zone in inoculated and uninoculated trees was 11% and 10%, respectively.
The differences in Dt% value in this study were probably due to the type and severity of fungi. Previous studies have confirmed fungi’s positive function in generating agarwood formation in the wound area [8,13,42]. The results also demonstrated that treated trees were affected as early as six months after inoculation, while other studies reported that agarwood formation occurred within 3, 6, and 12 months after infection [39,43]. Another study by [44] found that agarwood formation occurred 18 months after fungal inoculation.

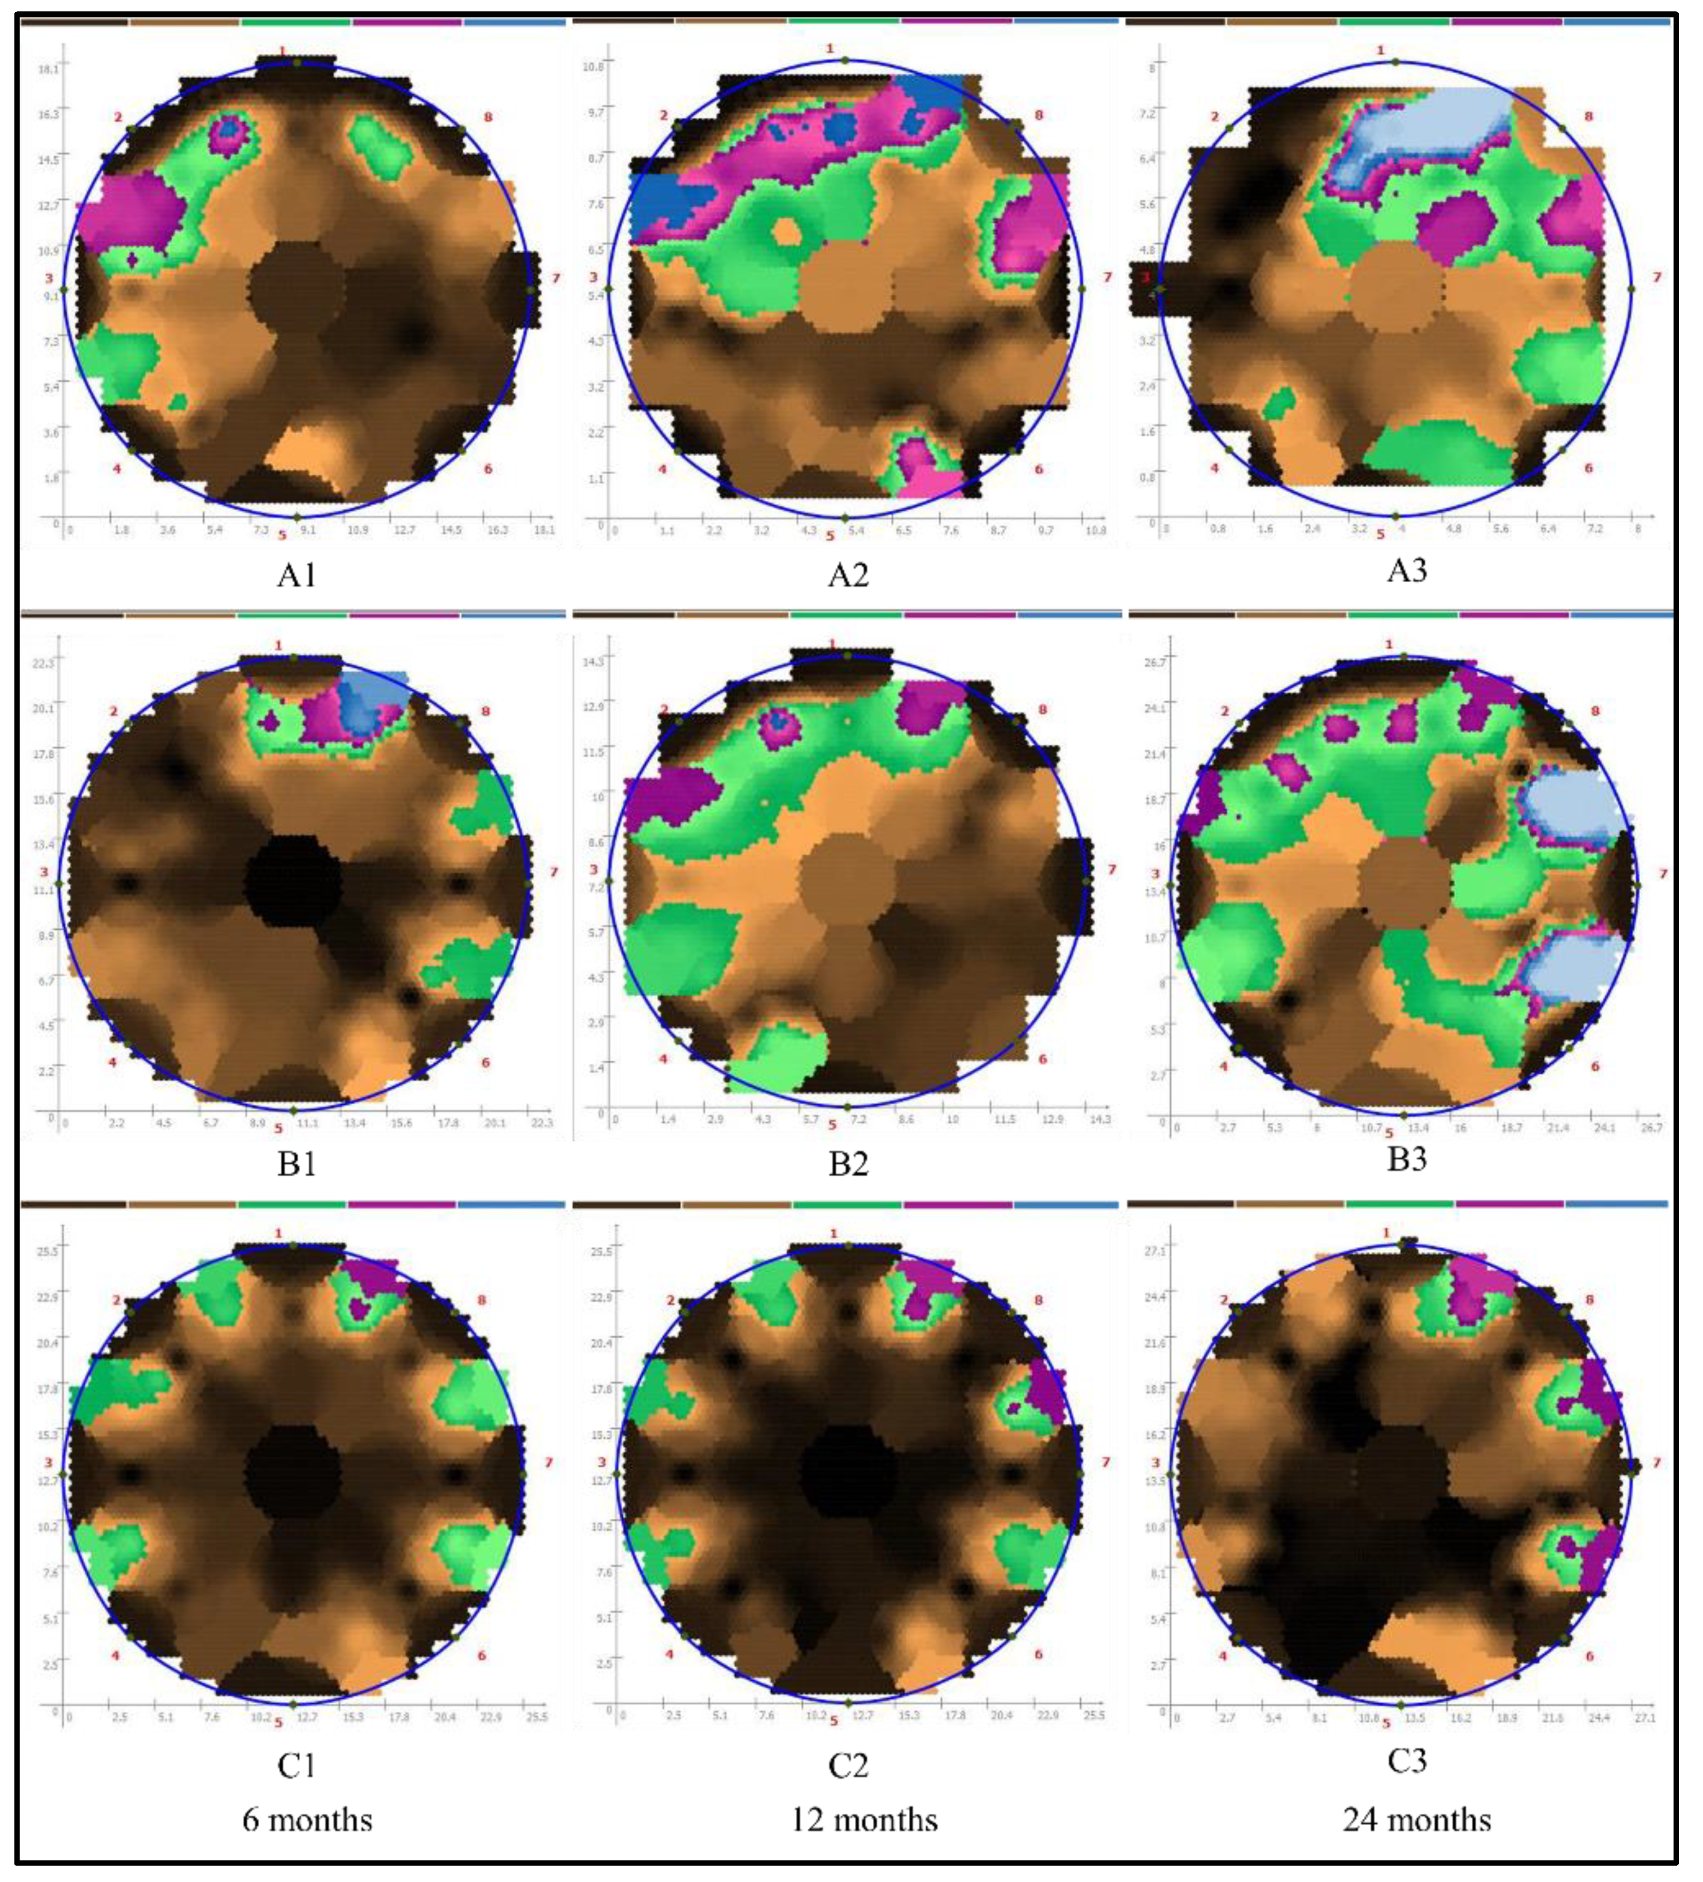
3.2.2. Detection of Differentiation by Tomogram Colour Images

Tomogram colour images obtained with the PiCUS® sonic tomography program provided information on the internal condition of the sapwood area in the inoculated trees. The brown-black colour observation during the first six months of fungi invasion showed the dominance of solid intact, or healthy wood areas. However, discolouration became evident at 12 months to 24 months after inoculation (Figure 7). Discolouration began after six months in trees infested with P. kudriavzevii when an initial green-purple colour appeared, indicating early to moderate fungal infestation (Figure 7A1). The transitional colour condition accompanied some bluish after 12 months, indicating an increase in the size of the infested area (Figure 7A2). The bluish colouration was remarkable after 24 months, indicating enlargement of the infested area (Figure 7A3). An initial colour change to green, violet, and bluish around the inoculation hole indicated an early to moderate fungal infection after six months by fungus P. niveus (Figure 7B1). These colour transitions intensified after 12 months (Figure 7B2) and extended to advance damaged areas by bluish colouration after 24 months (Figure 7B3).
Tiny discolourations of brown-black to greenish colour appeared at the insertion sites of the sensor nails in the control trees (Figure 7C1). However, after 12 months, violet colouration appeared with the remaining greenish colour at the sensor points (Figure 7C2). Interestingly, the transition process of discolouration from greenish to brown-black (original colour) was visible in some parts of the sensor zones after 24 months (Figure 7C3).
As mentioned earlier, a 24-month inoculation of trees with P. kudriavzevii and P. niveus was more effective in expanding decay zones in the sapwood area. The importance of inoculation duration on the spread of the infection area and the expansion of infestation zones was also confirmed in other studies [45,46]. However, it was difficult to determine whether the infested area formed either resinous or decaying wood. The visual observation revealed that the resinous wood was more intact than the healthy wood or So zone. The non-invasive SoT measurement involves measuring the sonic velocity across the diameter of a trunk, which reflects the condition inside the trunk. The fastest velocities indicated intact wood, while the slower sound velocities described deteriorated areas in the wood [47].
It was also stated that colour tomograms could not distinguish the types of fungal invasion in a tree, but the pattern image detected by the tomogram could represent the shape of the affected areas. It was confirmed that the affected area after the tree fell was similar to the deteriorated zone’s tomogram image. However, it is worth noting that the size and shape of the tomogram image are larger than the actual deteriorated area [21,48,49]. Nevertheless, these early signs of wood damage could guide harvesting potential trees rather than cutting trees without knowing the expected results.

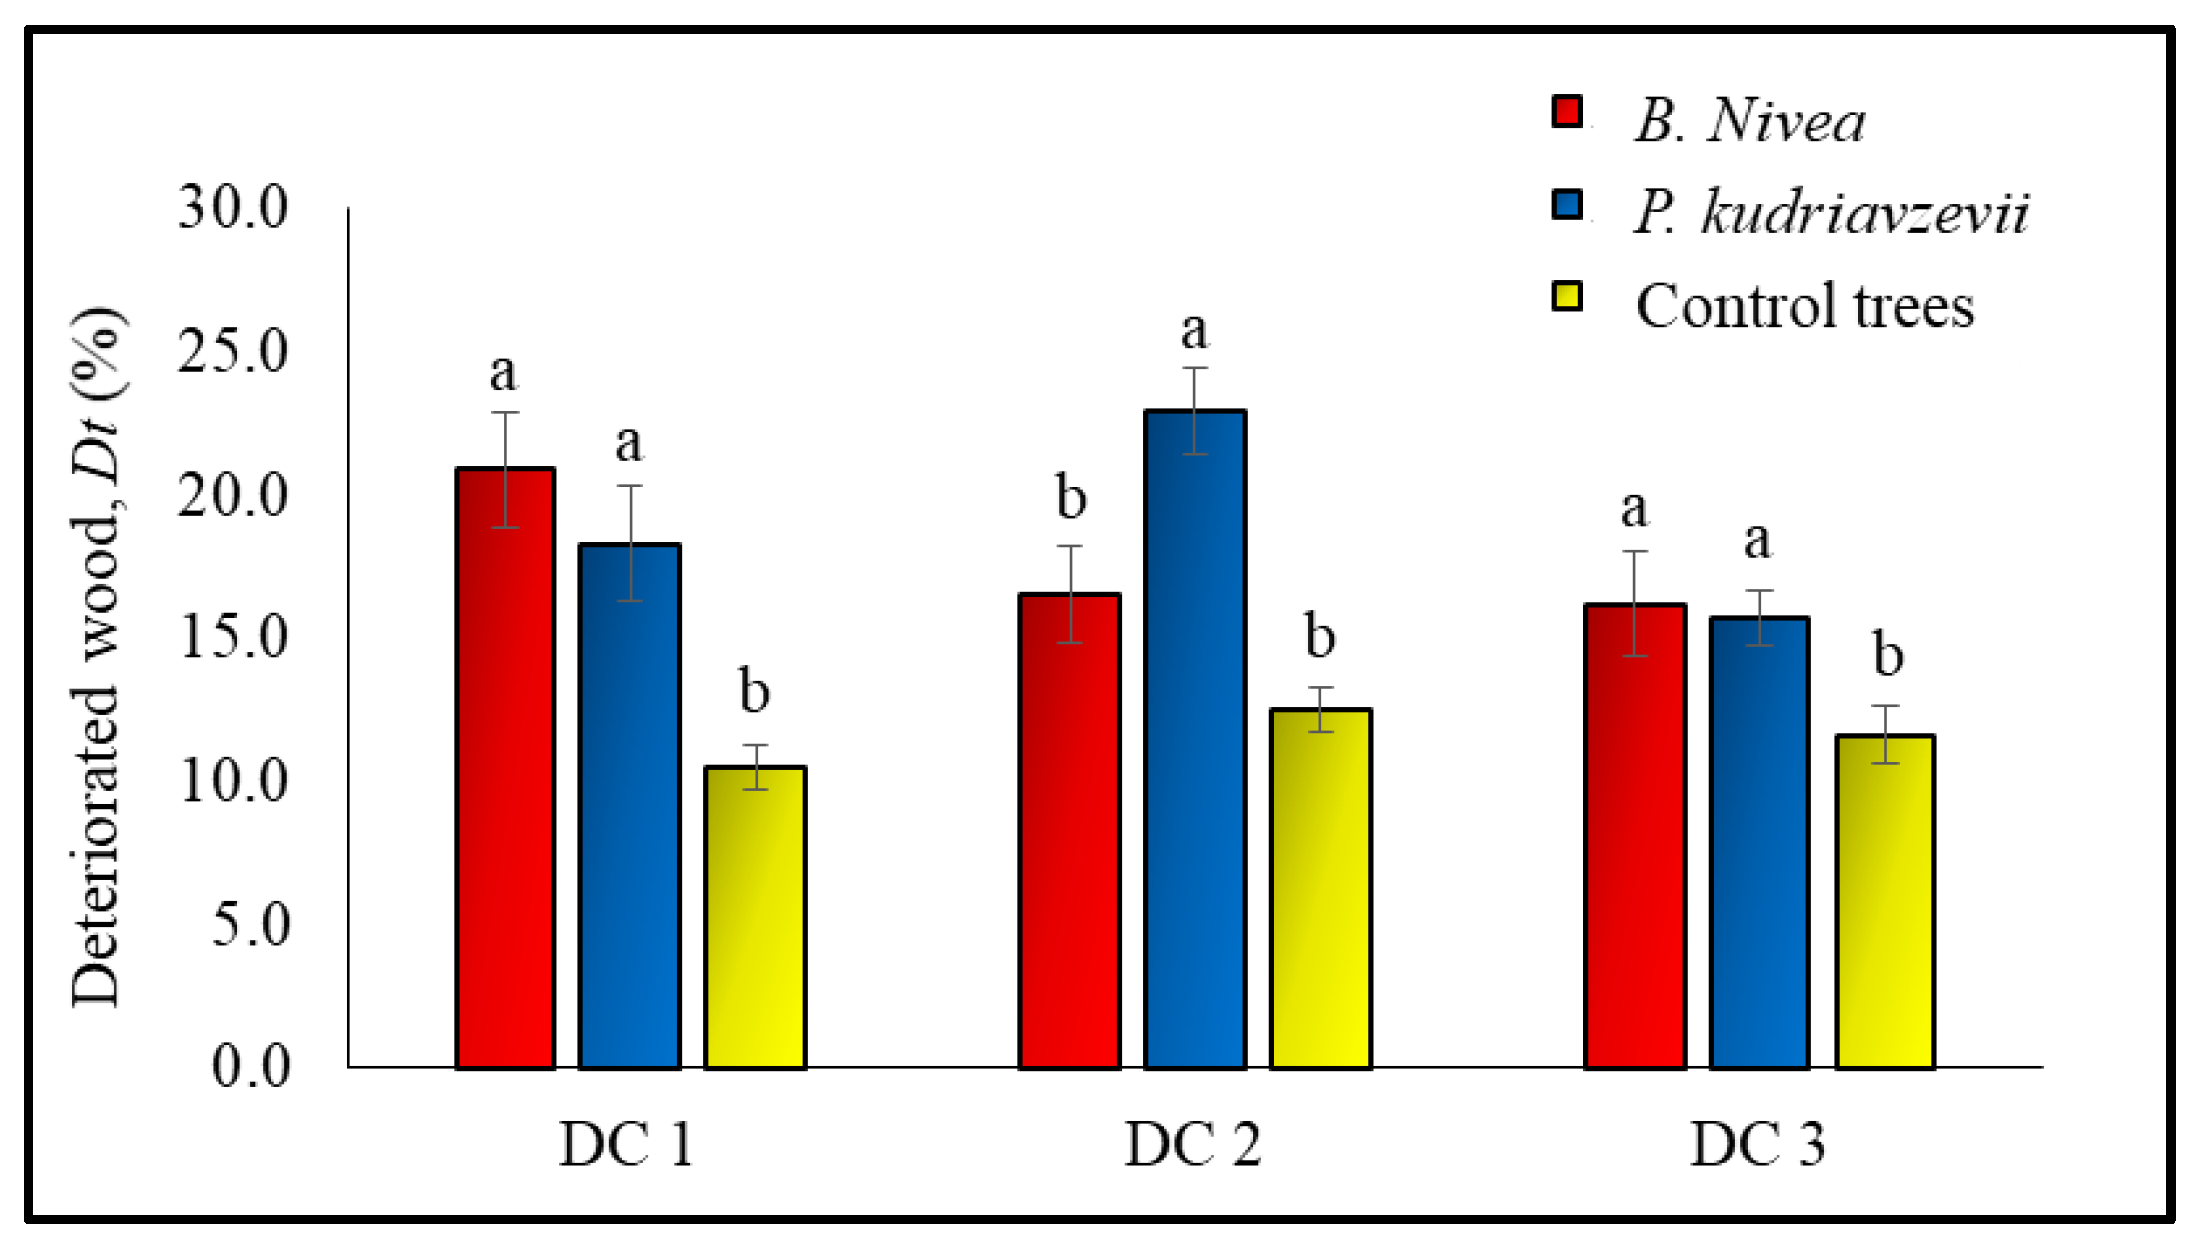
3.3. Deteriorated Wood Effected by Diameter Class

There was a significant difference at the level p < 0.05 in Dt% between the different diameter classes (small (DC1), medium (DC2), and large (DC3)) of inoculated and control trees (Figure 8). However, no significant differences were observed between P. kudriavzevii and P. niveus at DC1 and DC3. The higher Dt% was recorded in the trees inoculated with P. kudriavzevii in DC1 (20.9%) and DC3 (16.2%). Meanwhile, the highest Dt% was recorded in trees inoculated with P. niveus in DC2 (22.9%). The lowest Dt% were measured in control trees in DC1, DC2, and DC3 with 10.5%, 12.5%, and 11.6%, respectively.
Based on a study by [50], the Aquilaria stem consists mostly of sapwood or active cell wood and has a low wood density in the range of 335 kg m−3 to 400 kg m−3. It was reported that the appearance of the important anatomical cell structures in the wood of Aquilaria is remarkable because the included phloem is very distinctive, and the tissue provides a very important diagnostic feature [50]. Included phloem is found as scattered islands in the cross-section throughout the sapwood region of Aquilaria [50], whereby these cells are capable of biosynthesising chemical compounds in agarwood [51,52]. Differences in chemical composition and anatomical structures of sapwood are likely closely related to sapwood infection caused by the fungal attack [53].
A study of the spatial distribution of Rafaelea quercivora in the xylem showed that the hyphae of the fungi were located near the site of inoculation [54]. The distribution of hyphae in the infected area destroyed the structure of the xylem vessels. Therefore, this can suggest that the deteriorated wood was elevated by the massive failure of the xylem vessels due to fungal invasion [36]. In addition, fungi can produce cellulolytic enzymes that lead to softening and decomposition of plant cell walls [55]. Therefore, the production of enzymes at higher levels of fungi attacks could promote the tree’s defence mechanism to respond to injury [15]. Once the fungus has formed a colony in the infected wood, the colony spreads to other wood cells until the biochemical reaction completely prevents the spread.
According to a study by [50], the sapwood area is the largest part of the stem where the biochemical reaction occurs, and the tree diameter size played an important role in influencing the spread of the fungus. In this study’s experiment, higher Dt% was observed in trees inoculated with P. kudriavzevii and P. kudriavzevii at DC1, DC2, and DC3 than in control trees. With an equal volume of inoculated fungi in each tree, Dt% was found to be proportional to the diameter size. A larger sapwood area in Aquilaria trees means that the sapwood contains more phloem, xylem vessels, and cellulose fibres. Cellulose is the main framework molecule of the plant cell wall, filling the space between microfibrils and cellulose chains [56]. Therefore, a large sapwood area provides more space for fungi to spread. These results were confirmed by [57], which reported on the genetics of poplar hybrids that the most severe fungal invasion occurred in trees with the largest growth diameters.

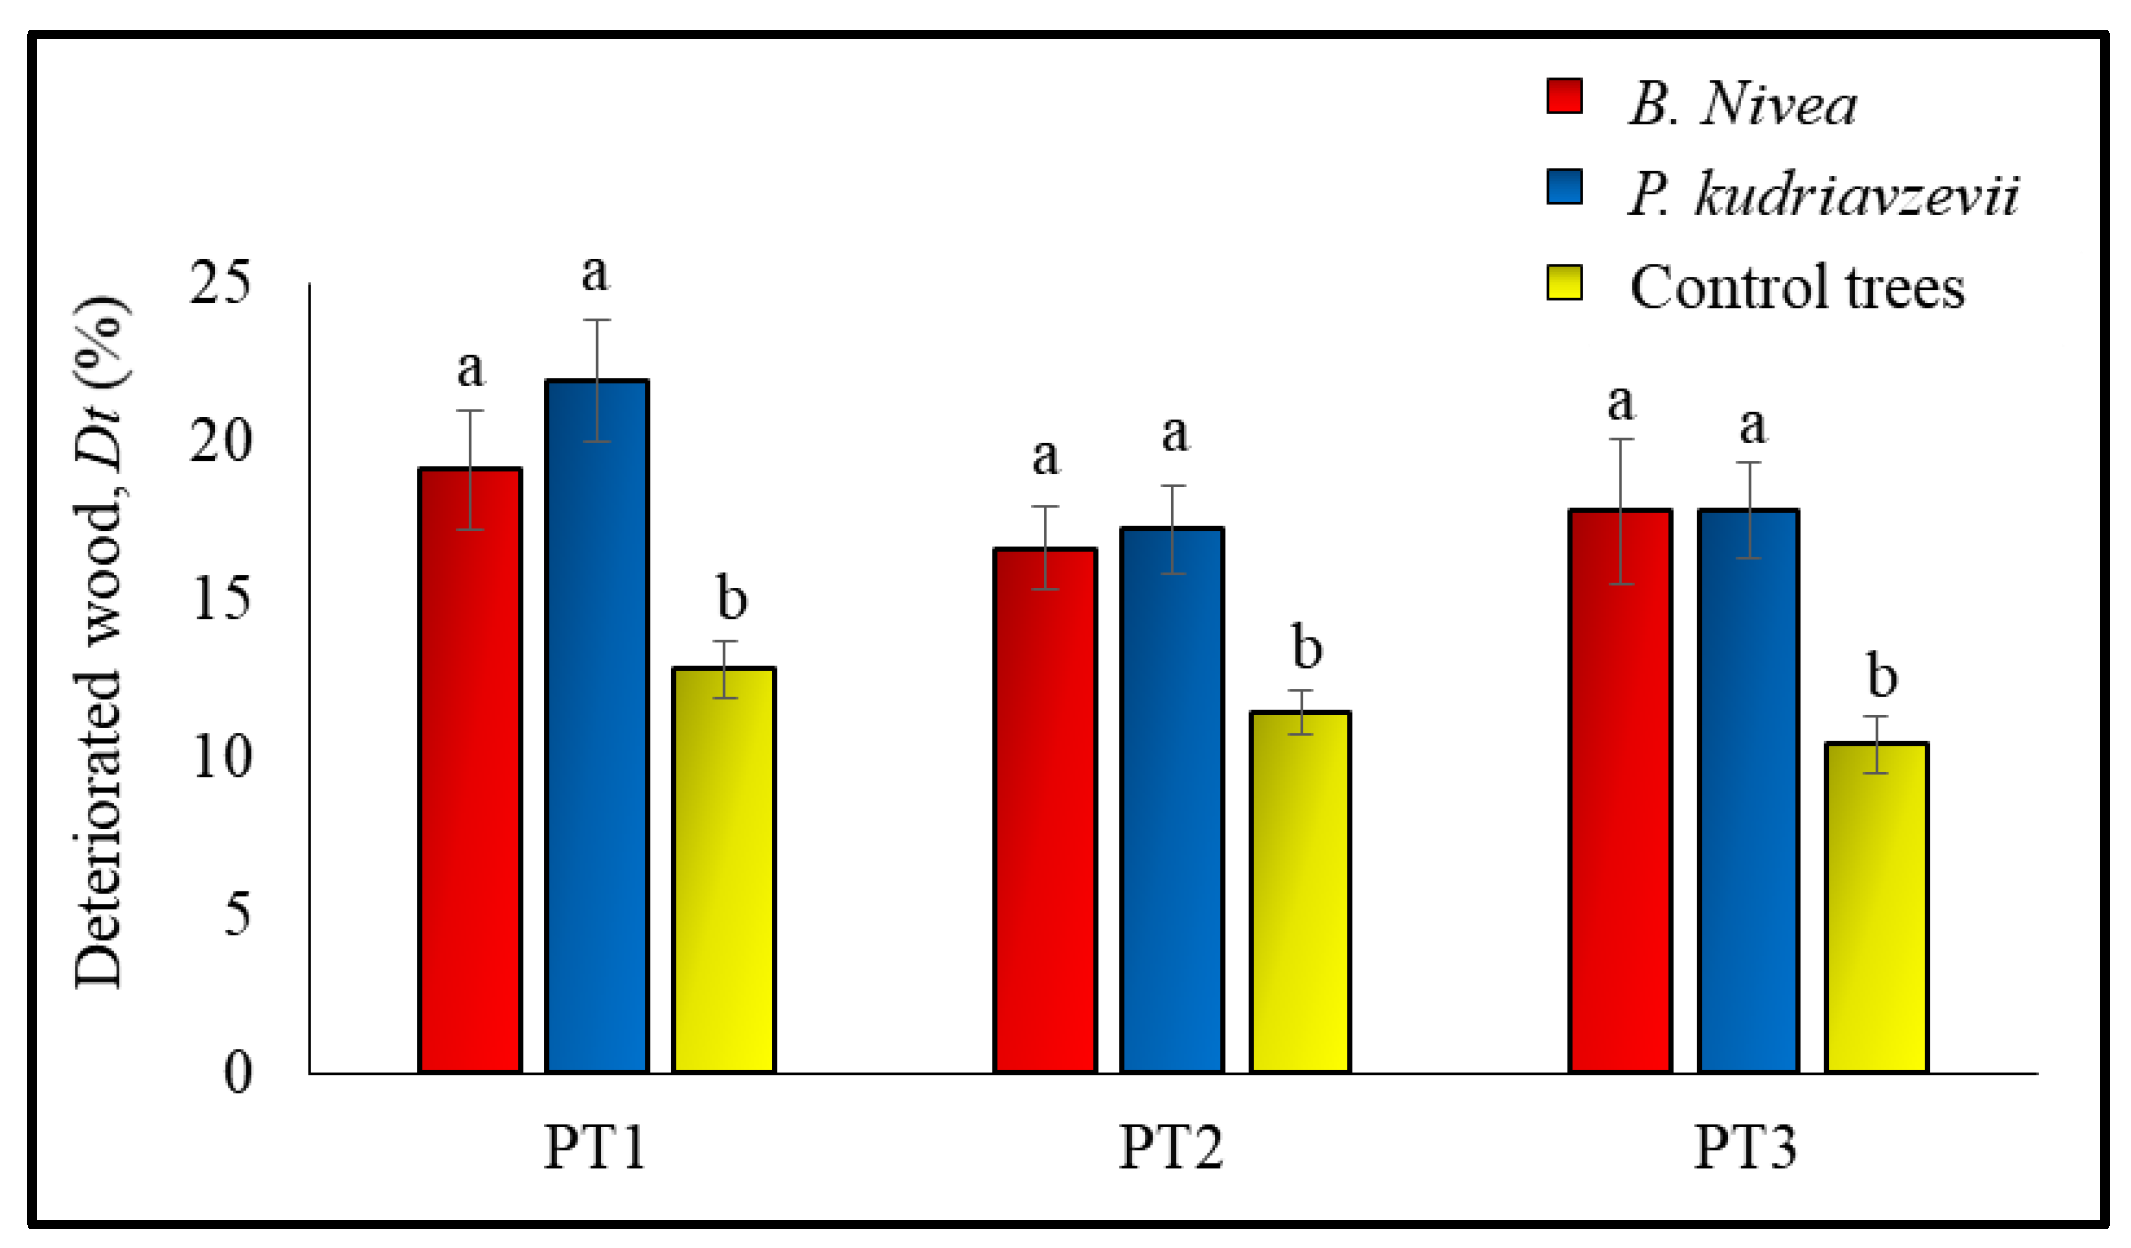
3.4. Deteriorated Wood Influenced by Inoculation Position

There was a significant difference (p < 0.05) between the different positions of inoculations (bottom position (PT1), middle position (PT2), and top position (PT3)) in terms of Dt percentage in the inoculated and control trees (Figure 9). However, in all positions, no significant differences were observed between P. kudriavzevii and P. niveus. The observation showed that the highest Dt% was observed in PT1 (21.9%), PT2 (17.2%), and PT3 (17.8%) positions of P. niveus inoculated trees as compared to P. kudriavzevii inoculated trees. Nonetheless, the lowest Dt% was observed in the control trees in positions PT1, PT2, and PT3, with 12.8%, 11.4%, and 10.4%, respectively.
This study’s observation also showed no significant differences between tree responses to the two fungi invasions. As discussed earlier, secondary metabolites are synthesised in the xylem parenchyma in response to fungal invasion of the sapwood area. These metabolites accumulate in the xylem parenchyma cells and are released to infiltrate the intercellular spaces within the reaction zone and prevent the pathogen’s spread [58]. Since the A. malaccensis stem consisted mostly of sapwood [50], this reaction was assumed to occur at any site on the tree trunk. Several similar studies using the same method also reported that the percentages of areas damaged by fungi in inoculated Aquilaria trees were not significantly different at any position [17,21,59]. This suggested that Aquilaria trees activated the defence responses against infection by the inoculated fungal pathogens at each position of inoculation. As a result, agarwood yield can be increased by increasing the number of inoculation points along the tree trunk [60].

3.5. Evaluation of Sap Flow Rate

For sap flow (SF) measurement, the inoculated trees with fungi P. kudriavzevii and P. niveus in different diameter classes were compared with control trees. The SF rate was related to the diurnal temperature difference. The measurement was conducted for 14 days after 15 months of inoculation.

3.5.1. Average Sap Rate Flow Influenced in Inoculated Trees

ANOVA and Tukey’s multiple comparison tests showed significant differences between the inoculated and control trees at p < 0.05 in SF rate between different diameter classes (Table 5). The highest and lowest average rates of SF in the small-diameter class (DC1) were observed in control and inoculated trees with P. kudriavzevii with 312.9 cm3/h and 207.7 cm3/h, respectively (Table 5). In the medium-diameter class (DC2), the highest and lowest average rates of SF were reported in inoculated trees with P. niveus and P. kudriavzevii with 1465.0 cm3/h and 1001.3 cm3/h, respectively (Table 5). Furthermore, the observation showed that the highest and lowest average rates of SF in the large-diameter class (DC3) were seen in the inoculated trees with P. niveus and control trees with 3372.7 cm3/h, and 2423.2 cm3/h, respectively (Table 5).

3.5.2. Diurnal Sap Flow Rate Influenced in Inoculated Trees

Additionally, the daily observation showed non-significant differences inside control and treated trees in the small-diameter class (DC1) (Figure 10A). The highest and lowest daily SF rates in control trees were observed on Day 157 with 1399 cm3/h and Day 159 with 0 cm3/h, respectively. Furthermore, in the inoculated trees with P. kudriavzevii the highest and lowest SF rates were recorded on Day 154 with 1107 cm3/h and Day 160 with 0 cm3/h, respectively. Meanwhile, in the inoculated trees with P. niveus, the highest and lowest SF rates were reported on Day 154 with 1056 cm3/h and Day 159 with 0 cm3/h, respectively.
However, the observation on the medium-diameter class (DC2) showed that the daily SF rate patterns in inoculated trees with P. kudriavzevii and P. niveus were higher than control trees (Figure 10B). In the inoculated trees with P. niveus, the highest and lowest SF rates were reported on Day 152 with 5402 cm3/h and Day 160 with 0 cm3/h. Furthermore, in the inoculated trees with P. kudriavzevii, the highest and lowest SF rates were recorded on Day 155 with 4577 cm3/h and Day 159 with 0 cm3/h. Moreover, in control trees, the highest and lowest daily SF rates were observed on Day 160 with 4332 cm3/h and Day 159 with 0 cm3/h, respectively.
Likewise, further observation on the large-diameter class (DC3) reported higher levels of daily SF rates in inoculated trees with P. kudriavzevii and P. niveus than in control trees (Figure 10C). In the inoculated trees with P. niveus, the highest and lowest SF rates were reported on Day 152 with 14,109 cm3/h and Day 160 with 0 cm3/h. Furthermore, in the inoculated trees with P. kudriavzevii, the highest and lowest SF rates were recorded on Day 151 with 13,148 cm3/h and Day 160 with 0 cm3/h. In the meantime, in control trees, the highest and lowest daily SF rates were observed on Day 160 with 8629 cm3/h and Day 160 with 0 cm3/h, respectively.
SF rate was impaired in A. malaccensis trees inoculated with P. kudriavzevii and P. niveus compared with control trees in small-diameter classes. The presence of fungi may have affected the limited cross-sectional area of sapwood in small-diameter classes. Plants form an immune system that exhibits different responses when threatened, such as using the second level of defence (pathogen-specific response), depending on the threat level [61]. The defence system is activated when the hydraulic system falters [62]. Prior to activation of the defence system, the marginal axial parenchyma connects rays to rays, and ray cells are connected to the phloem via the cambium to transport water and assimilates, which plays a role in the osmoregulation of the water transport system [36]. The sapwood in the tangential and axial directions was completely circumvented when the reaction zone formed after the resin canals were closed due to the invasion [15]. The reaction zones formed at the expense of water transport, resulting in hydraulic disruption when the decayed or damaged area was successfully compartmentalised [15,62].
Consequently, successful compartmentalisation of infected sapwood in inoculated A. malaccensis trees affected SF rates in small-diameter trees where the sapwood area was related to diameter size. Nevertheless, the fungal invasion did not affect the SF rate in medium- and large-diameter trees inoculated with A. malaccensis. Moreover, the plant mechanism for the cessation of translocation in the vessels was established. Therefore, it was observed that a compartmentalised infected area preserved the integrity of the hydraulic stem system by preventing the rapid spread of the fungus [15,63].
Since the sapwood area was most abundant in the stem of A. malaccensis, the vascular-associated cells remained alive and continued to maintain, developed new cells, and balanced the hydraulic system in the tree [64]. One of the principles of the water-conducting system against fungal invasion is primarily to protect the tree, and all tree responses to fungal pathogens revolve around maintaining the hydraulic system [62]. Moreover, the large proportion of sapwood in A. malaccensis, especially in medium and large diameters, proved that the hydraulic system balanced SF around the infected area. Surprisingly, SF rates were reported to be higher in trees inoculated with both fungi than in control trees in medium- and large-diameter classes. The results suggested that defence activity around the infected area, in conjunction with developing of new cells, led to a higher SF rate.

3.5.3. The Effect of Temperature on the Sap Flow Rate

The results of the observations on the control trees showed that the average 14-day pattern of SF rate increased from 37 cm3/h to 1028 cm3/h in the small-diameter class (DC1), from 166 cm3/h to 3572 cm3/h in the medium-diameter class (DC2), and from 102 cm3/h to 6990 cm3/h in the large-diameter class (DC3). At the same time, the rate of SF increased between 6:00 a.m. and 12 noon, when the daytime temperature increased from 29.2 °C to 31.4 °C (Figure 11A).
However, the pattern of SF rate was significantly lower in trees inoculated with the fungi P. niveus and P. kudriavzevii compared with control trees at DC1. The rate of SF increased from 12 cm3/h to 785 cm3/h in trees which were inoculated with P. niveus and from 15 cm3/h to 695 cm3/h in trees which were inoculated with P. kudriavzevii (Figure 11A).
Conversely, the pattern of SF rate was significantly higher in inoculated trees with the fungi P. niveus and P. kudriavzevii compared with control trees at DC2. The rate of SF increased from 72 cm3/h to 4510 cm3/h in inoculated trees with P. niveus and from 139 cm3/h to 3809 cm3/h in inoculated trees with P. kudriavzevii (Figure 11B).
Similar to DC2, the rate of SF was significantly higher in trees inoculated with the fungi P. niveus and P. kudriavzevii compared with control trees at DC3. The rate of SF increased from 245 cm3/h to 9599 cm3/h in trees inoculated with P. niveus and from 213 cm3/h to 9403 cm3/h in trees inoculated with P. kudriavzevii (Figure 11C). Finally, the pattern of SF rate in all observation trees decreased due to the temperature drop from 31.4 °C to 29.1 °C in the evening from 1 pm.
In nature, sap flow rate (SF) in trees was influenced by climatic variables such as leaf wetness, wind speed, precipitation, soil moisture, radiation, temperature, and vapour pressure deficit (VPD) [65,66]. Vapour pressure deficit is another substitute for the complex variations in relative temperature and humidity [67]. Independent of other abiotic factors, tree species can respond to temperature changes by adjusting their transpiration rate to the SF and VPD. In some tree species, including Pentaclethra macroloba, Simarouba amara, and Goupia glabra, a decrease in stomatal conductance and SF rate was observed when VPD was increased [68]. According to [67], an increase in air temperature consistently increased the SF rate in Pinus sylvestris L. when the VPD was above a critical threshold.
It should be noted that the non-significant results could be due to the large sum of squares. Interestingly, a study on Pinus sylvestris L. showed an approximately non-significant linear relationship between the SF rate and hourly mean air temperature [69]. The lower SF in inoculated small-diameter trees compared with control trees may be influenced by the limited sapwood area, which is disturbed as temperature and VPD increase. In addition, the results of this study showed that the increase in daily temperature did not affect the water use of the inoculated medium- and large-diameter trees compared to control trees. The rate could increase with the inoculated area because the volume and rate of water absorbed by medium and large trees are higher compared to small trees. Remarkably, SF rate decreased in the early midday and afternoon hours when temperature and VPD were high. Most importantly, all SF activities were lowest in inoculated and control trees when the temperature decreased from the evening to midnight.

4. Conclusions

This study confirmed that A. malaccensis trees infected with the inoculation fungus were visually recognisable by discolouration under the bark after six months. Inoculation with the fungi P. kudriavzevii and P. niveus infected the trees. Regardless of the diameter and position of inoculation, the infected area was presented in all inoculated trees. The internal condition of the inoculated trees, which has deteriorated due to fungal infection, can be monitored using non-invasive techniques. In conjunction with the infected areas, SF was disturbed in small diameter classes by the fungal infection, which probably inhibited the growth of the trees. However, water consumption of inoculated trees was not affected in medium- and large-diameter trees as compared to control trees.
Nevertheless, it was also found that the temperature between 6:00 a.m. and 12:00 p.m. was the ideal time for inoculation because the sap flow increased with increasing temperature. Although the temperature was higher in the afternoon, this was not favourable for the absorption of the fungal inoculation, as the SF decreased. Therefore, this study found that the optimal production of agarwood could be achieved by inoculating medium- and large-diameter trees (more than 15 cm DBH) in the morning to increase the yield of agarwood. The combination of these results may improve and influence the inoculation methods for optimal agarwood formation and as the conservation of this endangered species.
Since the agarwood industry requires consistent and optimal results, this study has provided informative guidance and references. Starting with the right diameter size for inoculation, the right timing for inoculation, monitoring the internal condition of the wood to avoid premature destruction of the inoculated trees, and the fact that the inoculant contains the least effective fungi. This way, time and energy can be saved and, above all, the population of Aquilaria sp. can be protected in the wild.

Author Contributions

Conceptualisation, A.-M.J., H.A.-H. and P.M.-T.; methodology, A.-M.J., S.-L., P.M.-T. and M.-K.A.-U.; validation, H.A.-H., S.-L., S.A.S., A.-S.S.-A. and J.M.; formal analysis, A.-M.J. and A.-S.S.-A.; investigation, A.-M.J.; and A.-S.S.-A.; resources, A.-M.J., S.M.-R. and S.A.S.; data curation, A.-M.J., M.R.M.K. and J.M.; writing—original draft preparation, A.-M.J. and R.A.; writing—review and editing, A.-M.J. and R.A.; visualisation, A.-M.J., M.-K.A.-U., A.-A.M.-N., S.A.S., M.R.M.K. and R.A.; supervision, A.-M.J. and H.A.-H.; project administration, A.-M.J. and H.A.-H.; funding acquisition, A.-M.J. and H.A.-H. All authors have read and agreed to the published version of the manuscript.

Funding

This research was supported by the Fundamental Research Grant Scheme (Project No. FRGS/1/2020/WAB03/KATS/03/1/FRGS(S).600-3/9/33311005003). The authors would like to thank the research group of the Product Development Programme, FRIM, for their invaluable support. Special thanks to the staff of the Institute of Tropical Forestry and Forest Products, University Putra Malaysia, for their assistance in the field and laboratory.

Institutional Review Board Statement

Not applicable.

Informed Consent Statement

Not applicable.

Data Availability Statement

Not applicable.

Conflicts of Interest

The authors declare no conflict of interest.

References

  1. Chua, L.S.L.; Lee, S.L.; Lau, K.H.; Zakaria, N.F.; Tnah, L.H.; Lee, C.T.; Ng, C.H.; Ng, K.K.S. Conservation Action Plan: For the Threatened Agarwood Species Aquilaria malaccensis (Thymelaeaceae) in Peninsular Malaysia; Forest Research Institute Malaysia: Kuala Lumpur, Malaysia, 2016; ISBN 9789670622590. [Google Scholar]
  2. Abd Majid, J.; Hazandy, A.H.; Paridah, M.T.; Nor Azah, M.A.; Mailina, J.; Saidatul Husni, S.; Sahrim, L. Determination of Agarwood Volatile Compounds from Selected Aquilaria Species Plantation Extracted by Headspace-Solid Phase Microextraction (HS-SPME) Method. In IOP Conference Series: Materials Science and Engineering; Institute of Physics Publishing: Bristol, UK, 2018; Volume 368. [Google Scholar]
  3. Alamil, J.M.R.; Paudel, K.R.; Chan, Y.; Xenaki, D.; Panneerselvam, J.; Singh, S.K.; Gulati, M.; Jha, N.K.; Kumar, D.; Prasher, P.; et al. Rediscovering the Therapeutic Potential of Agarwood in the Management of Chronic Inflammatory Diseases. Molecules 2022, 27, 3038. [Google Scholar] [CrossRef] [PubMed]
  4. Eissa, M.A.; Hashim, Y.Z.H.Y.; Abdul Azziz, S.S.S.; Salleh, H.M.; Isa, M.L.M.; Abd Warif, N.M.; Abdullah, F.; Ramadan, E.; El-Kersh, D.M. Phytochemical Constituents of Aquilaria malaccensis Leaf Extract and Their Anti-Inflammatory Activity against LPS/IFN-γ-Stimulated RAW 264.7 Cell Line. ACS Omega 2022, 7, 15637–15646. [Google Scholar] [CrossRef] [PubMed]
  5. Chua, L. Agarwood (Aquilaria malaccensis) in Malaysia. In NDF Workshop Case Studies, WG1—Trees, Case Study 3; Forest Research Institute Malaysia: Kuala Lumpur, Malaysia, 2008; pp. 1–17. [Google Scholar]
  6. Desa, A.P.; Lee, S.Y.; Mustapa, M.Z.; Mohamed, R.; Emang, D. Trends in the Agarwood Industry of Peninsular Malaysia. Malays. For. 2021, 84, 152–168. [Google Scholar]
  7. CITES. Consideration of Proposals for Amendment of Appendices I and II—Proposal 4. In Proceedings of the Seventeenth Meeting of the Conference of the Parties, Johannesburg, South Africa, 24 September–5 October 2016; pp. 1–23. [Google Scholar]
  8. Justin, S.; Lihan, S.; Elvis-Sulang, M.R.; Chiew, T.S. Formulated Microbial Consortium as Inoculant for Agarwood Induction. J. Trop. For. Sci. 2020, 32, 161–169. [Google Scholar] [CrossRef]
  9. Wang, Y.; Hussain, M.; Jiang, Z.; Wang, Z.; Gao, J.; Ye, F.; Mao, R.; Li, H. Aquilaria Species (Thymelaeaceae) Distribution, Volatile and Non-Volatile Phytochemicals, Pharmacological Uses, Agarwood Grading System, and Induction Methods. Molecules 2021, 26, 7708. [Google Scholar] [CrossRef] [PubMed]
  10. Azren, P.D.; Lee, S.Y.; Emang, D.; Mohamed, R. History and Perspectives of Induction Technology for Agarwood Production from Cultivated Aquilaria in Asia: A Review. J. For. Res. 2019, 30, 1–11. [Google Scholar] [CrossRef]
  11. Steppe, K.; Vandegehuchte, M.W.; Tognetti, R.; Mencuccini, M. Sap Flow as a Key Trait in the Understanding of Plant Hydraulic Functioning. Tree Physiol. 2015, 35, 341–345. [Google Scholar] [CrossRef] [Green Version]
  12. Mustapa, M.Z.; Ibrahim, M.; Rajak, N.A. Agarwood Production of Aquilaria malaccensis Using Various Inoculants and Induction Techniques. Cent. Asia Cauc. 2022, 23, 3042–3051. [Google Scholar]
  13. Faizal, A.; Esyanti, R.R.; Aulianisa, E.N.; Iriawati; Santoso, E.; Turjaman, M. Formation of Agarwood from Aquilaria malaccensis in Response to Inoculation of Local Strains of Fusarium solani. Trees 2017, 31, 189–197. [Google Scholar] [CrossRef]
  14. Faizal, A.; Azar, A.W.P.; Turjaman, M.; Esyanti, R.R. Fusarium solani Induces the Formation of Agarwood in Gyrinops versteegii (Gilg.) Domke Branches. Symbiosis 2020, 81, 15–23. [Google Scholar] [CrossRef]
  15. Morris, H.; Hietala, A.M.; Jansen, S.; Ribera, J.; Rosner, S.; Salmeia, K.A.; Schwarze, F.W.M.R. Using the CODIT Model to Explain Secondary Metabolites of Xylem in Defence Systems of Temperate Trees against Decay Fungi. Ann. Bot. 2020, 125, 701–720. [Google Scholar] [CrossRef] [PubMed] [Green Version]
  16. Dwianto, W.; Kusumah, S.S.; Darmawan, T.; Amin, Y.; Bahanawan, A.; Pramasari, D.A.; Lestari, E.; Himmi, S.K.; Hermiati, E.; Fatriasari, W.; et al. Anatomical Observation and Characterization on Basic Properties of Agarwood (Gaharu) as an Appendix II CITES. In IOP Conference Series: Earth and Environmental Science; Institute of Physics Publishing: Bristol, UK, 2019; Volume 374, p. 12062. [Google Scholar]
  17. Putri, N.; Karlinasari, L.; Turjaman, M.; Wahyudi, I.; Nandika, D. Evaluation of Incense-Resinous Wood Formation in Agarwood (Aquilaria malaccensis Lam.) Using Sonic Tomography. Agric. Nat. Resour. 2017, 51, 84–90. [Google Scholar] [CrossRef]
  18. Abdul Wahab, Y.; Abdul Rahim, R.; Fazalul Rahiman, M.H.; Ridzuan Aw, S.; Mohd Yunus, F.R.; Goh, C.L.; Abdul Rahim, H.; Ling, L.P. Non-Invasive Process Tomography in Chemical Mixtures—A Review. Sens. Actuators B Chem. 2015, 210, 602–617. [Google Scholar] [CrossRef]
  19. Zakaria, Z.; Airiman, A.A.H.; Talib, M.T.M.; Ibrahim, M.; Balkhis, I.; Mansor, M.S.B.; Rahim, R.A. A Review of Non-Invasive Imaging: The Opportunity of Magnetic Induction Tomography Modality in Agarwood Industry. J. Teknol. 2015, 77, 115–119. [Google Scholar] [CrossRef] [Green Version]
  20. Lee, S.; Lee, S.J.; Lee, J.S.; Kim, K.B.; Lee, J.J.; Yeo, H. Basic Study on Nondestructive Evaluation of Artificial Deterioration of a Wooden Rafter by Ultrasonic Measurement. J. Wood Sci. 2011, 57, 387–394. [Google Scholar] [CrossRef]
  21. Indahsuary, N.; Nandika, D.; Karlinasari, L.; Santoso, E. Reliability of Sonic Tomography to Detect Agarwood in Aquilaria Microcarpa Baill. J. Indian Acad. Wood Sci. 2014, 11, 65–71. [Google Scholar] [CrossRef]
  22. Rahiman, M.H.F.; Thomas, T.W.K.; Soh, P.J.; Rahim, R.A.; Jamaludin, J.; Ramli, M.F.; Zakaria, Z. Microwave Tomography Sensing for Potential Agarwood Trees Imaging. Comput. Electron. Agric. 2019, 164, 104901. [Google Scholar] [CrossRef]
  23. Wang, Q.; Lintunen, A.; Zhao, P.; Shen, W.; Salmon, Y.; Chen, X.; Ouyang, L.; Zhu, L.; Ni, G.; Sun, D.; et al. Assessing Environmental Control of Sap Flux of Three Tree Species Plantations in Degraded Hilly Lands in South China. Forests 2020, 11, 206. [Google Scholar] [CrossRef] [Green Version]
  24. Jaskierniak, D.; Benyon, R.; Kuczera, G.; Robinson, A. A New Method for Measuring Stand Sapwood Area in Forests. Ecohydrology 2015, 8, 504–517. [Google Scholar] [CrossRef]
  25. Kirisits, T.; Offenthaler, I. Xylem Sap Flow of Norway Spruce after Inoculation with the Blue-Stain Fungus Ceratocystis polonica. Plant Pathol. 2002, 51, 359–364. [Google Scholar] [CrossRef]
  26. Urban, J.; Dvořák, M. Occlusion of Sap Flow in Elm after Artificial Inoculation with Ophiostoma novo-ulmi. Acta Hortic. 2013, 991, 301–306. [Google Scholar] [CrossRef]
  27. Forster, M.A. Quantifying Water Use in a Plant-Fungal Interaction. Fungal Ecol. 2012, 5, 702–709. [Google Scholar] [CrossRef]
  28. Park, J.H.; Juzwik, J.; Cavender-Bares, J. Multiple Ceratocystis smalleyi Infections Associated with Reduced Stem Water Transport in Bitternut Hickory. Phytopathology 2013, 103, 565–574. [Google Scholar] [CrossRef] [Green Version]
  29. Wyn, L.T.; Anak, N.A. Wood for Trees: A Review of the Agarwood (Gaharu) Trade in Malaysia; A Report Commissioned by the CITES Secretariat; TRAFFIC Southeast Asia: Petaling Jaya, Malaysia, 2010; ISBN 9789833393268. [Google Scholar]
  30. Abd-Majid, J.; Hazandy, A.; Nor-Azah, M.; Johar, M. Allometric Models for Estimating Aboveground Biomass and Carbon Stock in Planted Aquilaria malaccensis Stand. J. Trop. For. Sci. 2021, 33, 240–246. [Google Scholar] [CrossRef]
  31. Elias, M.F.; Jamaludin, A.A.; Abu Bakar, A.; Mohd Zain, H.H.; Ibrahim, H. Effect of Different Chemical Formulation on Agarwood (Aquilaria malaccensis) Resin Weight. Educ. J. Sci. Math. Technol. 2020, 7, 1–6. [Google Scholar] [CrossRef]
  32. Wu, Z.Q.; Liu, S.; Li, J.F.; Li, M.C.; Du, H.F.; Qi, L.K.; Lin, L. Analysis of Gene Expression and Quality of Agarwood Using Agar-Bit in Aquilaria sinensis. J. Trop. For. Sci. 2017, 29, 380–388. [Google Scholar] [CrossRef]
  33. Iyer, L.M.; Zhang, D.; Maxwell Burroughs, A.; Aravind, L. Computational Identification of Novel Biochemical Systems Involved in Oxidation, Glycosylation and Other Complex Modifications of Bases in DNA. Nucleic Acids Res. 2013, 41, 7635–7655. [Google Scholar] [CrossRef] [Green Version]
  34. Abdul-Hamid, H.; Mencuccini, M. Age- and Size-Related Changes in Physiological Characteristics and Chemical Composition of Acer pseudoplatanus and Fraxinus excelsior Trees. Tree Physiol. 2009, 29, 27–38. [Google Scholar] [CrossRef] [Green Version]
  35. Granier, A. Evaluation of Transpiration in a Douglas-Fir Stand by Means of Sap Flow Measurements. Tree Physiol. 1987, 3, 309–320. [Google Scholar] [CrossRef]
  36. Morris, H.; Brodersen, C.; Schwarze, F.W.M.R.; Jansen, S. The Parenchyma of Secondary Xylem and Its Critical Role in Tree Defense against Fungal Decay in Relation to the CODIT Model. Front. Plant Sci. 2016, 7, 1665. [Google Scholar] [CrossRef] [Green Version]
  37. Nugroho, W.D.; Rini, P.; Novena, P.T. Wood anatomical characteristics of agarwood-producing species (Aquilaria sp.). Wood Res. 2019, 64, 759–768. [Google Scholar]
  38. Elkhateeb, W.A.; Daba, G.M. Botryotrichum and Scopulariopsis Secondary Metabolites and Biological Activities. Biotechnol. Bioprocess. 2022, 3, 2314–2766. [Google Scholar] [CrossRef]
  39. Chhipa, H.; Chowdhary, K.; Kaushik, N. Artificial Production of Agarwood Oil in Aquilaria Sp. by Fungi: A Review. Phytochem. Rev. 2017, 16, 835–860. [Google Scholar] [CrossRef]
  40. Ingham, J.L. Phytoalexins and Other Natural Products. Bot. Rev. 1972, 38, 343–424. [Google Scholar] [CrossRef]
  41. Tan, C.S.; Isa, N.M.; Ismail, I.; Zainal, Z. Agarwood Induction: Current Developments and Future Perspectives. Front. Plant Sci. 2019, 10, 122. [Google Scholar] [CrossRef] [Green Version]
  42. Cui, J.; Wang, C.; Guo, S.; Yang, L.; Xiao, P.; Wang, M. Evaluation of Fungus-Induced Agilawood from Aquilaria sinensis in China. Symbiosis 2013, 60, 37–44. [Google Scholar] [CrossRef]
  43. Zhang, X.L.; Liu, Y.Y.; Wei, J.H.; Yang, Y.; Zhang, Z.; Huang, J.Q.; Chen, H.Q.; Liu, Y.J. Production of High-Quality Agarwood in Aquilaria sinensis Trees via Whole-Tree Agarwood-Induction Technology. Chin. Chem. Lett. 2012, 23, 727–730. [Google Scholar] [CrossRef]
  44. Chong SP, et. al Agarwood Inducement Technology: A Method for Producing Oil Grade Agarwood in Cultivated Aquilaria malaccensis Lamk. J. Agrobiotechnol. 2015, 6, 1–16. [Google Scholar]
  45. Cui, J.L.; Guo, S.X.; Fu, S.B.; Xiao, P.G.; Wang, M.L. Effects of Inoculating Fungi on Agilawood Formation in Aquilaria sinensis. Chin. Sci. Bull. 2013, 58, 3280–3287. [Google Scholar] [CrossRef] [Green Version]
  46. Espinoza, E.O.; Lancaster, C.A.; Kreitals, N.M.; Hata, M.; Cody, R.B.; Blanchette, R.A. Distinguishing Wild from Cultivated Agarwood (Aquilaria spp.) Using Direct Analysis in Real Time and Time of-Flight Mass Spectrometry. Rapid Commun. Mass Spectrom. 2014, 28, 281–289. [Google Scholar] [CrossRef]
  47. Karlinasari, L.; Putri, N.; Turjaman, M.; Wahyudi, I.; Nandika, D. Moisture Content Effect on Sound Wave Velocity and Acoustic Tomograms in Agarwood Trees (Aquilaria malaccensis Lamk.). Turk. J. Agric. For. 2016, 40, 696–704. [Google Scholar] [CrossRef]
  48. Rahman, M.F.A.; Dahing, L.; Ishak, M.N.I.; Hassan, H.; Abdullah, N.L.; Al-Qallaff, M. Gamma-Ray Computed Tomography for Scanning of Agarwood Tree: Data Analysis and Comparison. In AIP Conference Proceedings; AIP Publishing LLC: Kuala Lumpur, Malaysia, 2020; ISBN 9780735440296. [Google Scholar]
  49. Li, L.; Wang, X.; Wang, L.; Allison, R.B. Acoustic Tomography in Relation to 2D Ultrasonic Velocity and Hardness Mappings. Wood Sci. Technol. 2012, 46, 551–561. [Google Scholar] [CrossRef]
  50. Nordahlia, A.S.; Lim, S.C.; Anwar, U.M.K. Wood Anatomical Features of Aquilaria (Thymelaeaceae) and Gonystylus (Gonystylaceae) in Malaysia. Malay. Nat. J. 2017, 69, 63–69. [Google Scholar]
  51. Nobuchi, T.; Siripatanadilok, S. Preliminary observation of Aquilaria crassna wood associated with the formation of aloeswood. Dep. Bull. Pap. 1991, 63, 226–235. [Google Scholar]
  52. Tabata, Y.; Widjaja, E.; Mulyaningsih, T.; Parman, I.; Wiriadinata, H.; Mandang, Y.I. Structural Survey and Artificial Induction of Aloeswood. Wood Res. Bull. Wood Res. Inst. Kyoto Univ. 2003, 90, 11–12. [Google Scholar]
  53. Du, T.; Dao, C.; Mapook, A.; Stephenson, S.L.; Elgorban, A.M.; Al-rejaie, S.; Suwannarach, N.; Karunarathna, S.C.; Tibpromma, S. Diversity and Biosynthetic Activities of Agarwood Associated Fungi. Diversity 2022, 14, 211. [Google Scholar] [CrossRef]
  54. Takahashi, Y.; Matsushita, N.; Hogetsu, T. Spatial Distribution of Raffaelea quercivora in Xylem of Naturally Infested and Inoculated Oak Trees. Phytopathology 2010, 100, 747–755. [Google Scholar] [CrossRef]
  55. Sharma, S.K.; Atri, N.S. Qualitative Estimation of Cellulases and Lignin Modifying Enzymes in Five Wild Lentinus Species Selected from North West India. World J. Fungal Plant Biol. 2012, 3, 13–17. [Google Scholar]
  56. Sangareswari, M.; Parthiban, K.T.; Kanna, S.U.; Karthiba, L.; Saravanakumar, D. Fungal Microbes Associated with Agarwood Formation. Am. J. Plant Sci. 2016, 7, 1445–1452. [Google Scholar] [CrossRef] [Green Version]
  57. Zamudio, F.; Yañez, M.; Hamelin, R.; Lolas, M.; Urzua, J. Modeling the Genetic Response of Diameter Growth in Poplar Hybrids Growing in the Center of Chile in the Presence of Septoria Canker. Tree Genet. Genomes 2022, 18, 30. [Google Scholar] [CrossRef]
  58. Słupianek, A.; Dolzblasz, A.; Sokołowska, K. Xylem Parenchyma—Role and Relevance in Wood Functioning in Trees. Plants 2021, 10, 1247. [Google Scholar] [CrossRef] [PubMed]
  59. Karlinasari, L.; Indahsuary, N.; Santoso, E.; Turjaman, M.; Nandika, D. Sonic and Ultrasonic Waves in Agarwood Trees (Aquilaria microcarpa) Inoculated with Fusarium solani. J. Trop. For. Sci. 2015, 27, 351–356. [Google Scholar]
  60. Liu, Y.; Chen, H.; Yang, Y.; Zhang, Z.; Wei, J.; Meng, H.; Chen, W.; Feng, J.; Gan, B.; Chen, X.; et al. Whole-Tree Agarwood-Inducing Technique: An Efficient Novel Technique for Producing High-Quality Agarwood in Cultivated Aquilaria sinensis Trees. Molecules 2013, 18, 3086–3106. [Google Scholar] [CrossRef]
  61. Jones, J.D.G.; Dangl, J.L. The plant immune system. Nature 2006, 444, 323–329. [Google Scholar] [CrossRef] [PubMed] [Green Version]
  62. Schenk, H.J.; Espino, S.; Goedhart, C.M.; Nordenstahl, M.; Martinez Cabrera, H.I.; Jones, C.S. Hydraulic Integration and Shrub Growth Form Linked across Continental Aridity Gradients. Proc. Natl. Acad. Sci. USA 2008, 105, 11248–11253. [Google Scholar] [CrossRef] [Green Version]
  63. Zanne, A.E.; Sweeney, K.; Sharma, M.; Orians, C.M. Patterns and Consequences of Differential Vascular Sectoriality in 18 Temperate Tree and Shrub Species. Funct. Ecol. 2006, 20, 200–206. [Google Scholar] [CrossRef]
  64. Spicer, R. Symplasmic Networks in Secondary Vascular Tissues: Parenchyma Distribution and Activity Supporting Long-Distance Transport. J. Exp. Bot. 2014, 65, 1829–1848. [Google Scholar] [CrossRef] [Green Version]
  65. Clark, D.A.; Piper, S.C.; Keeling, C.D.; Clark, D.B. Tropical Rain Forest Tree Growth and Atmospheric Carbon Dynamics Linked to Interannual Temperature Variation during 1984–2000. Proc. Natl. Acad. Sci. USA 2003, 100, 5852–5857. [Google Scholar] [CrossRef] [Green Version]
  66. Clark, D.A.; Clark, D.B. Climate-Induced Annual Variation in Canopy Tree Growth in a Costa Rican Tropical Rain Forest. J. Ecol. 1994, 82, 865. [Google Scholar] [CrossRef]
  67. Kellomäki, S.; Wang, K.Y. Sap Flow in Scots Pines Growing under Conditions of Year-Round Carbon Dioxide Enrichment and Temperature Elevation. Plant Cell Environ. 1998, 21, 969–981. [Google Scholar] [CrossRef]
  68. Granier, A.; Huc, R.; Colin, F. Transpiration and Stomatal Conductance of Two Rain Forest Species Growing in Plantations (Simarouba amara and Goupia glabra) in French Guyana. Ann. Sci. For. 1992, 49, 17–24. [Google Scholar] [CrossRef] [Green Version]
  69. Pataki, D.E.; Oren, R.; Phillips, N. Responses of Sap Flux and Stomatal Conductance of Pinus taeda L. Trees to Stepwise Reductions in Leaf Area. J. Exp. Bot. 1998, 49, 871–878. [Google Scholar] [CrossRef]
Figure 1. Location of FRIM Research Station at Maran Pahang, Malaysia.
Forests 13 01731 g001
Figure 2. Conducting of the Inoculation Treatment on Aquilaria malaccensis Lam., Tree by: (A) Inoculation Accessories, (B) Drilling Angle, (C) Inoculant Dripping, and (D) Inoculation Positions.
Forests 13 01731 g002
Figure 3. Sound-wave velocity data collected by: (A) 6 to 10 sensors vertically near inoculation holes, (B) sequentially tapping each nail using an electronic hammer.
Forests 13 01731 g003
Figure 4. Sap Flow Meter Installation Set Up in Inoculated Aquilaria malaccensis Tree. (A) = Two small holes were appropriately drilled 5 cm above the inoculation point, (B) = A selection of appropriate thermal dissipation probe (TDP) was inserted into the drilled holes, (C) = The sensors were covered with an aluminium box and an insulating film was placed around the trunk.
Forests 13 01731 g004
Figure 5. Discolouration Zone around Inoculation Position of Inoculated A. malaccensis Trees Measured on Medium Diameter Class at the Middle Position (130 cm) from the ground. Note: the arrow indicated wood tissue colour which changed from pale brown to yellow-brown until the trunk surface was changed to the original colour. (A1A3) = inoculated with Pichia kudriavzevii Boidin, Pignal and Besson, (B1B3) = inoculated with Paecilomyces niveus Stolk and Samson, (C1C3) = uninoculated (control) trees.
Forests 13 01731 g005
Figure 6. Effect of inoculation types measured through non-invasive SoT that converted velocity to a So% and Dt% in the sapwood area of A. malaccensis trees. (A) = significant differences (p ≤ 0.05) in So% and Dt% in the trees inoculated with P. kudriavzevii in the measured months, (B) = significant differences (p ≤ 0.05) in So% and Dt% in the trees inoculated with P. niveus in the measured months, (C) = significant differences (p ≤ 0.05) in So% and Dt% in control trees at the measured months. Note: So = solid zone, Im = intermediate zone, Dm = damage zone, Dt = deteriorated wood, and small capital letters show significant differences between months. The error bar represents the mean standard error (n = 27); distinct letters imply significant distinctions between inoculation duration following Duncan’s multiple comparison test (p < 0.05).
Forests 13 01731 g006
Figure 7. Detection of Discolouration Zone by Tomogram Colour Images Matched with the Internal Sapwood Areas’ Condition of A. malaccensis trees. Note: (A1A3) = inoculated with P. kudriavzevii, (B1B3) = inoculated with P. niveus, (C1C3) = control (uninoculated) trees. These tomogram colour images were taken in the middle of the selected medium-class diameter, representing each treatment.
Forests 13 01731 g007
Figure 8. The affected area of Dt% in the sapwood of A. malaccensis tree at different diameter classes. Note: DC1 = small-diameter class, DC2 = medium-diameter class, DC3 = large-diameter class. The error bar represents the mean standard error (n = 27); distinct letters imply significant distinctions between inoculation treatments following Duncan’s multiple comparison test (p < 0.05).
Forests 13 01731 g008
Figure 9. Dt% in the sapwood of A. malaccensis tree in different inoculation positions. PT1 = bottom position, PT2 = middle position, PT3 = top position. The error bar represents the mean standard error (n = 27); distinct letters imply significant distinctions between inoculation treatments following Duncan’s multiple comparison test (p < 0.05).
Forests 13 01731 g009
Figure 10. Daily SF Rate of inoculated trees with fungi P. kudriavzevii, P. niveus and uninoculated (control) trees of A. malaccensis at (A) small-diameter classes (DC1), (B) medium-diameter classes (DC2), and (C) large-diameter classes (DC3).
Forests 13 01731 g010
Figure 11. Diurnal SF rate of inoculated trees with fungi and uninoculated (control) A. malaccensis trees at (A) small-diameter class (DC1), (B) medium-diameter class (DC2), and (C) large-diameter class (DC3). The error bar represents the mean standard error (n = 14).
Forests 13 01731 g011
Table 1. Diameter Classes and Treatment Types Divided from Selective Standing Aquilaria malaccensis Lam., Trees.
Treatment TypesDiameter (cm)
Class 1Class 2Class 3
Pichia kudriavzevii Boidin, Pignal and Besson13.519.824.9
10.119.224.5
7.317.028.9
Paecilomyces niveus Stolk and Samson10.422.725.1
12.618.026.8
13.916.325.5
Control trees12.117.934.1
13.519.530.3
14.020.729.9
Table 2. Inoculation Treatments with Selective Diameter Classes, Inoculation Positions, Inoculation Types, and Replication in Standing A. malaccensis Trees.
DiameterPositionsDistance from Ground (cm)Inoculant Dosage (mL)
Pichia kudriavzeviiPaecilomyces niveusControl TreesRep
Class 1Top2001010Nw3
Middle1301010Nw3
Bottom301010Nw3
Class 2 Top2001010Nw3
Middle1301010Nw3
Bottom301010Nw3
Class 3Top2001010Nw3
Middle1301010Nw3
Bottom301010Nw3
Note: Nw—Non-wounded, Rep—Replication.
Table 3. Colour Legend Showing the Internal Condition of the Wood (by PiCUS® Software).
Colour IndicatorDescriptionZone
Forests 13 01731 i001Brown-blackHigh velocity of sound waves, indicated solid intact and healthy woodSolid wood (So)
Green-to-violetTransitional condition, indicated early-to-moderate attack from the organismsIntermediate wood (Im)
BluishSlowed the propagation of sound waves, indicated advanced decay, or affected areaDeteriorated wood (Dt)
Table 4. Measurements on the area affected by the inoculation treatment in a given month.
Treatment TypesAffected Height (cm)
6 Months12 Months24 Months
Pichia kudriavzevii9.26.83.2
Paecilomyces niveus11.810.611.5
Control trees ndndnd
Table 5. Sap flow rates by treatment types at different diameter classes of A. malaccensis.
TreatmentsSap Flow Rate (cm3/h)
DC1DC2DC3
Pichia kudriavzevii207.7 b ± 14.11001.3 b ± 79.63270.4 a ± 209.1
Paecilomyces niveus216.8 b ± 16.31465.0 a ± 98.73372.7 a ± 223.7
Control trees312.9 a ± 21.21133.3 b ± 75.72423.2 b ± 153.4
Note: DC1 = small-diameter class, DC2 = medium-diameter class, DC3 = large-diameter class. Different letters indicate significant differences between treatments according to Duncan’s multiple comparison test (p < 0.05).
Publisher’s Note: MDPI stays neutral with regard to jurisdictional claims in published maps and institutional affiliations.

