Article

Bat Assemblages Are Shaped by Land Cover Types and Forest Age: A Case Study from Eastern Ukraine

by
Anton Vlaschenko
1,2,3,*,
Kseniia Kravchenko
1,3,4,*,
Yehor Yatsiuk
5,
Vitalii Hukov
1,3,6,
Stephanie Kramer-Schadt
7,8 and
Viktoriia Radchuk
7
1
Bat Rehabilitation Center of Feldman Ecopark, 61002 Kharkiv, Ukraine
2
Department of Zoology, Institute of Natural Sciences, H.S. Skovoroda Kharkiv National Pedagogical University, Valentynivska st., 2, 61168 Kharkiv, Ukraine
3
NGO “Ukrainian Independent Ecology Institute”, Plekhanov st., 40, 61001 Kharkiv, Ukraine
4
Department of Ecology and Evolution, University of Lausanne, CH-1015 Lausanne, Switzerland
5
Department of Zoology, Institute of Ecology and Earth Sciences, University of Tartu, Juhan Liivi 2, 50409 Tartu, Estonia
6
Biological Faculty, V.N. Karazin Kharkiv National University, Svobody sq. 4, 61077 Kharkiv, Ukraine
7
Leibniz Institute for Zoo and Wildlife Research, Alfred-Kowalke-Straße 17, 10315 Berlin, Germany
8
Institute of Ecology, Technische Universität Berlin, Rothenburgstr. 12, 12165 Berlin, Germany
*
Authors to whom correspondence should be addressed.
Forests 2022, 13(10), 1732; https://doi.org/10.3390/f13101732
Submission received: 21 September 2022 / Revised: 17 October 2022 / Accepted: 17 October 2022 / Published: 20 October 2022

Abstract

:
Eastern European broadleaved forests north of the 50th degree of latitude serve as a core breeding area for most migratory bat species wintering in Eastern and Central Europe. The southern border of this region has faced an increase in clear-cutting intensity in recent decades. We conducted a standardized mist-netting survey on eleven heterogeneous oak forest plots in order to assess how land cover types and forest age affect abundance, diversity and the breeding of bats. We found that abundance indices and species richness increased from upland plots surrounded by agricultural lands to riverine or waterside plots with high forest cover. Particularly large mature forests older than 90 years positively affected the breeding activity of bats, their abundance indices and overall species richness. Regarding species associations with specific habitats, we found that Myotis brandtii, Nyctalus leisleri and Pipistrellus pygmaeus were mainly found in mature deciduous forest stands, while Plecotus auritus appeared to be the only species tolerating clearcuts and young stands. Forest-dwelling species such as Nyctalus noctula and Pipistrellus nathusii were additionally associated with water habitats. Thus, the combination of mature forests and water sources is essential in shaping Eastern European assemblages of forest bat species.

1. Introduction

Forests are of exceptional conservation value on a global scale, as they harbor terrestrial biodiversity [1]. In Europe, excluding the European part of Russia, they cover 34.8% of the land surface [2]. Despite an increasing trend in total forest area and area of natural forests in Europe in recent decades [2,3,4], most unmanaged old forests are concentrated in mountain or boreal regions [5]. Forest management is the main factor shaping lowland forests outside strict nature reserves. Whereas some relatively novel management approaches such as even-aged retention systems are implemented in some regions, the vast majority of forests in Europe are managed under even-aged clear-felling systems [5]. Biodiversity-related consequences of these silvicultural management practices include the truncation of old-growth features and yielding mosaics of forest plots of different ages. Clearcuts and young plantations create disruptions in forest cover impacting biodiversity [6,7]. The presence of clearcuts generally favors open-landscape species and negatively impacts forest specialists [8].
Among various taxa of vertebrates that depend on forests, bats are of special concern [9,10]. They are recognized as a key bioindicator group of habitat quality among vertebrates [11,12]. In particular, European forest-dwelling bats require complex structures of woodlands from the micro-habitat to landscape level for successful breeding, e.g., [10,13,14]. On the micro-habitat level, they require existing cavities for roosting, either excavated by woodpeckers or created by long-term fungal decay processes [15,16]. On the meso-habitat level, bats need a network of dead, decaying, and injured old trees harboring cavities for roosting, e.g., [9,17]. On the landscape level, forest-dwelling bats require a certain level of landscape complexity, mostly related to proximity to water sources or floodplains [18,19], providing a high density of insects.
The majority of research investigating the impacts of landscape structure on bat assemblages has focused on Paleotropic or Neotropic regions, e.g., [20,21,22,23,24]. Knowledge about bat assemblages in temperate forests is still limited [9]. In Europe, deciduous stands represent one of the most important habitats for bats [9,14]. In addition, Eastern European deciduous woodlands north of the 50th degree of latitude serve as a core breeding area for most long-distance migratory bat species wintering in Eastern and Central Europe [25,26]; hence, they represent keystone areas for bat species beyond the local bat assemblage. However, we know little about how land cover types and forest age structure affect abundances of particular species and, in turn, shape the community composition of bat assemblages. Indeed, breeding activity depends on the availability of suitable land cover types in the landscape and strongly affects the temporal population dynamics of each particular species. Such responses of each individual species to land cover types then contribute to overall community dynamics. Therefore, we need to understand habitat preferences of individual species regarding forest age structure, landscape heterogeneity and the presence of water sources. This, in turn, will enable a better understanding of how bat assemblages are impacted by dominating silvicultural practices [10], and whether habitat features can mediate these effects. For example, the intensity of forest management can shape bat assemblages through changing the abundance of roosting sites and the availability of hunting grounds.
The current study is focused on broadleaved oak-dominated forests in north-eastern Ukraine. This area constitutes the southern part of the core breeding area of Eastern European migratory bat species. Here, at the border with the steppe zone, broadleaved forests are fragmented and unevenly distributed. There is a lack of primeval forests in the region. However, due to the relatively low intensity of management, the share of stands of natural origin is high and constitutes 76% of broadleaved stands in the forest steppe part of the Kharkiv region (according to forest survey data). In recent decades, broadleaved forests in north-eastern Ukraine have faced an accelerated intensity of clear-cutting, which has led to the increase in young plantations at the cost of natural old stands (Y. Yatsiuk, unpublished data) and aridization under climate change. This process has accelerated since 2014, when Ukraine became an associate member of the European Union, meaning an opening of a new market for Ukrainian timber. Mature deciduous forests are the most targeted forest type for logging because of their high prices on international markets, and it is therefore timely to assess the impact of forest age and land cover types on the bat assemblage structure in eastern Ukraine, as a case study area for Eastern European temperate deciduous forests.
We hypothesized that silviculture and the loss of mature deciduous forests severely reshuffles bat assemblages, with major demographic effects on forest-dwelling bats. We expected that abundance, species richness and the breeding activity of forest-dwelling bats would be positively associated with old forests, whereas the areas most strongly affected by clear-cutting and those without aquatic habitats (or with low amounts) would experience a reduction in the number of bat species and their abundance. The reason for this is the shortage of tree-roosting sites and insect-rich hunting grounds. To this end, we mist-netted bats in 11 study forest plots differing in land cover types, forest age and intensity of clear-cutting under even-aged silvicultural practices.

2. Materials and Methods
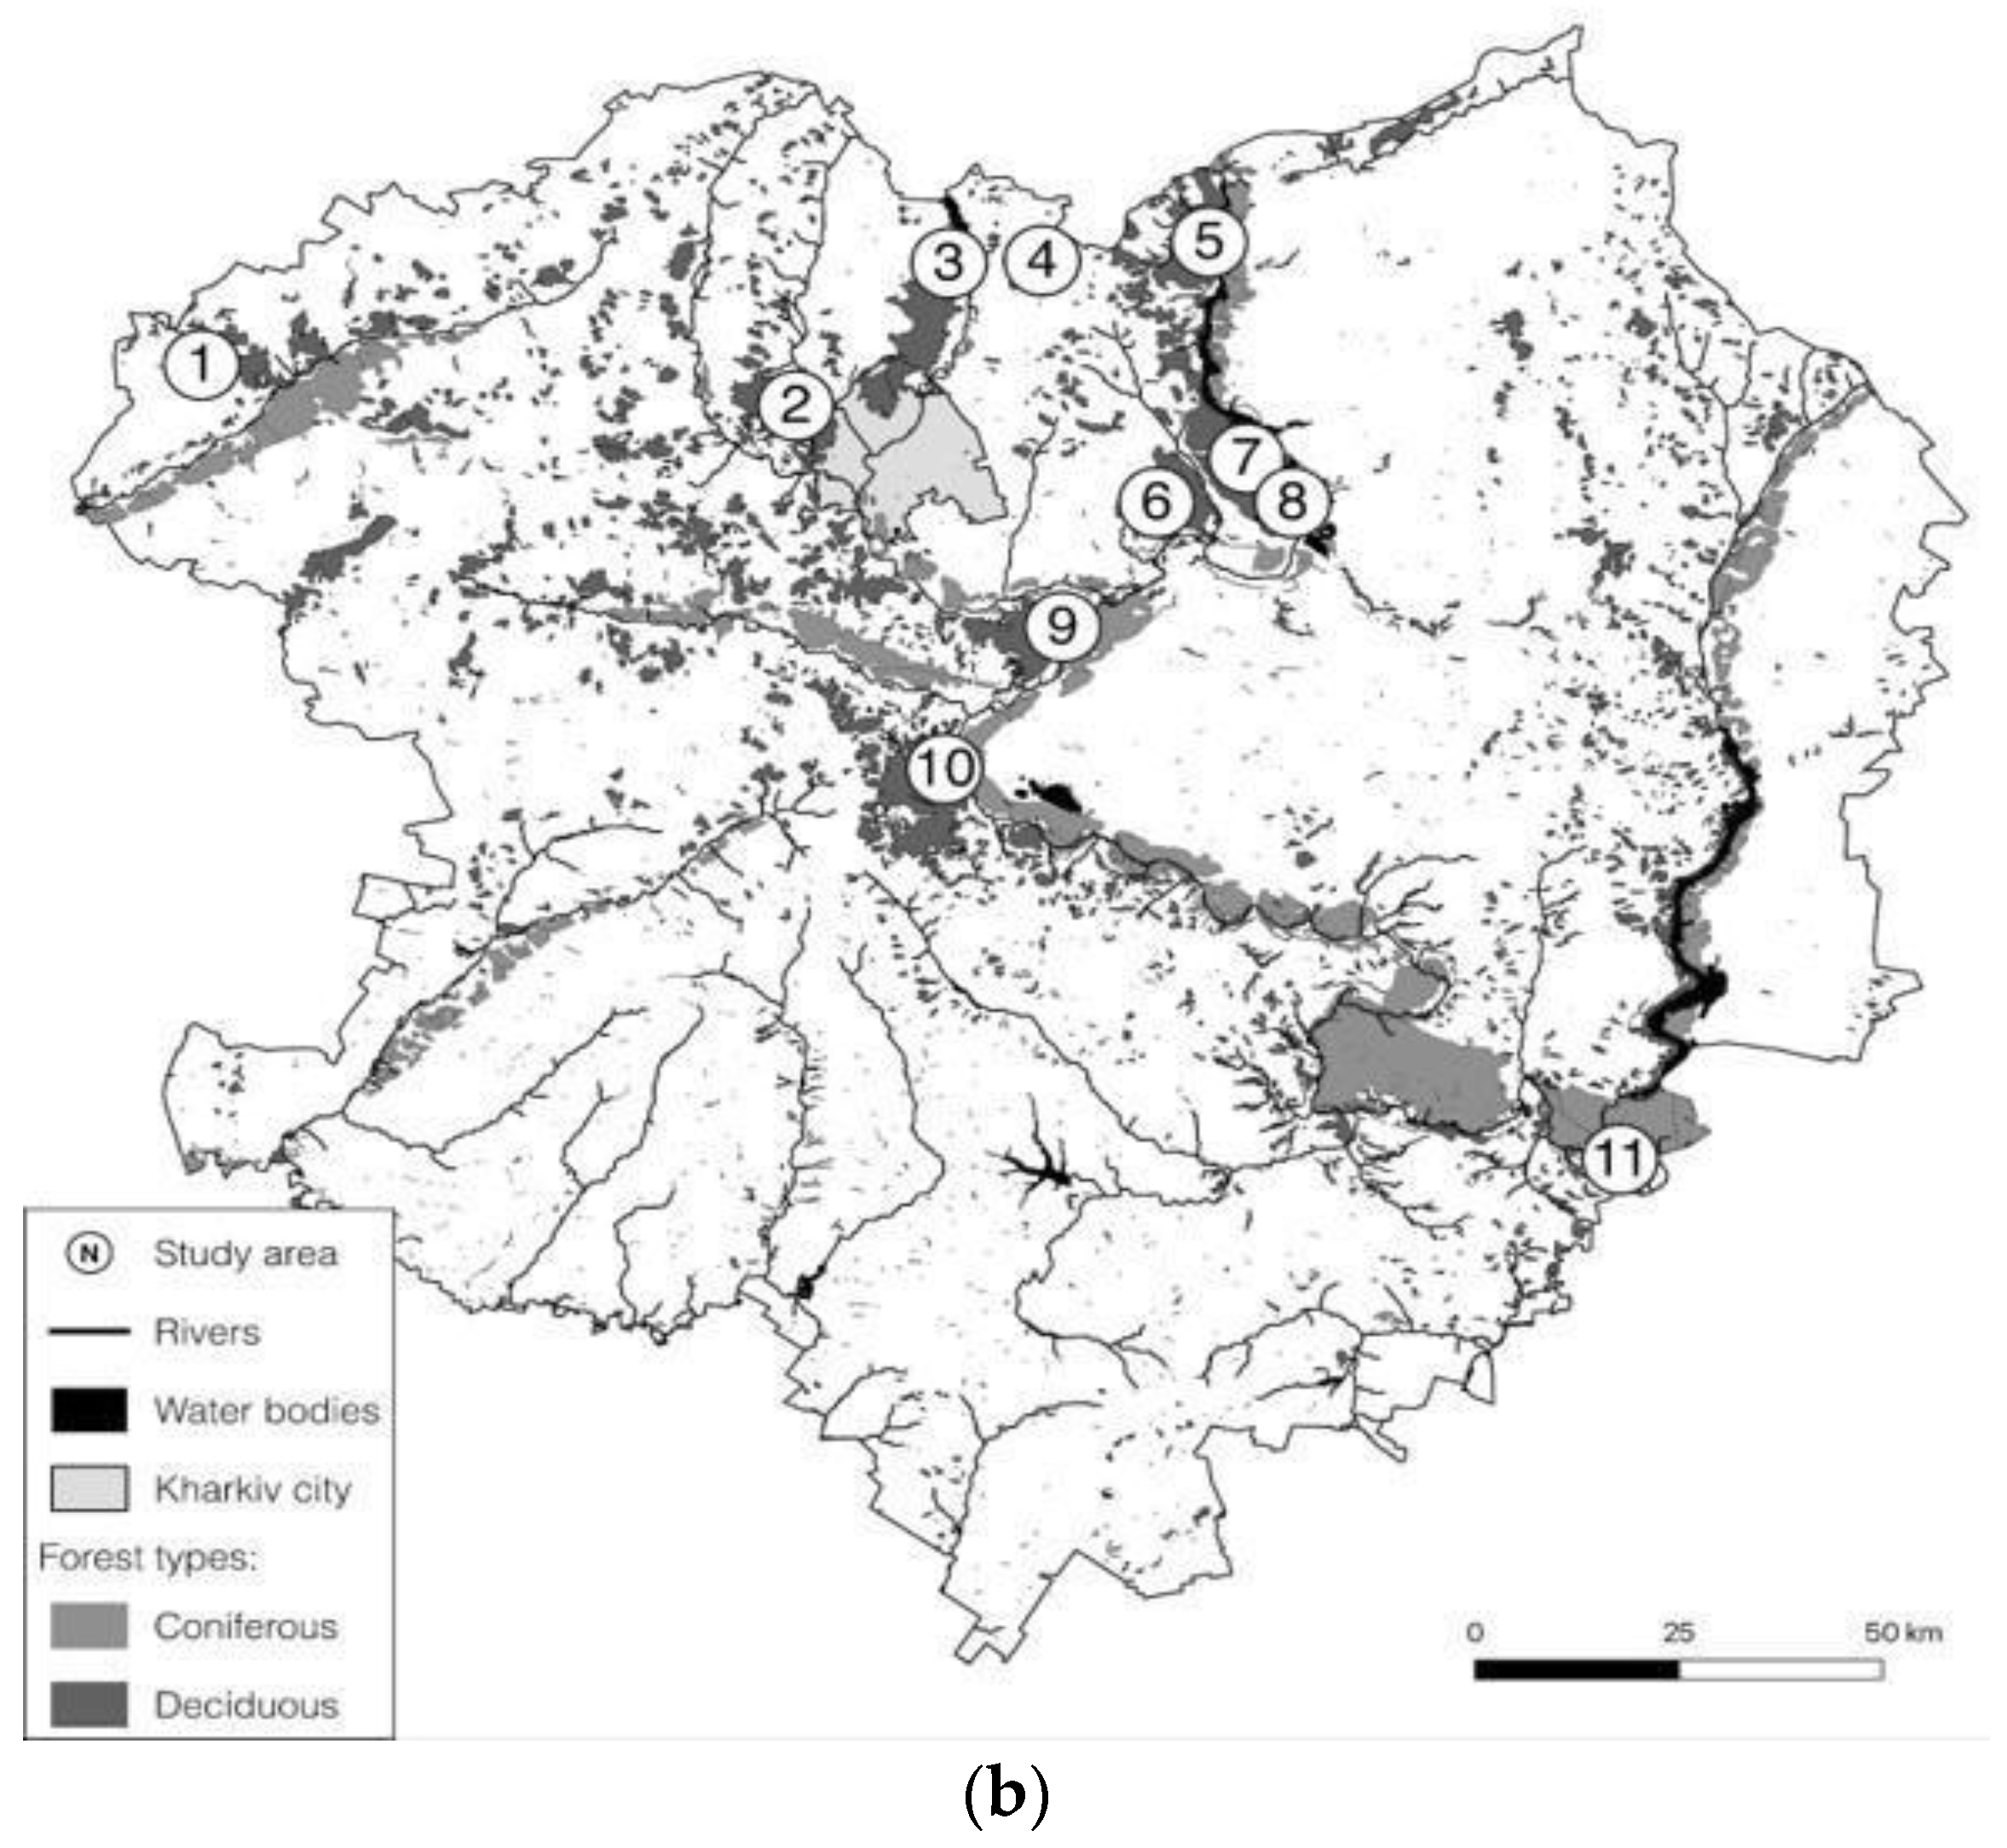
2.1. Study Area

The research was carried out in the Kharkiv region located in north-eastern Ukraine (50°12′ N, 36°22′ E) on the border between the Eastern European forest steppe and Pontic steppe ecoregions [27] (Figure 1a). The terrain of the Kharkiv region is undulating plains with a maximum elevation of 236 m above mean sea level (amsl) in the north and minimum elevation of 90 m amsl in the south-east. The mean annual temperature in the region is 8.1 °C, the mean January and July temperatures are −7 °C and +21 °C, respectively, and the mean annual precipitation is 540 mm [28]. There are two main forest types: pine-dominated (Pinus sylvestris L., 1753) forests on sandy soils on river left-bank terraces, and oak-dominated (Quercus robur L., 1753) forests on rich clay soils (Figure 1b). Forest cover comprises 13.16% of the forest steppe part of the region (3.4% coniferous and 9.7% broadleaved) and 6.7% of the steppe part (3.2% and 3.4%, respectively). Our study was carried out mainly in oak-dominated forests with a high proportion of lime (Tilia cordata Mill., 1768), maples (Acer platanoides L., 1753 and A. campestre L., 1753) and ash (Fraxinus excelsior L., 1753).
Here, extensive logging focused mainly on natural old stands, with the intensity of clear-cutting in the region reaching its maximum in 1920–1950, but substantially decreasing afterwards [29]. As a result, a relatively large part of the old tree stands, mainly of natural origin, were preserved (Y. Yatsiuk, unpublished data). Between 2001 and 2012, 15,263 ha, or 14.5% (median = 1086 ha, or 1.03% per year), of forested territories have been cut down in the Kharkiv region [30]. The current scheme of forest management in the region implies the clear-cutting of oak-dominated stands in 90–120-year rotations. However, the intensity of clear-cutting varies greatly among different forest districts, causing differences in age structure and stand patterns between different woodlands. Thus, some woodlands have patches of old-growth oak-dominated stands, reaching 130–200 years of age. Most of these patches are small (5–25 ha), but some continuous areas can cover 80 to 280 ha.

2.2. Study Bat Species

For more than a century of surveys, until 2020 [31,32], fourteen bat species from the family Vespertilionidae were recorded in the Kharkiv region: Myotis daubentonii (Kuhl, 1817), hereafter referred to with the acronym MDA; M. dasycneme (Boie, 1825)—MDS; M. brandtii (Eversmann, 1845)—MBR; M. nattereri (Kuhl, 1817)—MNA; Nyctalus leisleri (Kuhl, 1817)—NLE; N. lasiopterus (Schreber, 1780)—NLA; N. noctula (Schreber, 1774)—NNO; Eptesicus serotinus (Schreber, 1774)—ESE; Pipistrellus pygmaeus (Leach, 1825)—PPY; P. nathusii (Keyserling et Blasius, 1839)—PNA; P. kuhlii (Kuhl, 1817)—PKU; Vespertilio murinus Linnaeus 1758—VMU; Plecotus austriacus (Fischer, 1829)—PAS; and Plecotus auritus (Linnaeus, 1758)—PAU. Most of the species are widely distributed throughout the region, but two of them are rare (M. nattereri and N. lasiopterus) and have only been recorded in two locations in the Kharkiv region [32,33].
Previously, we classified twelve local bat species into ecological groups [34], based mainly on their summer habitat preference. That classification was performed according to the results of studies from Eastern Europe [35,36] and pan-European reviews [9,17,37]. The migratory status, roost-site selection and assignment of each bat species to a particular ecological group are presented in Supplementary Materials Table S1. We distinguished four ecological groups: water-associated species—MDA and MDS; forest-dwelling specialists—MBR, MNA, NLE, NLA, NNO and PAU; generalists—PPY, PNA and VMU; and urban- and rural-dwellers—ESE, PKU and PAS.

2.3. Bat Mist-Netting Protocol and Field Data Collection

Our study was conducted from 2009 to 2018, in eleven study plots (221–1067 ha) that differed in their land cover types and were located in deciduous woodlands (Table 1, Figure 1b). We mist-netted bats in 8–18 sites per study plot. The sites within each plot were visited in one of the study years. Only in two plots (Homil’sha and Yaremivka, see Table 1) were the sites mist-netted twice and for these plots we randomly chose one of the two mist-netting nights for further statistical analyses. Following previous results [38], the fieldwork was conducted during the period when the yearling bats start to fly (mainly July), because the catchability of bats is highest during this period [38]. Data on bat assemblages and species lists for some of the study plots have been published before [32,39,40].
Bat mist-netting was undertaken in accordance with the approach previously used in different types of Eastern European forests [26,41] and using the basic recommendations highlighted in Kunz et al. [42]. We caught bats by ultrathin Chinese mist nets (10–12 × 2.5–4 m), which were operated from sunset till sunrise mostly (closed earlier only in the case of heavy rains). We used one mist net per one mist-netting site. One or two on-duty persons were near a mist net all night long. Mist-netting sites were selected in the following main land cover types: riverbanks in the open floodplain and forest edge, shores of forest lakes and ponds, forest roads, and internal (openings and clear cuttings) and external (borders between forest and agricultural landscape) forest edges. We did not place mist nets randomly; instead, they were placed based on expert opinion and experience. The detailed maps of all the mist-netting points are presented in Supplementary Figure S1. The sampling effort was calculated as time of mist-netting in hours, with an accuracy of 15 min.
The sampling effort per plot varied from 39.75 to 130.75 h, with an average of 72.9 h (see Table 1).
All captured bats were measured, sexed and aged, their reproductive status was determined, and some individuals were ringed. The number of recaptures was lower than 3%–5%, and the recaptured bats were included in total sample size count. The protocols for handling and measuring the bats were described in detail in previous studies [26,38,41,43]. After taking all the measurements, the individuals were released within the same study plot. Bat capture and handling were ethical and respectful to animal welfare and met the conservation requirements of protected species, according to international standards [44] and Ukrainian National Legislation [34]. The field studies in the National Nature Park “Homilsha forest” were conducted as a part of the biodiversity monitoring program in the National Park (Order of the Ministry of Ecology and Natural Resources of Ukraine, Number 414 (z1444-15) dated 29 October 2015).

2.4. Bat Assemblage Structure and Indices of Abundance

At the mist-netting site level, the community matrix describing the bat assemblage consisted of the number of individuals of all species captured at each net. At the plot level, the community matrix consisted of the total number of individuals per species caught within each plot.
To describe bat abundance, we used two types of indices: (i) one summarizing the abundance of all bats across all species, i.e., as the total number of bats of all species per hour (b/hT); and (ii) a species-specific one calculated for six selected species as the total number of bats of each species per hour (b/hS). The species-specific index was calculated for common species that had large enough sample sizes: NNO, NLE, PNA, MDA, PPY and PAU. The average b/hT index for each of the eleven plots was calculated as the number of bats of all species per hour caught over all mist-netting nights:
b / h T = i = 1 x T o t i h i x
where Toti is the total number of bats of all species captured on night i, hi is the number of mist-netting hours that night, and x is the total number of mist-netting nights at the study plot.
Similarly, indices for specific species (b/hS) were calculated as the number of individuals of a given species per hour caught over all mist-netting nights:
b / h S = i = 1 x A b i h i x
where Abi is the number of individuals of a given species captured during the night i, hi is the number of hours of mist-netting that night, and x is the total number of mist-netting nights.

2.5. The Land Cover Types as Explanatory Variables

We derived habitat characteristics at two spatial levels: the mist-netting site (site level; meso scale) and the study plot (plot level; landscape scale). The site level focuses on a description of land cover types around each of the 98 mist-netting sites. We used a buffer of a 500 m radius, according to an average distance that can be covered by the slowest gleaning species P. auritus during a night commute from roosts to foraging sites [17]. When the buffers around the adjacent mist-netting sites overlapped with each other, all shared habitats were counted separately for each site. The plot level focuses on the land cover types of each study plot within which the mist-netting sites were located. In this case, all 500 m buffers around the mist-netting sites within each plot were joined and, where a polygon did not coincide with buffers, tangents to buffers formed the borders of the polygon (see Supplementary Figure S1). At each of these spatial levels, we extracted the areas of different land cover types (see Section 2.5.1, Land Cover Types) and the areas of forest stands with different age classes (see Section 2.5.2, Forest Age Structure), which were then used to explain the breeding activity of bats, their abundance indices and overall community composition (see Section 2.6.2, Section 2.6.3 and Section 2.6.4).

2.5.1. Land Cover Types

We distinguished the following eight land cover types: forests, clear cuts, agricultural fields, meadows, lakes, rivers, wetlands, and settlements (in hectares). For the land cover type ‘forest’, we included both deciduous and coniferous forests because the proportion of the latter was less than 0.3%. For the land cover type ‘lakes’, we included both natural lakes and artificial water bodies. The area of each land cover type was determined by manually outlining them using satellite images provided by Google Maps in QGIS software [45]. We calculated the correlation between the areas of different land cover types. Since the areas of rivers and wetlands correlated highly within the study plots (Supplementary Figure S2a,b), we merged these land cover types into one: floodplain. Additionally, we removed settlements from further analyses as their area was too small. We included clear-cut areas into the cover type “forest” because they contribute to the forest structure. Thus, for the follow-up analyses, we relied on five land cover types: forests, agricultural fields, meadows, lakes and floodplain. The areas of these land cover types were calculated at each spatial level (using the respective buffers) and used as predictor variables in the analyses focusing on explaining the breeding activity of bats, their indices and overall community composition.

2.5.2. Forest Age Structure

Data on forest age were taken from forest taxation databases of the Ukrainian Forestry Authority. In each study plot, we distinguished the following forest age categories (in hectares): clear cuts, forest aged 11–40 years, 41–90 years, 91–150 years, and older than 151 years. We then used the areas of these five forest age categories as predictors in the analyses focusing on community composition, breeding activity, species richness and abundance.

2.6. Statistical Analyses

All statistical analyses and visualizations were performed with R version 4.2.0 [46] and Excel Microsoft Corporation.

2.6.1. Validation of Sampling Effort

To estimate whether mist-netting effort was sufficient to reveal a maximal number of species within the study plot, we conducted a rarefaction analysis using the R package iNEXT [47]. The rarefaction was conducted at the level of the study plot including all captured individuals.

2.6.2. Associations of Bat Assemblages with Land Cover Types and Forest Age

To assess the impact of land cover types and forest age structure on bat assemblage structure, we performed two types of redundancy analysis (RDA) [48]: in the first one, we used the areas of different land cover types as explanatory variables, and in the second one, the areas of different forest age classes. RDAs were performed using the R package vegan [49] at both spatial levels. The spatial level of the analyses determined how the area of different land cover types and forest age classes was calculated (see Section 2.5). Prior to performing RDA, we applied a Hellinger transformation to the community matrix. To assess the significance of the fitted models we used a permutation test (n = 999). Similarly, permutation tests were used to test the significance of each constrained axis and explanatory variables.

2.6.3. Species Richness and Total Bat Abundance in Relation to Land Cover Types and Forest Age Structure

We found no correlation between the sampling effort and either the number of individuals or species richness (see Section 3.2), which allowed us to look at how these two variables are affected by land cover types and forest age structure without the need to account for unequal sampling effort. To assess the impact of land cover types and forest age structure on species richness, we ran two generalized linear mixed-effects models (GLMM) with Poisson distribution using the ‘fitme()’ function from package ‘spaMM’. We used the number of species at each mist-netting site as a response variable and areas of different land cover types (first model) or areas of forest age classes (second model) as fixed-effects continuous predictors. In both of these models, we used the random structure of the site nested in the plot (random intercept). Similarly to these two models, we fitted two models to explain the index of total bat abundance, i.e., using the number of bats at each mist-netting site as a response variable (fitted with negative binomial distribution). We used the same random and fixed effects in these models as in the two models focusing on species richness.

2.6.4. Breeding Activity

We assessed how land cover types and forest age affected the breeding activity of the five selected species (see chapter 2.4) by fitting two GLMMs with binomial distribution using function ‘fitme()’ from the R package spaMM [50]. As a response variable for both models, we used the reproductive state of individuals: 1 for reproductive females and bats born this year, and 0 for adult males and non-reproductive females. By classifying individuals in this way, we aimed to look for the evidence of breeding activity of individuals. In bats, this can be seen by checking the lactating status of females or the presence of young individuals which were born in June of the same year. In the first model, we used five continuous fixed-effects predictors reflecting the areas of different land cover types (agricultural field, forest, lake, meadow and floodplain) and their interactions with the fixed categorical variable species (with five levels: MDA, NLE, NNO, PNA and PAU). Analogously, as fixed-effects predictors in the second model, we included five continuous variables reflecting the areas of forests in different age classes (11–40, 41–90, 91–150 years, >150 years and clear cuts) and their interactions with the categorical variable species. As the random structure in both these models, we considered the site nested in the plot (random intercept). To assess the significance of the fixed-effect predictors in all GLMMs, we used the Likelihood Ratio Test (LRT).

3. Results

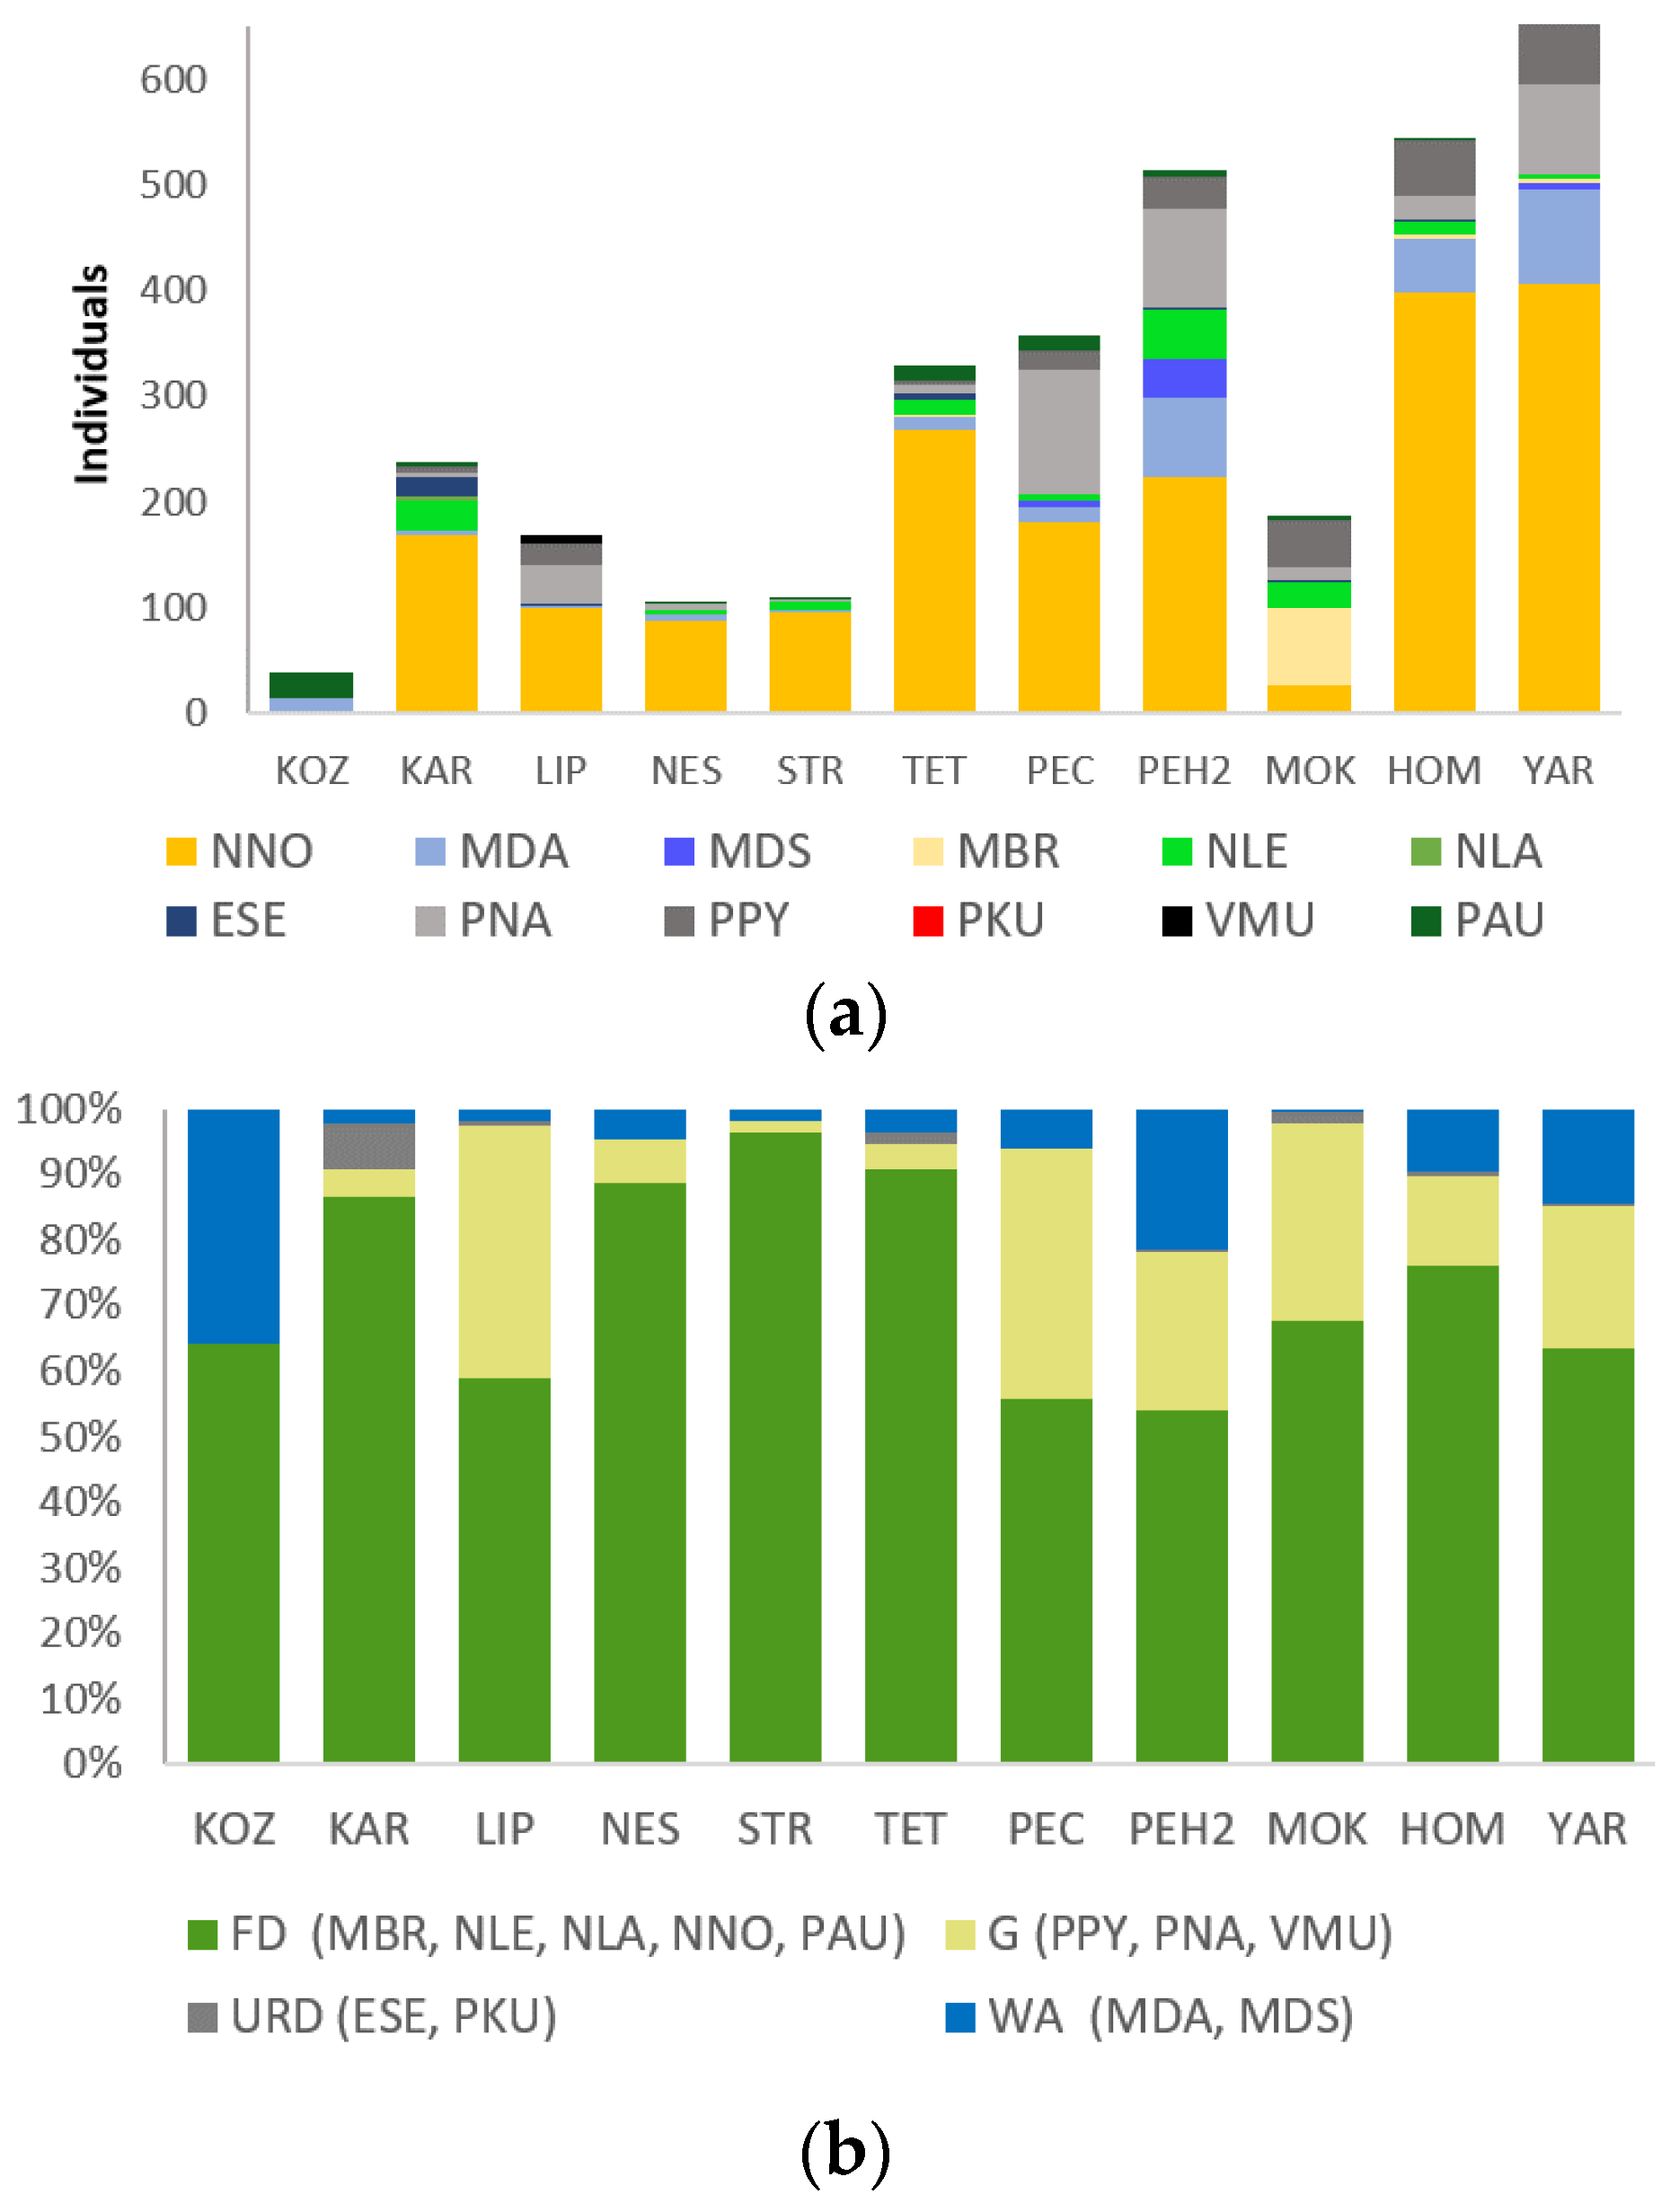
3.1. Mist-Netting Results

In total, we mist-netted 3192 individuals of twelve bat species. The number of species per study plot ranged from 3 to 10, and the number of individuals from 39 to 660 (Table 1). Only one species (MDA) was present at all eleven plots, and five species (NNO, NLE, PNA, PPY and PAU) were caught in 9–10 plots. Four species (MBR, MDS, ESE and VMU) were caught on a few plots, and two species (NLA and PKU) were presented by a few individuals on a single plot. The most common bat species in our sample were forest-dwelling specialists (MBR, NLE, NLA, NNO and PAU) and bats from the water-associated group (MDA and MDS); the generalists were also not rare (PPY, PNA and VMU), while urban- and rural-dwellers (ESE and PKU) were mostly rare. However, the two most rare species were from opposite groups in a line of pristine urban gradient: NLA—forest-dwelling specialists, and PKU—urban- and rural-dwellers.

3.2. The Validation of Sampling Effort

The correlation coefficient between the number of caught individuals and applied sampling effort (mist-netting hours) was low (Spearman’s ρ = 0.227, p = 0.502). Furthermore, the correlation between the number of caught individuals and the area (ha) of a study plot was also low (Spearman’s ρ = 0.263, p = 0.433). The correlation coefficient (Spearman’s ρ) between species number and sampling effort, and between species number and study plot area were 0.366 (p = 0.267) and 0.357 (p = 0.281), respectively. Since we did not detect a linear relation between the number of caught individuals and either the sampling effort or the plot area, our results are not biased by differences in the plot area and sampling efforts.
Based on estimates from rarefaction analysis, we could confirm that on almost all study plots, the number of species caught was equal to the predicted number of species (Supplementary Material, Table S2), indicating that the bat assemblages were saturated. Only for HOM were two more species expected to be found, and in NES and STR one more species.

3.3. Land Cover Types, Forest Age and Bat Assemblage Structure

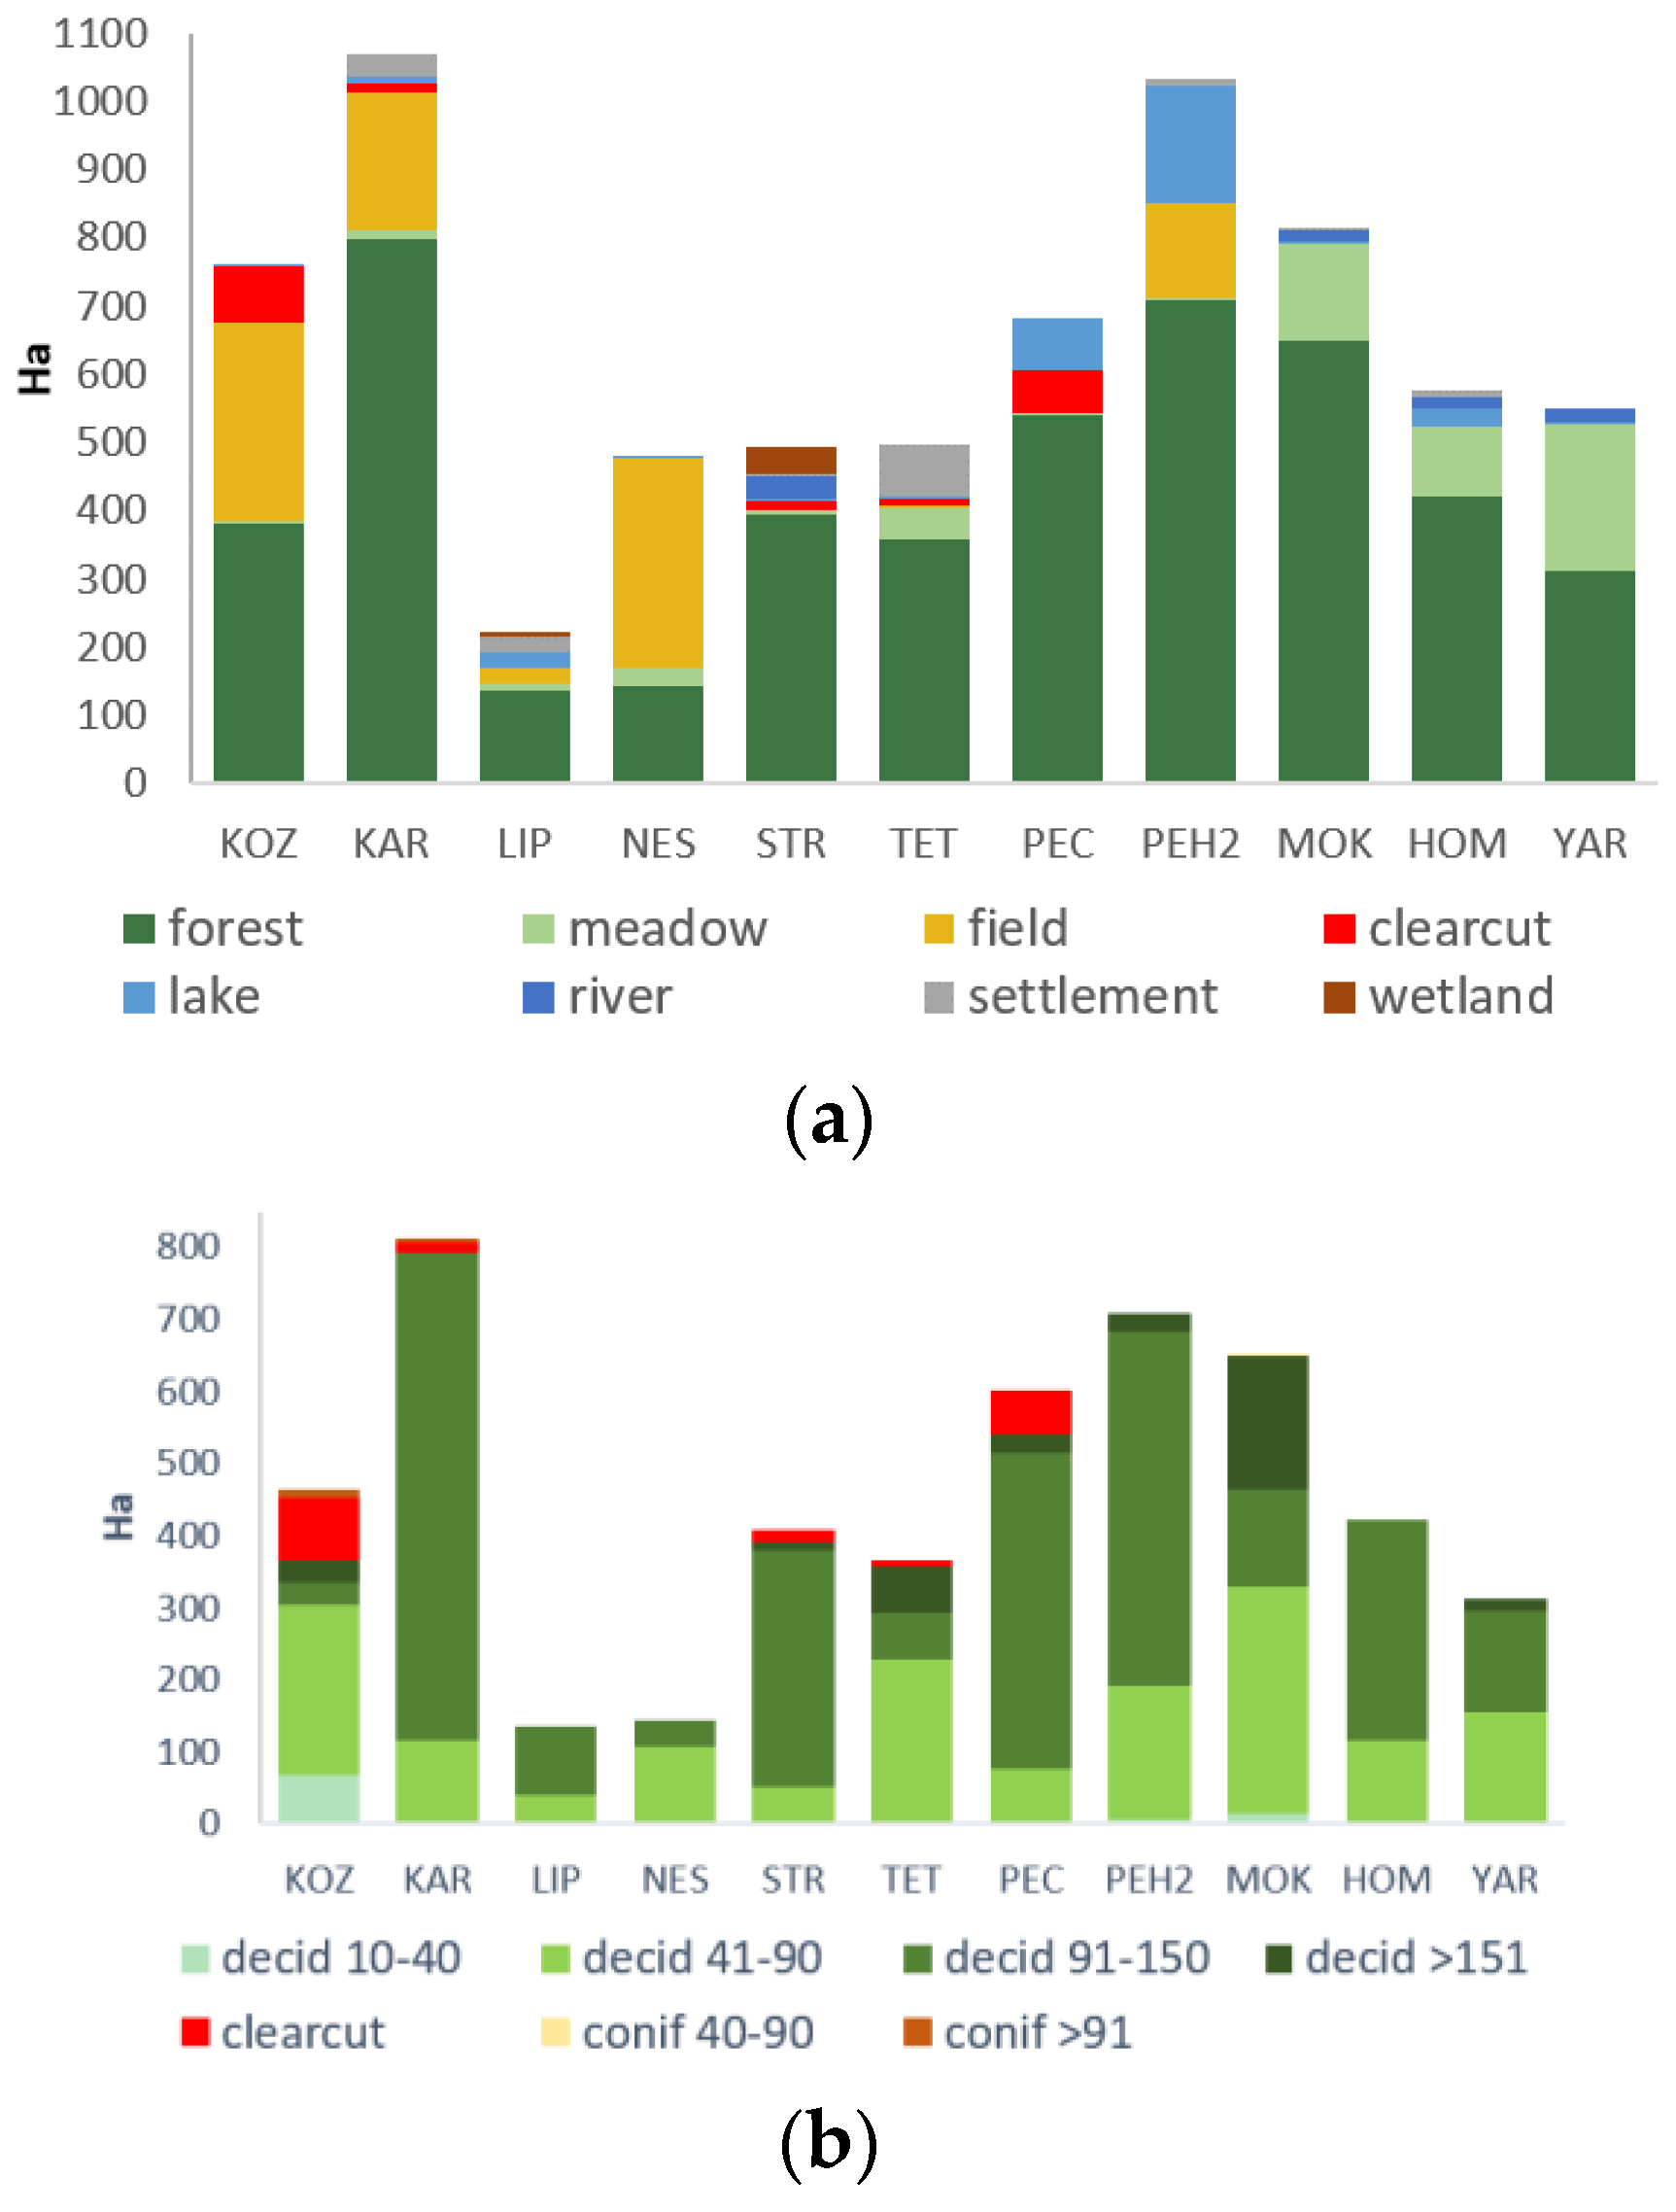
3.3.1. Land Cover Types and Forest Age of Study Plots

Forests constituted the main share of the area in most of the study plots. There was a gradient from plots located along the river with a higher share of water and wet habitats to plots located on uplands with a few small water bodies (Figure 2a,b and in Supplementary Material Figure S1). Open habitats were mostly meadows in riverside plots and agricultural fields in upland plots. Forest covered most of the area of all but one plot. The latter plot (Figure 1a: number 4) covered small, isolated forests with agricultural fields as a dominant habitat.
In forests, the two dominant age classes were 41–90 and 91–150 years. Five plots had fresh clear cuts covering up to 11% of their area; there was no direct connection between the area of clear cuts and old forests (Figure 2b).

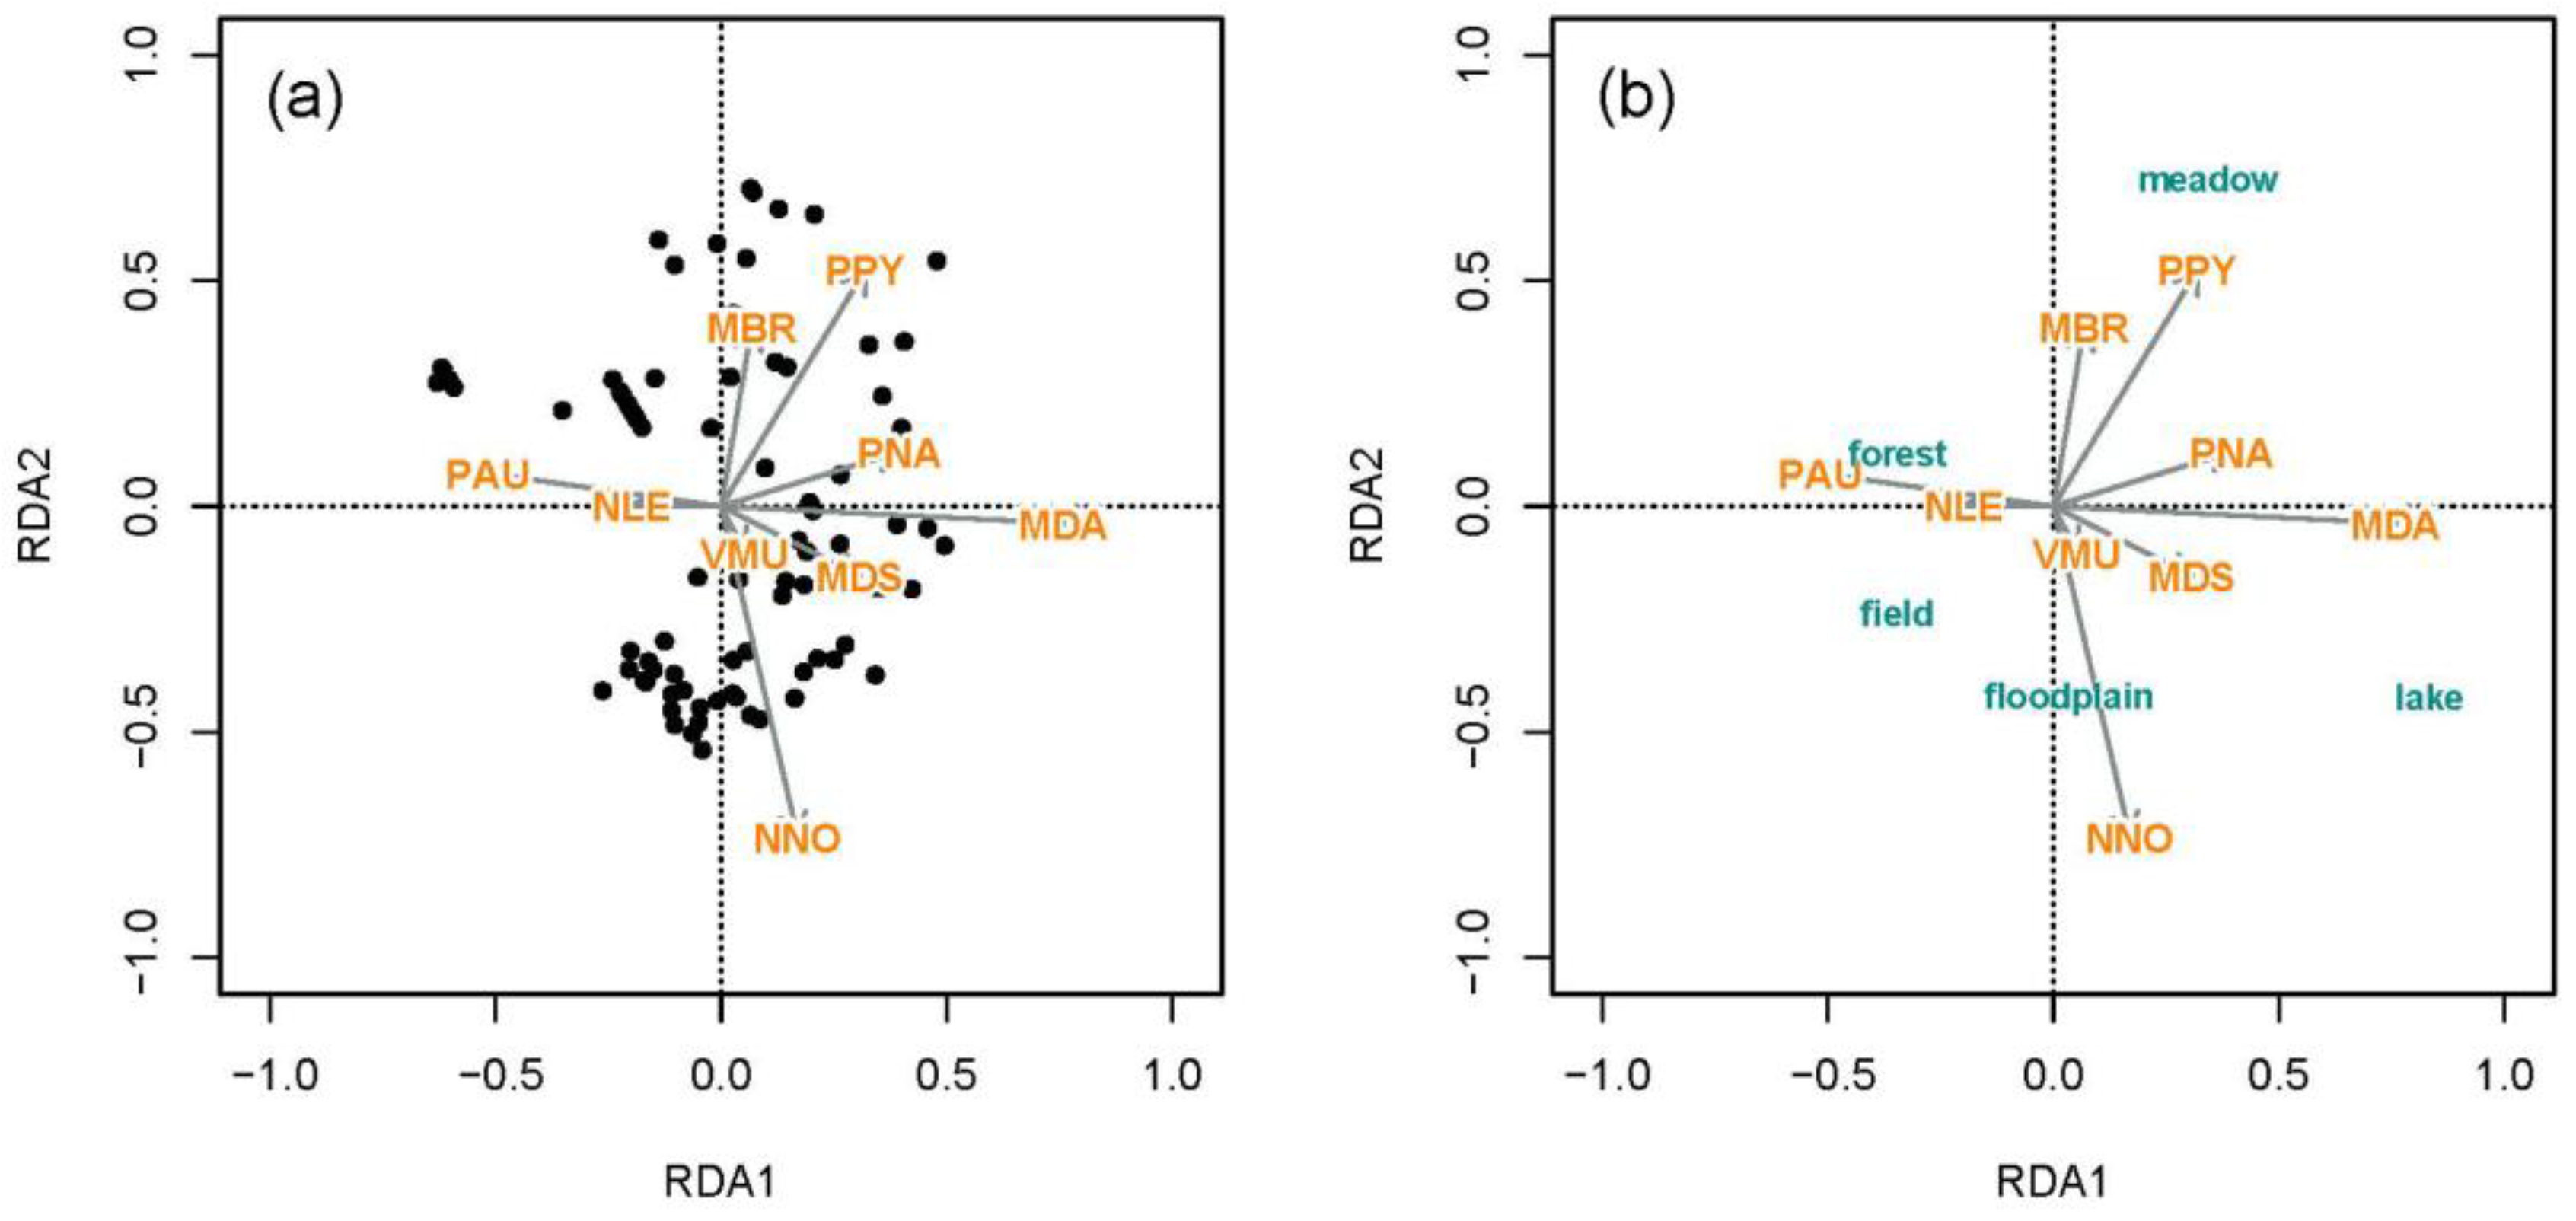
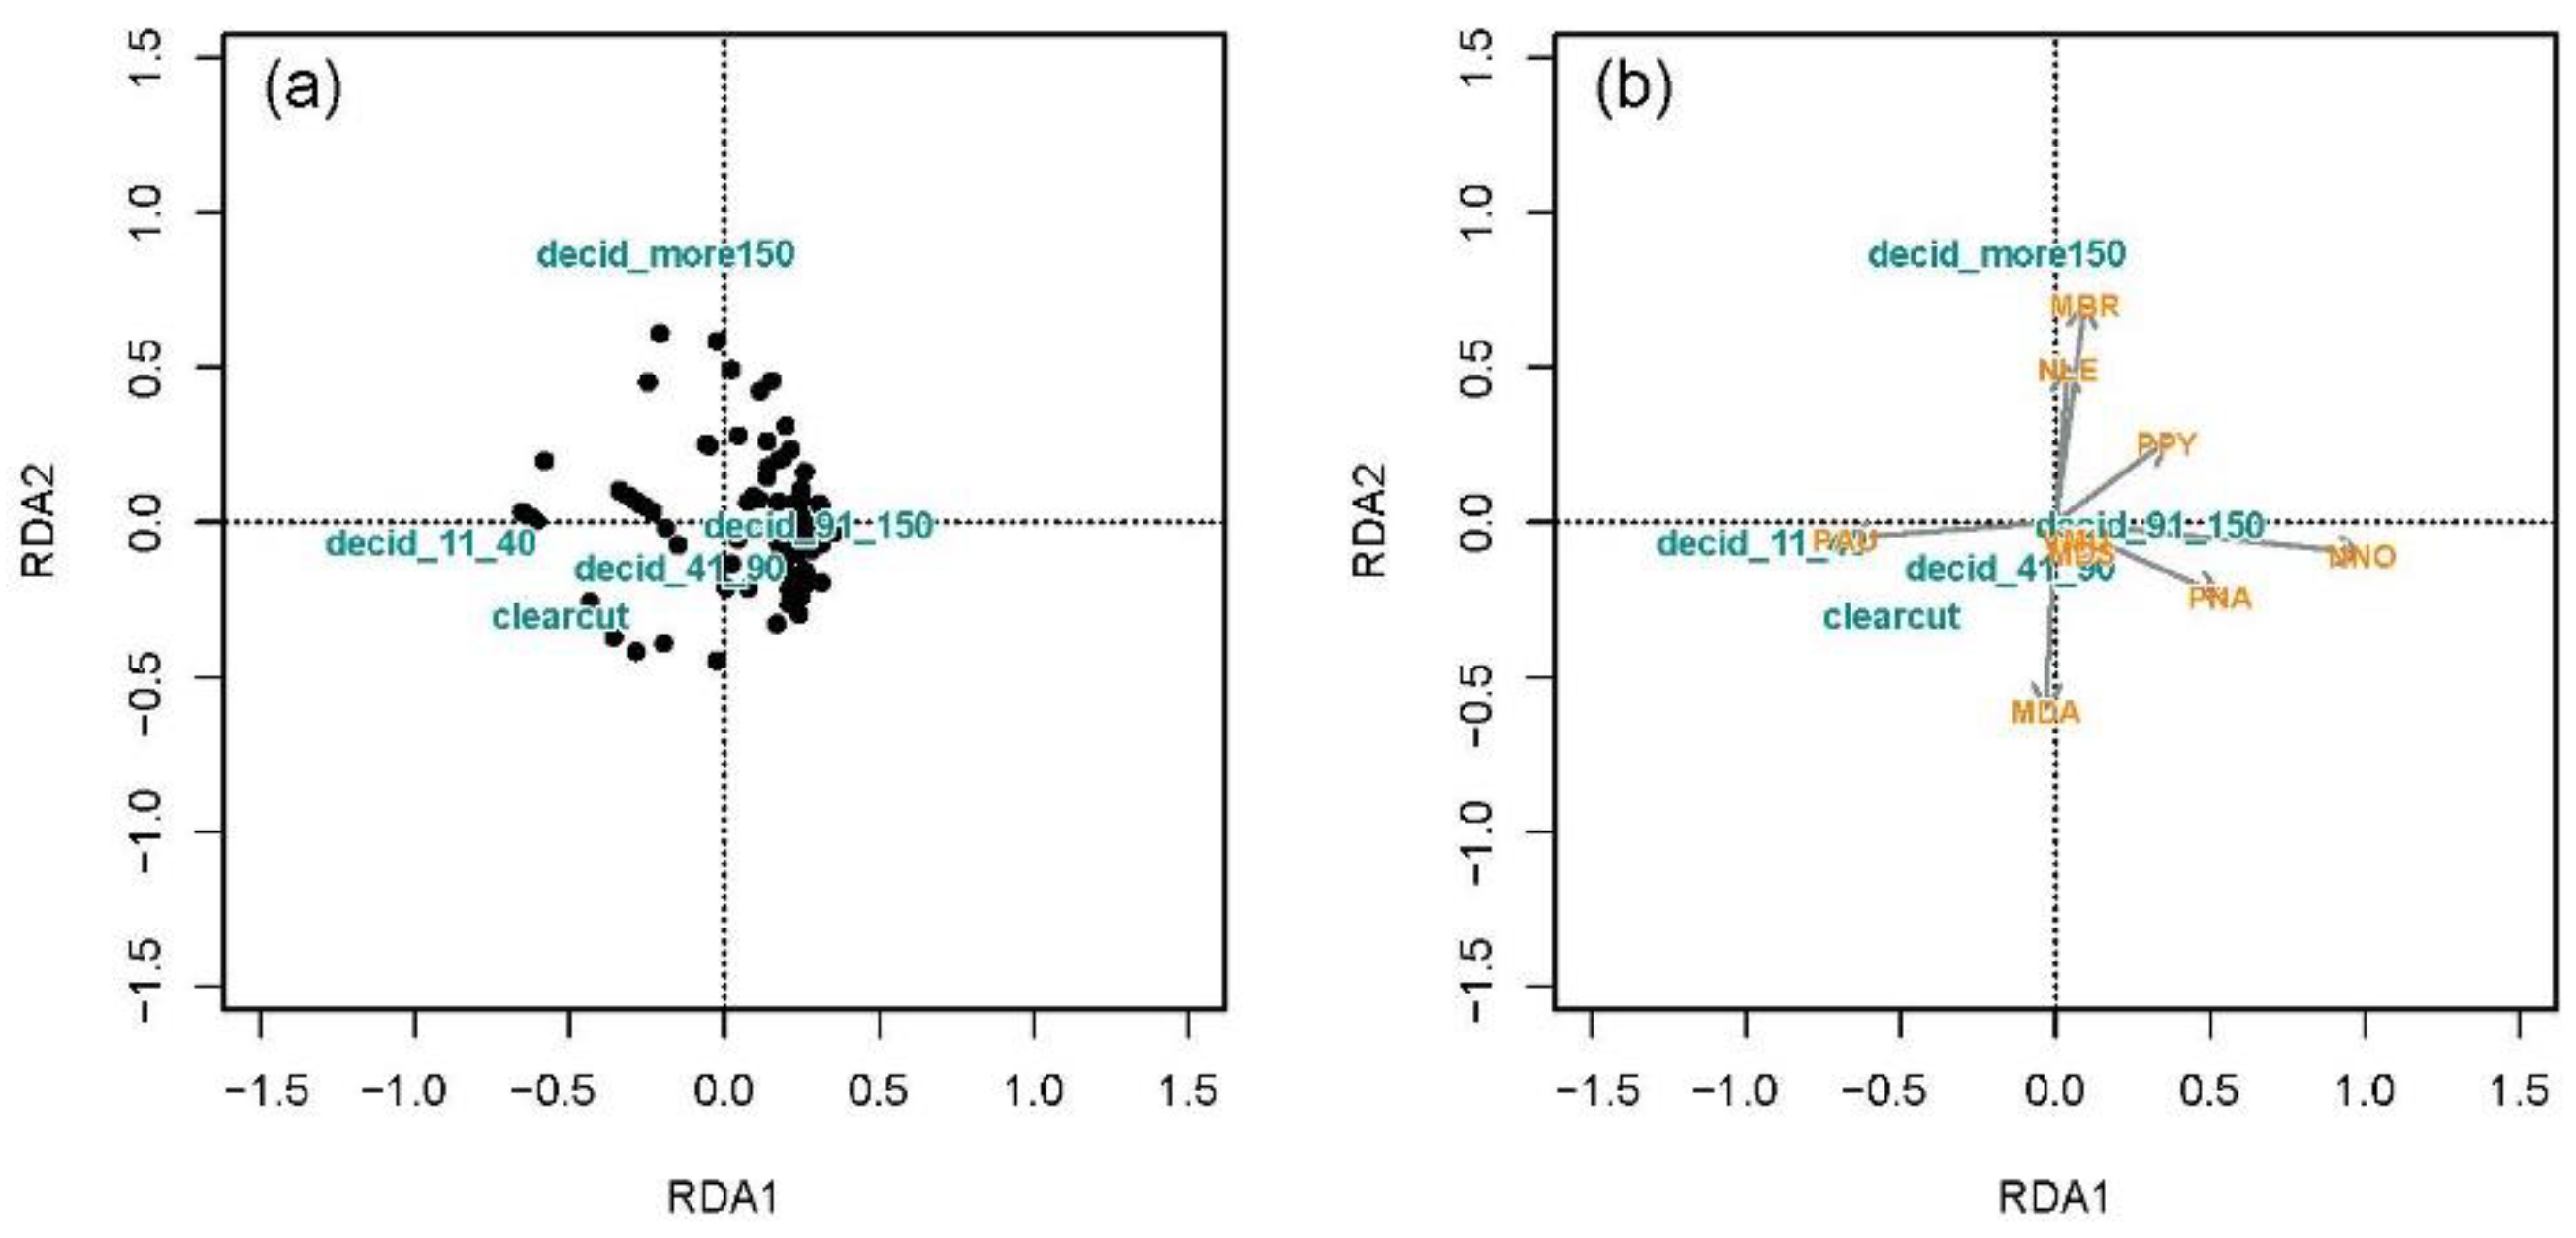
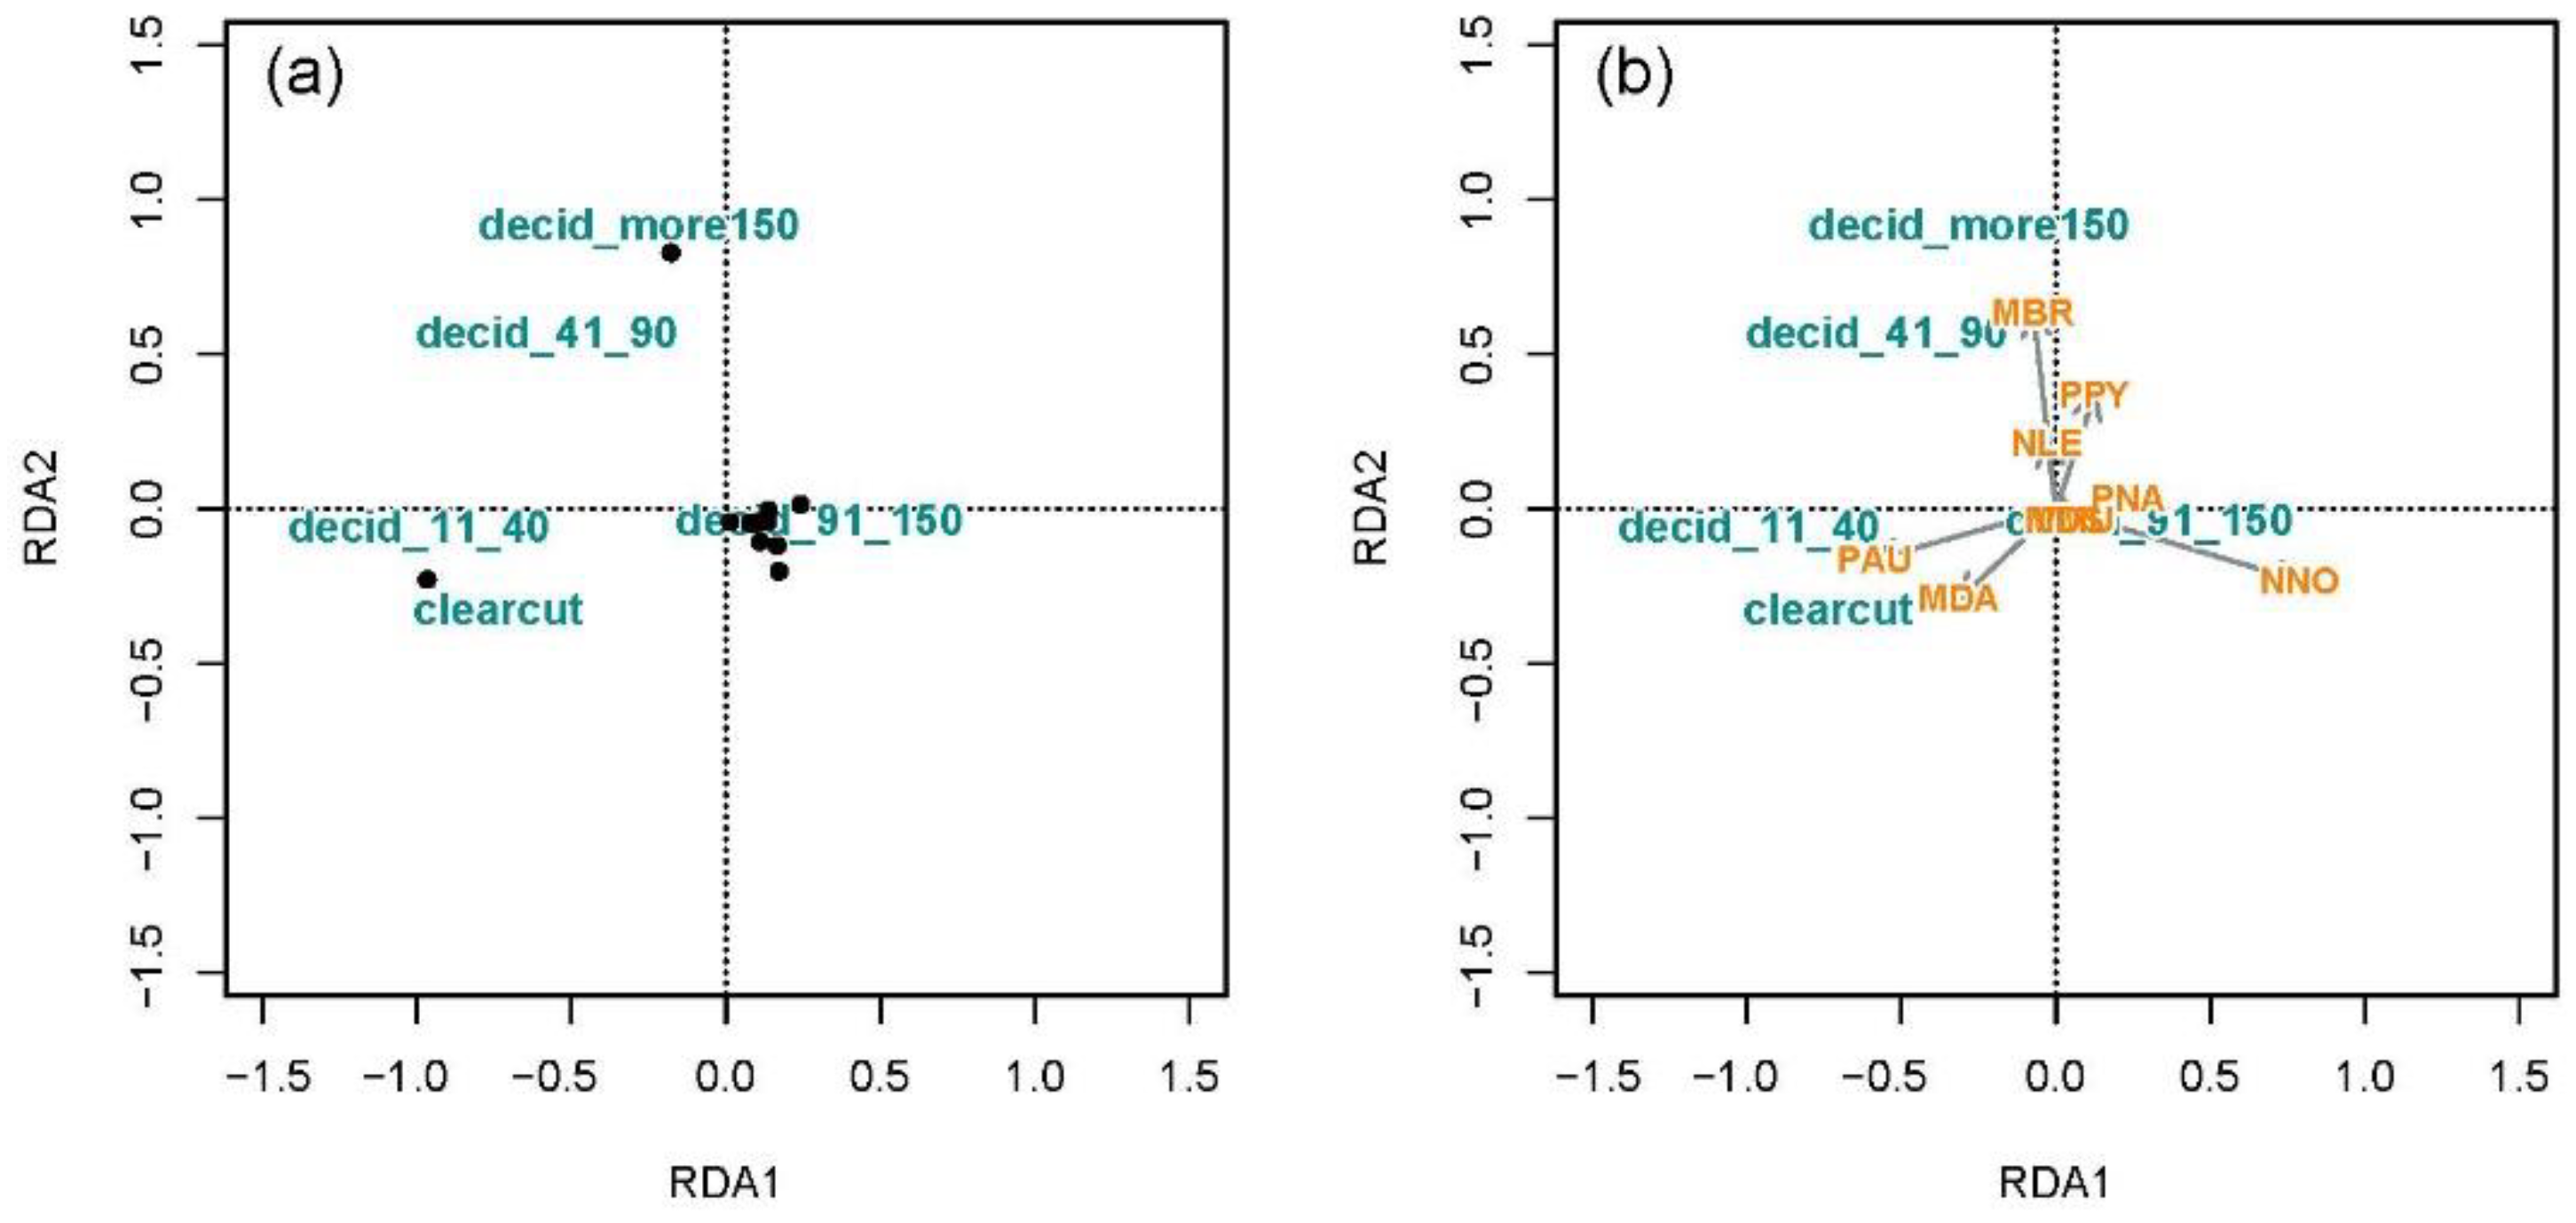
3.3.2. Associations of Bat Species with Land Cover Types and Forest Age

There was no single dominant species in the eleven study plots, but in most of the plots, NNO dominated the assemblage, with its relative abundance ranging from 50% to 80%. Sub-dominant species varied among study plots (Figure 3a), with the three most common sub-dominant species in our sample being: MDA, PNA and PPY. Bat species MBR, MDS and NLE were mostly rare, but common in some plots. The species that were rare in most of the plots were ESE, VMU, NLA and PKU. Notably, the assemblage composition on the study plot KOZ (Koziyivka) was very different from all the other plots (Figure 3a) and consisted of three species only (MDA, NLA and PAU). Furthermore, the dominant species in the KOZ sample was PAU, which was mostly rare (less than 5%) in all the other study plots.
Forest-dwelling specialists dominated the assemblages (Figure 3b), with water-associated and generalist species being sub-dominant, while urban- and rural-dwellers were rare.

Association of Bat Species with Land Cover Types

At the site level, the overall RDA model explained 51.9% of data variation, and the amount of the constrained variation explained by land cover types was 8.4%. The first RDA axis reflected the gradient from terrestrial to aquatic land cover types ranging from field and forest (negative values) to lake (positive values, Figure 4). The second RDA axis reflected wetness, with negative values corresponding to floodplain and the positive ones corresponding to meadows. Both RDA axes were not significant. The overall model was significant (F5,95 = 1.77, p = 0.01). The explanatory variables ‘lake’ (F1,95 = 2.13, p = 0.04) and ‘forest’ (F1,95 = 2.31, p = 0.04) were significant. Species fell into several groups along the environmental gradients summarized by RDA axes: NNO and VMU were associated with floodplains, PPY, PNA, MDS and MDA were associated with meadows and lakes, NLE was associated with forest sites, and PAU with sites close to fields. The majority of species were found away from fields (Figure 4b).
At the plot level, the overall RDA model explained 26.1%. The proportion of variation explained by land cover types was 41.9%. The fitted model was not significant (F5,5 = 0.72, p = 0.7). The negative values on RDA 1 reflected fields, whereas the positive ones reflected the higher share of lake areas (Supplementary Material, Figure S3). The RDA 2 reflected another gradient from field (negative values) to forest and meadow (positive values); however, these redundancy scores were not significant.

Association of Bat Assemblages with Forest Age Structure

At the site level, the overall RDA model explained 51.9% of variation, and the amount of the constrained variation explained by different forest age classes was 11.5%. The first RDA axis reflected a gradient of forest age ranging from young forest (11–40 years old) and clear cuts (negative values) to old forest (91–150 years old; Figure 5). The second RDA axis reflected a gradient from clear cut (negative values) to the oldest forest in the area of more than 150 years old. The overall model was significant (F5,95 = 2.5, p = 0.001) and the first RDA was significant (F1,95 = 7.77, p = 0.001). Among the explanatory variables, two were significant: the area of the young forest 11–40 years old (F1,95 = 7.28, p = 0.001) and the area of the old forest of more than 150 years old (F1,95 = 3.23, p = 0.01). Among the species, only PAU was associated with clear cuts and young forest stands of 11–40 years old, whereas all other species tended towards older forest stands of at least 41 years old.
At the plot level, the overall RDA model explained 26.1% of data variation. The proportion of constrained variation explained by the forest age classes was 78.8%. The first RDA axis reflected a gradient from young forest (11–40 years) and clear cut (negative values) to old forests (91–150 years old; positive value). The second RDA axis reflected the gradient from clear cut (negative value) to the oldest forest stands (more than 150 years old, positive value) (Figure 6). The overall model was significant (F5,5 = 3.71, p = 0.02), the first RDA axis was also significant (F1,5 = 11.81, p = 0.02). The community composition was significantly affected by the area of clear cut (F1,5 = 7.09, p = 0.02) and the area of young forest (11–40 years old; F1,5 = 5.78, p = 0.01). The effect of the oldest forest age class of more than 150 years old was marginally significant (F1,5 = 2.93, p = 0.08). At the plot level, two species, PAU and MDA, were associated with clear cuts and young forest stands, while all the other species were associated with forests older than 41 years.

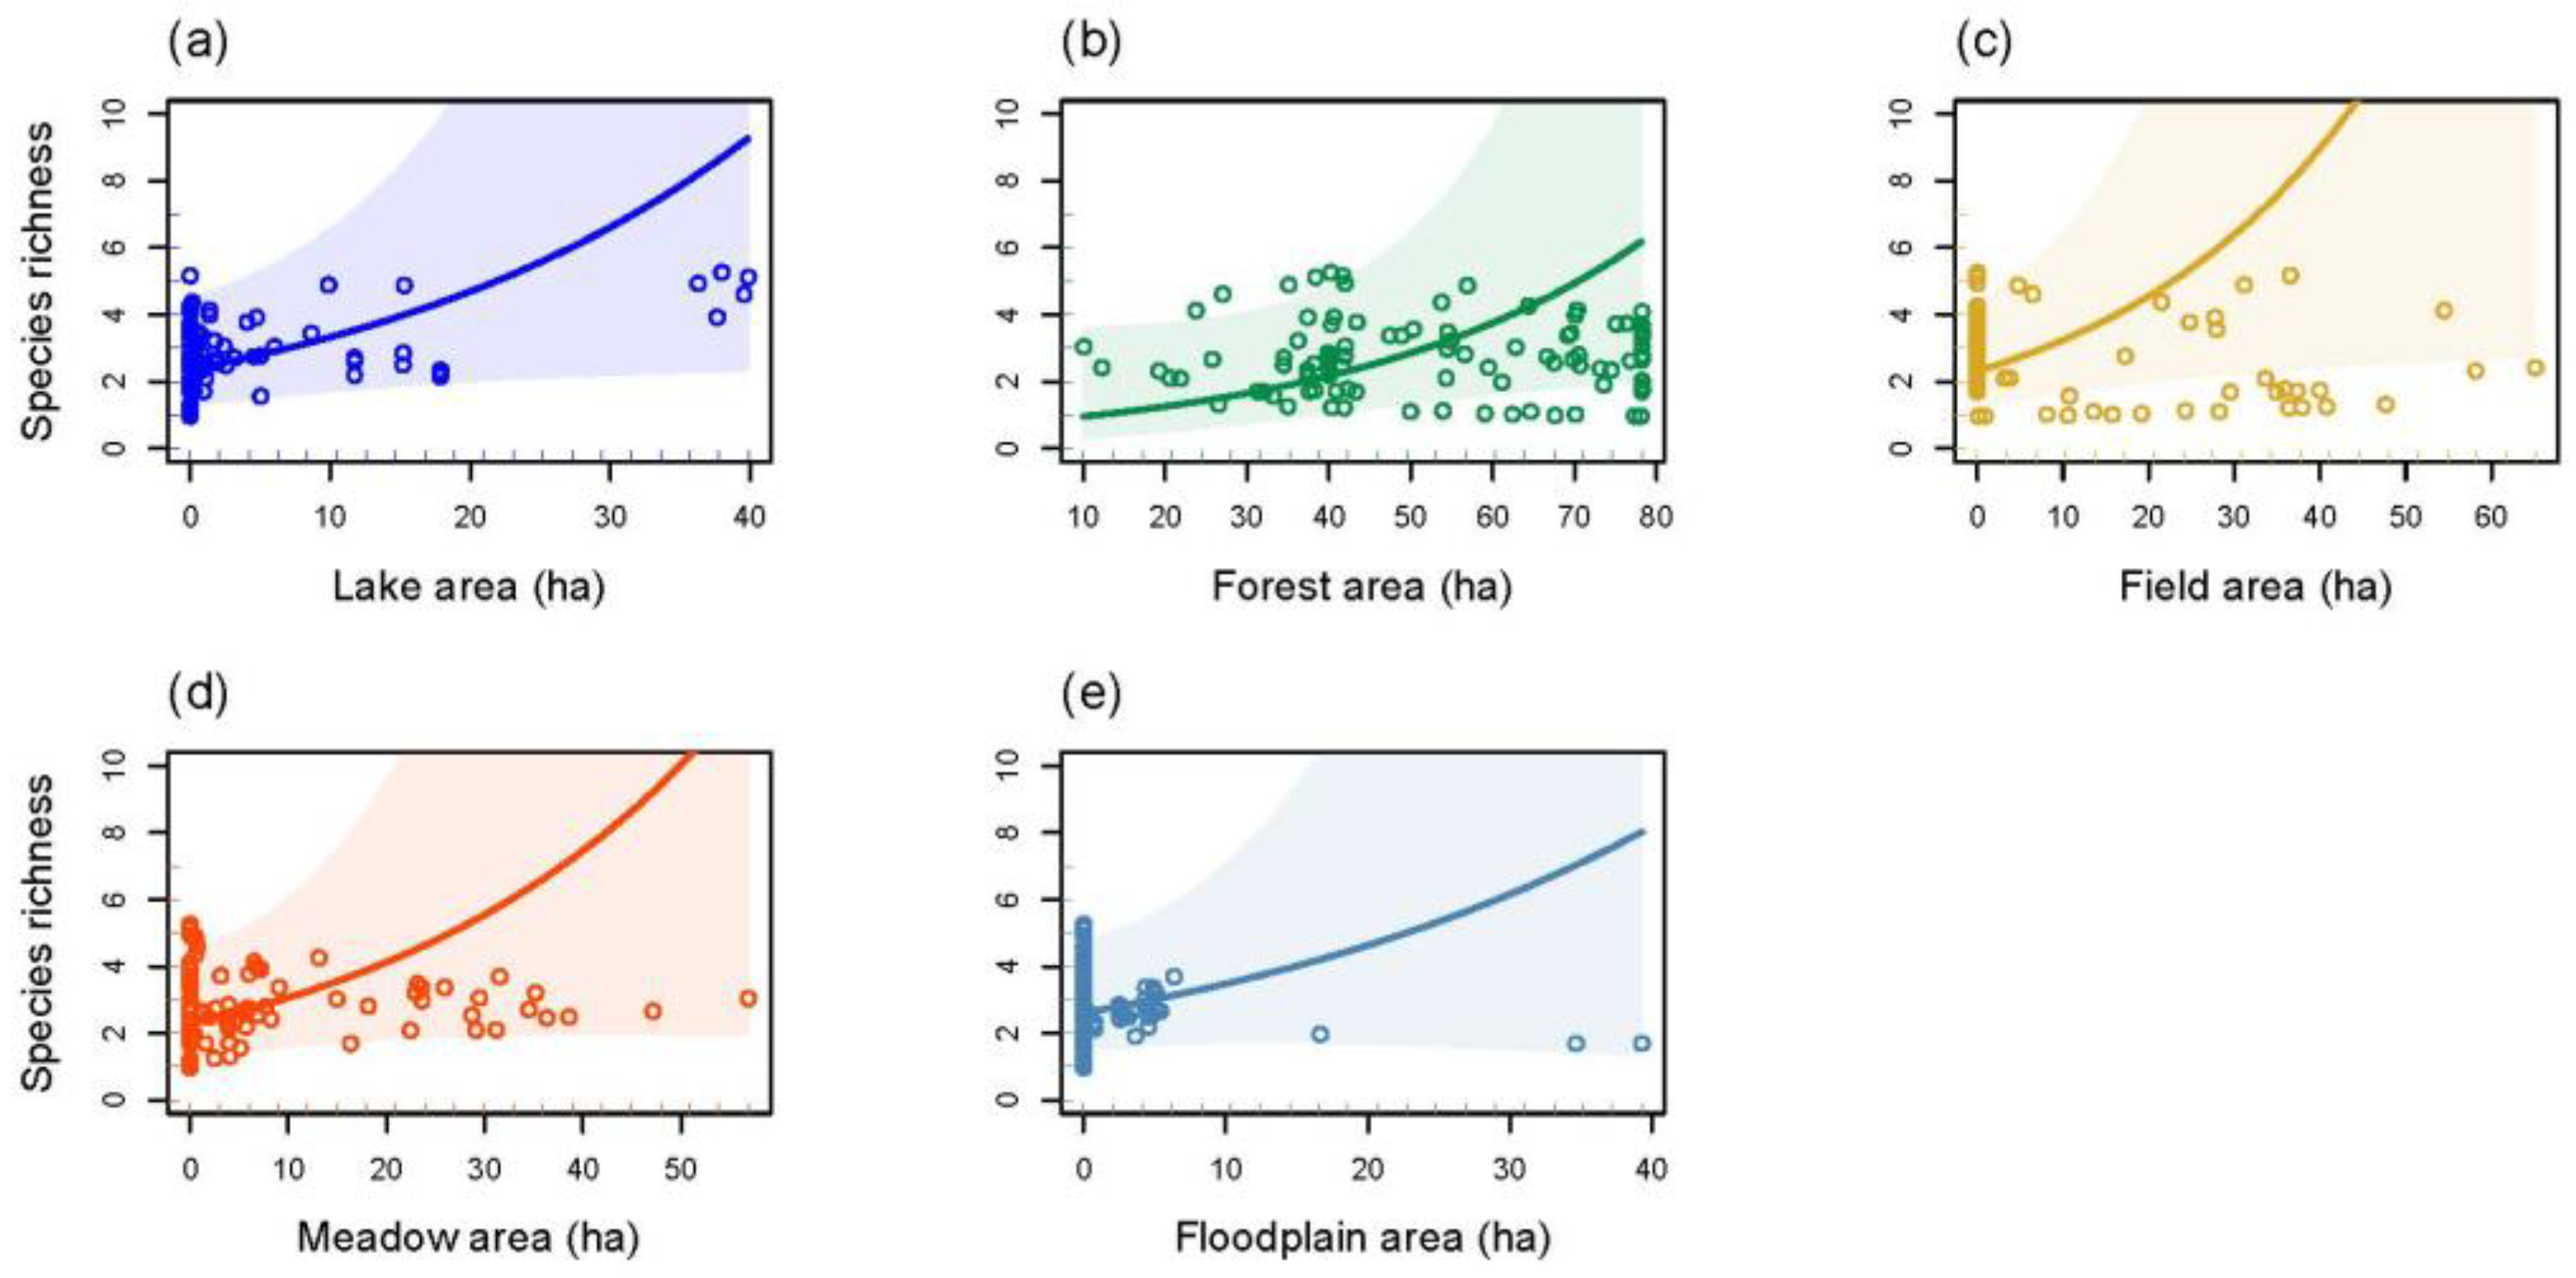
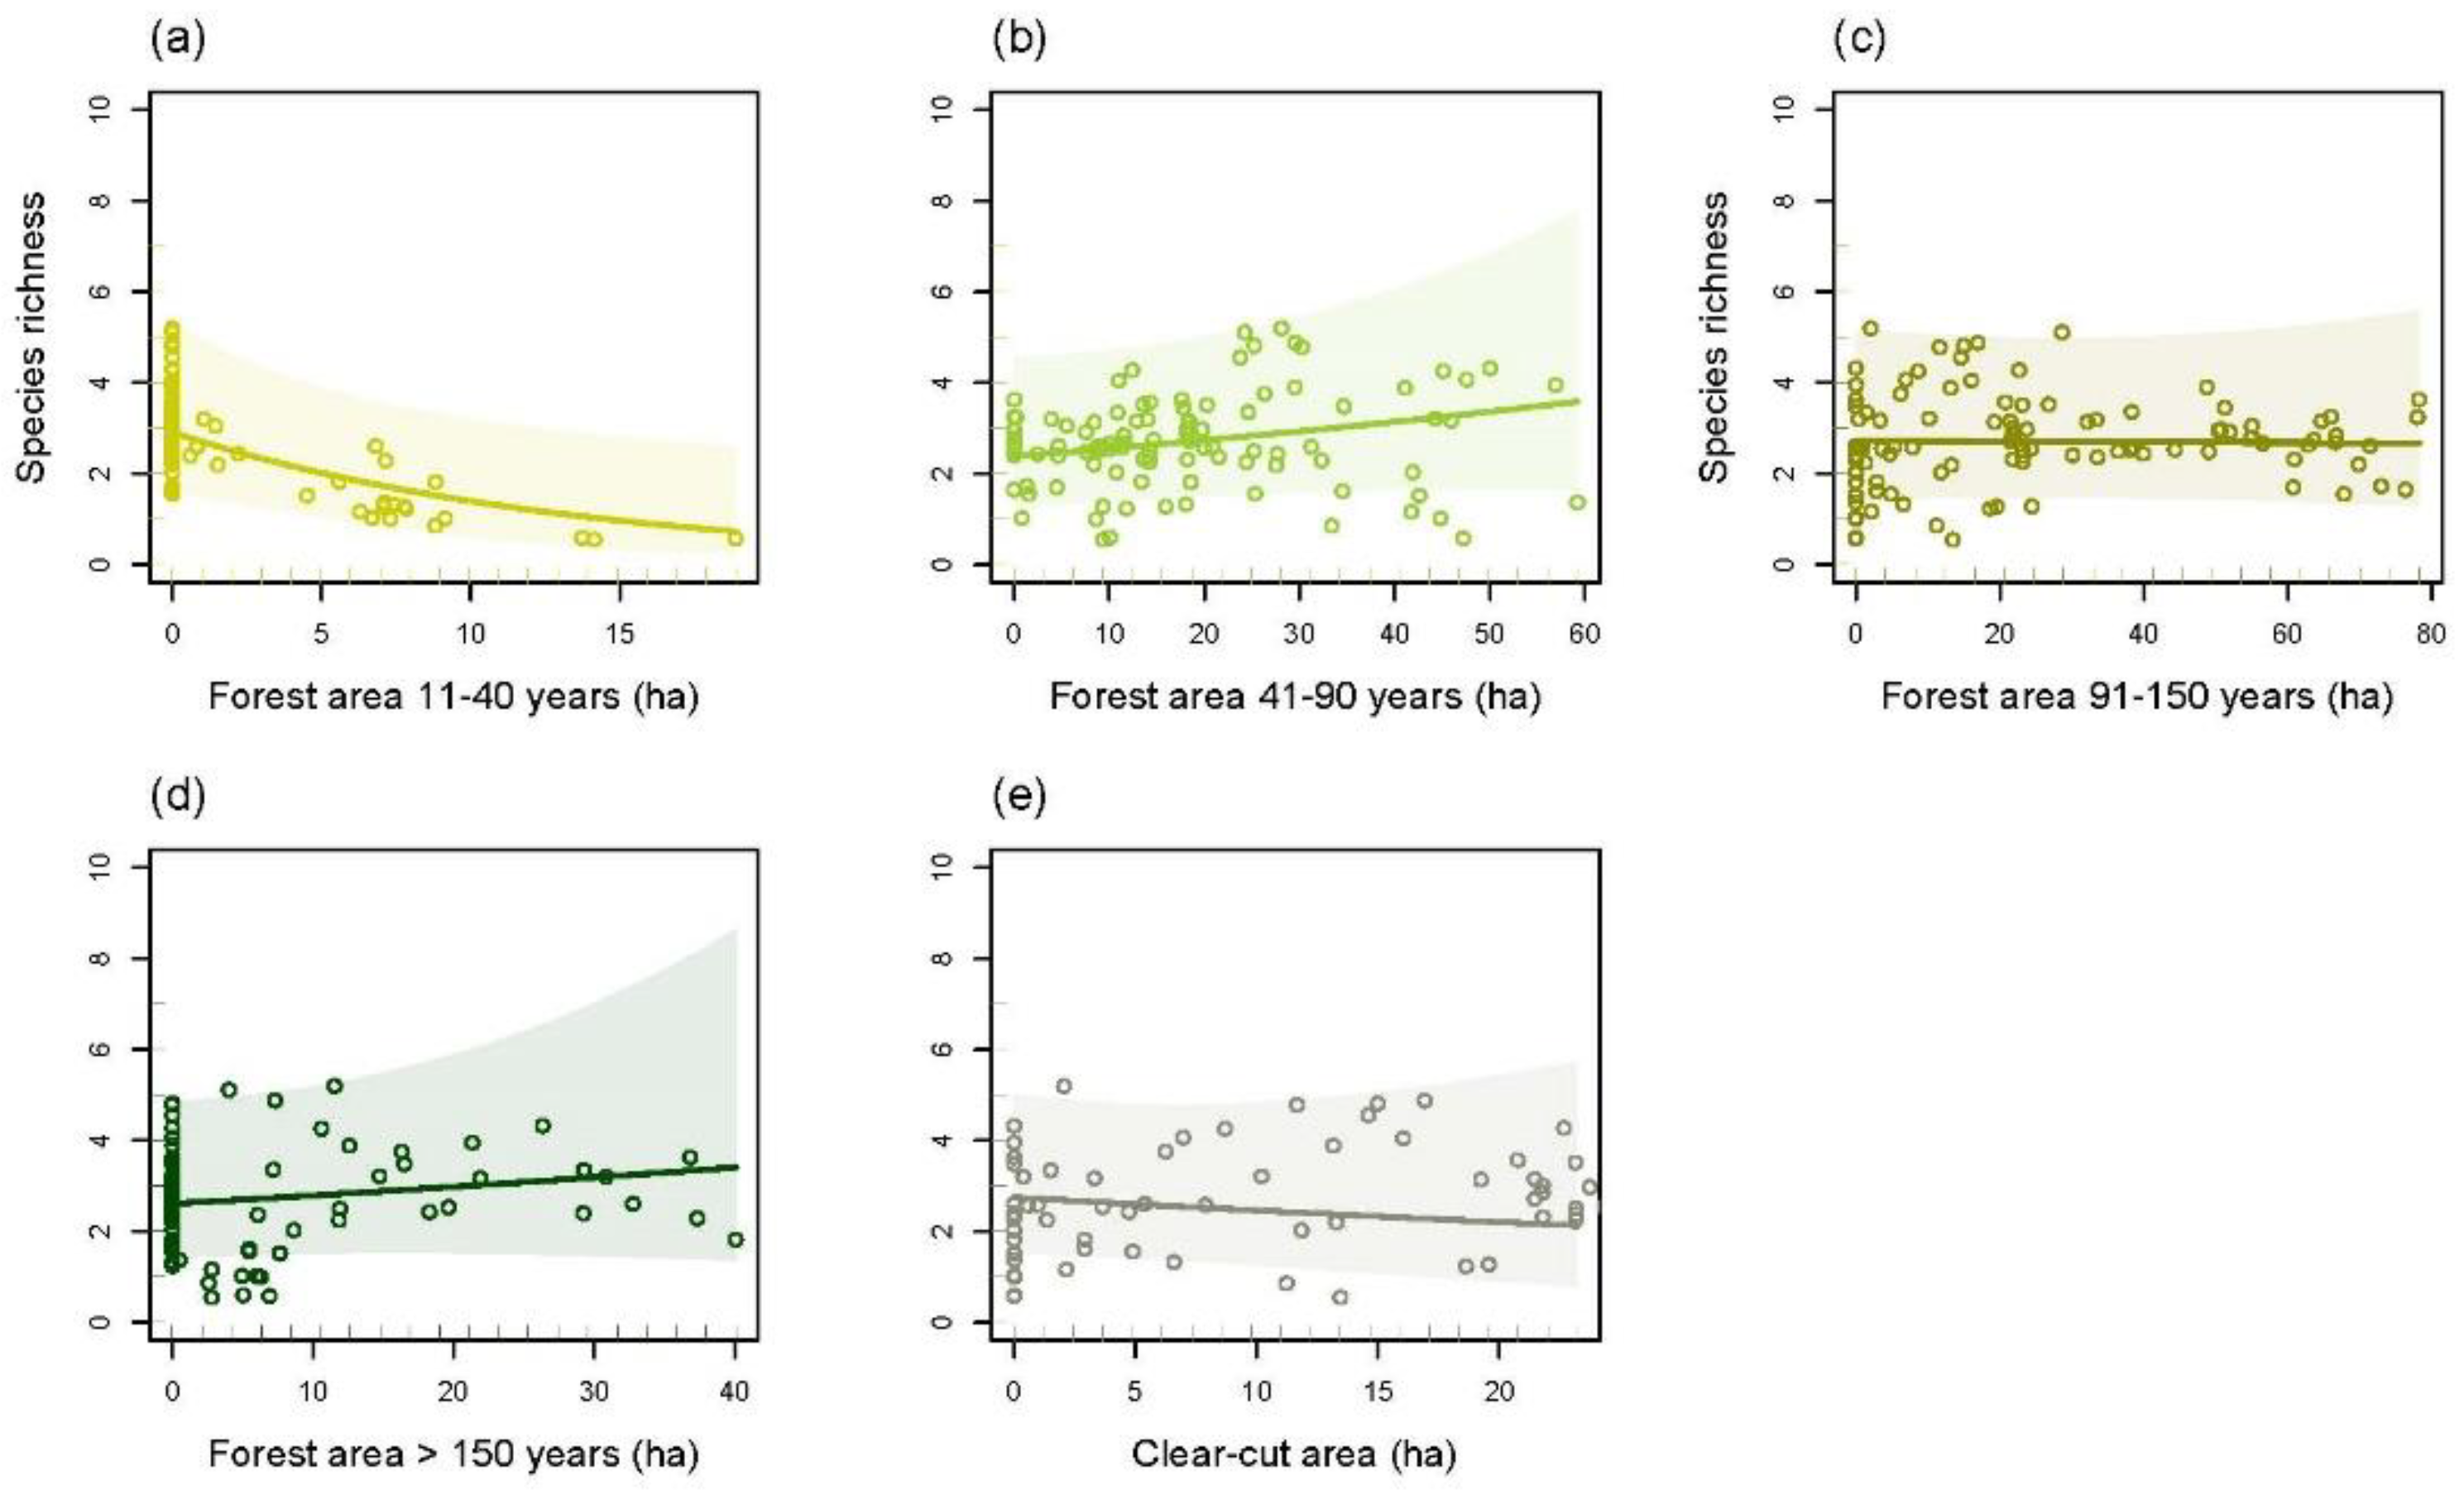
3.4. Species Richness and Total Bat Abundance in Relation to Land Cover Types and Forest Age Structure

Species richness increased significantly with the area of lake (χ2 = 4.07, df = 1, p = 0.04) and that of fields (χ2 = 3.60, df = 1, p = 0.05), while the area of forest (χ2 = 3.15, df = 1, p = 0.07) had a marginal positive effect (Figure 7, Supplementary Material Table S3a). Regarding forest age classes, only young forest (11–40 years old; t = −2.31) had a significant negative effect on species richness (Figure 8, Supplementary Material Table S3b).
Similar to species richness, the index of total bat abundance was positively significantly affected by the area of lake and field and marginally affected by the area of forests (Supplementary Figure S4a). Additionally, the index of total bat abundance was negatively affected by the area of young forests (1–40 years old; t = −2.14) (Supplementary Material Figure S4b, Table S4a,b).

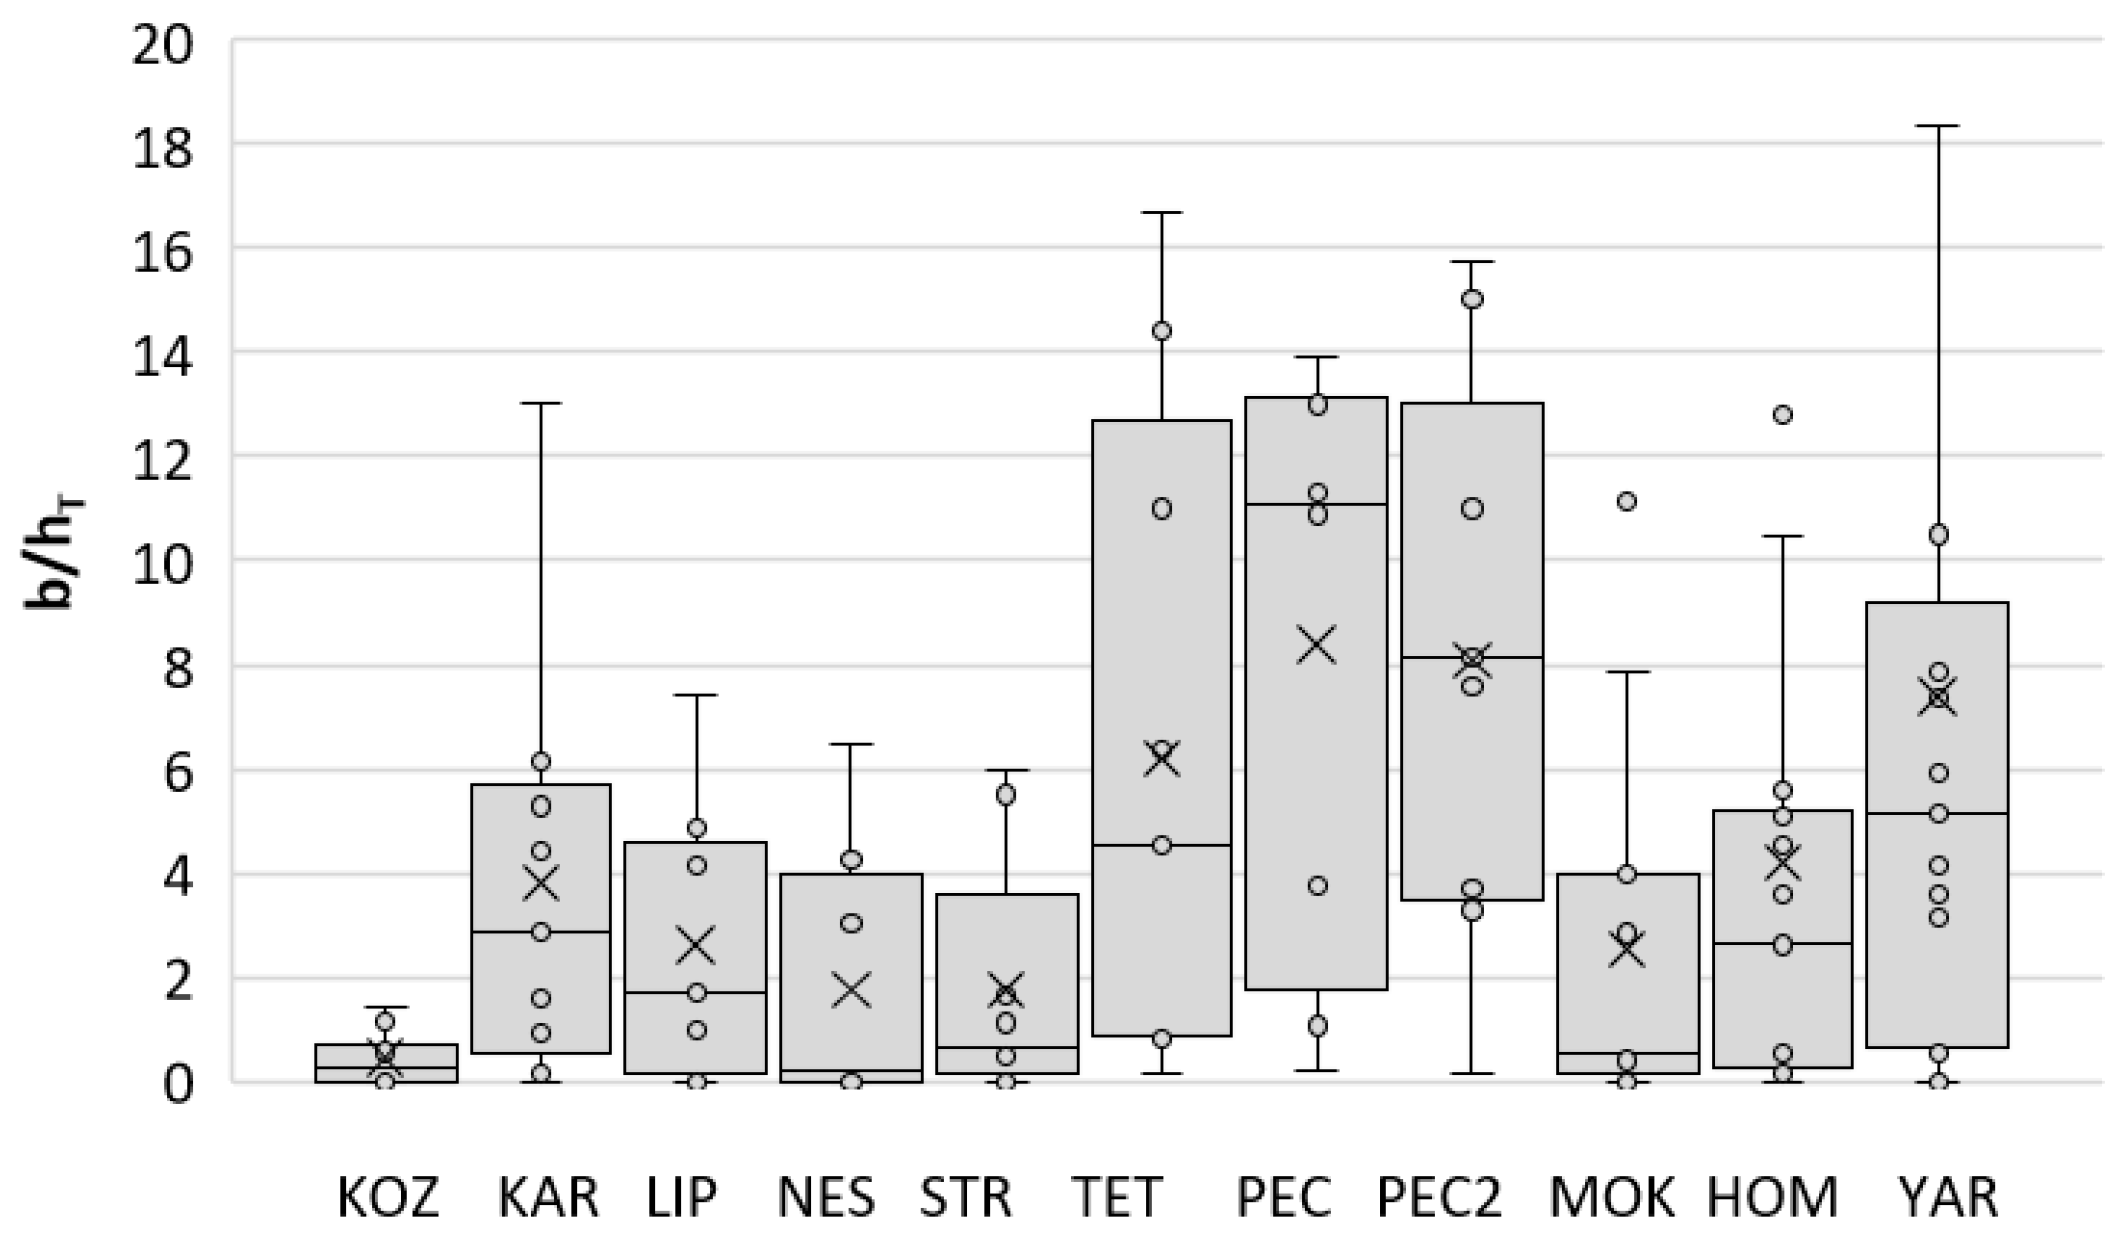
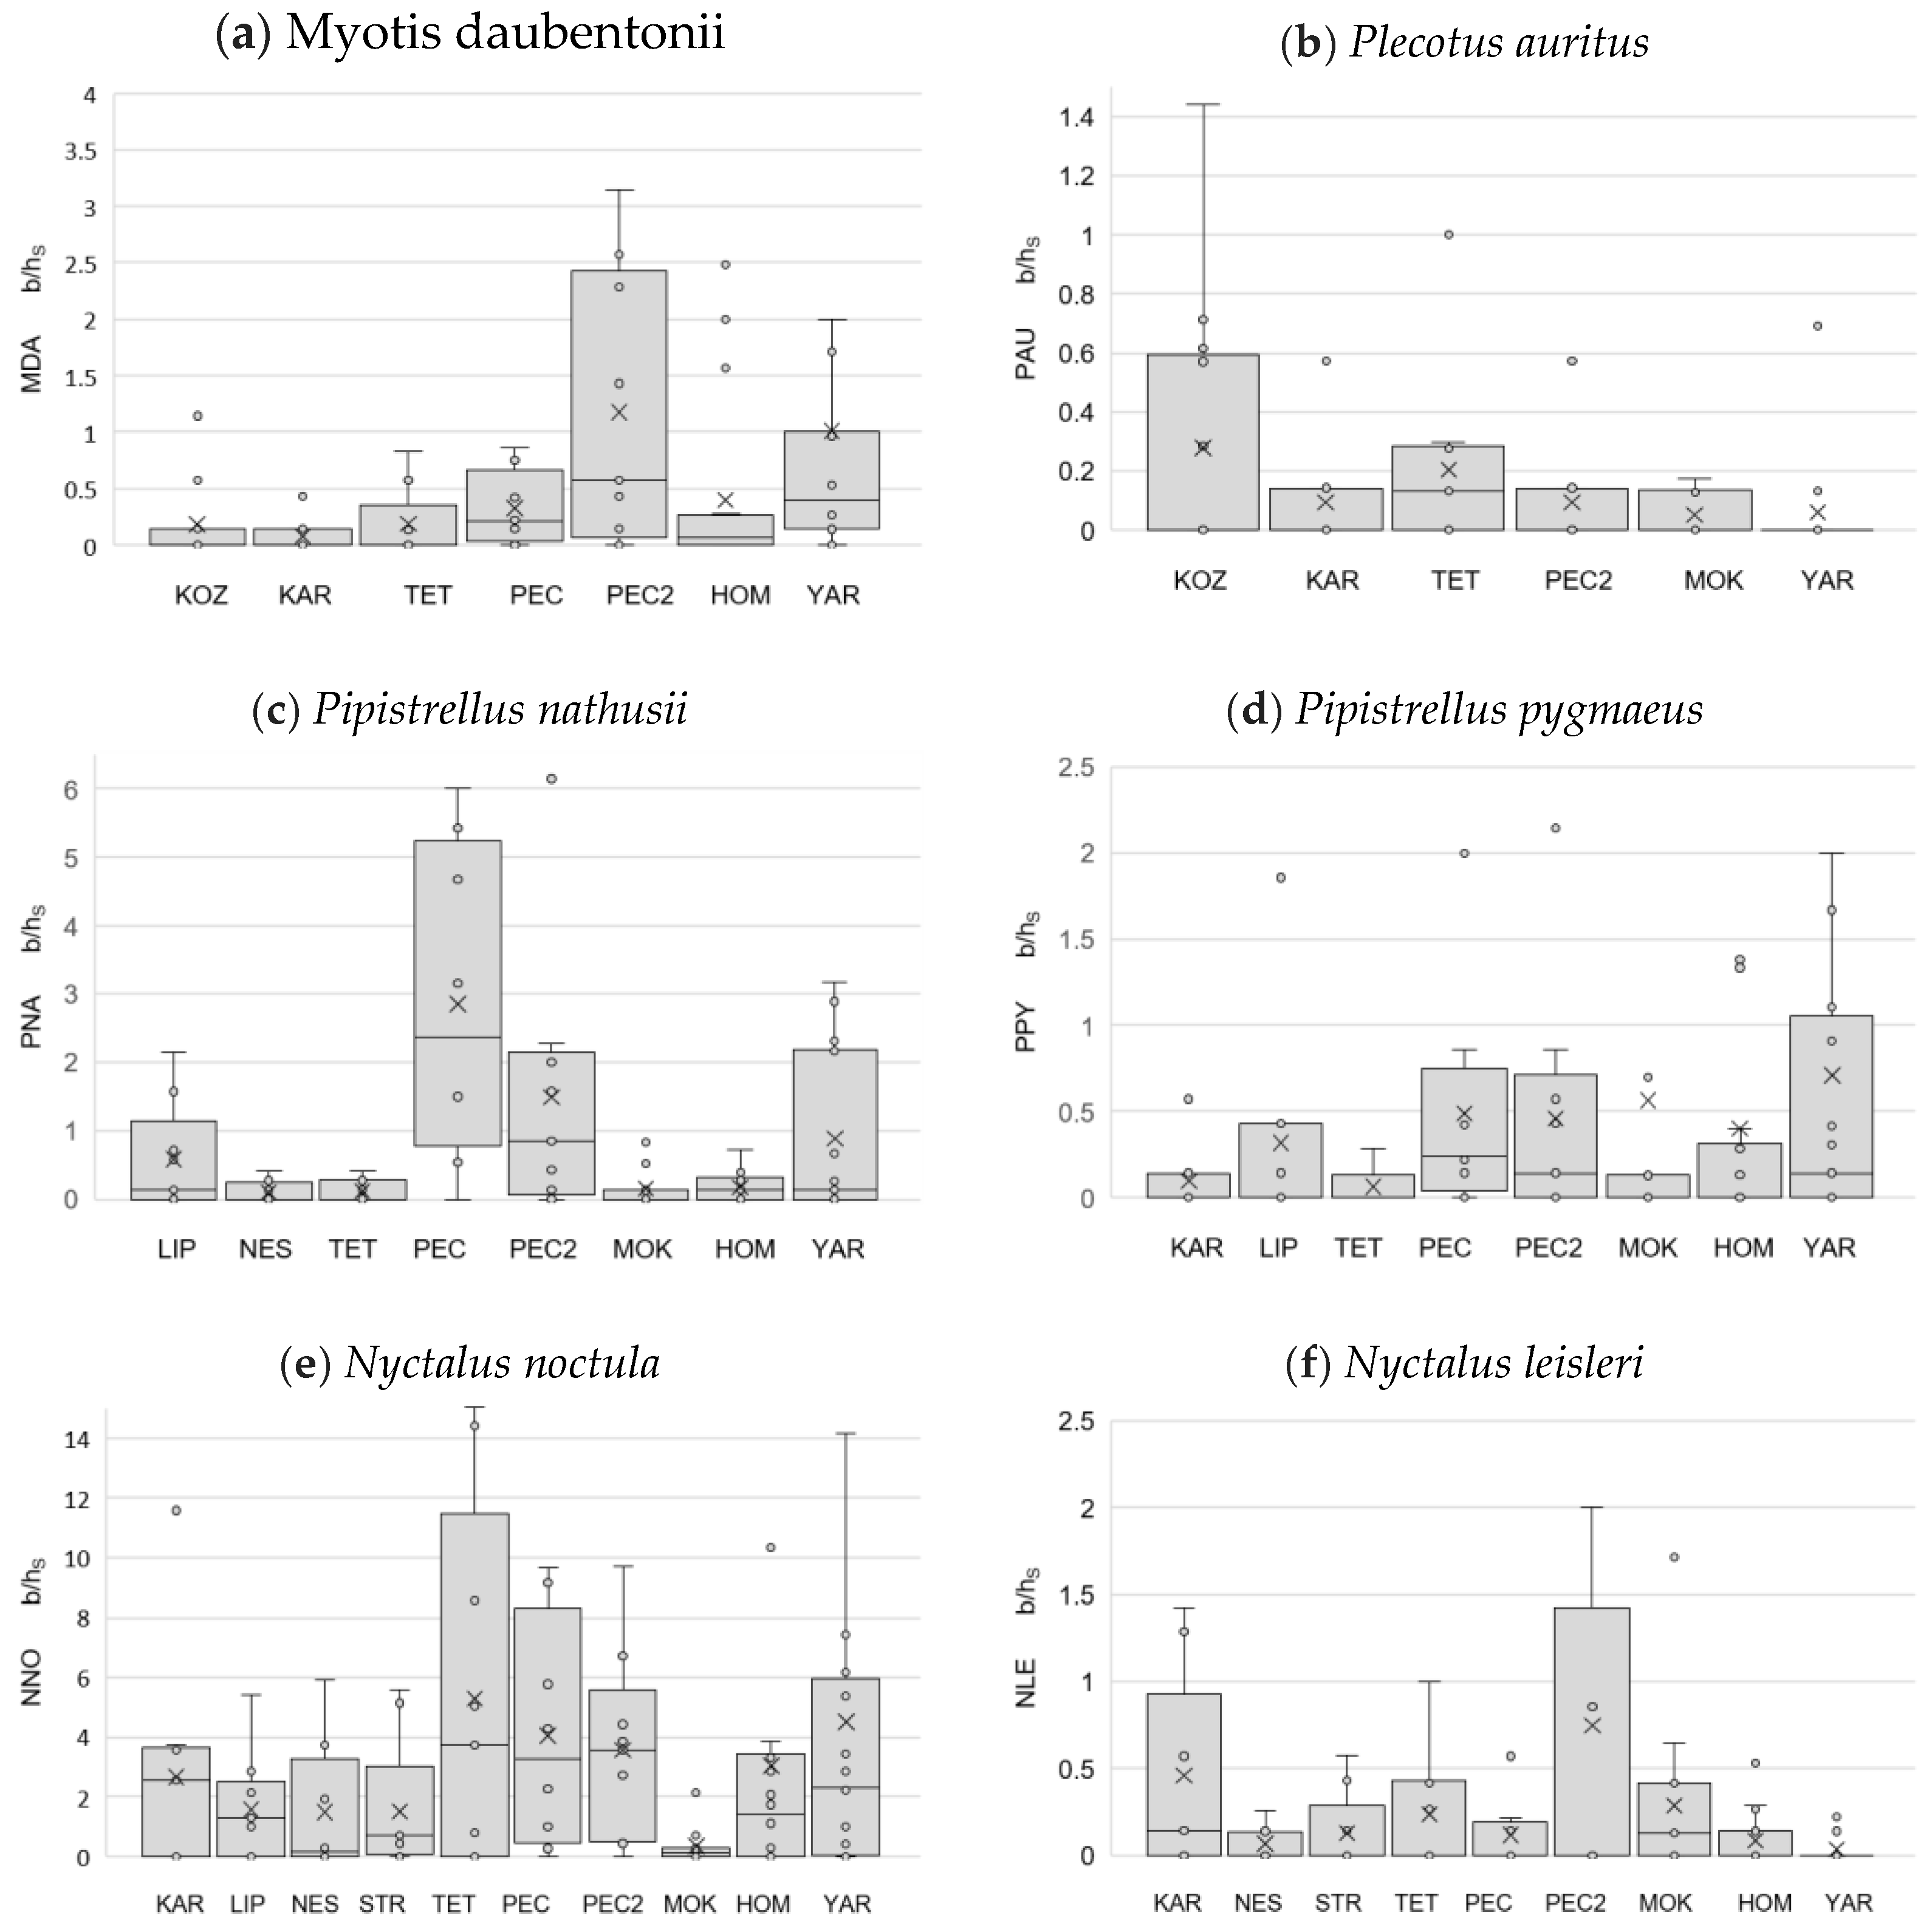
3.5. Indices of Bat Abundance B/h

The b/hT index varied from 0.4 (plot KOZ) to 8.4 (plot PEC) with the average across the eleven plots being 4.3 (Figure 9). The highest values of b/hT index (6–8.4) were observed in four plots (TET, PEC, PEC2 and YAR). Out of the four plots with the highest b/hT indices, three plots were located on floodplains (YAR) or on the banks of water reservoirs (PEC and PEC2); the other plot (TET) was 12% covered with oak forest older than 150 years (Figure 2b). Four plots had intermediate b/hT index values (2–6): KAR, LIP, MOK and HOM (Figure 9). All of these plots belong to vast woodland areas. The lowest b/hT index values (less than 2) were recorded in three plots: one represented by an agricultural landscape with small, embedded forests (NES), forest on the watershed (KOZ), and forest on the high riverbank (STR) (Figure 1b). In summary, we found the lowest b/hT index in upland plots far from big rivers and in isolated forest patches surrounded by agricultural landscapes. Intermediate levels of species richness and b/hT index were recorded in the upland plots’ adjoining large forests. Conversely, the assemblages characterized by the highest species richness were associated with low amounts of anthropogenically transformed habitats in forests close to the river.
Regarding the b/hS, species-specific index, the most abundant bat species in our sample was NNO, whose b/hS index ranged from 0.343 to 5.286. For other species, we found different patterns of the distribution of the b/hS index among the plots (Figure 10a–d,f; see Supplementary Table S7 for all species and for all study plots). For example, the PAU b/hS index was highest in KOZ, which is the most remote plot from water sources and wetlands and surrounded by agricultural areas (Figure 10b). The b/hS indices of MDA (Figure 10a) and PNA (Figure 10c) were highest on the high riverbanks of water reservoirs (PEC and PEC2) and floodplain (YAR) plots. The b/hS index for PPY was rather equally distributed among the six plots with high riverbanks and floodplain oak forests (LIP, PEC, PEC2, MOK, HOM and YAR, Figure 10d). The NLE (Figure 10f) had the highest b/hS index on two plots (KAR and PEC2), one characterized by elevated oak forests within the watershed and the other one by the high riverbanks of the water reservoir.

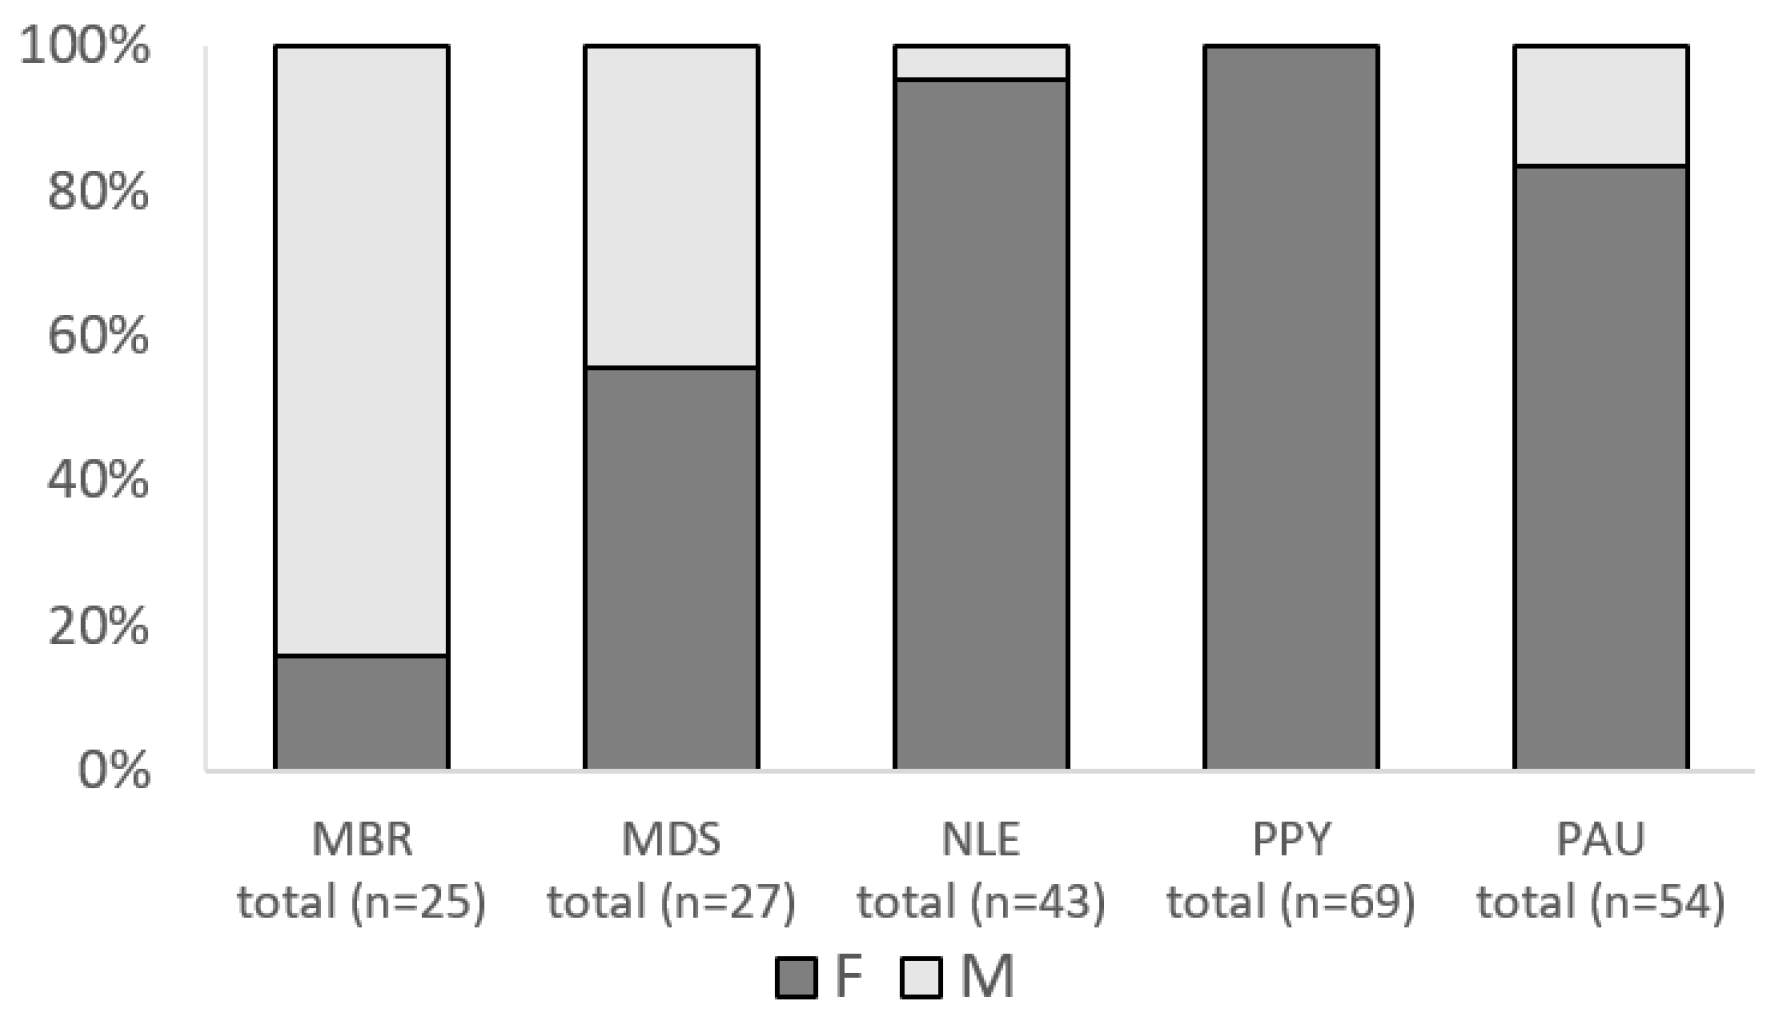
3.6. Sex Ratio and Breeding Activity of Bats

Five bat species (MDA, NNO, NLA, PPY and VMU) bred in all study plots where they were recorded (Supplementary Material Table S6). The other five species (MBR, MDS, NLE, PNA and PAU) were bred in all but one study plot out of the plots where they were found (Supplementary Material Table S6). The sex ratio of adult individuals was mostly female-dominated (Figure 11). Two long-distance migrant species in our sample were presented almost exclusively by females (PPY—100% and NLE—95.2%, Figure 11). However, another species, PNA, had an equal sex ratio (Supplementary Material, Figure S5a). Moreover, the sex ratio for each species varied among plots, for example, it ranged from 60% to 90%–95% of adult females for NNO (Supplementary Material, Figure S5b). For resident species, sex ratio ranged from male-dominated (MBR) to an equal sex ratio (MDS and MDA, Figure S5c) or to a female-dominated one (PAU, Figure 11).
On average, the breeding activity was highest for NNO and NLE, whereas the estimates for PNA, MDA and PAU were lower (Figure 12). The species differed in their sensitivity to the change in the area of different land cover types. Indeed, the breeding activity of such species as PNA, MDA and PAU changed a lot with the change in the land use areas, while others were less affected (e.g., NNO, NLE). The breeding activity of PNA and PAU significantly decreased with the area of fields (t = −3.61 and t = −2.63; Figure 12). The breeding activity of MDA significantly increased with forest area (t = 2.50), while it decreased with lake area (t = −2.50). Additionally, the breeding activity of forest species such as NLE decreased with an increase in meadow area (t = −1.84), and the breeding activities of PNA and PAU decreased with increase in the areas of floodplains (t = −1.71; t = −1.75; (Supplementary Table S8a).
With increase in the area of young forest stands (11–40 years), the breeding activity of all but NNO declined (Figure 13, Supplementary Material Table S8b). Interestingly, although increasing the areas of 41–90-year-old forests positively affected the breeding activity of most species, it still negatively affected the breeding activity of PNA (t = −2.63). Only increasing the areas of forest stands older than 91 and 150 years old significantly increased the breeding activity of PNA (t = 1.81 and t = 2.84, respectively). Besides that, PNA was the most sensitive to the areas of clear cuts. The clear cuts larger than 75 ha decreased by half the breeding activity of PNA (Figure 13). In general, increases in the area of old forests (more than 91 years) increased the breeding activity of all five analyzed species. Old forest stands larger than 400 ha increased the breeding activity of NLE (Figure 13).

4. Discussion

In this study, we investigated the drivers shaping the structure of bat assemblages in Eastern Ukrainian oak forests. We demonstrate that land cover types and, most importantly, forest age structure, play a crucial role in the breeding status of bats, their abundance and the overall composition of bat assemblages. We showed that the presence of MBR, NLE and PPY in assemblages is strongly associated with older (more than 150 years) patches of oak forests. Our study sheds new light on the ecological preferences of some species by demonstrating that PPY is more likely a forest-dwelling specialist species and not a generalist, as considered earlier. Similarly, PNA, which was earlier considered to be a generalist was, according to our findings, mostly associated with open-water habitats.

4.1. Methodology

We applied the mist-netting protocol previously standardized for an inventory of summer assemblages of forest-dwelling bats [38,51] that has been widely applied in woodlands of Ukraine and European Russia [26,41,52,53]. We did not detect a linear relationship between the number of caught individuals and either the sampling effort or the plot area, suggesting that our results are not biased by differences in the plot area and sampling efforts. Importantly, our results were not biased only at the spatial scale of our study plots, which was in a range of 200–1000 ha.
The b/hT index was applied as an indicator of bat abundance at each plot. There were different ways for calculating an index of bat abundance within the area using the number of bats in a mist-net, e.g., (i) multiplying the mist net area, the number of mist nets, hours per night and number of nights [54]; (ii) the number of bats per mist-netting hour of one standard 12 m net [55,56]; (iii) the number of bats per square meter of open mist net [57]. In our previous papers, we calculated the b/hT in another way: the total number of caught bats divided by the sum of mist-netting hours [26,38]. To the best of our knowledge, there is no single best approach for index calculation, as there are no guidelines on how to select the most appropriate index for a specific situation. Moreover, the most diverse ways to calculate bat abundance indices stem from publications focusing on the Neotropics and Tropics, with a rare exception of Europe, e.g., [58]. Such a variety of indices are likely related to the variety of bat mist-netting techniques, e.g., the material of the net tissue used, the season of mist-netting and the number of netting hours per night. In the current study, we always used the same standard mist-nets, operated in a particular season of bat life cycle and conducted mist-netting all night long [26,38].
We anticipate the b/hT index to be representative of the real bat occurrences in a particular location given that mist-netting was conducted during multiple nights, which would average out the variations due to the weather and other environmental factors. However, we suggest treating these indices carefully because the mist-nettings on different plots were performed in different years, and migratory bat assemblages display multi-year dynamics in the European part of the former Soviet Union [59]. Similarly, the number of migratory bats (Pipistrellus and Nyctalus) varied over time and decreased strongly after cold winters in wintering areas (mostly in the Balkans) [59]. Therefore, we did not statistically compare the b/hT indices from different study plots.

4.2. Structure of Bat Assemblages across Landscapes

Twelve bat species among fourteen known in the Kharkiv region (from Vespertilionidae family) were caught within our survey. Only MNA and PAS were not caught; both of them have limited distribution in the region and were known only from one location each [33,60]. At the same time, another rare species, NLA, also known from one location in the region [32] and from a few locations in the rest of Ukraine [61], was mist-netted in our study.
Local bat assemblages were dominated by long-distance migrants and forest-dwelling species. This is typical for summer bat assemblages in woodlands to the north of the steppe zone in Ukraine [32,53], European Russia [26,41] and Southern Belarus [62]. Previously, we reported that the effect of local land cover types on bat assemblages was stronger compared to the effect of latitude, by looking at Eastern European forests [26,52]. The ratio of Myotis species was higher in locations with more water bodies and was not related to the geographic latitude of the examined locations [26]. Here, we corroborate general findings by demonstrating that the structure of forest bat assemblages and species richness was strongly affected by two main factors: old forest stands, e.g., [9], and the presence of water bodies, e.g., [18,63].

4.3. Ecological Groups of Bats and Their Habitat Requirements

The association of particular species with certain land cover types mainly reflects general preferences for hunting areas, for example, insects are more likely to be found close to water bodies. At the same time, the association of a species with a particular forest age class likely represents the availability of specific roosting sites. Interestingly, with respect to the forest age structure, we found that the forest specialist PAU was mostly associated with clearcuts and younger forests in the KOZ plot. We can assume that recently created clearcuts were proper hunting habitats for this species, and at the same time plot area still had enough old forest for summer roosting, highlighting the importance of old-growth forest stands with tree cavities as hallmark habitat features [17,64]. However, we cannot exclude that this seemingly positive effect of clear cuts will severely affect the population dynamics in following years, as these ‘carry-over’ effects on long-lived species will only be visible after several generations. It is also possible that PAU used to be locally highly abundant, and recent clear cuttings have not yet negatively impacted the species at the moment of our survey, a phenomenon known as “extinction debt” [65]. The tree-roosting preferences of MBR and NLE are similar. Both species prefer crevice-like tree hollows in trunks or large branches such as those created by a lightning strike or vertical frost cracks. Additionally, MBR prefer roosts in cavities behind the tree bark e.g., [16,17,36,66,67,68]. These roosting preferences were reflected by our findings, according to which both of these species were mainly associated with the oldest forests that are required for the formation of such types of cavities. At the same time, we found NNO to be predominantly associated with mature (90–150 years) but not the oldest forests, which reflects their roosting in the tree hollows created by woodpeckers, e.g., [15], which form quicker than those required by MBR and NLE, e.g., [16,17].
The extremely rare forest-dwelling bat species NLA was also found in the study area. It was detected for the first time in the Kharkiv region in 2016, 60 years after its last record [32]. The largest European bat is also one of the rarest ones. Only a few records of this species are known in Central and Eastern Europe, with the exceptions of Spain and France, where populations of this species are still relatively abundant [69]. While it is well known that NLA is an exclusive forest-dwelling species that breeds in tree hollows [59,70] and is associated with pristine forests and swampy landscapes [26,71,72,73,74], the ecological features of this species are still poorly studied [69]. It is possible that the occurrence of NLA in the KAR plot is a remnant of the species’ historical range known from the records of 1920–1930s [61].
The preference for wetlands of MDA and MDS is mostly determined by them preying on aquatic insects [75,76]. These two species have different roosting site preferences: MDA is mostly a tree-hollow-dwelling species [76], whereas MDS is almost exclusively a house-dwelling species [36,77]. In line with MDS preferentially roosting in houses, this species was not strongly associated with any forest age category, either at the site or plot level. Generally, MDA showed broader plasticity compared with MDS. According to our results, the regional breeding core of MDS and the highest occurrence indices were found near one of the biggest water reservoirs (plots PEC and PEC2, Figure 1b) in the region (Pechenihy Reservoir, 85.2 km2). At the same time, MDS had low breeding activity and density within the natural riverbed of the Siverskyi Donets River (plots HOM and YAR). On the one hand, these results support the fact that this species is considered to prefer aquatic habitats [36,75,76]. On the other hand, MDS was classified as a boreal species with a core range in Northern European natural post-glacial lake landscapes [26,77]. However, the Pechenihy water reservoir in the Kharkiv region was created only in the early 1960s. This demonstrates that the ability of MDS to utilize aquatic human-made habitats as hunting grounds might be more critical for species distribution than roosting sites. Despite the significantly broader breeding plasticity of MDA, with regard to the distance to large water bodies, the highest densities of this species were detected within the plots located along the Siverskyi Donets River. Species density within highly human-transformed (PEC2) and lower human-modified plots corroborate studies showing correlations of abundance gradients with river flow [78] and water quality preferences [79,80].
Formerly considered as a generalist species, PNA was strongly associated with wetlands and lake habitats and old-growth forests. This species is one of the northernmost distributed long-distance migratory bats in Eastern Europe [81], inhabiting Baltic countries and South Fennoscandia [82,83]. Furthermore, it is the most common or subdominant species in forest bat assemblages north of the 50th degree of latitude [26,36,41,53]. Our habitat association analyses clearly demonstrated the relation of PNA with wetlands and lakeside habitats, corroborating other studies [18,53,84]. Indeed, although PNA was present in most of the plots, its highest occurrences were near the biggest water reservoirs (plots PEC and PEC2) and in a relatively preserved section of the river floodplain (plot YAR). Taken together, we argue that it is time to reassess the ecological requirements of PNA and include it in a group of water-associated bat species.
Rural and urban dwellers (ESE and PKU) were generally rare in our study area; however, we found a pattern of their association with settlements, in line with the previous knowledge about the habitat preferences of these species [34,43,85,86,87,88]. Boreal VMU was rare in our sample, and we did not detect a clear association of this species with any category. This is a long-distance migratory bat species that is distributed up to the polar circle [81]. The forest steppe landscapes of the Kharkiv region cover the southern margin of the breeding range of this species.
The ecological (habitat and roosting site) preferences of PPY in Eastern Europe are poorly studied. Only recently (end of the 1990s) was this species separated from a morphologically similar one, P. pipistrellus; therefore, scarce data are available regarding its habitat preference [26,34,41,89,90,91,92]. In the context of data scarcity for this species, our findings shed new light on roosting ecology of PPY in Eastern Europe. In most of the countries of Western and Central Europe, PPY is a strongly house-dwelling species that prefers mostly crevice-like shelters [92]. It uses similar roosting sites in most of the known cases in the East, e.g., [36]. However, there are records of this species roosting in sparsely distributed patches of very old oak forest of 200 years old or more. We observed PPY often roosting behind the bark of dead or decaying old oak trees (more than a meter in DBH; see the example in Supplementary Material Figure S6a–c). This roosting type was previously described for European Russia (Bilohirya Natural Reserve: [93]) and for the Kyiv metropolitan area (Holosiivskyi National Nature Park: [94]). Furthermore, PPY roosting in the same kind of tree microhabitats was recently discovered in the pristine oak forest of Belovezhskaya Pushcha National Park, Belarus [95]. These findings suggest that the use of human buildings as roosting sites is a secondary adjustment of PPY, which likely appeared due to the lack of these specific roosting trees in human-modified landscapes. To sum up, we argue for reassessing the ecological status of PPY as a forest-dwelling bat species.

4.4. Impact of Forest Management on Bat Assemblages

Our results demonstrated that, on a landscape scale, key areas associated with the highest bat species diversity include waterbodies or riverine habitats surrounded by sufficient areas of mid-aged or old forests. For most examined bat species, forests provide both foraging habitats (though with substantial microhabitat segregation) and roosting sites. It has been shown that many temperate bat species require a network of roosting sites during the summer season to switch between them [17]. The abundance of roosting microhabitats depends on forest stand age class, which is expressed as mean tree DBH [9,96,97,98], and on the density of woodpeckers—the main cavity providers—which has an upper limit due to their territoriality [99]. Therefore, we argue that the large area of old forests (more than 91 years old) is critical to support the diversity of forest-dwelling specialists, e.g., [100,101]. In other words, only large mature forests can provide a sufficient amount and diversity of roosting sites to support rich bat assemblages.
Clear cuts create spatial heterogeneity and favor woodland edge specialists [102], but the presence of clear cuts and young plantations comes at the cost of mature forests, which are rich in roosting sites and foraging conditions for forest specialists. In our case, the plot (KOZ) with the highest presence of clear cuts (11.2% of total area) and young stands (9.2%), associated with few mature and old stands (8.3% in total), had the lowest species diversity and bat abundance index.
We conclude that, under the current extensive plantation clear-cut silvicultural model that is used for multispecies broadleaved forests in the region, the best management approach must include two main points: (i) mature or old forests must dominate in forested landscapes across the region, and (ii) the share of clear cuts and young plantations within the scale of 1000–10,000 ha must not exceed 10%–15% of the total forest area. The highest conservation attention must be paid to woodlands with riverine habitats and water bodies.
In the face of possible future management intensification, the first point of attention may include reserving all overmature (old) patches as set-asides and implementing measures to ensure higher microhabitat and spatial heterogeneity for the rest of the area (including retention and continuous-cover approaches). These methods are in line with the triad approach in silviculture [103,104].
On a local level, practical and rapid bat conservation action will be to establish a National Nature Park in Pechynigy Forest (plots PEC and PEC2), which hosts the highest bat abundance in the region [26,41].

5. Conclusions

We used a standardized mist-netting approach to understand how breeding and the abundance of bats, as well as their diversity, are affected by land cover types and the age of forest stands on eleven plots of oak forests in Eastern Ukraine. We demonstrated the critical importance of old forest patches (more than 91 years) for forest-dwelling specialist bats (MBR, NLE and PPY). Furthermore, we highlighted the importance of artificial water reservoirs and pristine sections of the riverbed for water-associated species (MDA, MDS and PNA). The only species that tolerated the clear cuts was PAU, given that the patches of old forest were present within the plot. We showed that the studied plot with the highest areas of clear cuts and young stands and a few patches of mature and old stands had the lowest bat diversity and abundance.
We proposed the reassessment of the ecological group status of two bat species (PNA and PPY) for Eastern European terrains. However, we also call for further surveys in this part of Europe to investigate the habitat preferences of PNA and the selection of roosting sites by PPY and MBR in pristine old forests more closely.
From a practical point of view, we recommend: (i) managing old forests in a way for the future domination of mature forests in woodland landscapes across the region, (ii) not exceeding the share of clearcuts and young plantations by 10%–15% of the total forested area (within the scale of 1000–10 000 ha) and (iii) establishing a strictly protected area in the forest area (plots PEC and PEC2) with the highest bat abundance in the region.

Supplementary Materials

The following supporting information can be downloaded at: https://www.mdpi.com/article/10.3390/f13101732/s1, Table S1: Classification of bats from Vespertilionidae family inhabiting Kharkiv region into different ecological groups, migratory status and summer roost-site selection. Table S2: Results of the rarefaction analysis for all studied plots. Table S3: (a) Effect of habitat variables on species richness; (b) Effect of forest age variables on species richness. Table S4: (a) Effect of habitat variables on the number of individuals; (b) Effect of forest age variables on the number of individuals. Table S5: (a) Land cover types and RDA ANOVA summary model table; (b) Forest age RDA ANOVA summary model table. Table S6: Breeding status for each bat species within the study plots. Table S7: The variability of b/hs index by all studied plots. Table S8: (a) Effect of habitat variables on breeding activity; (b) Effect of forest age variables on breeding activity. Figure S1: Detailed map of land cover types of study plots. Figure S2: (a) Habitat correlation before merging; (b) Habitat correlation after merging several habitats. Figure S3: Results of redundancy analysis revealing the relationship between the areas of different land cover types and assemblage structure at the plot level. Figure S4: (a) Visualization of GLMM results revealing the relationship between the land cover types and number of individuals at the mist-netting site level; (b) Visualization of GLMM results revealing the relationship between the forest age structure and number of individuals at the mist-netting site level. Figure S5: (a) Sex ratio of P. nathusii (PNA) calculated using the total sample of all adult individuals and for each of 4 plots with more than 10 individuals; (b) Sex ratio of N. noctula (NNO) calculated using the total sample of all adult individuals and for each of 9 plots with more than 10 individuals; (c) Sex ratio of M. daubentonii (MDA) calculated using the total sample of all adult individuals and for each of 3 plots with more than 10 individuals. Figure S6: (a)–(c): Roosting tree of numerous colony of P. pygmaeus and P. nathusii. File S1: Vlaschenko et all Supplimentary FP 20221012.

Author Contributions

Field data collection, A.V., K.K., Y.Y. and V.H.; formal analysis and conceptualization, A.V., K.K. and Y.Y.; project idea and administration, A.V. and Y.Y.; data curation and analysis, A.V., K.K., Y.Y. and V.R.; visualization and writing the first draft, A.V., K.K., Y.Y. and V.R.; writing—review and editing, A.V., K.K., Y.Y., V.R. and S.K.-S. All authors have read and agreed to the published version of the manuscript.

Funding

Fieldwork was supported by two projects from the Rufford Foundation (RF) (UK): the project 10155-1 “The International Year of Forests in the Northeastern Ukraine: establishing of long-term program on forest biodiversity conservation” (2012) and “Conservation of Sensitive Forest-Dwelling Animals in Oak Forests of Eastern Ukraine” (2017), and by the project supported by The Youth Activity Fund of the Explorers Club (2016) “Searching for birth-place: determination of connection between summer and winter locations of threatened bat populations”. Finalizing the manuscript during the active phase of Russian–Ukrainian war (February–September 2022) was possible due to a special short-term scholarship (April–June) provided by the Leibniz Institute for Zoo and Wildlife Research (Leibniz-IZW), the intermediate data analysis was completed in 2018 during the research stay of A.V. at the Leibniz-IZW.

Institutional Review Board Statement

Not applicable.

Informed Consent Statement

Not applicable.

Data Availability Statement

All data analyzed during this study are included in Supplementary Materials.

Acknowledgments

We are grateful to our friends and colleagues: Alona Prylutska, Olexander Klochko, Illa Romanenko, Oleh Prylutsky, Maryna Kharyakova, Maria Sudakova, Maryna Kryvokhyza, Hanna Suvorova, Natalya Shanuk, Yury Chayka, Oleksiy Parfilov, Iryna Yatsiuk, Olha Timofieieva, and Olena Rodenko for fieldwork assistance in different periods of the research. Our special thanks to Viktor Kovalov and Marharyta Moiseienko for their significant contribution to the data analyses and preliminary discussion of the results.

Conflicts of Interest

The authors declare no conflict of interest.

References

  1. Food and Agriculture Organization of the United Nations. The State of the World’s Forests 2020: Forests, Biodiversity and People; FAO and UNEP: Rome, Italy, 2020. [Google Scholar]
  2. Forest Europe. State of Europe’s Forests 2020; Forest Europe: Oslo, Norway, 2020; p. 392. [Google Scholar]
  3. Keenan, R.J.; Reams, G.A.; Achard, F.; de Freitas, J.V.; Grainger, V.A.; Lindquist, E. Dynamics of global forest area: Results from the FAO Global Forest Resources Assessment 2015. For. Ecol. Manag. 2015, 352, 9–20. [Google Scholar] [CrossRef]
  4. Song, X.P.; Hansen, M.C.; Stehman, S.V.; Potapov, P.V.; Tyukavina, A.; Vermote, E.F.; Townshend, J.R. Global land change from 1982 to 2016. Nature 2018, 560, 639–643. [Google Scholar] [CrossRef] [PubMed]
  5. Sabatini, F.; Bluhm, H.; Kun, Z.; Aksenov, D.; Atauri, J.; Kuemmerle, T. European primary forest database v2.0. Sci. Data 2021, 8, 220. [Google Scholar] [CrossRef]
  6. Paillet, Y.; Bergés, L.; Hjältén, J.; Ódor, P.; Avon, C.; Bernhardt-Römermann, M.; Bijlsma, R.-J.; de Bruyn, L.; Fuhr, M.; Grandin, U.; et al. Biodiversity differences between managed and unmanaged forests: Meta-analysis of species richness in Europe. Conserv. Biol. 2010, 24, 101–112. [Google Scholar] [CrossRef]
  7. Pawson, S.M.; Brockerhoff, E.G.; Norton, D.A.; Didham, R.K. Clear-fell harvest impacts on biodiversity: Past research and the search for harvest size thresholds. Can. J. For. Res. 2006, 36, 1035–1046. [Google Scholar] [CrossRef]
  8. Fuller, R.J.; Robles, H. Conservation Strategies and Habitat Management for European Forest Birds. In Ecology and Conservation of Forest Birds; Mikusiński, G., Roberge, J.-M., Fuller, R.J., Eds.; Cambridge University Press: Cambridge, UK, 2018; pp. 455–507. [Google Scholar]
  9. Russo, D.; Billington, G.; Bontadina, F.; Dekker, J.; Dietz, M.; Gazaryan, S.; Jones, G.; Meschede, A.; Rebelo, H.; Reiter, G.; et al. Identifying Key Research Objectives to Make European Forests Greener for Bats. Front. Ecol. Evol. 2016, 4, 87. [Google Scholar] [CrossRef] [Green Version]
  10. Law, B.; Park, K.J.; Lacki, M.J. Insectivorous bats and silviculture: Balancing timber production and bat conservation. In Bats in the Anthropocene: Conservation of Bats in a Changing World; Voigt, C.C., Kingston, T., Eds.; SpringerOpen: Cham, Switzerland; Heidelberg, Germany; New York, NY, USA; Dordrecht, The Netherlands; London, UK, 2016; pp. 105–150. [Google Scholar]
  11. Jones, G.; Jacobs, D.S.; Kunz, T.H.; Willig, M.R.; Racey, P.A. Carpe noctem: The importance of bats as bioindicators. Endang. Species Res. 2009, 8, 93–115. [Google Scholar] [CrossRef] [Green Version]
  12. Russo, D.; Jones, G. Bats as bioindicators. Mamm. Biol. 2015, 80, 157–246. [Google Scholar] [CrossRef] [Green Version]
  13. Russo, D.; Cistrone, L.; Garonna, A.P.; Jones, G. Reconsidering the importance of harvested forests for the conservation of tree-dwelling bats. Biodivers. Conserv. 2010, 9, 2501–2515. [Google Scholar] [CrossRef]
  14. Ruczyński, I.; Nicholls, B.; MacLeod, C.D.; Racey, P.A. Selection of roosting habitats by Nyctalus noctula and Nyctalus leisleri in Białowieża Forest—An adaptive response to forest management? For. Ecol. Manag. 2010, 259, 1633–1641. [Google Scholar] [CrossRef]
  15. Vlaschenko, A. Roost sites of Noctule bat (Nyctalus noctula Schreber, 1774) on the territory of Gomolsha forest. J. V. N. Karazin Kharkiv. Natl. Univ. Ser. Biol. 2005, 1, 122–133, (In Russian with English summary). [Google Scholar]
  16. Ruczynski, I.; Bogdanowicz, W. Roost cavity selection by Nyctalus noctula and N. leisleri (Vespertilionidae, Chiroptera) in BiaŁowieża Primeval Forest, eastern Poland. J. Mammal. 2005, 86, 921–930. [Google Scholar] [CrossRef]
  17. Boye, P.; Dietz, M. Development of good practical guidelines for woodland management for bats. eNRR 2005, 661, 1–89. [Google Scholar]
  18. Salvarina, I. Bats and aquatic habitats: A review of habitat use and anthropogenic impacts. Mammal Rev. 2016, 46, 131–143. [Google Scholar] [CrossRef]
  19. Blakey, R.V.; Law, B.S.; Straka, T.M.; Kingsford, R.T.; Milne, D.J. Importance of wetlands to bats on a dry continent: A review and meta-analysis. Hystrix Ital. J. Mammal. 2018, 29, 41–52. [Google Scholar]
  20. Meyer, C.F.J.; Aguiar, L.M.S.; Aguirre, L.F.; Baumgarten, J.; Clarke, F.M.; Cosson, J.F.; Villegas, S.E.; Fahr, J.; Faria, D.; Furey, N.; et al. Long-term monitoring of tropical bats for anthropogenic impact assessment: Gauging the statistical power to detect population change. Biol. Conserv. 2010, 143, 2797–2807. [Google Scholar] [CrossRef]
  21. Freudmann, A.; Mollik, P.; Tschapka, M.; Schulze, C.H. Impacts of oil palm agriculture on phyllostomid bat assemblages. Biodivers. Conserv. 2015, 24, 3583–3599. [Google Scholar] [CrossRef]
  22. Loureiro, L.O.; Gregorin, R. Structure of a bat assemblage from a fragmented landscape in the state of Minas Gerais, southeastern Brazil. Mastozool. Neotrop. 2015, 22, 35–42. [Google Scholar]
  23. Meyer, C.F.J.; Struebig, J.M.; Willig, M.R. Responses of Tropical Bats to Habitat Fragmentation, Logging, and Deforestation. In Bats in the Anthropocene: Conservation of Bats in a Changing World; Voigt, C.C., Kingston, T., Eds.; SpringerOpen: Cham, Switzerland; Heidelberg, Germany; New York, NY, USA; Dordrecht, The Netherlands; London, UK, 2016; pp. 63–103. [Google Scholar]
  24. Wordley, C.F.R.; Sankaran, M.; Mudappa, D.; Altringham, J.D. Heard but not seen: Comparing bat assemblages and study methods in a mosaic landscape in the Western Ghats of India. Ecol. Evol. 2018, 8, 3883–3894. [Google Scholar] [CrossRef]
  25. Strelkov, P.P. Breeding area and its position in range of migratory bats species in East Europe and adjacent territories Communication 1. Zool. Zhurnal 1997, 76, 1073–1082. [Google Scholar]
  26. Vlaschenko, A.; Kravchenko, K.; Prylutska, A.; Ivancheva, E.; Sitnikova, E.; Mishin, A. Structure of summer bat assemblages in forests in European Russia. Turk. J. Zool. 2016, 40, 876–893. [Google Scholar] [CrossRef]
  27. Olson, D.M.; Dinerstein, E.; Wikramanayake, E.D.; Burgess, N.D.; Powell, G.V.N.; Underwood, E.C.; D’Amico, J.A.; Itoua, I.; Strand, H.E.; Morrison, J.C.; et al. Terrestrial ecoregions of the world: A new map of life on earth. BioScience 2001, 51, 933–938. [Google Scholar] [CrossRef]
  28. Golikov, A.P.; Kazakova, N.A.; Shuba, M.B. Kharkov Region: Regional Development, Current and Perspectives; V.N. Karazin Kharkiv National University Press: Kharkiv, Ukraine, 2011. (In Russian) [Google Scholar]
  29. Kuemmerle, T.; Kaplan, J.O.; Prishchepov, A.V.; Rylsky, I.; Chaskovskyy, O.; Tikunov, V.S.; Müller, D. Forest transitions in Eastern Europe and their effects on carbon budgets. Glob. Change Biol. 2015, 21, 3049–3061. [Google Scholar] [CrossRef] [PubMed]
  30. Global Forest Watch. Available online: www.globalforestwatch.org (accessed on 18 December 2021).
  31. Vlaschenko, A.S. Research history and list of records of bats (Chiroptera) in the Kharkov Region in the XIX and XX centuries. Plecotus 2011, 14, 26–54, (In Russian with English summary). [Google Scholar]
  32. Kovalov, V.; Hukov, V.; Rodenko, O. New record of Nyctalus lasiopterus (Schreber, 1780) in Ukraine with a new confirmation of carnivory. North-Weast. J. Zool. 2019, 15, 91–95. [Google Scholar]
  33. Vlaschenko, A.S.; Naglov, A.V. A Marl Open Pit as a Unique Place of Bats (Chiroptera) Inhabiting. Vest Zool. 2005, 39, 94. [Google Scholar]
  34. Vlaschenko, A.; Yatsiuk, Y.; Hukov, V.; Prylutska, A.; Straka, T.; Kravchenko, K. Urban forest preserves local bat species diversity, but not forest-dweller specialists—Renewed study 65 years later (Kharkiv city, Ukraine). Mammal Res. 2021, 66, 615–626. [Google Scholar] [CrossRef]
  35. Vlaschenko, A. Biogeocenological Role of Bats (Mammalia, Chiroptera) on the South Part of Forest-Steppe Zone. Ph.D. Thesis, V.N. Karazin Kharkiv National University, Kharkiv, Ukraine, 2006. (In Russian with English summary). [Google Scholar]
  36. Strelkov, P.; Il’in, V. Bats (Chiroptera, Vespertilionidae) of the Southern Central and Lower Volga Region. Tr. Zool. Inst. Akad Nauk SSSR 1990, 225, 42–167. (In Russian) [Google Scholar]
  37. Dietz, C.; Kiefer, A. Die Fledermäuse Europas: Kennen, Bestimmen, Schützen; Kosmos VerlagKosmos: Stuttgart, Germany, 2014. [Google Scholar]
  38. Gukasova, A.; Vlaschenko, A. Effectiveness of mist-netting of bats (Chiroptera, Mammalia) during the non-hibernation period in oak forests of Eastern Ukraine. Acta Zool. Crac. Verterbrata 2011, 54, 77–93. [Google Scholar] [CrossRef]
  39. Vlaschenko, A.S.; Gukasova, A.S. Bat (Chiroptera) fauna and structure of assemblage of projecting protected area “Yaremovskoe” (Kharkov region). Nat. Reserves Ukr. 2010, 16, 44–50, (In Russian with English summary). [Google Scholar]
  40. Vlaschenko, A.; Hukov, V.; Naglov, A.; Prylutska, A.; Kravchenko, K.; Rodenko, O. Contribution to ecology of Brandt’s Bat, Myotis brandtii (Chiroptera, Vespertilionidae), in the North-eastern Ukraine: Comparison of local summer and winter bat assemblages. Vest. Zool. 2016, 50, 231–240. [Google Scholar] [CrossRef] [Green Version]
  41. Gukasova, A.; Vlaschenko, A.; Kosenkov, G.; Kravchenko, K. Fauna and structure of bat (Chiroptera) assemblage of the National Park ‘Smolensk Lakeland’, western Russia. Acta Zool. Litu. 2011, 21, 173–180. [Google Scholar] [CrossRef] [Green Version]
  42. Kunz, T.H.; Hodgkison, R.; Weise, C.D. Methods of capturing and handling bats. In Ecological and Behavioral Methods for the Study of Bats, 2nd ed.; Kunz, T., Parsons, S., Eds.; Johns Hopkins University Press: Baltimore, MD, USA, 2009; pp. 3–35. [Google Scholar]
  43. Kravchenko, K.; Vlaschenko, A.; Prylutska, A.; Rodenko, O.; Hukov, V.; Shuvaev, V. Year-round monitoring of bat records in an urban area: Kharkiv (NE Ukraine), 2013, as a case study. Turk. J. Zool. 2017, 41, 530–548. [Google Scholar] [CrossRef]
  44. Sikes, R.S. The Animal Care and Use Committee of the American Society of Mammalogists. Guidelines of the American Society of Mammalogists for the use of wild mammals in research and education. J. Mammal. 2016, 97, 663–688. [Google Scholar] [CrossRef] [PubMed]
  45. Quantum GIS Development Team. QGIS Geographic Information System; QGIS 2.18.11 2.18.11 Version; Open Source Geospatial Foundation Project: Beaverton, OR, USA, 2016; Available online: https://qgis.osgeo.org (accessed on 1 January 2020).
  46. R Core Team. R: A Language and Environment for Statistical Computing; R Foundation for Statistical Computing: Vienna, Austria, 2021; Available online: https://www.R-project.org (accessed on 1 May 2022).
  47. Hsiech, T.C.; Ma, K.H.; Chao, A. iNEXT: An R package for rarefaction and extrapolation of species diversity (Hill numbers). Methods Ecol. Evol. 2016, 7, 1451–1456. [Google Scholar] [CrossRef]
  48. Legendre, P.; Legendre, L. Numerical Ecology, 3rd ed.; Elsevier: Amsterdam, The Netherlands, 2012; 990p. [Google Scholar]
  49. Oksanen, J.; Blanchet, F.G.; Friendly, M.; Kindt, R.; Legendre, P.; McGlinn, D.; Minchin, P.R.; O’Hara, R.B.; Gavin, L.; Solymos, S.P.; et al. Vegan: Community Ecology Package. R Package Version 2.5-7. 2020. Available online: https://CRAN.R-project.org/package=vegan (accessed on 1 May 2022).
  50. Rousset, F.; Ferdy, J.-B. Testing environmental and genetic effects in the presence of spatial autocorrelation. Ecography J. 2014, 37, 781–790. [Google Scholar] [CrossRef]
  51. Vlaschenko, A.S.; Gukasova, A.S. Development of method for the inventory of species composition and population structure of Chiroptera. Nat. Reserves Ukr. 2009, 15, 49–57. (In Russian) [Google Scholar]
  52. Prylutska, A.S. Summer Population of Bats in Forests of Central Part of East European Plain: Inventory and Monitoring Using mist Nets. Ph.D. Thesis, Schmalhausen Institute of Zoology, National Academy of Sciences of Ukraine, Kyiv, Ukraine, 2014. (In Russian with English summary). [Google Scholar]
  53. Gashchak, S.P.; Vlaschenko, A.S.; Naglov, A.V.; Kravchenko, K.O.; Gukasova, A.S. Bat fauna of the Exclusion Zone in concern of assessment of environmental value of its areas. Prob. Chernobyl. Exclusion Zone 2013, 11, 56–78, (In Russian with English summary). [Google Scholar]
  54. Zeppelini, C.G.; Rego, K.M.C.; Lopez, L.C.S. Bats in settlements from an atlantic forest area in northeastern Brazil. Papéis Avulsos De Zool. 2017, 57, 405–411. [Google Scholar] [CrossRef] [Green Version]
  55. Rocha, R.; Ferreira, D.F.; López-Baucells, A.; Farneda, F.Z.; Carreiras, J.M.B.; Palmeirim, J.M.; Meyer, C.F.J. Does sex matter? Gender-specific responses to forest fragmentation in Neotropical bats. Biotropica 2017, 47, 259–263. [Google Scholar] [CrossRef] [Green Version]
  56. Rocha, R.; Ovaskainen, O.; López-Baucells, A.; Farneda, F.Z.; Sampaio, F.M.; Bobrowiec, P.E.D.; Cabeza, M.; Jorge, M.; Palmeirim, J.M.; Meyer, C.F.J. Secondary forest regeneration benefits old-growth specialist bats in a fragmented tropical landscape. Sci. Rep. 2018, 8, 3819. [Google Scholar] [CrossRef] [PubMed]
  57. Shapiro, J.; Bordignon, M. Bat (Chiroptera) assemblages in three Cerrado fragments of Mato Grosso do Sul, southwestern Brazil. Check List 2014, 10, 1380–1386. [Google Scholar] [CrossRef]
  58. Dietz, M.; Pir, J.D. Distribution and habitat selection of Myotis bechsteinii in Luxembourg: Implications for forest management and conservation. Fol. Zool. 2009, 58, 327–340. [Google Scholar]
  59. Panutin, K.K. Bats. In Results of Mammals Banding; Kucheruk, V.V., Ed.; Nauka; USSR: Moscow, Russia, 1980; pp. 23–46, (In Russian with English summary). [Google Scholar]
  60. Vlaschenko, A.; Hukov, V.; Timofieieva, O.; Moiseienko, M.; Domanska, A.; Zinenko, O.; Prylutska, A. Leaping on urban islands: Further summer and winter range expansion of European bat species. Ukrainian Bat Rehabilitation Center, Kharkiv, Ukraine. Mammalia 2022. submitted. [Google Scholar]
  61. Vlaschenko, A.; Gashchak, S.; Gukasova, A.; Naglov, A. New record and current status of Nyctalus lasiopterus (Schreber, 1780) (Chiroptera: Vespertilionidae) in Ukraine. Lynx N. Praha 2010, 41, 209–216. [Google Scholar]
  62. Dombrovski, V.; Fenchuk, V.; Fenchuk, V.; Zhurauliou, D. The bat fauna (Mammalia, Chiroptera) of Stary Zhaden Zakaznik, Southern Belarus. Proc. Theriol. Sch. 2017, 15, 3–97. [Google Scholar] [CrossRef]
  63. Salvarina, I.; Gravier, D.; Rothhaupt, K.O. Seasonal bat activity related to insect emergence at three temperate lakes. Ecol. Evol. 2018, 8, 3738–3750. [Google Scholar] [CrossRef] [Green Version]
  64. Starik, N.; Göttert, T.; Zeller, U. Spatial Behavior and Habitat Use of Two Sympatric Bat Species. Animals 2021, 11, 3460. [Google Scholar] [CrossRef]
  65. Figueiredo, L.; Krauss, J.; Steffan-Dewenter, I.; Cabral, J.S. Understanding extinction debts: Spatio–temporal scales, mechanisms and a roadmap for future research. Ecography 2019, 42, 1973–1990. [Google Scholar] [CrossRef] [Green Version]
  66. Vlaschenko, A. Current status of Leisler’s bat (Chiroptera) on the territory of Kharkov region. Visnyk Lviv. Univ. Biol. Ser. 2009, 51, 145–156, (In Ukrainian with English summary). [Google Scholar]
  67. Dombrovski, V. Maternity colonies of Myotis brandtii in the Polesie State Radiation-Ecological Reserve. Theriol. Ukr. 2018, 16, 91–94. [Google Scholar] [CrossRef] [Green Version]
  68. Boston, E.S.M.; Dechmann, D.K.N.; Ruczynski, I. Leisler’s Noctule Nyctalus leisleri (Kuhl, 1817). In Handbook of the Mammals of Europe; Hackländer, K., Zachos, F.E., Eds.; Springer Nature: Cham, Switzerland, 2020; pp. 1–15. [Google Scholar]
  69. Alcaldé, J.; Juste, J.; Paunović, M. Nyctalus lasiopterus. The IUCN Red List of Threatened Species. 2016. e.T14918A22015318. Available online: https://www.iucnredlist.org/species/14918/22015318 (accessed on 30 May 2022).
  70. Estók, P. Present status of a rare bat species, Nyctalus lasiopterus (Schreber, 1780), in Hungary. Hystrix Ital. J. Mammal. 2011, 22, 99–104. [Google Scholar]
  71. Dombrovski, V.; Fenchuk, V.; Zhurauliou, D. New occurrence and the first breeding record of Nyctalus lasiopterus in Belarus. Vespertilio 2016, 18, 55–59. [Google Scholar]
  72. Vasenkov, D.A.; Golovina, G.A.; Sidorchuk, N.V. The first registration of Greater noctule (Nyctalus lasiopterus) in Vladimir region. Plecotus 2016, 19, 32–36, (In Russian with English summary). [Google Scholar]
  73. Naďo, L.; Lőbbová, D.; Hapl, E.; Ceľuch, M.; Uhrin, M.; Šara, M.; Kaňuch, P. Highly selective roosting of the Giant Noctule Bat and its astonishing foraging activity by GPS tracking in a mountain environment. Mammal Res. 2019, 64, 587–594. [Google Scholar] [CrossRef]
  74. Popa-Lisseanu, A.G.; Bontadina, F.; Ibáñez, C. Giant noctule bats face conflicting constraints between roosting and foraging in a fragmented and heterogeneous landscape. J. Zool. 2009, 278, 126–133. [Google Scholar] [CrossRef]
  75. Krüger, F.; Clare, E.L.; Greif, S.; Siemers, B.M.; Symondson, W.O.; Sommer, R.S. An integrative approach to detect subtle trophic niche differentiation in the sympatric trawling bat species Myotis dasycneme and Myotis daubentonii. Mol. Ecol. 2014, 23, 3657–3671. [Google Scholar] [CrossRef]
  76. Encarnacao, J.A.; Backer, N.I. Daubenton’s Bat Myotis daubentonii (Kuhl, 1817). In Handbook of the Mammals of Europe; Hackländer, K., Zachos, F.E., Eds.; Springer Nature: Switzerland, Switzerland, 2020; pp. 1–31. [Google Scholar]
  77. Ciechanowski, M.; Zapart, A.; Kokurewicz, T.; Rusiński, M.; Lazarus, M. Habitat selection of the pond bat Myotis dasycneme during pregnancy and lactation in Northern Poland. J. Mammal. 2017, 98, 232–245. [Google Scholar] [CrossRef] [Green Version]
  78. Dietz, M.; Encarnacao, J.A.; Kalko, E. Small scale distribution patterns of female and male Daubenton’s bats (Myotis daubentonii). Acta Chir. 2006, 8, 403–415. [Google Scholar] [CrossRef]
  79. Abbott, I.M.; Sleeman, D.P.; Harrison, S. Bat activity affected by sewage effluent in Irish rivers. Biol. Con. 2009, 142, 2904–2914. [Google Scholar] [CrossRef]
  80. Langton, S.D.; Briggs, P.A.; Haysom, K.A. Daubenton’s bat distribution along rivers—Developing and testing a predictive model. Aquatic Conserv. Mar. Freshw. Ecosyst. 2010, 20, 45–54. [Google Scholar] [CrossRef]
  81. Bogdarina, S.V.; Strelkov, P.P. Distribution of Chiroptera in northern European Russia. Plecotus 2003, 6, 7–28, (In Russian with English summary). [Google Scholar]
  82. Blomberg, A.S.; Vasko, V.; Salonen, S.; Pētersons, G.; Lilley, T.M. First record of a Nathusius’ pipistrelle (Pipistrellus nathusii) overwintering at a latitude above 60° N. Mammalia 2020, 85, 74–78. [Google Scholar] [CrossRef]
  83. Tidenberg, E.M.; Liukko, U.M.; Stjernberg, T. Atlas of Finnish bats. Ann. Zool. Fenn. 2019, 56, 207–250. [Google Scholar] [CrossRef] [Green Version]
  84. Flaquer, C.; Puig-Montserrat, X.; Goiti, U.; Vidal, F.; Curco, A.; Russo, D. Habitat selection in Nathusius’ pipistrelle (Pipistrellus nathusii): The importance of wetlands. Acta Chir. 2009, 11, 149–155. [Google Scholar] [CrossRef]
  85. Ancillotto, L.; Tomassini, A.; Russo, D. The fancy city life: Kuhl’s pipistrelle, Pipistrellus kuhlii, benefits from urbanisation. Wildl. Res. 2016, 42, 598–606. [Google Scholar] [CrossRef]
  86. Maxinová, E.; Kipson, M.; Naďo, L.; Hradická, P.; Uhrin, M. Foraging Strategy of Kuhl’s Pipistrelle at the Northern Edge of the Species Distribution. Acta Chir. 2016, 18, 215–222. [Google Scholar] [CrossRef]
  87. Bilushenko, A.A. The Current Status of Kuhl’s Pipistrelle, Pipistrellus kuhlii (Chiroptera, Vespertilionidae), in the Central Forest-Steppe of Ukraine. Vest. Zool. 2013, 47, 343–349. [Google Scholar] [CrossRef] [Green Version]
  88. Hukov, V.; Timofieieva, O.; Prylutska, A.; Rodenko, O.; Moiseienko, M.; Bohodist, V.; Domanska, A.; Vlaschenko, A. Wintering of an urban bat (Pipistrellus kuhlii lepidus) in recently occupied areas. Eur. J. Ecol. 2020, 6, 102–120. [Google Scholar] [CrossRef]
  89. Kruskop, S.V. On distribution of pipistrelles from Pipistrellus pipistrellus/pygmaeus complex (Chiroptera, Vespertilionidae) in Russia. Plecotus 2007, 10, 36–46, (In Russian with English summary). [Google Scholar]
  90. Godlevska, L.V.; Shpak, A.V. Bats in the collection of the Zoological museum of Belarusian State University. Proc. Natl. Acad. Sci. Belarus. Biol. Ser. 2020, 65, 412–420, (In Russian with English abstract). [Google Scholar] [CrossRef]
  91. Godlevska, L.; Rebrov, S. Bats of the Left-Bank Dnipro Region in the northern part of Ukraine. Theriol. Ukr. 2018, 16, 25–50, (In Ukrainian with English abstract). [Google Scholar] [CrossRef] [Green Version]
  92. Jones, G.; Froidevaux, J.S.P. Soprano Pipistrelle Pipistrellus pygmaeus (Leach, 1825). In Handbook of the Mammals of Europe; Hackländer, K., Zachos, F.E., Eds.; Springer Nature: Switzerland, Switzerland, 2020; pp. 1–25. [Google Scholar]
  93. Petrov, O.V. Mammals of the “Forest on Vorskla” forestry and its environs. Uch. App. Leningr. State Univ. Ser. Biol. Sciences. Integr. Res. For.-Steppe Oak For. For. Vorskla 1971, 52, 127–132. (In Russian) [Google Scholar]
  94. Vlaschenko, A.S.; Godlevska, L.V.; Kravchenko, K.O.; Tyshchenko, V.M.; Gukasova, A.S.; Sudakova, M.V. Contribution to bat fauna of Holosiyivsky National Nature Park. Nat. Reserves Ukraine 2012, 18, 51–58, (In Russian with English abstract). [Google Scholar]
  95. Dietz, M.; Brombacher, M.; Erasmy, M.; Fenchuk, V.; Simon, O. Bat community and roost site selection of tree-dwelling bats in a well-preserved European lowland forest. Acta Chir. 2018, 20, 117–127. [Google Scholar] [CrossRef]
  96. Asbeck, T.; Pyttel, P.; Bauhus, F.L. Predicting abundance and diversity of tree-related microhabitats in Central European montane forests from common forest attributes. For. Ecol. Manag. 2019, 432, 400–408. [Google Scholar] [CrossRef]
  97. Crampton, H.L.; Barclay, R. Selection of Roosting and Foraging Habitat by Bats in Different-Aged Aspen Mixedwood Stands. Conserv. Biol. 1998, 12, 1347–1358. [Google Scholar] [CrossRef]
  98. Kalcounis-Rüppell, C.M.; Psyllakis, M.J.; Brigham, R.M. Tree Roost Selection by Bats: An Empirical Synthesis Using Meta-Analysis. Wildl. Soc. Bull. 2005, 33, 1123–1132. [Google Scholar] [CrossRef]
  99. Wesołowski, T.; Martin, K. Tree holes and hole nesting birds in European and North American forests. In Ecology and Conservation of Forest Birds; Mikusiński, G., Roberge, J.-M., Fuller, R.J., Eds.; Cambridge University Press: Cambridge, UK, 2018; pp. 79–133. [Google Scholar]
  100. Lesinski, G.; Kowalski, M.; Wojtowicz, B.; Gulatowska, J.; Lisowska, A. Bats on forest islands of different size in an agricultural landscape. Folia Zool. 2007, 56, 153–161. [Google Scholar]
  101. de Jong, J. Habitat use and species richness of bats in a patchy landscape. Acta Theriol. 1995, 40, 237–248. [Google Scholar] [CrossRef] [Green Version]
  102. Quine, C.P. The Curious Case of the Even-aged Plantation: Wretched, Funereal or Misunderstood? In Europe’s Changing Woods and Forests: From Wildwood to Managed Landscapes; Kirby, K., Watkins, C., Eds.; CABI: Wallingford, UK, 2015; pp. 207–223. [Google Scholar]
  103. Paquette, A.; Messier, C. The role of plantations in managing the world’s forests in the Anthropocene. Front. Ecol. Environ. 2010, 8, 27–34. [Google Scholar] [CrossRef] [Green Version]
  104. Himes, A.; Betts, M.; Messier, C.; Seymour, R. Perspectives: Thirty years of triad forestry, a critical clarification of theory and recommendations for implementation and testing. For. Ecol. Manag. 2022, 510, 120103. [Google Scholar] [CrossRef]
Figure 1. (a) Ecoregions of Ukraine and the location of the Kharkiv region (indicated by crossed-lines mesh). CEMF—Central European mixed forests; CMF—Carpathian montane forests; CSFC—Crimean submediterranean forest complex; EEFS—East European forest steppe; PMF—Pannonian mixed forests; PS—Pontic steppe; white lines—main rivers in Ukraine. (b) Locations of study plots in the Kharkiv region (Oblast); 1–11—study plots; 1—Koziyivka (KOZ); 2—Karavan (KAR); 3—Liptsy (LIP); 4—Neskuchne (NES); 5—Starytsia (STR); 6—Tetleha (TET); 7—Pechenihy (PEC); 8—Pechenihy2 (PEC2); 9—Mokhnach (MOK); 10—Homil’sha (HOM); 11—Yaremivka (YAR).
Forests 13 01732 g001aForests 13 01732 g001b
Figure 2. (a) Areas of originally distinguished land cover types in study plots (for abbreviations of study plots, see Table 1). (b) Areas of originally distinguished forest types and ages in study plots (for abbreviations of study plots, see Table 1): clearcut—clear cuttings; conif—coniferous forest; decid—deciduous forest; 10–40, 41–90, 91–150, >151—ranges of forest age (years), see Section 2.5.2.
Forests 13 01732 g002
Figure 3. (a) Numbers of different bat species in each study plot. (b) The ratio of bat species from different ecological groups by study plots. WA—water-associated; FD—forest-dwelling specialists; G—generalists; URD—urban- and rural-dwellers.
Forests 13 01732 g003
Figure 4. Results of redundancy analysis revealing the relationship between the areas of different land cover types and assemblage structure at the site level. (a) Overlay of samples (at each mist-netting site) and species shown by grey arrows and orange 3-letter bat species abbreviations. (b) Overlay of species shown with grey arrows and land cover types shown in green–blue: forest, lake, meadow, field and floodplain.
Forests 13 01732 g004
Figure 5. Results of redundancy analysis revealing the relationship between the forest age and assemblage structure at the site level. (a) Overlay of samples (at each site) and forest age classes shown in green–blue: clearcut, decid_11_40, decid_41_90, decid_91_150 and decid_more150. (b) Overlay of species shown with grey arrows and orange 3-letter species abbreviations and forest age classes shown in green–blue.
Forests 13 01732 g005
Figure 6. Results of redundancy analysis revealing the relationship between the forest age and assemblage structure at the plot level. (a) Overlay of samples (at each plot) and forest age classes shown in green–blue: clearcut, decid_11_40, decid_41_90, decid_91_150, decid_more150. (b) Overlay of species shown with gray arrows and orange 3-letter species abbreviations and forest age classes shown in green–blue.
Forests 13 01732 g006
Figure 7. Visualizations of GLMM results revealing the relationships (solid line) between the land cover types (in hectares) and species richness at the mist-netting site level (dots): (a) Lake area, (b) Forest area, (c) Field area, (d) Meadow area, (e) Floodplain area.
Forests 13 01732 g007
Figure 8. Visualizations of GLMM results revealing the relationships (solid line) between the forest age (in hectares) and species richness at the mist-netting site level (dots): (a) Forest area 11–40 years, (b) Forest area 41–90 years, (c) Forest area 91–150 years, (d) Forest area older than 150 years, (e) Clear-cut area.
Forests 13 01732 g008
Figure 9. The variability of b/hT index (bats per hour) by different study plots; outliers for HOM—23.2, and YAR—42, not shown on the figure; “x”—average; “-”—median; dots—each night of mist-netting.
Forests 13 01732 g009
Figure 10. The variability of b/hS index between different study plots for six most abundant bat species ((a)–(f)—species name). “×” denotes average; “—” median; dots—each night of mist-netting. Some outliers are not shown in the figure: (a) YAR—7.5; (d) MOK—5.2, HOM—3.5, and YAR—4.6; (e) HOM—16.7 and YAR—26.6; (f) PEC2—3.8.
Forests 13 01732 g010
Figure 11. Sex ratio of five bat species calculated using the total sample of adult individuals.
Forests 13 01732 g011
Figure 12. The probability of breeding activity of the five selected bat species as a function of the area of different land cover types. The solid lines represent predicted effects of the area of respective land cover types, with the shaded regions reflecting 95% CI.
Forests 13 01732 g012
Figure 13. The probability of breeding activity of the five selected bat species as a function of the area of three forest age classes. See legend to Figure 12 for further details.
Forests 13 01732 g013
Table 1. Characteristics of the study plots and research efforts (MN hours—total mist-netting hours; MN points—number of mist-netting sites; Individuals—total number of caught individuals).
Names, Acronyms and Total Area (ha)Coordinates, Field Work Period and Plot Number According to Figure 1bLand Cover TypesResearch EffortManagement Type
(According to IUCN Protected Area Categories)
Koziyivka
KOZ
759.1
50°07′30″ N
35°05′04″ E
27 June–2 July 2012
1
Deciduous upland forest far from big rivers and in the vicinity of water bodies MN hours—88;
MN sites—13;
Bat species—3;
Individuals—39.
Managed forest; the local Forest Authority held FSC FM certificate in 2008.
Natural Monuments or Feature “Koziyivska 1” and “Koziyivska 2” (IUCN category III); total area 8.1 ha; restriction of clear cutting.
Karavan
KAR
491.8
50°02′48″ N
36°06′16″ E
15–19 July
2018
2
Deciduous upland forest on a bank of water reservoirMN hours—63;
MN sites—9;
Bat species—7;
Individuals—239.
Managed forest.
Liptsy
LIP
221.2
50°12′40″ N
36°22′23″ E
8–13 July 2016
3
Deciduous upland forest on a bank of water reservoirMN hours—64.75;
MN sites—9;
Bat species—6;
Individuals—168.
Managed forest.
Neskuchne
NES
478.6
50°12′06″ N
36°32′19″ E
27 July–1 August 2012
4
Two small, isolated patches of deciduous forest within an agricultural landscape MN hours—58;
MN sites—8;
Bat species—6;
Individuals—105.
Managed forest, only selection cuttings.
Starytsia
STR
1067.8
50°13′19″ N
36°49′37″ E
25–29 July
2018
5
Large deciduous upland forest at the right bank of the main river in the regionMN hours—62;
MN sites—8;
Bat species—6;
Individuals—110.
Managed forest; “Kholodnoyarske” habitat management area (IUCN category IV); 10 ha; minor restrictions of forest management.
Tetleha
TET
496.7
49°54′58″ N
36°43′02″ E
5–10 July 2012
6
Large deciduous upland forest with big rivers and water bodies in the vicinity MN hours—54.75;
MN sites—9;
Bat species—8;
Individuals—328.
Managed forest.
“Kochetotsky forest” habitat management area (IUCN category IV); 240 ha; minor restrictions of forest management.
Pechenihy
PEC
681.6
49°57′01″ N
36°51′59″ E
10–15 July 2012
7
Large deciduous upland forest at the right bank of the large artificial water reservoirMN hours—39.75;
MN sites—8;
Bat species—7;
Individuals—358.
Managed forest.
“Pechenizky forest” habitat management area (IUCN category IV); 358 ha; minor restrictions of forest management.
Pechenihy2
PEC2
1031.9
49°54′25″ N
36°56′14″ E
11–15 July
2018
8
Large deciduous upland forest at the right bank of the large artificial water reservoirMN hours—64;
MN sites—9;
Bat species—9;
Individuals—514.
Managed forest; “Pechenizky forest” habitat management area (IUCN category IV); 1031.9 ha; minor restrictions of forest management.
Mokhnach
MOK
813.6
49°45′25″ N
36°32′32″ E
18–24 July 2012
9
Large deciduous upland forest at the right bank of the main river in the regionMN hours—75.75;
MN sites—11;
Bat species—8;
Individuals—186.
Managed forest;
“Mokhnachansky” and “Serednyodonetsky” habitat management areas; (IUCN category IV); 701 ha; restriction of clear cutting.
Homil′sha
HOM
575.8
49°37′10″ N
36°19′32″ E
two cycles
2–10 & 11–20 July 2011
10
Large deciduous upland forest at the right bank of the main river in the regionMN hours—130.75;
MN sites—9 (double);
Bat species—10;
Individuals—545.
Protected area; National Nature Park (IUCN category II) since 2004; 567 ha; complete restriction of clear and selective cuttings since 2007.
Yaremivka
YAR
550.9
49°06′38″ N
37°25′00″ E
two cycles
4–11 & 12–19 July 2009
11
Floodplain deciduous woodland at the left bank of the main river in the regionMN hours—101.5;
MN sites—8 (double);
Bat species—10;
Individuals—660.
Managed forest, but under private protection; restriction of clear cuttings and limitation of selective cuttings.
Publisher’s Note: MDPI stays neutral with regard to jurisdictional claims in published maps and institutional affiliations.

