Article

Drought Resistance Evaluation of Casuarina equisetifolia Half-Sib Families at the Seedling Stage and the Response of Five NAC Genes to Drought Stress

1
Forestry College, Fujian Agriculture and Forestry University, Fuzhou 350002, China
2
Fujian Academy of Forestry Sciences, Fuzhou 350012, China
3
Fuzhou Forestry Administration, Fuzhou 350007, China
*
Authors to whom correspondence should be addressed.
Forests 2022, 13(12), 2037; https://doi.org/10.3390/f13122037
Submission received: 22 October 2022 / Revised: 23 November 2022 / Accepted: 24 November 2022 / Published: 30 November 2022
(This article belongs to the Special Issue Stress Resistance and Genetic Improvement of Forest Trees)

Abstract

:
Casuarina equisetifolia (L.) is an indispensable tree species in the construction of the backbone of the shelterbelt system in subtropical coastal regions, as it can resist wind, sand, drought, and salt. Under global warming and water shortage, it is important to clarify the mechanisms through which C. equisetifolia adapts to drought stress and to breed drought-resistant varieties in order to enhance the ecological protection provided by coastal shelterbelts. Here, we aimed to explore the response characteristics of C. equisetifolia to drought stress and investigate the associations of NAC genes with drought resistance. Seedlings of 16 half-sib C. equisetifolia families were subjected to drought treatment. Seedling growth, morphology, physiological and biochemical indices, and drought resistance were comprehensively evaluated. The drought-resistant families designated 4-383, 3-80, 3-265, 3-224, and 1-195 were selected using multiple indices and methods. Correlation and structural equation model analyses revealed that CCG007578 might regulate growth and osmoprotection in C. equisetifolia while CCG028838 and CCG004029 may scavenge reactive oxygen species. The correlation and structural equation model analyses of seedling height growth ( Δ H), survival rate (S), malondialdehyde (MDA), superoxide dismutase (SOD), and CCG007578 expression were used to identify drought resistance in C. equisetifolia. The aforementioned drought-resistant families provide basic materials for future research on genes encoding drought-resistance proteins and the molecular breeding of drought-resistant C. equisetifolia.

1. Introduction

Drought is one of the most frequent and serious naturally occurring disasters in China [1]. Drought patterns in China have substantially changed in response to global warming and water shortages. Han et al. [2] analyzed daily temperature and precipitation data compiled by 527 weather stations in northern and southern China over 54 y and found that the range of the drought area has expanded southward. Cai et al. [3] studied the evolution of drought and flooding in the southeastern coastal areas of China over the past 524 y and concluded that the dry period there will persist until the second half of the 21st century. The dynamics of drought occurrence seasonally change under the synergistic influences of the land, ocean, and atmosphere in the Fujian coastal areas. In spring and summer, typhoons and warm and humid air currents from the southwest result in abundant precipitation [4]. In contrast, rainfall sharply decreases in autumn and winter in response to the winter monsoon circulation, the rain-shadow effect of Taiwan Province, and the lack of terrestrial dynamic lifting conditions in coastal areas [5]. The narrow pipe effect of the Taiwan Strait creates strong winds in the coastal areas [6], increases soil water evaporation and plant evapotranspiration, and causes drought in the Fujian coastal areas for ~3 mo.
Casuarina equisetifolia is an indispensable tree species used to construct the backbone of the shelterbelt system in subtropical coastal regions. It has good resistance to wind, sand, drought, and salt [7]. The artificial C. equisetifolia forest in China covers an area of >300,000 ha [8]. Among them, Fujian Province has built a C. equisetifolia protective forest belt of length >3000 km and area >20,000 ha spanning six coastal cities for coastal protection [9]. Over the past 20 y, however, the seedlings used in C. equisetifolia plantations have been propagated mainly from the twigs of plants in hydroponically cultivated second-generation forests consisting of a few clonal varieties such as “Minping 2”, “Hui 1”, and “C. equisetifolia Yue 501” [10]. However, the physiological age of the propagules has been advancing. Hence, C. equisetifolia currently has relatively shorter growth cycles and prematurely enters senescence [11]. Moreover, there are relatively few varieties of C. equisetifolia and there have been steep declines in the growth potential, preservation rate, and drought resistance of this species in the shelterbelts of the Fujian coastal areas [12]. Furthermore, the coastal land is sandy and porous, has a poor water-holding capacity (WHC) [13], and cannot supply sufficient water for the normal growth and development of C. equisetifolia during the drought season. Drought has become a major abiotic stress factor impeding the protective function of the C. equisetifolia shelterbelt in the coastal, sandy area of Fujian.
The ecological protection provided by the coastal shelterbelts could be enhanced by clarifying the mechanisms by which C. equisetifolia adapts to drought stress and by breeding drought-resistant varieties. In plants, drought resistance is the functional adaptability to drought stress, and it is controlled by several different factors and mechanisms [14]. Previous studies have used plant growth and development, morphology, and physiological and biochemical indices to identify drought resistance in C. equisetifolia [15,16]. They showed that this species had superior drought tolerance compared with its congenerics C. glauca, C. cunninghamiana, and C. junghuhniana. The genome of C. equisetifolia has been mapped and published [17], and drought resistance in this species was preliminarily explored at the molecular level. NAC transcription factor (TF)-coding genes represent a large gene family in plants and are key to the drought stress response of plants [18]. The NAC TFs perform specific functions through specific promoter cis-acting elements [19], such as scavenging peroxide in plants [20] and regulating the expression of stress-related genes [21]. In our previous study, we found that NAC TFs may be related to the ability of C. equisetifolia to respond to drought stress (data not yet published). In this study, half-sib families of C. equisetifolia were subjected to drought stress, and the changes in growth, morphology, physiological and biochemical indexes, and NAC TFs expression in the tested families were analyzed. The response mechanism of C. equisetifolia to drought stress was discussed from a multidimensional scale, and drought-resistant families were preliminarily selected. We focused on the following two aspects: (1) the multidimensional response mechanism of C. equisetifolia to drought stress and (2) the regulatory pathway that might be affected by the five NAC TFs in the drought resistance of C. equisetifolia.

2. Materials and Methods

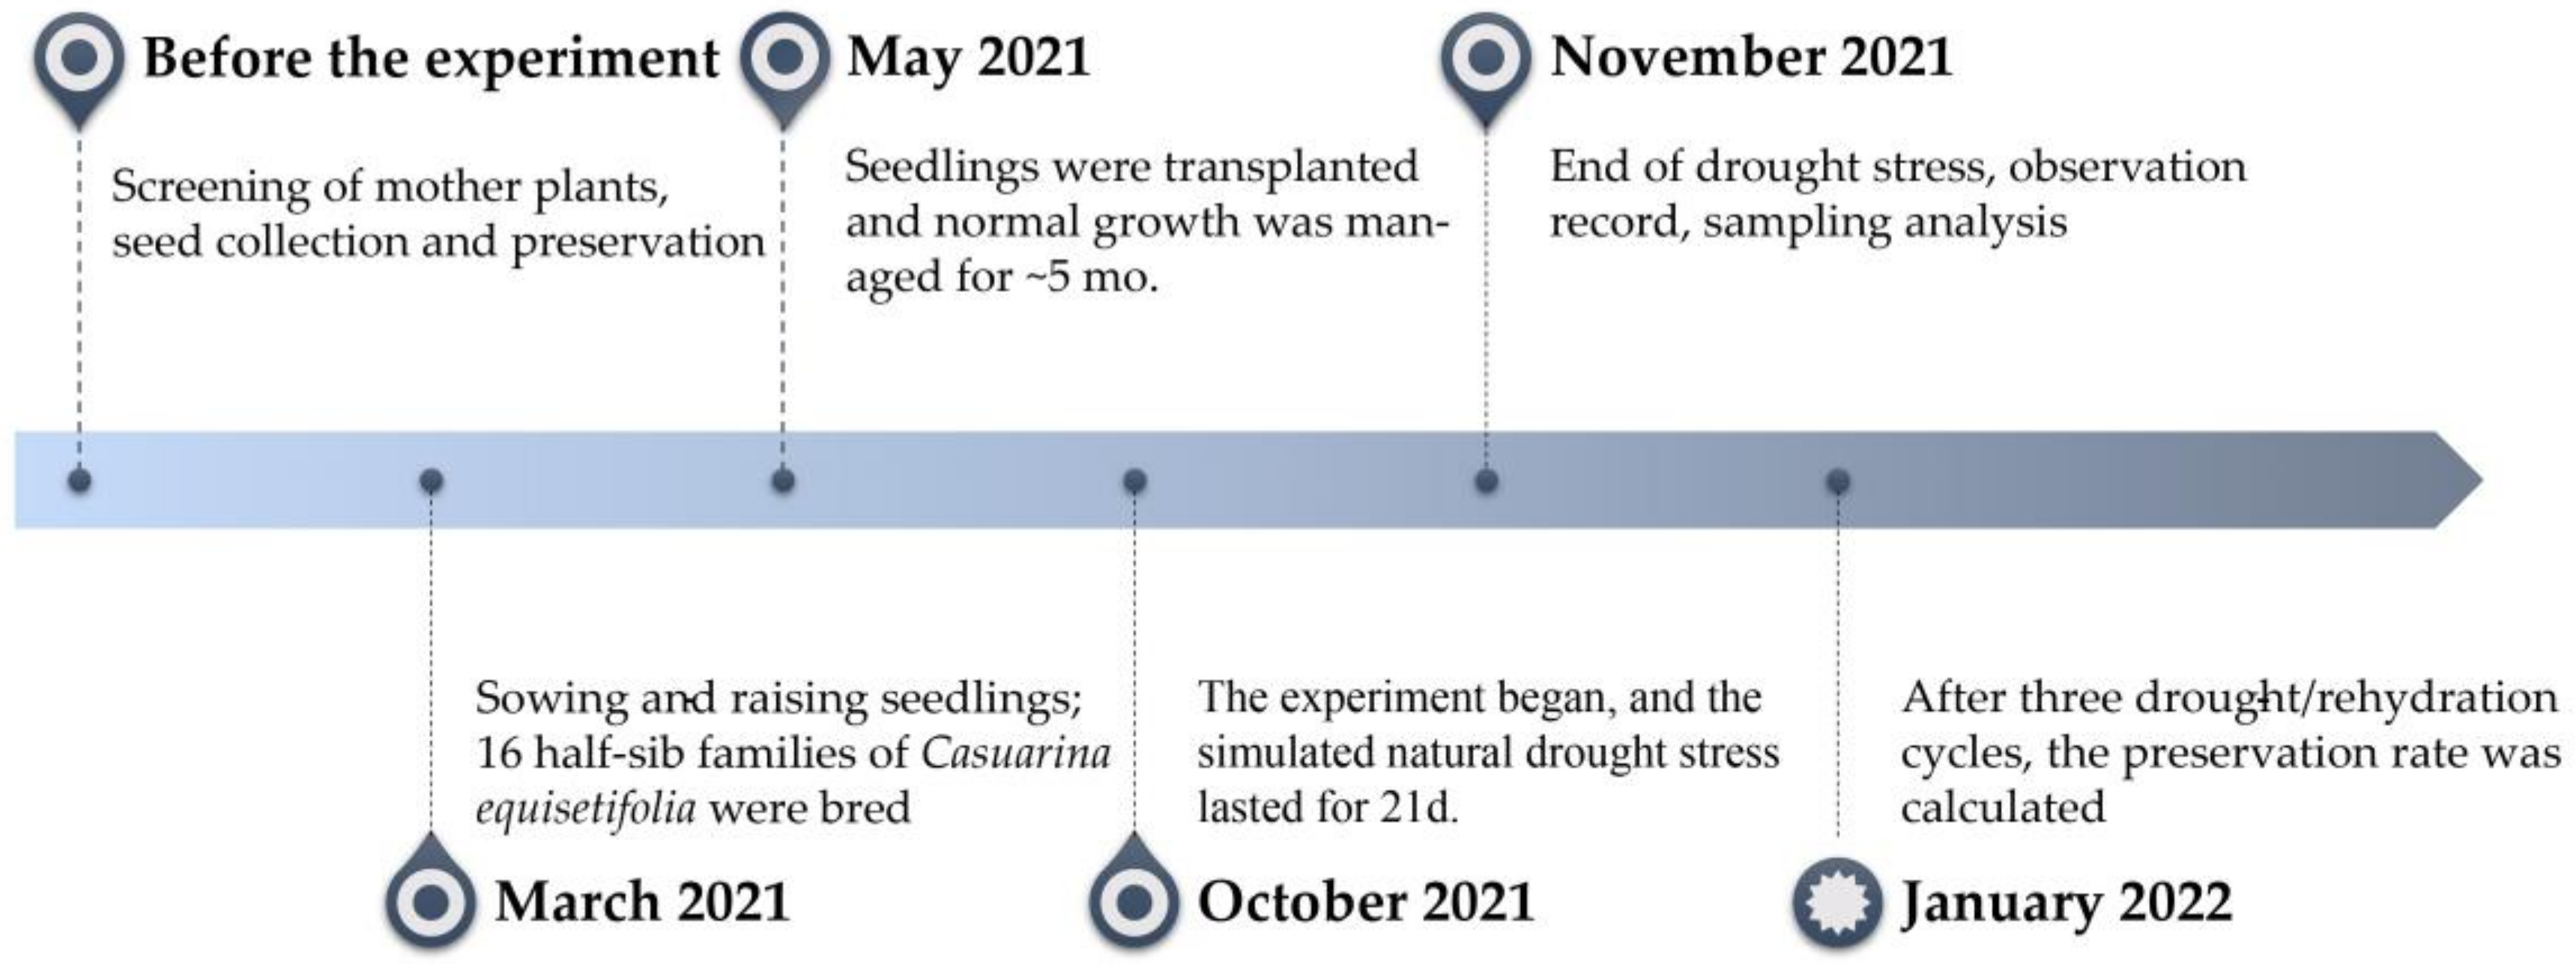
2.1. Test Materials and Design

2.1.1. Mother Plant Screening

The direct observation method was used to analyze the growth status of a 5 y C. equisetifolia international provenance test forest in Chihu State-Owned Forest Farm (118°54′29″ E, 24°54′45″ N) in Hui‘an, Fujian Province, China. Mother plants with optimal tree height, diameter at breast height (DBH) growth, and health status were selected, and their seeds were collected and planted during the fruiting period.

2.1.2. Sowing and Raising Seedlings

In March 2021, the preserved seeds were planted, and the seedlings were subsequently raised in the forest farm nursery. Sixteen half-sib C. equisetifolia families were cultivated. In May 2021, seedlings of height ~10 cm were selected and transplanted into plastic cultivation pots. There were 120 pots per family. The dimensions of each pot were as follows: top diameter = 220 mm, bottom diameter = 180 mm, height = 225 mm, tray diameter = 220 mm, and volume = 7 L. The potting medium was sandy soil collected from the international provenance C. equisetifolia test forest. The sandy soil was first evenly mixed and sieved to remove gravel, weeds, litter, plant residues, and roots. The field water holding capacity (WHC) of the substrate was 25.59%, pH was 6.21, total carbon content was 8.325 g·kg−1, total nitrogen content was 0.640 g·kg−1, total phosphorus content was 0.377 g·kg−1, and total potassium content was 23.90 g·kg−1. After transplanting, routine cultivation and management were conducted for 5 mo [22].

2.1.3. Stress Experiment

The initial seedling height (Hinitial) of each of the tested seedlings was recorded. All plastic cultivation pots were then moved into a greenhouse to conduct a simulated natural drought stress test. A randomized complete block design was adopted and consisted of four blocks and 16 families per block. Each family was arranged into six rows of 30 pots per row, and the pots were divided into the drought stress test group (DT) and the other untreated control (CK). Water supply was interrupted in the former whereas the latter received a normal water supply. The simulated natural drought stress experiment was conducted for 21 d, and then the wilting status and seedling heights (Hultimate) were measured and recorded.

2.1.4. Root Sampling

Five DT and CK seedlings of the same height were selected from each family in each block and their roots were sampled. Each plastic cultivation pot was gently shaken to separate the root system from the substrate and the entire seedling was gently removed from the pot by holding the stem at the base. The root surfaces were quickly rinsed with a wash bottle containing deionized water and blotted dry with filter paper. Young living roots were then excised with a pair of sterilized surgical scissors. Root samples from five seedlings in the same block and under the same treatment were pooled as a biological replicate, and there were four replicates in total. One part of each replicate was stored on dry ice whereas the other was flash-frozen in liquid nitrogen for 3 min and then stored on dry ice. The samples were then labelled, packed in an incubator, returned to the laboratory, and stored in an ultralow-temperature freezer at −80 °C.

2.1.5. Observation and Statistics

The remaining seedlings were rehydrated, and their survival rates (S) were determined after 7 d. Drought stress was then resumed on the remaining seedlings as previously described until the third drought/rehydration cycle was completed. Seedling preservation rates (P) were then determined. The experimental process was showned in Figure 1.

2.2. Index Measurements

2.2.1. Determination of Substrate Field Water Holding Capacity (WHC), pH, and Nutrient Content

Field water holding capacity was measured using the ring knife method [23]. pH was measured using potentiometry (water: soil = 2.5:1.0) (PH16; Yeasen Biotechnology, Shanghai, China). Total soil carbon and nitrogen were determined using an element analyzer (Vario EL III; Elementar Analysensysteme GmbH, Langenselbold, Germany). Total phosphorus and total potassium were determined using Inductively Coupled Plasma Mass Spectrometry (NEXION 300X; Perkin Elmer, MA, USA).

2.2.2. Determination of Growth and Morphological Indices

Seedling   height   growth   ( Δ H ) = H ultimate H initial
Wilting degree was evaluated and calculated by the method of Xu et al. [24]. The wilting degrees were as follows: Grade 0 (healthy); Grade 1 (< 1/2 of all twigs wilted); Grade 2 (1/2 of all twigs wilted); Grade 3 (> 1/2 of all twigs wilted); Grade 4 (entire plant wilted or dead). The wilting degree was calculated as follows:
W = i = 1 n Φ i × N i Φ m a x × N
where W is the wilting degree, Φ i is the ith wilting grade, N i is the number of wilting plants per ith family, Φ m a x is the highest level of wilting, and N is the total number of plants.
Survival rate was calculated as follows:
S / % = x i X i × 100
where S is the survival rate, x i is the number of surviving seedlings in the ith family after the first drought/rehydration cycle, and X i is the number of living seedlings in the ith family after root sampling.
Preservation rate was calculated as follows:
P / % = m i X i × 100
where P is the preservation rate, m i is the number of surviving seedlings in the ith family after the third drought/rehydration cycle, and X i is the number of surviving seedlings in the ith family after root sampling.

2.2.3. Determination of Physiological and Biochemical Indices

Malondialdehyde (MDA), superoxide dismutase (SOD), proline (Pro), glutathione (GSH), and ascorbic acid (AsA) levels in C. equisetifolia roots were determined using the respective test kits from Fuzhou Dubaite Biotechnology Co., Ltd. (Fuzhou, China) according to the manufacturer’s instructions.

2.2.4. Determination of Relative NAC Gene Expression Levels

The total RNA was extracted from the tender C. equisetifolia roots. RNA purity and concentration were determined using 1.2% agarose gel electrophoresis and UV spectrophotometry (P-330-31-1; Implen, MUC, Germany). The RNA was extracted using a plant total RNA kit (No. DP441; Tiangen Biotech, Beijing, China) and reverse-transcribed into cDNA using a cDNA synthesis kit (No. 11141ES60; Yeasen Biotechnology, Shanghai, China). The qRT-PCR was conducted on an Agilent-Mx3005P Real-Time Fluorescence PCR instrument (Agilent Technologies, Santa Clara, CA, USA) with the HieffTM qPCR SYBR Green Master Mix (No. 11202ES08; Yeasen Biotechnology, Shanghai, China).
The total volume of the reaction mixture was 20 μL, and the amplification procedure was showned in Table 1.
EF1α was the internal reference gene [25]. There were four biological replicates per experiment. The 2−ΔΔCt method was used to quantify gene expression. Oligo v. 7 (oligo.net) was used to design the primers which were synthesized by Shanghai Boshan Company (Shanghai, China). The primer sequences of the five NAC genes in this study were showned in Table 2.

2.3. Data Processing and Analysis

Microsoft Excel 2020 (Microsoft Corporation, Redmond, WA, USA) was used to sort the data. SPSS v. 25.0 (IBM Corporation, Armonk, NY, USA) was used for statistical analysis. The R package voronoiTreemap [26] was used to plot the polygon tree clustering diagram. The ggplot2 [27] package in R was used to plot the differential histogram. The PerformanceAnalytics [28] package in R was used to plot the correlation analysis diagram. SPSS Amos v. 28 (IBM Corporation, Armonk, NY, USA) was used to construct the structural equation.
A paired-sample t-test was used to identify the differences between DT and CK in terms of their average indices.
The drought resistance coefficient (DC) for each measured index was calculated as follows:
DC = X i C K i
where, X i is the index value of the test group and C K i is the index value of the control group.
A principal component analysis (PCA) was performed based on the DC for each index.
Factor weight coefficient ω i was calculated using formula (6). Membership function value ( μ ( X i ) ) for each comprehensive index was calculated using Formula (7). Drought resistance measurement value (D) was calculated using Formula (8). Here, θ i is the contribution rate of the ith index in the PCA, X i is the DC of the ith index, X m i n is the minimum DC value of the ith index, and X m a x is the maximum DC value of the ith index.
ω i = θ i i = 1 n θ i
μ ( X i ) = X i X m i n X m a x X m i n
D = i = 1 n μ ( X i ) × ω i
Finally, using the D value as the variable, cluster analysis was used to cluster the tested families, and drought resistance was evaluated according to the average D value of each category.

3. Results

3.1. Measurements of Indices under Drought Stress and Normal Water Supply

Table 3 shows that the coefficient of variation (CV) of each index was in the range of 0.000–0.788. Hence, there was abundant variation which facilitated the selection of drought-resistant families. The paired-sample t-test indicated that all parameters except the GSH content significantly differed among the treatments (p < 0.05). However, all other indices very significantly differed among the treatments (p < 0.01). Thus, all selected indices were sensitive to drought stress. Compared with those of the control, all indices of the tested families changed to varying degrees after the drought stress treatment (Table 4). There were obvious differences in the DC among the families with the same indices, and the CV was in the range of 0.104–0.739.

3.2. Principal Component Analysis (PCA)

A PCA (Table 5) of the DC values of the eight indices including, namely, Δ H, W, S, MDA, SOD, Pro, GSH, and AsA, was conducted (KMO test = 0.609 and Bartlett test: p < 0.001). The cumulative contribution of the first four principal components was 81.907% and λ < 0.863. Therefore, the first four factors were extracted to classify variables with the same importance. The original indices could be converted into four independent comprehensive indices of drought resistance. S and SOD, and W and MDA had relatively higher loading on P1 and P2, respectively, and they were identified as comprehensive indices of morphology, physiology, and biochemistry. MDA and AsA had relatively higher loading on P2, and they were classified as physiological and biochemical indices. Δ H had a substantially higher loading on P4 than the other indices and it was categorized as a growth index.

3.3. Comprehensive Evaluation of Drought Resistance

The membership function method was used to calculate the four comprehensive evaluation indices selected using the PCA. The D value was calculated by combining it with the factor weight (Table 6). The cluster analysis showed that all families could be divided into three categories (Figure 2). The first category included the five families 4-383, 3-80, 3-265, 3-224, and 1-195. The second category consisted of the seven families 4-389, 6-445, 3-52, 6-207, 5-80, 4-213, and 5-398. The third category comprised the four families 6-394, 5-218, 4-128, and 5-335. The drought resistances of the three families were combined with the D value, evaluated, and analyzed. The first category was drought-resistant and the average D value = 0.675. The second category had intermediate drought tolerance and the average D value = 0.468. The third category was drought-sensitive and the average D value = 0.225.

3.4. Distribution Characteristics and Differential Analysis of Preservation Rate

As shown in Figure 3a, after three drought/rehydration stress cycles, the preservation rates of all 16 families tested varied widely (range: 25.0%–82.1%). The preservation rates of 4-383 and 3-80 were 82.1% and 80.8%, respectively. Both 6-445 and 4-213 families had a 25.0% preservation rate. The preservation rates of the different families were analyzed according to the drought resistance evaluation results listed in Table 6. The preservation rate of the families increased in the following order: drought-sensitive < intermediate drought tolerance < drought-resistance. The differential analysis (Figure 3b) revealed that the preservation rates of drought-resistant families were significantly higher than those for intermediate drought tolerance and drought-sensitive families. However, the difference in preservation rate between the intermediate drought tolerance and drought-sensitive families was not significant.

3.5. DC of Relative NAC Gene Expression

In our previous study, we found that certain NAC genes in C. equisetifolia may be related to drought stress including CCG003077, CCG028838, CCG004029, CCG007578, and CCG007885 (data not yet published). In the present study, we verified the foregoing genes using qRT-PCR (Figure 4). The drought resistance coefficients of relative expression of CCG003077, CCG028838, and CCG007885 were the highest for the 5-80 family (9.784, 1.006, and 5.471, respectively). The drought resistance coefficient of the relative expression of CCG004029 in the 1-195 family was relatively high.

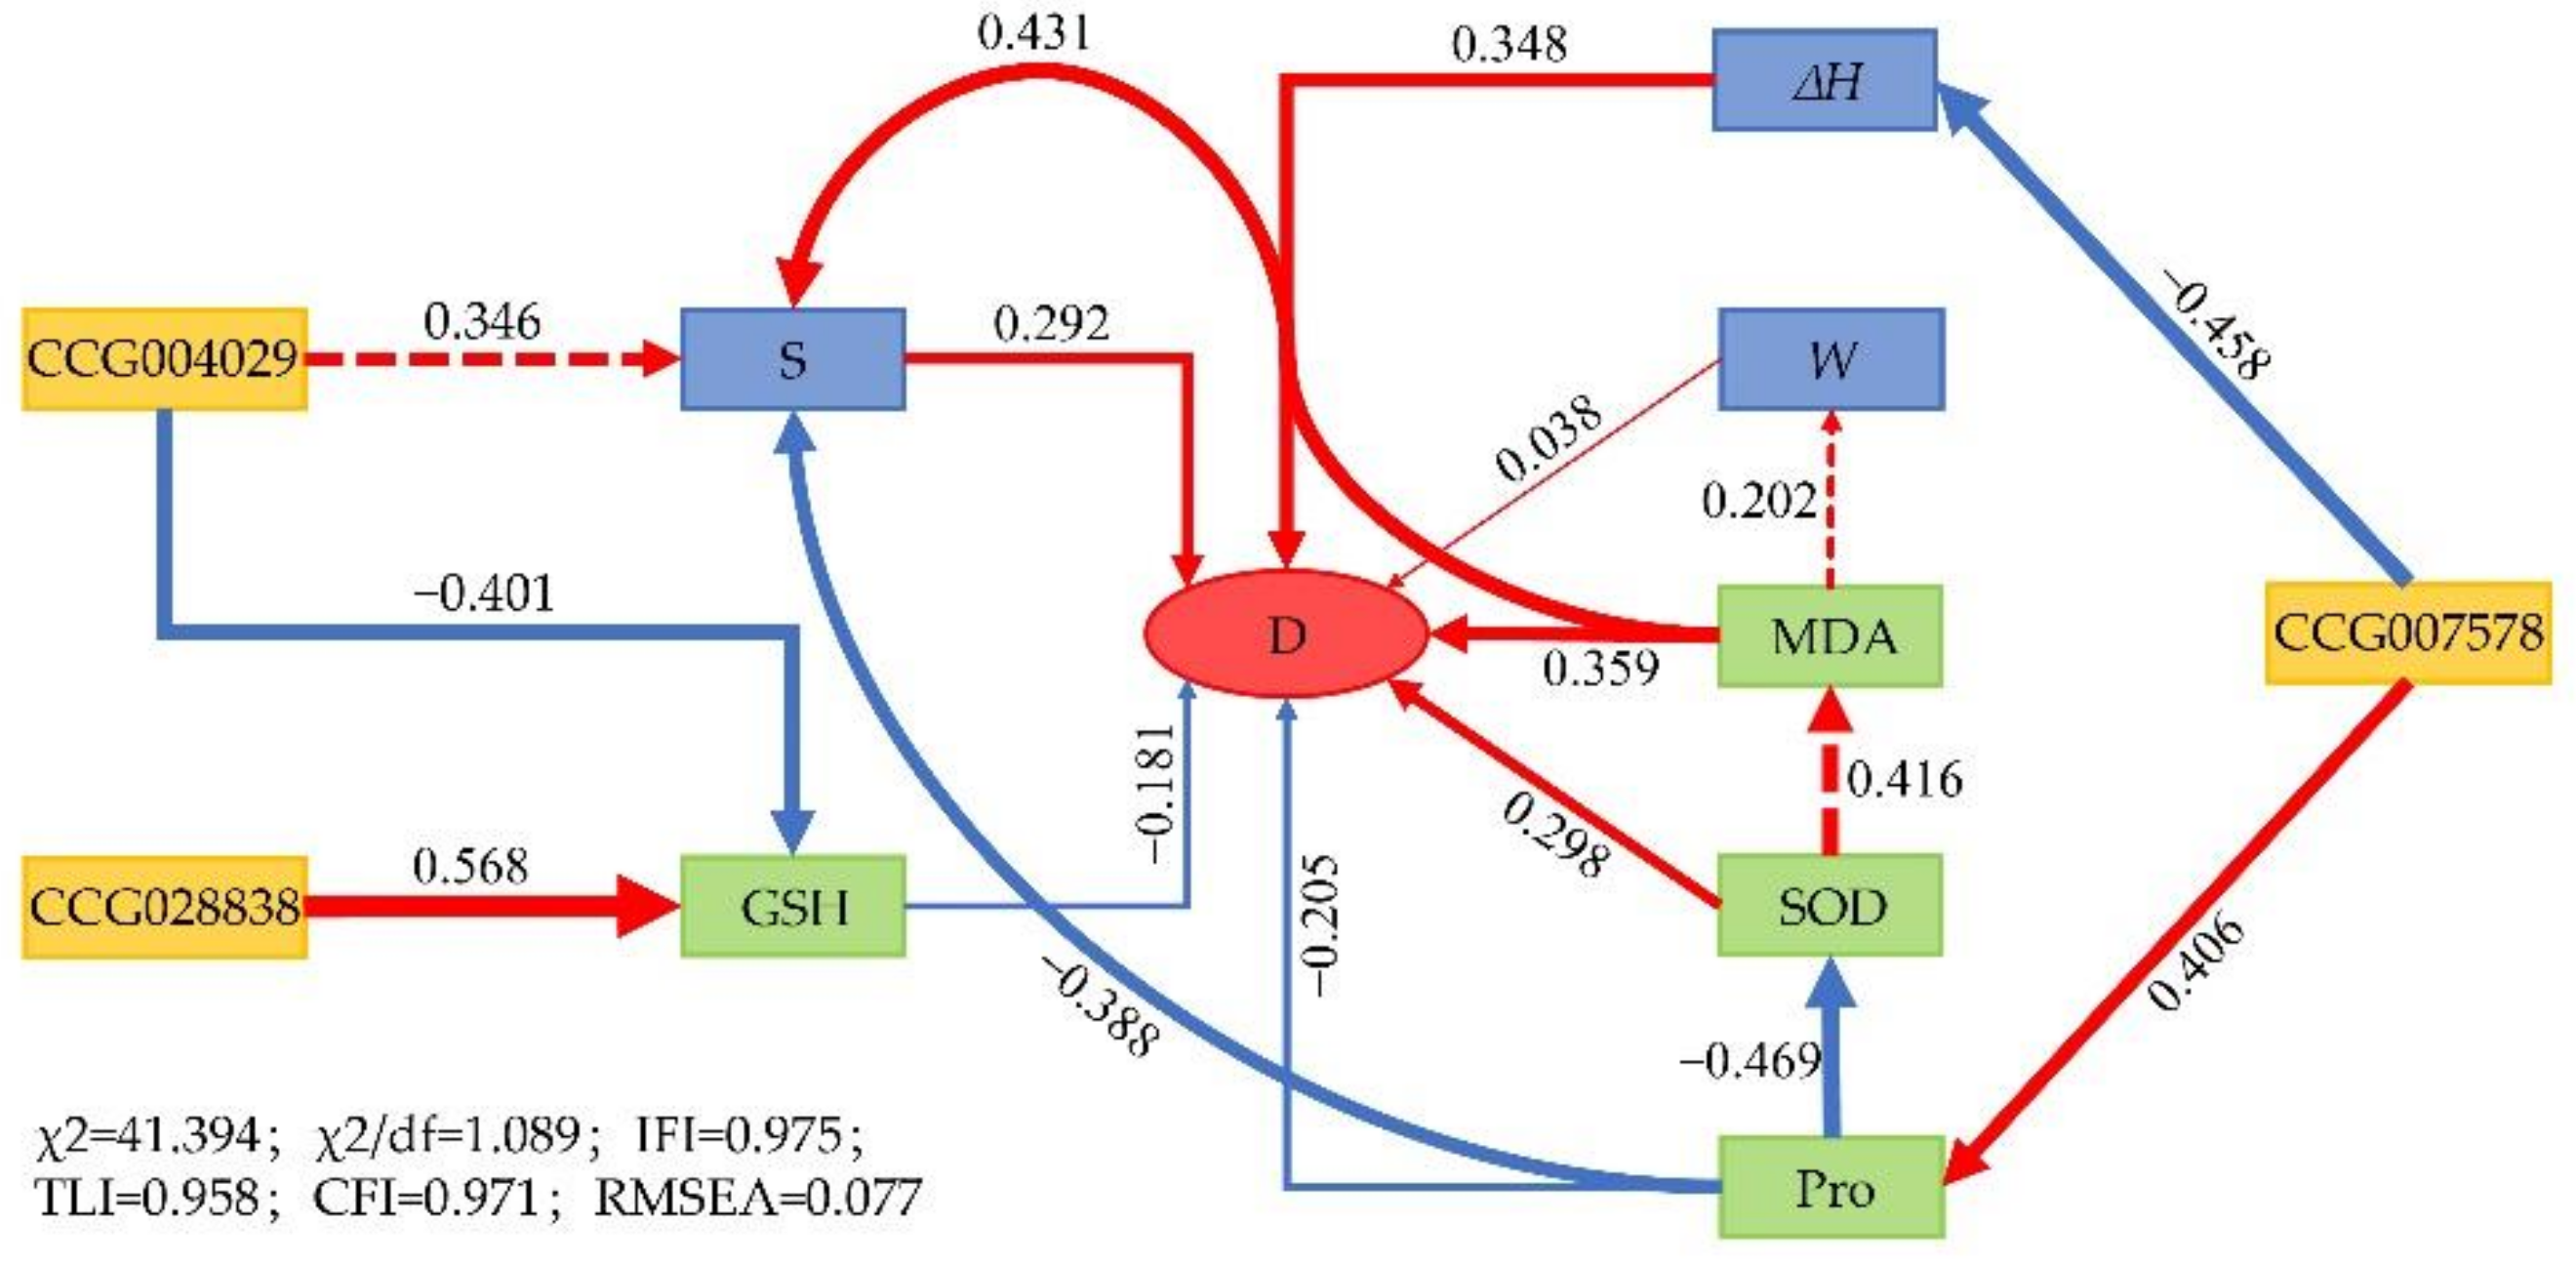
3.6. Correlation and Structural Equation Model Analyses

The correlation analysis of each observation index (Figure 5) showed that D was positively correlated with Δ H, S, MDA, SOD, and P but negatively correlated with relative Pro and CCG007578. The relative expression of CCG028838 was positively correlated with GSH. The relative expression of CCG004029 was negatively correlated with W. The relative expression levels of CCG007578 were negatively correlated with Δ H and S but positively correlated with Pro.
The structural equation model was used to analyze the growth, morphology, and physiological and biochemical indices as well as the relationship between the NAC genes and drought resistance in the C. equisetifolia families (Figure 6). Drought resistance in C. equisetifolia was directly and positively influenced by Δ H, W, S, MDA, and SOD but negatively affected by Pro and GSH content. CCG028838 and CCG004029 indirectly affected drought resistance in C. equisetifolia by regulating GSH. CCG007578 negatively affected drought resistance in C. equisetifolia by altering Δ H and Pro content.

4. Discussion

4.1. Evaluation of Drought Resistance in C. equisetifolia

Drought resistance is a functional adaptation to drought stress in plants. It is a complex quantitative trait influenced by several factors. The use of a single index in the analysis limits the results, and it cannot accurately reflect actual plant drought resistance [29]. Furthermore, various traits may be correlated. Hence, the evaluation of plant drought resistance exclusively using the membership function method is unreliable and inadequate [30]. In contrast, PCA transforms several interrelated factors into comprehensive independent indices with little or no loss of the original data. The PCA accurately calculates the characteristic quantity and contribution rate of each principal component. The results of PCA are realistic and objective and eliminate most influences of human interference [31]. For these reasons, it is a common practice to combine numerous indices and methods to assess plant drought resistance [32]. In the present study, we applied PCA, the membership function method, D values, and cluster analysis to evaluate drought resistance in 16 C. equisetifolia families in the seedling stage. Thereafter, five families with varying degrees of drought resistance were preliminarily selected. Previous studies have reported that drought resistance evaluations based on the D values closely reflected the actual plant drought resistance performance in the field [33]. In the present study, three drought stress/rehydration cycles confirmed that the preservation rates of C. equisetifolia with different drought resistance levels were consistent with the drought resistance clustering trends based on the D values. Thus, combining several different indices and methods to identify drought-resistant C. equisetifolia varieties in the seedling stage was reliable.

4.2. Response Mechanism of C. equisetifolia to Drought Stress

Plants are sessile organisms that have developed genetically restricted stress adaptation mechanisms through long-term natural selection and coevolution. They resist and adapt to drought stress by adjusting their growth rates, changing their morphology, altering their physiology and biochemistry, regulating their gene expression, and so on [34]. Our study found that under long-term drought stress, C. equisetifolia cannot only reduce water consumption by slowing down its growth rate to adapt to the drought environment, but also the phylloclades decrease the effective light-receiving area and stomate size, avoiding excessive water loss by wilting [35]. Drought stress also disrupts the dynamic balance between the induction and repression of oxygen metabolism. Excessive reactive oxygen species (ROS) accumulation causes membrane lipid peroxidation, cellular dysfunction, free radical syndromes, and death in plants [36]. Malondialdehyde (MDA) is the terminal decomposition product in membrane peroxidation and indicates the degree of membrane lipid damage. Here, the root MDA content was significantly higher in the tested families subjected to drought stress [37]. Thus, long-term drought causes substantial oxidative damage to C. equisetifolia. To mitigate this injury, C. equisetifolia activates enzymatic and nonenzymatic antioxidant defense systems. Superoxide dismutase (SOD) induction and ascorbic acid (AsA) accumulation in the roots may reduce oxidative damage. Plants also produce osmoprotectants that alleviate the damage caused by drought stress. Proline (Pro) is of low molecular weight, has high water solubility, and shows low toxicity, and it is considered an ideal osmoprotectant [38]. We found that long-term drought stress significantly increased the Pro content in C. equisetifolia roots. Nevertheless, the correlation and the structural equation model analyses disclosed that Pro accumulation negatively regulates drought resistance in C. equisetifolia. This finding was inconsistent with that of Chen. [39]. The association between the Pro content and drought resistance remains controversial. Singh et al. [40] reported that in 10 different barley varieties under drought stress, Pro accumulation was positively correlated with the drought resistance level. However, Hanson et al. [41] tested the pairs of drought-resistant and drought-sensitive barley varieties selected by Singh and determined that Pro accumulation was lower in the former than the latter. Similar conflicting results have been reported for sugarcane [42,43] and other crops. Therefore, it remains to be established whether Pro accumulation directly indicates drought resistance in C. equisetifolia.
NAC genes (NAM, ATAT, and CUC) play vital roles in plant drought stress responses. JUB1 is a transcription factor (TF) of NAC genes and regulates drought resistance in tomato. Silencing SlJUB1 or overexpressing AtJUB1 decreases and increases drought resistance, respectively, and alters the peroxide content in tomato plants [20]. The poplar variety “Nanlin 895” transfected with CarNAC3 and CarNAC6 from Cicer arietinum (Linn.) presented relatively faster growth, higher Pro content, and more potent antioxidant enzyme activity. Thus, CarNAC3 and CarNAC6 might enhance drought resistance in poplar [44,45]. In our previous study (data not yet published), we found that the TFs encoded by CCG003077, CCG028838, CCG004029, CCG007578, and CCG007885 of C. equisetifolia may also regulate drought resistance. We used qRT-PCR to evaluate the expression levels of these five NAC gene TFs. The correlation analysis revealed that CCG028838, CCG004029, and CCG007578 were significantly associated with the phenotypes and physiological and biochemical traits of the families. The structural equation model showed that CCG007578 indirectly affected drought resistance in C. equisetifolia by affecting seedling growth and Pro content. Hence, CCG007578 might control growth and osmoregulation in C. equisetifolia and, by extension, affect its drought resistance. CCG028838 and CCG004029 indirectly affect plant drought resistance by regulating the glutathione (GSH) content. GSH is an important antioxidant in the AsA-GSH cycle that reduces ROS and serves as a substrate for enzymes that remove excessive ROS [46]. Therefore, CCG028838 and CCG004029 might participate in the ROS scavenging pathway. In future research, the drought-resistant and drought-sensitive families selected herein will be used to elucidate the molecular mechanisms of drought resistance in C. equisetifolia and provide a comprehensive theoretical basis for the molecular breeding of drought-tolerant C. equisetifolia species.

5. Conclusions

Five drought-resistant C. equisetifolia families were selected via a sustained natural drought stress test and using multiple indices and methods. These families could serve as basic materials for subsequent drought-resistance breeding and gene mining in this species. We endeavored to clarify the molecular drought response mechanisms in C. equisetifolia and identified the candidate NAC genes CCG007578, CCG028838, and CCG004029 using correlation and structural equation model analyses. CCG007578 may regulate growth and osmoprotection in C. equisetifolia and affect drought resistance. CCG028838 and CCG004029 might participate in ROS scavenging. The correlation and structural equation model analyses screened and established Δ H, S, MDA, SOD, and CCG007578 as reference drought resistance indices for C. equisetifolia seedlings.

Author Contributions

Conceptualization and Methodology, L.Y. and G.Y.; Writing—original draft, H.X. and J.Y.; Data curation, H.X.; Writing—review and editing, H.X., L.Y. and J.Y.; Investigation, H.X., S.X. and T.L.; Project administration and supervision, L.Y., S.N., G.Y. and D.L.; Funding acquisition, S.N. and G.Y. All authors have read and agreed to the published version of this manuscript.

Funding

This research was supported by the Fujian Provincial Department of Science and Technology (2021L3017, 2021R1010007) and the Fujian Provincial Department of Forestry (ZMGG-0704).

Institutional Review Board Statement

Not applicable.

Informed Consent Statement

Not applicable.

Data Availability Statement

The data was resulted in this research.

Acknowledgments

We thank Maojin Li and Qingui Su for their contribution to the survey.

Conflicts of Interest

The authors declare no conflict of interest.

References

  1. Xu, K.; Yang, D.W.; Yang, H.B.; Li, Z.; Qin, Y.; Shen, Y. Spatio-temporal variation of drought in China during 1961–2012: A climatic perspective. J. Hydrol. 2015, 526, 253–264. [Google Scholar] [CrossRef]
  2. Han, L.Y.; Zhang, Q.; Jia, J.Y.; Wang, Y.H.; Huang, T. Drought severity, frequency, duration and regional differences in China. J. Desert Res. 2019, 39, 1–10. [Google Scholar]
  3. Cai, X.Z.; Zhang, R.Y. A study on drought and flood phases in the southeast coast area during the past 524 years. Trop. Geogr. 1994, 14, 250–259. [Google Scholar]
  4. Zhuang, Y.; Bao, R.J.; Zhang, R.Y.; He, J.H.; Wang, L. MCI-based climatic characteristics of drought in Fujian province. J. Meteor. Environ. 2021, 37, 93–99. [Google Scholar]
  5. Fang, Z.G.; Xie, J.R. Calculation and analysis of the aridity and the wind erosion climatic erosivity in the coastal area of Fujian. J. Fujian Nor. Univ (Nat. Sci. Ed.) 1997, 3, 99–106. [Google Scholar]
  6. Zhang, W.K. Study on the relationship between the landform and the development of dry climate in the coastal region in Fujian province. J. Fujian Nor. Univ (Nat. Sci. Ed.) 2001, 1, 94–98. [Google Scholar]
  7. Zhang, Y.; Zhong, C.L.; Chen, Y.; Chen, Z.; Jiang, Q.B.; Wu, C.; Pinyopusarerk, K. Improving drought tolerance of Casuarina equisetifolia seedlings by arbuscular mycorrhizas under glasshouse conditions. New For. 2010, 40, 261–271. [Google Scholar] [CrossRef]
  8. Zhong, C.L.; Zhang, Y.; Chen, Y.; Jiang, Q.B.; Chen, Z.; Liang, J.F.; Pinyopusarerk, K.; Franche, C.; Bogusz, D. Casuarina research and applications in China. Symbiosis 2010, 50, 107–114. [Google Scholar] [CrossRef]
  9. Xie, Y.J. Evaluation of Ecosystem Service Value and Ecological Compensation Mechanism of Coastal Casuarina equisetifolia Forest in Fujian. Master’s Thesis, Fujian Normal University, Fuzhou, China, 2020. [Google Scholar]
  10. Xu, H.C.; Nie, S.; Yu, J.L.; You, L.H.; Ye, G.F.; Zhang, H.X.; Cheng, F.S.; Su, Q.G. Genetic variation and selection of Casuarina equisetifolia half-sibling families at seedling stage. Chin. J. Trop. Crops 2022. accepted. [Google Scholar]
  11. Wang, Q.M.; Zhang, Z.H.; Cui, J.G. The physiological age of asexual plants—Thingking arise from telomere length. For. Res. 2017, 30, 866–870. [Google Scholar]
  12. Li, M.J. Provenance characteristics and early selection of Casuarina equisetifolia. J. Trop. Subtrop. Bot. 2018, 26, 597–603. [Google Scholar]
  13. Wu, X.L.; Ye, G.F. Soil moisture dynamics and availability of Casuarina equisetifolia plantation in coastal sandy land. Straits Sci. 2008, 22, 46–50. [Google Scholar]
  14. Zia, R.; Nawaz, M.S.; Siddique, M.J.; Hakim, S.; Imran, A. Plant survival under drought stress: Implications, adaptive responses, and integrated rhizosphere management strategy for stress mitigation. Microbiol. Res. 2021, 242, 126626. [Google Scholar] [CrossRef] [PubMed]
  15. Lin, W.X.; Ye, G.F.; Zheng, T.H.; Lai, W.S.; Xu, J.S.; Yang, X.M.; Tan, F.L.; Pan, H.Z. Study on drought resistance characteristics and application of different Casuarina species. Protect. For. Sci. Tech. 2000, 1, 173–176+193. [Google Scholar]
  16. Shi, C.G.; Ye, G.F.; Lai, W.S.; Lin, D.G.; Xu, J.S.; Lin, W.X.; Tan, F.L.; Pan, H.Z. Study on the growth and morphological characteristics of Casuarina equisetifolia seedlings under water stress. Protect. For. Sci. Tech. 2000, 1, 151–154. [Google Scholar]
  17. Ye, G.F.; Zhang, H.X.; Chen, B.H.; Nie, S.; Liu, H.; Gao, W.; Wang, H.Y.; Gao, Y.B.; Gu, L.F. De novo genome assembly of the stress tolerant forest species Casuarina equisetifolia provides insight into secondary growth. Plant J. 2019, 97, 779–794. [Google Scholar] [CrossRef] [Green Version]
  18. Souer, E.; Van, H.A.; Kloos, D.; Mol, J.; Koes, R. The no apical meristem gene of Petunia is required for pattern formation in embryos and flowers and is expressed at meristem and primordia boundaries. Cell 1996, 85, 159–170. [Google Scholar] [CrossRef] [PubMed] [Green Version]
  19. Riechmann, J.L.; Heard, J.; Martin, G.; Reuber, L.; Jiang, C.Z.; Keddie, J.; Adam, L.; Pineda, O.; Ratcliffe, O.; Samaha, R. Arabidopsis transcription factors: Genome-wide comparative analysis among eukaryotes. Science 2000, 290, 2105–2110. [Google Scholar] [CrossRef] [PubMed]
  20. Thirumaaikumar, V.P.; Devkar, V.; Mehterov, N.; Ali, S.; Ozgur, R.; Turkan, I.; Mueller, R.B.; Balazadeh, S. NAC transcription factor JUNGBRUNNEN1 enhances drought tolerance in tomato. Plant Biotechnol. J. 2018, 16, 354–366. [Google Scholar] [CrossRef] [Green Version]
  21. Tran, L.S.P.; Nakashima, K.; Sakuma, Y.; Simpson, S.D.; Fujita, Y.; Maruyama, K.; Fujita, M.; Seki, M.; Shinozaki, K.; Yamaguchi-Shinozaki, K. Isolation and functional analysis of Arabidopsis stress-inducible NAC transcription factors that bind to a drought-responsive cis-element in the early responsive to dehydration stress 1 promoter. Plant Cell 2004, 16, 2481–2498. [Google Scholar] [CrossRef] [PubMed] [Green Version]
  22. Zhong, C.L.; Zhang, Y.; Wei, Y.C.; Meng, J.X.; Chen, Y.; Jiang, Q.S.; Chen, Z.; Li, Z.; Yu, W. Technical Regulations on Cultivation of Casuarina Seedling and Trees: LY/T 3092-2019; NFBA: Beijing, China, 2019. [Google Scholar]
  23. Tian, Y.; Sun, X.Y.; Li, S.Y.; Wang, H.Y.; Wang, L.Z.; Cao, J.X.; Zhang, L. Biochar made from green waste as peat substitute in growth media for Calathea rotundifola cv. Fasciata. Sci. Hortic. 2012, 143, 15–18. [Google Scholar] [CrossRef]
  24. Xu, C.; Wu, X.Q.; Zhang, H.Y. Impact of D-arg on drought resistance and endogenous polyamines in mycorrhizal Pinusma ssoniana. J. Nanjing For. Univ. (Nat. Sci. Ed.) 2009, 33, 19–23. [Google Scholar]
  25. Schmittgen, T.D.; Livak, K.J. Analyzing real-time PCR data by the comparative CT method. Nat. Protocols 2008, 3, 1101–1108. [Google Scholar] [CrossRef] [PubMed]
  26. Kowarik, A.; Meindl, B.; Vojvodic, M.; Bostock, M.; Lebeau, F. Voronoi Treemap: Voronoi Treemaps with Added Interactivity by Shiny. R Package Version 0.2.0. 2019. Available online: https://CRAN.R-project.Org/package=VoronoiTreemap (accessed on 16 September 2022).
  27. Wickham, H. ggplot2: Elegant Graphics for Data Analysis; Springer: New York, NY, USA, 2016. [Google Scholar]
  28. Peterson, B.G.; Carl, P. Performance Analytics: Econometric Tools for Performance and Risk Analysis. R Package Version 2.0.4. 2020. Available online: https://CRAN.R-project.org/package=PerformanceAnalytics (accessed on 16 September 2022).
  29. Zou, J.; Hu, W.; Li, Y.X.; He, J.Q.; Zhu, H.H.; Zhou, Z.G. Screening of drought resistance indices and evaluation of drought resistance in cotton (Gossypium hirsutum L.). J. Integr. Agric. 2020, 19, 495–508. [Google Scholar] [CrossRef]
  30. Meng, Y.; Tian, W.Z.; Wen, P.F.; Ding, Z.Q.; Zhang, X.P.; He, L.; Duan, J.Z.; Liu, W.D.; Guo, T.C.; Feng, W. Comprehensive evaluation of drought resistance of wheat varieties based on synergy of different developmental stages. Acta Agron. Sin. 2022. accepted. [Google Scholar]
  31. Biju, S.; Fuentes, S.; Gupta, D. The use of infrared thermal imaging as a non-destructive screening tool for identifying drought-tolerant lentil genotypes. Plant Physiol. Biochem. 2018, 127, 11–24. [Google Scholar] [CrossRef]
  32. Tian, C.Y.; Bian, X.; Yu, H.X.; Lang, R.B.; Dong, L.H.; Tao, L.N.; Zhou, Q.M.; An, R.D.; Sun, Y.F.; Yang, L.H.; et al. Comprehensive evaluation of innovative Yunrui Sugarcane parents for drought resistance. J. Plant Genet. Resour. 2019, 20, 610–623. [Google Scholar]
  33. Qi, X.S.; Wang, X.R.; Xu, J.; Zhang, J.P.; Mi, J. Drought-resistance evaluation of flax germplasm at adult plant stage. Sci. Agric. Sin. 2010, 43, 3076–3087. [Google Scholar]
  34. Anjum, S.K.; Xie, X.Y.; Wang, L.C.; Saleem, M.F.; Man, C.; Lei, W. Morphological, physiological and biochemical responses of plants to drought stress. Afr. J. Agric. Res. 2011, 6, 2026–2032. [Google Scholar]
  35. Ludlow, M.M.; Bjorkman, O. Paraheliotropic leaf movement in Siratro as a proactive mechanism against drought induced damage to primary photosynthetic reactions: Damage by excessive light and heat. Planta 1984, 161, 505–518. [Google Scholar] [CrossRef]
  36. Smimoff, N. The role of active oxygen in response of paints to water deficit and desiccation. New Phytol. 1993, 125, 27–58. [Google Scholar] [CrossRef] [PubMed]
  37. Sun, X.Z.; Zheng, C.S.; Wang, X.F. Advances on drought tolerant mechanism in woody plant. Acta Bot. Boreal.-Occid. Sin. 2007, 27, 629–634. [Google Scholar]
  38. Tang, Z.C. The Accumulation of free proline and its roles in water-stressed sorghum seedlings. Acta Phytophysiol. Sin. 1989, l5, 105–110. [Google Scholar]
  39. Chen, H. Studies on the part physiological and chemical characters of drought tolerance in Casuarina equisetifolia. Fujian J. Agric. Sci. 2000, 1, 48–54. [Google Scholar]
  40. Singh, T.N.; Aspinall, D.; Paleg, L.G. Proline accumulation and varietal adaptability to drought in Barley: A potential metabolic measure of drought resistance. Nat. New Biol. 1972, 236, 188–190. [Google Scholar] [CrossRef]
  41. Hanson, A.D.; Nelsen, C.E.; Everson, E.H. Evaluation of free proline accumulation as an index of drought resistance using two contrasting Barley cultivars. Crop Sci. 1977, 17, 720–726. [Google Scholar] [CrossRef]
  42. Li, J.; Phan, T.T.; Li, Y.R.; Xing, Y.X.; Yang, L.T. Isolation, transformation and overexpression of sugarcane SoP5CS gene for drought tolerance improvement. Sugar. Tech 2018, 20, 464–473. [Google Scholar] [CrossRef]
  43. Li, X.J.; Luo, Z.Q.; Lu, C.Q.; Tang, J.C.; Zhou, Z.; Cao, Q. Evaluation of drought resistance on twenty sugarcane varieties (strains). Chin. J. Trop. Crops 2020, 41, 2482–2491. [Google Scholar]
  44. Movahedi, A.; Zhang, J.X.; Gao, P.H.; Yang, Y.; Wang, L.; Yin, T.M.; Kadkhodaei, S.; Ebrahimi, M.; Zhu, G.Q. Expression of the chickpea CarNAC3 gene enhances salinity and drought tolerance in transgenic poplars. Plant Cell Tissue Organ. Cult. 2014, 120, 141–154. [Google Scholar] [CrossRef]
  45. Movahedi, A.; Zhang, J.X.; Yin, T.M.; Zhu, G.Q. Functional analysis of two orthologous NAC genes, CarNAC3, and CarNAC6 from Cicer arietinum, involved in abiotic stresses in Poplar. Plant Mol. Biol. Rep. 2015, 33, 1539–1551. [Google Scholar] [CrossRef]
  46. Zhu, J.K. Abiotic stress signaling and responses in plants. Cell 2016, 167, 313–324. [Google Scholar] [CrossRef] [PubMed]
Figure 1. Experimental flowchart.
Forests 13 02037 g001
Figure 2. Polygonal tree cluster diagram of drought resistance in the tested families based on the D value. Different colors represent families with different drought resistance. Polygon area represents the D value size.
Forests 13 02037 g002
Figure 3. Preservation rate analysis among the tested families. (a): Histogram of preservation rate (%) for the tested families. (b): Analysis of the difference of preservation rate (%) of different drought resistant categories. Red represents drought-resistant families, blue indicates intermediate drought tolerance families, and green represents drought-sensitive families. The number indicates the maximum and minimum values of preservation rate (%) with different drought resistance levels. “***”: p < 0.001.
Forests 13 02037 g003
Figure 4. Drought resistance coefficients of relative expression levels of CCG003077, CCG004029, CCG007578, CCG007885, and CCG028838 in all tested families. Red represents drought-resistant families, blue indicates intermediate drought tolerance families, and green represents drought-sensitive families. The number indicates the maximum and minimum values of relative expression levels of CCG003077, CCG004029, CCG007578, CCG007885, and CCG028838 with different drought resistance levels.
Forests 13 02037 g004
Figure 5. Analysis of correlations among indices. “*”: p < 0.05; “**”: p < 0.01; “***”: p < 0.001.
Forests 13 02037 g005
Figure 6. Growth, morphology, and physiological and biochemical indices, and relationship between the NAC genes and D value in various drought-resistant C. equisetifolia families. The number on arrows is the standardized path coefficient. Arrow width indicates path strength. Positive and negative path coefficients of arrows are displayed in red and blue, respectively. Solid line represents a path with a significance level p < 0.05. Dotted line represents a path without significance.
Forests 13 02037 g006
Table 1. qRT-PCR conditions and parameters.
Cycling StepTemperature (°C)TimeNo. Cycles
Predenaturation955 min1
Deformation9510 s1
Annealing6030 s40
Table 2. NAC gene primer sequences.
GeneMaker TypePrimer Sequence (5′-3′)
CCG003077NACF: AAACAACTTGAGGCTTGACGA
R: GTACCGATTCCGACGTGTCCA
CCG004029NACF: ACGGAAACTAGAGTCACGAA
R: TCTCTTGGACGATCTACTGCT
CCG007578NACF: ATCCCCAAAACTGCAAACTCA
R: CCCGTTTCTACCAATAGAGTGT
CCG007885NACF: CGTGACCTGCTTCTCCGAT
R: AATTCTGCTTTTGCGTTCCTC
CCG028838NACF: CACCTGCTGTGCGACCTCC
R: GGAACTCCGGCCCAAACCC
Table 3. Measurements of indices under drought stress and normal conditions.
Family Δ H
/cm
W
/%
S
/%
MDA
/nmol·g−1
SOD
/U·g−1
Pro
/ug·g−1
GSH
/umol·g−1
AsA
/mg·g−1
DTCKDTCKDTCKDTCKDTCKDTCKDTCKDTCK
1-1952.4372.97217.8570.000100.000100.00080.64510.164531.338216.70465.24026.4210.5060.3620.2190.045
3-2244.4875.97311.5280.000100.000100.00093.54810.540301.262109.648304.31028.8820.3300.8470.2100.062
3-2652.7222.90444.5310.00081.250100.00096.7749.831480.000149.693146.05957.1900.5850.4240.2590.067
3-524.4465.93451.5630.00083.333100.00096.77411.507592.208158.86550.65225.6000.5440.3000.1860.072
3-802.8573.32225.5580.00093.750100.00093.54811.454576.923104.96974.71521.4970.5230.4440.2140.085
4-1284.8926.32543.4520.00078.571100.00067.7429.265361.976225.370842.64830.5230.9510.3620.3020.137
4-2135.5296.86352.0830.00083.333100.00083.87110.160897.902343.4501106.89840.3690.5790.3310.3370.029
4-3832.0713.16832.2920.000100.000100.000109.6779.5341035.115205.08655.35129.1700.7230.5500.1690.027
4-3891.4342.33564.0630.00090.000100.000103.2269.781471.000341.891662.45039.1380.6110.8370.4310.036
5-2183.5509.01243.7500.00075.000100.00083.87110.008727.686283.728979.58646.1130.9170.5170.3470.036
5-3983.2027.32121.7860.00089.722100.00080.64510.150617.045234.214410.10132.1640.5840.4960.2100.027
5-3353.4079.53541.2500.00073.750100.00077.41911.294174.217290.179365.93626.8310.4350.4750.2030.036
5-802.2732.42833.1250.00082.500100.00070.96811.064485.473248.393174.01237.4970.5560.3720.3400.030
6-2073.6704.02433.1250.00087.500100.00083.87111.315513.692262.012298.88048.5740.5230.3820.3430.040
6-3944.6427.49342.3610.00071.667100.00090.32312.093605.629196.989707.84839.5490.4540.4130.3360.025
6-4452.2732.82441.1460.00083.333100.000103.22610.696621.673257.854803.94437.0870.5400.6410.3360.027
Average3.3685.15237.4670.00085.857100.00088.50810.554562.071226.815440.53935.4130.5850.4850.2780.049
StDev1.1332.35913.2440.0008.9010.00011.5170.794202.52469.565347.0409.3050.1560.1600.0750.029
CV/%0.3360.4580.3530.0000.1040.0000.1300.0750.3600.3070.7880.2630.2660.3290.2710.594
t-value−3.80026.09110.959−6.1546.3704.5601.60410.342
p-value0.0020.0000.0000.0000.0000.0000.1300.000
Table 4. DC of each index of the tested families.
Family Δ H
/cm
W
/%
S
/%
MDA
/nmol·g−1
SOD
/U·g−1
Pro
/ug·g−1
GSH
/umol·g−1
AsA
/mg·g−1
1-1950.6200.4240.7177.4693.07417.8981.09813.488
3-2240.7510.1151.0008.8762.74810.5360.3893.400
3-2650.8050.4110.8339.6512.41121.6770.84212.343
3-520.7490.5160.8338.4103.7281.9791.8162.566
3-800.8600.2560.9388.1675.4963.4761.1762.525
4-1280.9370.4450.8139.8443.2072.5541.3813.886
4-2130.8060.5210.8338.2552.61427.4191.75011.707
4-3830.6540.3231.00011.5045.0471.8981.3146.329
4-3890.6140.6410.90010.5541.37816.9260.73012.134
5-2180.3940.4380.7508.3802.56521.2431.7759.714
5-3980.4370.2180.8977.9462.63512.7501.1787.753
5-3350.3570.4130.7386.8550.60013.6390.9155.687
5-800.9360.3310.8256.4141.9544.6411.49411.242
6-2070.9120.3310.8757.4121.9616.1531.3688.669
6-3940.8200.1791.0007.9342.4522.4691.3984.840
6-4450.7730.4350.7867.3121.60627.6072.6282.211
Average0.71437.4670.8598.4362.71712.0541.3287.406
StDev0.18113.2440.0891.3221.2108.9040.5053.852
CV/%0.2530.3530.1040.1570.4450.7390.3800.520
Table 5. Eigenvectors and contribution rates of principal components of all indices.
IndexFactor Pattern
P1P2P3P4
Δ H/cm0.412−0.3490.3480.738
W/%−0.6550.1900.6270.018
S/%0.8490.215−0.0730.048
MDA/nmol·g−10.3710.6840.538−0.173
SOD/U·g−10.6870.0180.435−0.178
Pro/ug·g−1−0.7840.1180.053−0.084
GSH/umol·g−1−0.292−0.7340.479−0.165
AsA/mg·g−1−0.5560.544−0.0220.468
Eigenvalue2.9371.5211.2320.863
Contribution rate/%36.71219.01115.39910.785
Cumulative contribution rate/%36.71255.72371.12281.907
Factor weight0.4480.2320.1880.132
Table 6. Evaluation of drought resistance of the tested families.
FamilySubordinate Function ValueD ValueRankCategoryDrought Resistance
μ 1 μ 2 μ 3 μ 4
4-3830.9980.7550.9940.1080.8241Drought-resistant
3-801.0000.3470.6830.3530.7032Drought-resistant
3-2650.6370.4281.0000.5180.6413Drought-resistant
3-2240.9260.6280.0610.4120.6264Drought-resistant
1-1950.8450.3380.2850.5370.5825Drought-resistant
4-3890.1801.0000.8090.5200.5346Intermediate drought tolerance
6-4450.2710.7900.6690.7270.5267Intermediate drought tolerance
3-520.5530.2690.9930.2090.5248Intermediate drought tolerance
6-2070.4810.3520.4410.8380.4919Intermediate drought tolerance
5-800.3590.2730.3811.0000.42810Intermediate drought tolerance
4-2130.0600.5010.9150.6420.40011Intermediate drought tolerance
5-3980.4680.5540.1360.1020.37712Intermediate drought tolerance
6-3940.0530.5940.4980.5480.32813Drought-sensitive
5-2180.0000.5220.6250.0000.23914Drought-sensitive
4-1280.0490.0000.8380.1980.20515Drought-sensitive
5-3350.0150.4870.0000.0630.12816Drought-sensitive
Publisher’s Note: MDPI stays neutral with regard to jurisdictional claims in published maps and institutional affiliations.

