
Physiological Responses of Chionanthus retusus Seedlings to Drought and Waterlogging Stresses
by
Muge Niu
1,†,
Tianran Zhao
2,†,
Dong Xu
3,†,
Cuishuang Liu
1,
Yuan Liu
1,
Maotong Sun
1,
Huicheng Xie
1,* and
Jihong Li
1,* 1
Shandong Mountain Tai Forest Ecosystem National Station, Key Laboratory of Forest Cultivation in the Lower Yellow River, National Forestry and Grassland Administration, College of Forestry, Shandong Agricultural University, Tai’an 271018, China
2
Xu Zhou China Mining Geotechnical Technology Co., Ltd., Xuzhou 221000, China
3
Shenzhen Branch, Guangdong Laboratory of Lingnan Modern Agriculture, Genome Analysis Laboratory of the Ministry of Agriculture and Rural Affairs, Agricultural Genomics Institute at Shenzhen, Chinese Academy of Agricultural Sciences, Shenzhen 518120, China
*
Authors to whom correspondence should be addressed.
†
These authors contributed equally to this work.
Forests 2023, 14(2), 429; https://doi.org/10.3390/f14020429
Submission received: 15 January 2023
/
Revised: 13 February 2023
/
Accepted: 15 February 2023
/
Published: 19 February 2023
(This article belongs to the Special Issue Stress Resistance and Genetic Improvement of Forest Trees)
Abstract
:Understanding the adaptability of Chionanthus retusus Lindl. et Paxt. to extreme water conditions will help in exploring the potential application of this species in barren mountains. Three-year-old Chionanthus retusus seedlings were used in a greenhouse pot experiment that analyzed the effect of different moisture gradients on growth, photosynthetic and fluorescence characteristics, protective enzyme system, osmotic substance regulation and cell membrane damage. The results indicated that C. retusus can effectively grow at a relative soil water content of 44.6% and above and can maintain growth for 20 days under flooded conditions. Under drought stress, net photosynthesis rate (Pn), stomatal conductance (Gs), transpiration rate (Tr), and intercellular carbon dioxide concentration (Ci) all showed a trend of gradual decrease. The trend of change was similar under waterlogging conditions. The maximal quantum yield of PSII photochemistry (Fv/Fm), actual photochemical efficiency of PSII (ΦPSII), photochemical quenching coefficient (qP), and electron transport rate (ETR) all decreased as drought deepened. Malondialdehyde (MDA) content decreased first and then increased. However, superoxide dismutase (SOD) activity content, peroxidase (POD) activity content, and proline (Pro) activity content showed a trend of increasing and then decreasing. C. retusus had good adaptability in the slight drought treatment group and flooded treatment group but showed intolerance in the high drought group, which could still last for approximately 21 days. C. retusus was found to have a strong adaptability to water stress and can be used as an afforestation tree in barren mountains.
1. Introduction
Soil erosion is an important environmental threat in China, and published reports show that more than 60% of the country is affected by soil invasion [1]. Drought and flooding are important factors that cause soil erosion. The frequency of heavy rainfall events has increased significantly around the world as global warming accelerates, while the frequency of light and moderate precipitation has decreased [2,3,4]. These extreme weather events, such as heavy rainfall and extreme drought, exacerbate soil erosion [5,6]. To alleviate such environmental problems, protective nets [7], artificial cement reinforcement of protective slopes [8] and vegetation greening [9] are often employed. Vegetation greening has the function of carbon fixation and oxygen release while effectively relieving the pressure of extreme weather. Therefore, of these methods, we believe that vegetation greening is most beneficial to the environment. However, this method makes higher demands on the drought and flood tolerance of plants, and most plants cannot adapt to such extreme environments at the same time. Silva et al. [10] studied the physiological responses of 16 eucalyptus groups under drought stress, but no studies have reported on eucalyptus under flooding. More stress-tolerant plants need to be identified as candidates for the afforestation of barren mountains.
Water stress will adversely affect not only the appearance and morphology of plants but also their physiological and ecological characteristics, including inhibition of photosynthesis, respiratory disorders, and abnormal plant metabolism, and it may even lead to plant death [11,12,13]. Drought damage or waterlogging damage will cause obvious changes in plant growth morphology, often manifesting as wilting, drooping, yellowing, reddening and even shedding of leaves [14,15]. The decrease in stomatal conductance (Gs) is the initial response of plants to water shortage, which in turn reduces water loss by limiting plant transpiration (Tr) [16,17]. This result leads to the reduction of intercellular CO2 (Ci) and the imbalance of photochemical activity II and electron requirements for photosynthesis, thus affecting plant photosynthesis (Pn) [18]. Chlorophyll fluorescence (Maximal quantum yield of PSII photochemistry, actual photochemical efficiency of PSII, photochemical quenching coefficient, electron transport rate. These are abbreviated as Fv/Fm, ΦPSII, qP, ETR) indicates the state of photosystem II (PSII) and thus the photochemical efficiency [19]. In addition, to resist the influence of water stress, plants usually improve their drought resistance and waterlogging resistance by increasing the activities of superoxide dismutase (SOD) and peroxidase (POD) enzymes or by increasing the concentration of cell fluid by accumulating organic matter such as proline (Pro) [20,21,22]. These typical indicators are, therefore, the key factors to measure when examining plant stress resistance.
Chionanthus retusus Lindl. et Paxt., a species of the genus Chionanthus in the family Oleaceae, is widely distributed in subtropical and temperate regions of China, and a small amount of it is also distributed in the Korean Peninsula and Japan. C. retusus is grown in mountainous and hilly areas such as sparse mixed forests below 3300 m.a.s.l. or forest margin shrublands, riverbanks and gravel soils [23]. As an important native tree species in China, its distribution spans temperate, subtropical, and tropical regions, suggesting that it may be extremely adaptable to different climates. To date, the limited number of studies of C. retusus has mainly focused on factors such as component analysis [24,25,26,27,28], ecological value [29,30,31,32], and evolutionary genetic relationship [33,34,35,36]. Little physiological information exists about the response of C. retusus to water stress. We studied the photosynthetic characteristics (Pn, Gs, Tr, and Ci), chlorophyll fluorescence characteristics (Fv/Fm, ΦPSII, qP and ETR), protective enzyme system (MDA content, POD activity and SOD activity) and the changing rule of the osmotic regulation substances (Pro) under different moisture gradients in C. retusus. The purpose of this study was to find the water threshold of C. retusus. Our results will provide a foundation for water management and the application potential of C. retusus in barren mountains or bottomland vegetation restoration.
2. Materials and Methods
2.1. Plant Materials
Three-year-old C. retusus cuttings with a diameter at the ground level of 0.75 cm and a height of approximately 80 cm were purchased. These seedlings were transplanted into flowerpots containing 4.3 kg sandy loam. Healthy plants of a similar height were used to perform the experiments in a greenhouse in the Forestry Experimental Station of Shandong Agricultural University (36°16′ N, 117°15′ E) from May to August 2020 (33–36 °C day/17–19 °C night; relative air humidity, 60%–70%).
2.2. Drought and Flood Treatments
Rooted plants were exposed to drought and flood treatments, and six replicates (one plant/each repeat) of each experiment were carried out. Five different water gradients were set: (1) In the control group, the relative water content (RWC) of the soil was controlled to reach 75%–80% of field water capacity; (2) in the slight drought treatment group, RWC reached 55%–60%; (3) in the moderate drought treatment group, RWC was 40%–45%; (4) in the high drought treatment group, RWC was 30%–35%; (5) in the flooded treatment group, the water level was 2 cm higher than the basin soil, and soil moisture capacity was determined by the ring tool method. A soil moisture meter (ThetaprobetypeML2X, Delta-T, UK) was used to measure soil moisture capacity. A weighed quantity of water was applied every 2 days to maintain the soil RWC. At 0 d, 7 d, 14 d, 21 d, and 28 d after water stress treatment, leaves from each seedling were harvested to measure the physiological indexes. Groupings in this experiment were made according to Hao et al. [12] with some small modifications.
2.3. Measurements of Physiological Indexes
2.3.1. Determination of Morphological Indexes
At the end of the stress treatment, the morphological characteristics of plants and leaves were randomly selected for photography, and the grade of leaf damage was investigated. The damage index was calculated according to previous reports (Equation (1)). The damage was classified as:
- Grade 0: no damage symptoms.
- Grade I: mild water damage; less than 10% of the leaves show wilting, drooping, or wrinkling.
- Grade II: moderate water damage; 10%–20% of the leaves show wilting, drooping, or wrinkling.
- Grade III: severe water damage; 30%–59% of the leaves show wilting, drooping, or wrinkling.
- Grade IV: extremely severe water damage; more than 60% of the leaves show wilting, drooping, or shrinking.
Damage index (%) = ∑ (number of leaves at all grade × series)/(highest
series × total number of leaves) × 100%
series × total number of leaves) × 100%
2.3.2. Photosynthetic Parameters
From 8:30 to 11:00 on sunny days, the 3–5 leaves at the top of the seedlings were selected to test the net photosynthetic rate (Pn), stomatal conductance (Gs), intercellular CO2 concentration (Ci) and transpiration rate (Tr) by LI-6800XT portable automatic photosynthesis meter (LICOR, Lincoln, NE, USA). The determined light intensity was 1200 µmol·m−2·s−1.
2.3.3. Determination of Chlorophyll Fluorescence Index
The minimum fluorescence (Fo’) and maximum fluorescence (Fm’) of the leaves were measured under light adaptation with a pulse-modulated fluorescence system (FMS2.02, Hansatech, norfolk UK). After 30 min of dark adaptation, the initial fluorescence (Fo), maximum fluorescence (Fm) and steady-state fluorescence (Fs) of leaves were measured. The maximum photoconversion efficiency of PSII (Fv/Fm), actual photochemical efficiency of PSII (ΦPSII) and photochemical quenching coefficient of PSII (qP) were calculated according to Equations (2)–(4).
Fv/Fm = (Fm/Fo)/Fm’.
ΦPSII = (Fm’ − Fs)/Fm’.
qP = (Fm’ − Fs)/(Fm’ − Fo’).
2.3.4. Measurement of Antioxidase Activities, MDA, Thiobarbituric Acid and Pro Content
Approximately 0.5 g fresh leaves were ground with 5 mL pre-cooled 0.05 mmol·L−1 phosphate buffer (pH = 7.8) and then centrifuged at 4 °C for 20 min with a Sigma dk-315 benchtop freezer centrifuge. Subsequently, the supernatant was used for enzyme activity determination. The activity of superoxide dismutase (SOD) was determined by the Nitro blue tetrazolium (NBT) method [37], and the activity of peroxidase (POD) was determined by the guaiacol method. The content of MDA in the leaves was determined by the thiobarbituric acid (TBA) method, and the content of Pro in the leaves was determined by the sulfosalicylic acid method [21].
2.4. Statistical Analysis
All data were analyzed with SPSS 21.0 software and Origin 2019 software. Two-way ANOVA and the least significant difference method (LSD) were used to test the significance of differences among treatment groups at the 5% level (p = 0.05). For principal component analysis (PCA), data (Xij) were standardized to their standardized value (Zij) according to Equations (5)–(7), in which i is the treatment factor, and j is the time factor. The results are shown as means ± SD, and different letters indicate significant differences.
3. Results
3.1. Effects of Water Stress on Growth Morphology of C. retusus
The plant morphology of C. retusus had changed significantly, especially in the leaves (Figure 1). At 28 days, one-third of the leaves of plants in the slight drought treatment group had drooped, and chlorosis had occurred. In the high drought treatment group, all plants had dried up or even died, and there was a victim index of 0.93. In the slight drought treatment group, the top branches exhibited obvious wilting, and the leaves in the middle and lower parts were withered. The flooded treatment group was still in a normal state.
3.2. Effects of Water Stress on Gas Exchange Parameters of C. retusus
The gas exchange parameters were significantly different under different water stress treatments. The Pn, Gs and Tr of C. retusus showed a significant downward trend, while Ci gradually increased first and then decreased (Figure 2). Pn showed a sharp decline as drought stress deepened. The photosynthetic capacity of the flooded treatment group was 19.53% higher than that of the control group in the first 28 days and decreased after 28 days. However, it was still higher than that of the drought stress groups. Although the Pn of the slight drought treatment group was lower than that of the flooded treatment group, it was able to maintain normal growth for approximately 30 days, which decreased by 5.45%, 16.76%, 34.55% and 51.2% compared with that of 0 days, respectively. The stress state of the moderate drought treatment group on day 0 was basically the same as that of the slight drought treatment group on day 21 and gradually decreased as the number of stress days. The Pn of C. retusus leaves reached their lowest value in the high drought treatment group, with an average value of 1.103 ± 0.78 d µmol·m−2·s−1 (significant).
For the changing trend of Gs, the stomatal conductance of leaves in the flooded treatment group continued to decrease from day 0 to day 28, which was significantly different from that in the control group. The stomatal conductance of leaves in the slight drought treatment group decreased significantly with the increase in stress days but was higher than that in the moderate drought treatment and high drought groups as a whole.
Tr was decreased with the change in water stress, similar to results found in Gs. The high drought group was significantly lower (by 70.625%) than the control group, and the flooded treatment group was similar to the moderate drought treatment group, with a small overall decrease.
The variation trend of Ci showed that the soil relative water content decreased significantly with the decrease of soil relative water content; the flooded treatment group was 18.75% lower than that of the control group, and the amount of Ci in the flooded treatment group increased significantly with the increase in stress days. The slight drought treatment, moderate drought treatment and high drought groups all showed a trend of increasing first and then decreasing and showed a significant decrease after the peak at 14 d, with decreasing amplitudes of 32.05%, 33.58% and 15.14% in each group, respectively.
3.3. Effects of Water Stress on Chlorophyll Fluorescence Characteristics of C. retusus
The maximum photochemical efficiency (Fv/Fm), actual photochemical efficiency of PSII (ΦPSII), apparent photosynthetic electron transport rate (ETR) and photochemical fluorescence quenching (qP) of leaves increased first and then decreased with the decrease of soil RWC (Figure 3). In Figure 3A, Fv/Fm in all treatment groups shows a significant decline compared with that in the control group. The flooded treatment group was basically the same as the control group before 7 days but decreased with the increase of stress days. At this time, the Fv/Fm value of C. retusus leaves was between 0.816 and 0.828, the primary light energy conversion efficiency of the PSII reaction center was higher, and the difference was not significant (p > 0.05). The decrease in the slight drought treatment, moderate drought treatment and high drought groups was 14%, 36.32%, and 44.41% on day 7, respectively, and the change in the amplitude also increased with the deepening of drought stress. After 21 days, the decrease in the slight drought treatment group was significantly smaller, while the decrease in the moderate drought treatment and high drought treatment groups had increased significantly, and the lowest Fv/Fm reached 0.0903. Figure 3B–D shows that ΦPSII, ETR and qP clearly had three stages of response to water stress: the relative soil water content was 80%–100% (flooded treatment and control group), 60%–75% (slight drought treatment group) and 30%–55% (moderate drought treatment and high drought treatment groups). The ΦPSII, ETR and qP values all fell with the decrease in soil RWC, and the trend of variation within each treatment group was mainly the increase in days and the decrease in indexes.
3.4. Effects of Water Stress on Protective Enzyme Activities in C. retusus
SOD activity in C. retusus leaves in the slight drought treatment, moderate drought treatment and high drought treatment groups increased first and then decreased with the prolongation of time and the decrease in water content (Figure 4). In the flooded treatment group, it increased to a certain extent compared with the control group. Compared with the control group, the slight drought treatment group showed a significant trend of increase of approximately 30.29%, indicating that C. retusus was more adaptable to a mild drought environment and resistant to a waterlogging stress environment. Aggravation of water stress led to the overall trend of POD activity becoming similar to that of SOD. Compared with the control group, the flooded treatment group had a significant decrease of 40.47%. The slight drought treatment group showed a significant rise, with an increased rate of 91.12%. POD activity in the high drought treatment group was significantly lower than that in the control and slight drought treatment groups, indicating that C. retusus was seriously inhibited. At the late stage of gradient drought stress, the activities of antioxidant protective enzymes were significantly decreased, and two-thirds or even all seedlings in the moderate drought treatment and high drought treatment groups showed wilting and symptoms of death. C. retusus is unsuitable for planting in these stress conditions.
3.5. Effects of Water Stress on Malondialdehyde and Proline Contents in C. retusus
MDA content in the flooded treatment group increased by approximately 90.25% compared with the control group. The slight drought treatment group showed a slowly increasing trend, with an amplitude of 30.08%. However, the moderate drought treatment and high drought groups were significantly increased by 140.84% and 285.31%, respectively, and the high drought group was the most seriously stressed (Figure 5A). The MDA content in the leaves in the moderate drought treatment and high drought treatment groups was significantly higher than that in the control group and reached the highest level in the high drought treatment group at 28 days, indicating that the cell membrane leaf structure had been damaged to different degrees. The MDA content in the leaves in the high drought treatment group was the most seriously affected compared with the other groups, and the difference was significant at the 1% level.
As soil relative moisture content changed, Pro content increased first and then decreased, and there were significant differences among all treatments. Pro content in the slight drought treatment, moderate drought treatment and flooded treatment groups increased gradually, and it decreased significantly in the high drought treatment group with the lowest value of all the groups at 28 days (Figure 5B). The average pro content in the flooded treatment group was 50.286 μg·g−1, which was significantly increased in the moderate drought treatment group, and the mean reached the highest level in the whole group, and the Pro content was 135.787 μg·g−1, which was significantly different from that of the control group. These results indicated that the osmotic regulation ability of C. retusus played a role in the slight drought treatment, moderate drought treatment and flooded treatment groups, while the high drought treatment group decreased by 24.12%.
3.6. Drought Tolerance and Flood Tolerance Threshold Analysis of C. retusus
C. retusus is a slow-growing species, and therefore the net photosynthetic rate of leaves was used as the main index to evaluate water tolerance. In this experiment, soil RWC and net photosynthetic rate were analyzed, and different soil water contents were used as independent variables to establish a regression equation (Figure 6). Taking the leaf net photosynthetic rate as the dependent variable and soil salt content as the independent variable, the estimation curve and regression equation were constructed. The quadratic equation of leaf net photosynthetic rate and soil relative salt content was Y = −0.326x2 − 1.7228x + 12.732, (R2 = 0.9975). The RWC of drought tolerance was 44.6%, based on a 50% decrease in the net photosynthetic rate compared with the control group. Taking the days of waterlogging stress as the independent variable and the net photosynthetic rate of leaves as the dependent variable, the estimation curve was constructed, and the regression equation was fitted. The quadratic equation of the net photosynthetic rate of leaves and the number of days of flooding was Y = −0.1819x2 − 0.3809x + 13.82 (R2 = 0.9842). The estimated waterlogging tolerance threshold of C. retusus was approximately 20 days.
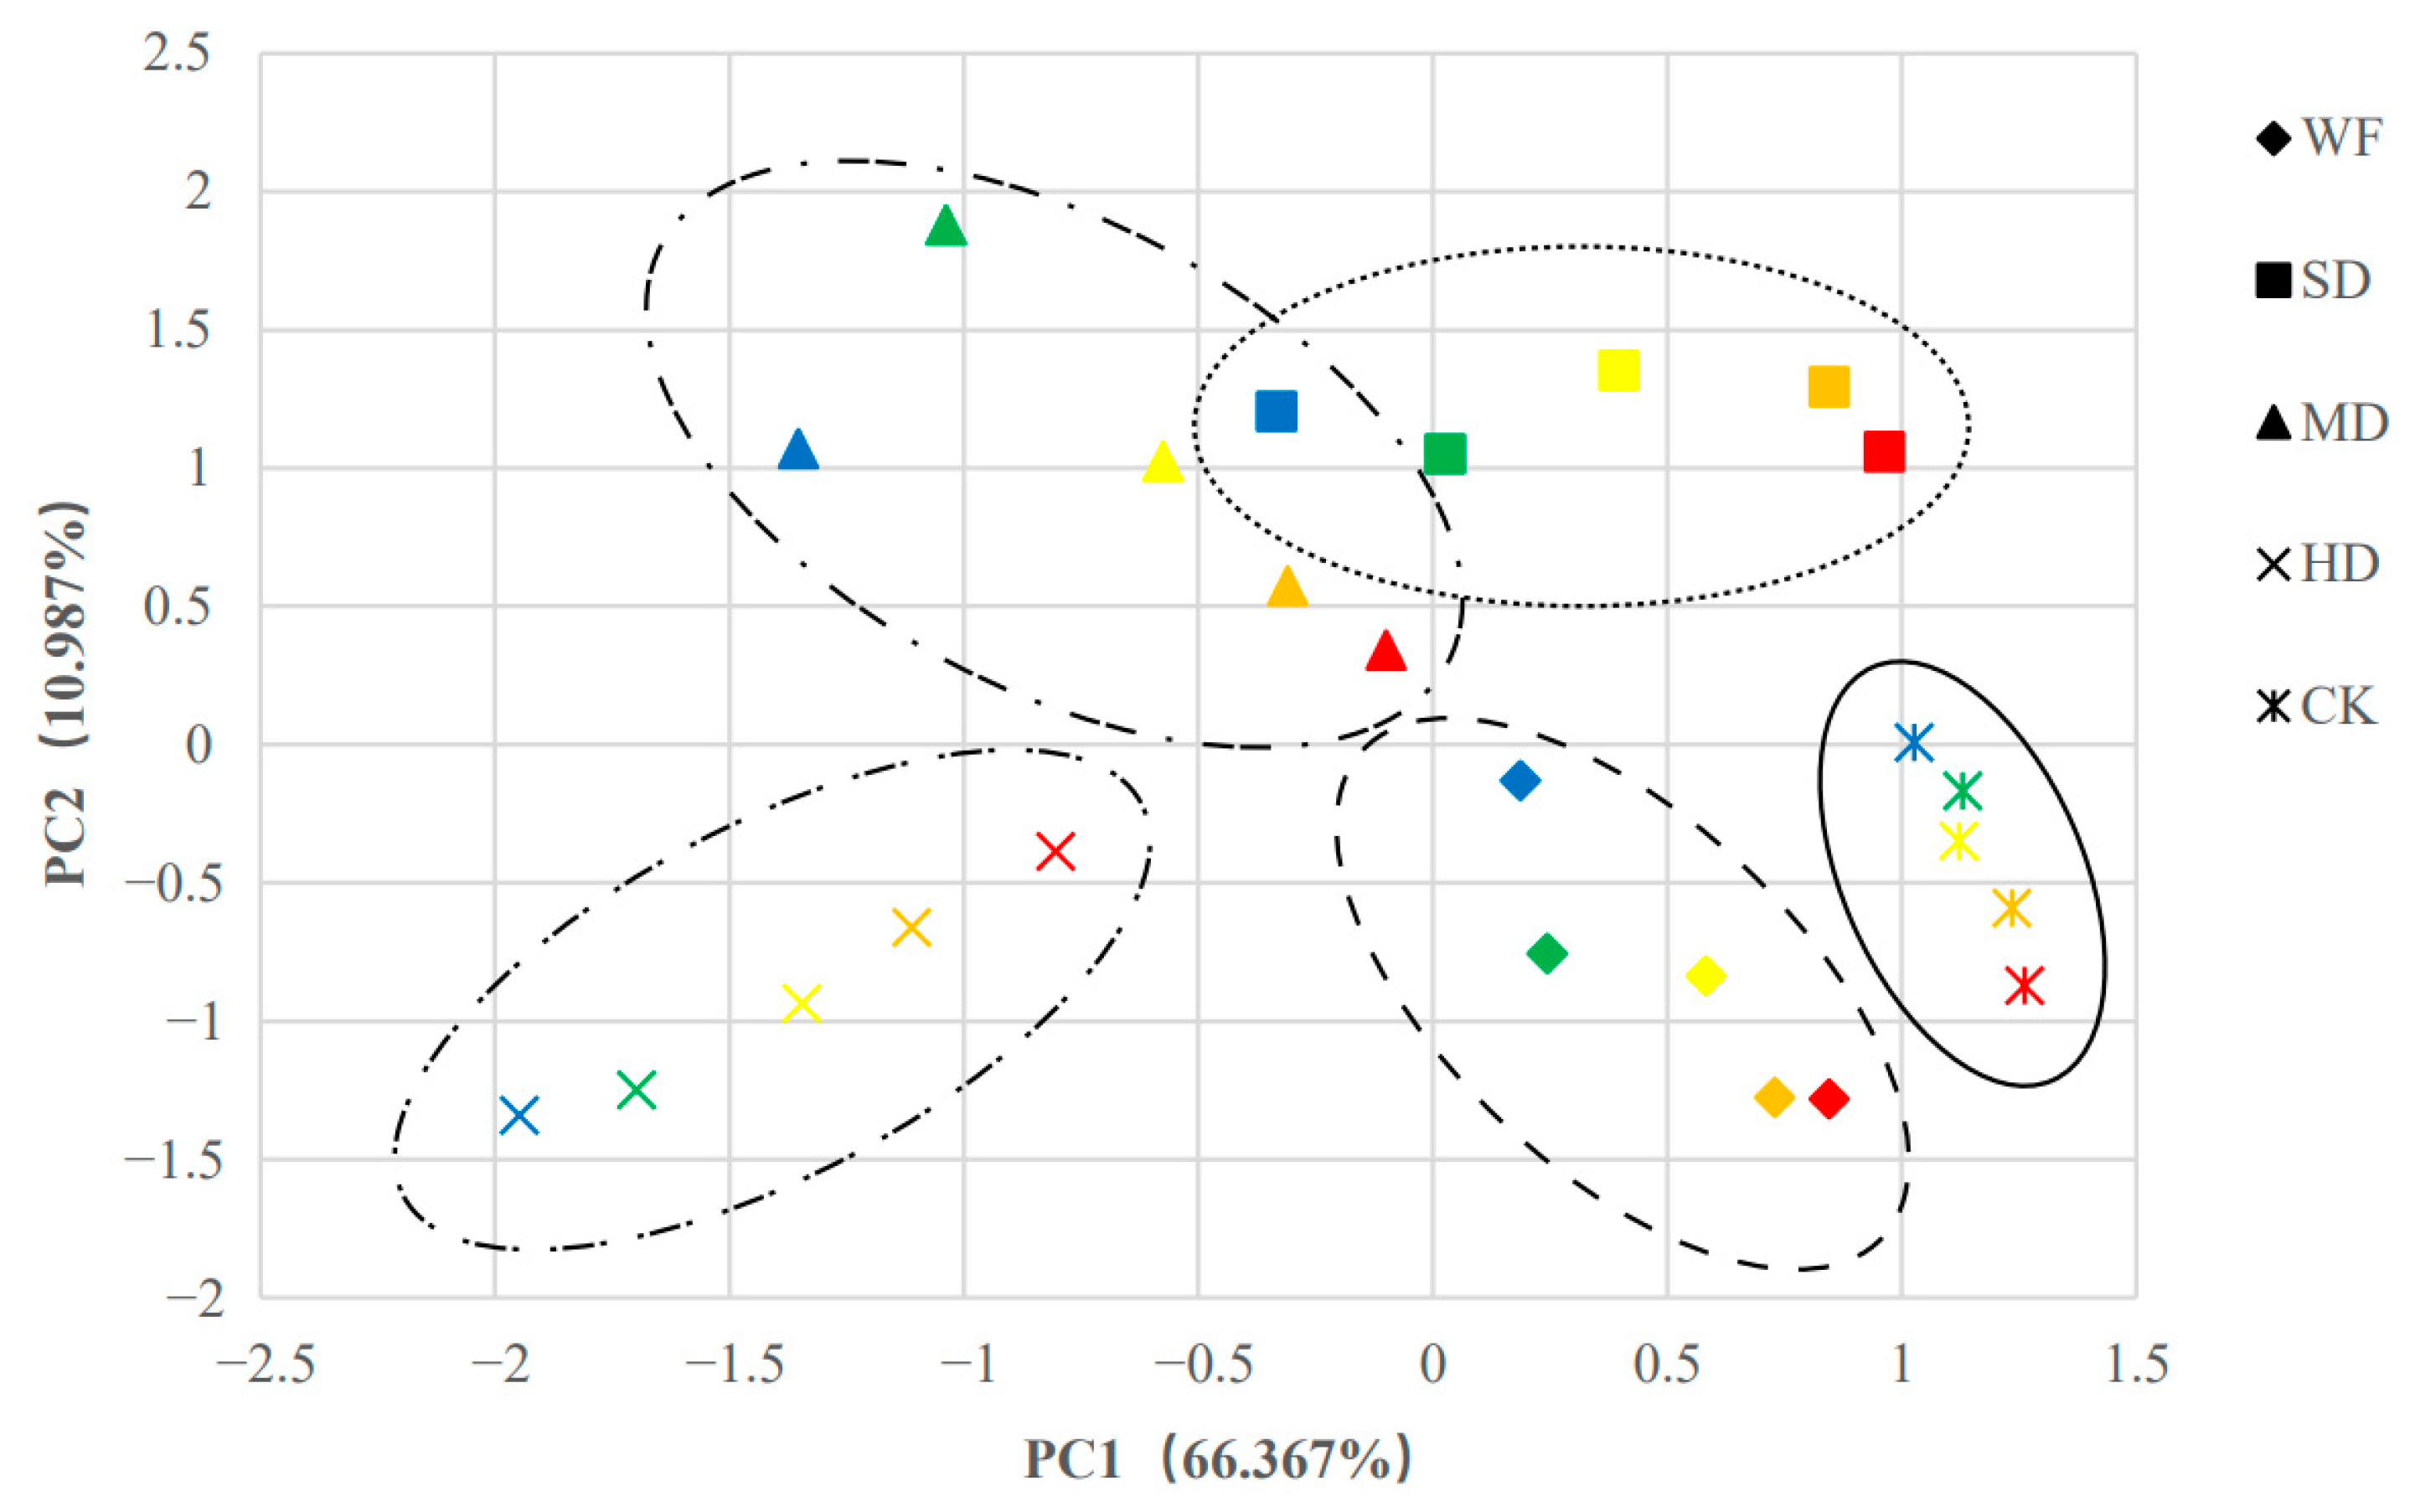
3.7. PCA of 12 Indicators of C. retusus under Different Treatments
To explore the response pattern of C. retusus seedlings to water stress, PCA analysis was performed using the above 12 indicators, including Pn, Ci, Tr, and Gs. Figure 7 shows that PC1 clearly separated the effects of different treatments on the response of C. retusus seedlings to water stress, while PC2 showed the changes in C. retusus seedlings under different water stress treatment times. PC1 and PC2 accounted for 66.367% and 10.987% of the total variation, respectively. With the exception of Pro, the other 11 indicators had similar effects on PC1, and Pro and POD were important influencing factors on PC2 (Table S1). Overall, the PCA results showed that C. retusus seedlings exhibited obvious physiological responses. In the slight drought treatment, no significant difference was observed in all indexes as the period of water stress treatment continued, and C. retusus had a certain drought resistance.
4. Discussion
Many studies have reported that water stress affects various physiological indexes of plants [38,39,40,41]. Plants regulate photosynthetic rate by closing some of the stomata, and when water falls to a certain extent, the cells begin to lose water [40]. Under severe drought stress (RWC = 35%), the stomatal conductance of leaves of C. retusus decreased significantly from 20 days, which affected the net photosynthetic rate of the plants. Under conditions of stomatal closure, CO2 levels in the cells were supplemented insufficiently, photosynthetic ability gradually declined, and the net photosynthetic rate and transpiration rate decreased. However, in this experiment, the intercellular CO2 concentrations and Ci of C. retusus did not increase significantly under severe stress, indicating that the decline in leaf photosynthesis was not affected by non-stomatal limiting factors under severe drought stress. In other words, the species has a certain tolerance to a drought environment and can maintain normal growth for a long time (28 d) under conditions of mild drought stress. In the study of Pei Bin et al. [42], the main reason for the decrease in time cooperation of Hippophae rhamnoides leaves when RWC was 10.5%–48.3% was a stomatal limitation, which was similar to the relative soil water content range in this study. The change in chlorophyll fluorescence characteristics can further explain the mechanism of photosynthesis change in an abiotic stress environment [43,44]. In this study, the chlorophyll fluorescence characteristics of the slight drought treatment and flooded treatment groups showed a relatively durable tolerance of two-thirds during the period of the experiment, which was consistent with the gas exchange parameters of photosynthesis (Figure 2).
The adaptation of plants to abiotic stress is closely related to their own antioxidant capacity and osmotic regulation. As the interface of energy and material exchange between plant cells and the external environment, the plasma membrane is the first to be damaged under various stresses. Excessive O2 proliferation and accumulation of MDA and other harmful peroxidation products—represented by membrane lipid peroxidation—cause damage to the cell membrane system, accelerate the aging of plants [45] and even threaten the survival of plant cells. The reactive oxygen species (ROS) protective enzyme system in plants, which includes SOD, POD and other important scavengers of ROS, plays a crucial role in maintaining the balance of ROS [46]. Chou et al. [47] showed that as the activities of POD and SOD increase, the waterlogging tolerance of plants under water stress becomes stronger. In this study, compared with the control group, MDA content and SOD and POD activities were increased in the slight drought treatment and flooded treatment groups. This indicated that, under mild drought and flooding stress, C. retusus helps relieve the stress of the accumulation of MDA and other harmful peroxide products by spontaneously increasing POD and SOD activities in the plant. However, under moderate drought stress, the activities of the two antioxidant enzymes were almost equal to those of the control group and flooded treatment group, indicating that the antioxidant enzymes were still active and played a certain protective role, which also indicated that C. retusus had a strong drought tolerance.
The accumulation of Pro in plants is recognized as a physiological response to external drought, and plant Pro content can be an important physiological index to evaluate the strength of drought resistance [48,49,50,51,52]. Although the two protective enzymes in the high drought group did not increase significantly compared with the mild drought treatment group, their activities were almost the same as those in the control group, indicating that they had a certain protective ability. However, the Pro content in the high drought group was significantly increased by 57.1% compared with the control group. These results indicated that C. retusus could cope with a stressful environment by increasing the content of osmoregulatory substances and has a certain drought tolerance, consistent with PCA results. Under flooding stress, Pro was slightly higher than that of the control, indicating that C. retusus not only adapts to the flooding environment through protective enzymes but also stabilizes the cell osmotic balance through osmotic substances. C. retusus has waterlogging tolerance for up to 20 days. Luo Qi et al. [53] evaluated the flooding tolerance of 10 native greening tree species and pointed out that the flooding tolerance time of the native Pistacia chinensis was approximately 10 days, whereas that of Photinia serrulata was approximately 7 days. Compared with these two species, the order of waterlogging tolerance is C. retusus > Pistacia chinensis > Photinia serrulata.
5. Conclusions
In this study, the gas exchange parameters of the drought stress treatment group showed a gradual downward trend, while the gas exchange parameters of the water flooding treatment group showed the same performance. The chlorophyll fluorescence index of all treatment groups decreased with the increased drought treatment. SOD activity, POD activity and Pro content increased first and then decreased, whereas MDA content showed the opposite trend. C. retusus can effectively grow with an RWC of 44.6% and above and can maintain growth for 20 days under flooded conditions. After that time, growth will be slow, the physiological response is not timely, and eventually, the plant wilts and even dies. The results showed that C. retusus seedlings could tolerate mild to moderate drought stress and flooding stress in abiotic stress environments and thus can be considered for application in barren mountains.
Supplementary Materials
The following supporting information can be downloaded at: https://www.mdpi.com/article/10.3390/f14020429/s1, Table S1: Coefficient of variable in PCA.
Author Contributions
T.Z., H.X. and J.L. designed and conceived the experiments. J.L., D.X. and C.L. collected the materials. M.N., Y.L. and M.S. processed the data. D.X., M.N., T.Z. and J.L. analyzed the corresponding results, drafted the manuscript, and contributed to the revision of the manuscript. H.X. and J.L. supervised this whole process and revised this paper. All authors have read and agreed to the published version of the manuscript.
Funding
This research was funded by the Subject of Key R & D Plan of Shandong Province (Major Scientific and Technological Innovation Project) Mining and Accurate Identification of Forest Tree Germplasm Resources (No. 2021LZGC023) and Agricultural science and Technology Fund Project of Shandong province (No. 2019LY001-4)
Institutional Review Board Statement
Not applicable.
Informed Consent Statement
Not applicable.
Data Availability Statement
All data generated or analyzed during this study are included in the published article.
Conflicts of Interest
The authors declare no conflict of interest.
References
- Teng, H.F.; Hu, Y.; Zhou, L.Q.; Zhou, S. Modelling and mapping soil erosion potential in China. J. Integr. Agric. 2019, 18, 251–264. [Google Scholar] [CrossRef] [Green Version]
- Zheng, Y.G.; Xue, M.; Li, B.; Chen, J.; Tao, Z. Spatial characteristics of extreme rainfall over China with hourly through 24-hour accumulation periods based on national-level hourly rain gauge data. Adv. Atmos. Sci. 2016, 33, 1218–1232. [Google Scholar] [CrossRef] [Green Version]
- Jiang, T.; Fischer, T.; Lu, X.X. Larger asian rivers: Changes in hydro-climate and water environments. Quat. Int. 2013, 304, 1–4. [Google Scholar] [CrossRef]
- Sun, H.; Wang, G.; Li, X.; Chen, J.; Su, B.; Jiang, T. Regional frequency analysis of observed sub-daily rainfall maxima over eastern China. Adv. Atmos. Sci. 2017, 34, 209–225. [Google Scholar] [CrossRef]
- Jiang, Z.; Shen, Y.; Ma, T.; Zhai, P.; Fang, S. Changes of precipitation intensity spectra in different regions of mainland China during 1961–2006. J. Meteorol. Res. 2014, 28, 1085–1098. [Google Scholar] [CrossRef]
- Wang, G.; Fang, Q.; Wu, B.; Yang, H.; Xu, Z. Relationship between soil erodibility and modeled infiltration rate in different soils. J. Hydrol. 2015, 528, 408–418. [Google Scholar] [CrossRef]
- Dhital, Y.P.; Kayastha, R.B.; Shi, J. Soil bioengineering application and practices in Nepal. Environ. Manag. 2013, 51, 354–364. [Google Scholar] [CrossRef]
- Lee, D.H.; Chen, P.Y.; Wu, J.H.; Chen, H.L.; Yang, Y.E. Method of mitigating the surface erosion of a high-gradient mudstone slope in southwest Taiwan. Bull. Eng. Geol. Environ. 2013, 72, 533–545. [Google Scholar] [CrossRef]
- Liu, Y.; Fu, B.; Liu, Y.; Zhao, W.; Wang, S. Vulnerability assessment of the global water erosion tendency: Vegetation greening can partly offset increasing rainfall stress. Land Degrad Dev. 2019, 30, 1061–1069. [Google Scholar] [CrossRef]
- Silva, P.H.; Campoe, O.C.; De Paula, R.C.; Lee, D.J. Seedling growth and physiological responses of sixteen eucalypt taxa under controlled water regime. Forests 2016, 7, 110. [Google Scholar] [CrossRef] [Green Version]
- Wu, J.; Wang, J.; Hui, W.; Zhao, F.; Wang, P.; Su, C.; Gong, W. Physiology of Plant Responses to Water Stress and Related Genes: A Review. Forests 2022, 13, 324. [Google Scholar] [CrossRef]
- Hao, S.; Cao, H.; Wang, H.; Pan, X. The physiological responses of tomato to water stress and re-water in different growth periods. Sci. Hortic. 2019, 249, 143–154. [Google Scholar] [CrossRef]
- Chen, H.; Zamorano, M.F.; Ivanoff, D. Effect of flooding depth on growth, biomass, photosynthesis, and chlorophyll fluorescence of Typha domingensis. Wetlands 2010, 30, 957–965. [Google Scholar] [CrossRef]
- Myung, J.K.; Seong, H.L.; Su, Y.W. Growth and anatomical characteristics of different water and light intensities on cork oak (Quercus suber L.) seedlings. Afr. J. Biotechnol. 2011, 10, 10964–10979. [Google Scholar] [CrossRef] [Green Version]
- Campelo, D.D.H.; Lacerda, C.F.D.; Sousa, J.A.D.; Bezerra, A.M.E.; Araújo, J.D.M.; Neves, A.L.R.; Carvalho, C.H. Morphophysiological leaf characteristics and nutritional status of six woody species as a function of the soil water availability. Cienc. Florest. 2018, 28, 924–936. [Google Scholar] [CrossRef] [Green Version]
- Conesa, M.R.; De La Rosa, J.M.; Domingo, R.; Banon, S.; Pérez-Pastor, A. Changes induced by water stress on water relations, stomatal behaviour and morphology of table grapes (cv. Crimson Seedless) grown in pots. Sci. Hortic. 2016; 202, 9–16. [Google Scholar] [CrossRef]
- Eksteen, A.B.; Grzeskowiak, V.; Jones, N.B.; Pammenter, N.W. Stomatal characteristics of Eucalyptus grandis clonal hybrids in response to water stress. J. For. Res. 2013, 75, 105–111. [Google Scholar] [CrossRef]
- Asada, K. The water-water cycle in chloroplasts: Scavenging of active oxygens and dissipation of excess photons. Annu. Rev. Plant Physiol. Plant Mol. Biol. 1999, 50, 601–639. [Google Scholar] [CrossRef]
- Nicolas, B.; Kyaw, T.P.; Matthew, E.G. A dynamic model of RuBP-regeneration limited photosynthesis accounting for photoinhibition, heat and water stress. Agric. For. Meteorol. 2020, 285, 107911. [Google Scholar] [CrossRef]
- He, Y.; Yang, J.; Zhu, B.; Zhu, Z.J. Low root zone temperature exacerbates the ion imbalance and photosynthesis inhibition and induces antioxidant responses in tomato plants under salinity. J. Integr. Agric. 2014, 13, 89–99. [Google Scholar] [CrossRef] [Green Version]
- Aghaie, P.; Tafreshi, S.A.H.; Ebrahimi, M.A.; Haerinasab, M. Tolerance evaluation and clustering of fourteen tomato cultivars grown under mild and severe drought conditions. Sci. Hortic. 2018, 232, 1–12. [Google Scholar] [CrossRef]
- Sancho-Knapik, D.; Sanz, M.Á.; Peguero-Pina, J.J.; Niinemets, Ü.; Gil-Pelegrín, E. Changes of secondary metabolites in Pinus sylvestris L. needles under increasing soil water deficit. Ann. For. Sci. 2017, 74, 24. [Google Scholar] [CrossRef]
- Li, J.H. Varieties Appreciation of Chinese Fringe Tree, 1st ed.; China Forestry Publishing House: Beijing, China, 2022; pp. 2–6. [Google Scholar]
- Wang, I.C.; Chen, L.C.; Chang, T.H.; Chen, C.L.; Sung, P.J.; Lin, R.A.; Cheng, M.J.; Hsiao, J.W.; Chen, J.J. New Coumarin and Bioactive Constituents of Chionanthus retusus. Chem. Nat. Compd. 2021, 57, 835–839. [Google Scholar] [CrossRef]
- Lee, Y.G.; Lee, H.; Jung, J.W.; Seo, K.H.; Lee, D.Y.; Kim, H.G.; Ko, J.H.; Lee, D.S.; Baek, N.I. Flavonoids from Chionanthus retusus (Oleaceae) flowers and their protective effects against glutamate-induced cell toxicity in HT22 cells. Int. J. Mol. Sci. 2019, 20, 3517. [Google Scholar] [CrossRef] [Green Version]
- Atchudan, R.; Edison, T.N.J.I.; Chakradhar, D.; Perumal, S.; Shim, J.J.; Lee, Y.R. Facile green synthesis of nitrogen-doped carbon dots using Chionanthus retusus fruit extract and investigation of their suitability for metal ion sensing and biological applications. Sens. Actuators B 2017, 246, 497–509. [Google Scholar] [CrossRef]
- Gao, J.Y.; Yin, W.P. Flower Essential Oil Composition of Chionanthus retusus. Chem. Nat. Compd. 2016, 52, 934–936. [Google Scholar] [CrossRef]
- Quilantang, N.G.; Ryu, S.H.; Park, S.H.; Byun, J.S.; Chun, J.S.; Lee, J.S.; Rodriguez, J.P.; Yun, Y.S.; Jacinto, S.D.; Lee, S. Inhibitory activity of methanol extracts from different colored flowers on aldose reductase and HPLC-UV analysis of quercetin. Hortic. Environ. Biotechnol. 2018, 59, 899–907. [Google Scholar] [CrossRef]
- Cipollini, D.; Rigsby, C.M. Incidence of infestation and larval success of emerald ash borer (Agrilus planipennis) on white fringetree (Chionanthus virginicus), Chinese fringetree (Chionanthus retusus), and devilwood (Osmanthus americanus). Environ. Entomol. 2015, 44, 1375–1383. [Google Scholar] [CrossRef] [PubMed]
- Olsen, R.T. Genetic Diversity and Distribution within Cultivated Gene Pools of Chionanthus retusus (Oleaceae) in the United States. In Proceedings of the 2014 ASHS Annual Conference, Orlando, Florida, USA, 27 July–1 August 2014. [Google Scholar]
- Zhang, L.; Su, B.Y.; Xu, H.; Li, Y.G. Growth and photosynthetic responses of four landscape shrub species to elevated ozone. Photosynthetica 2012, 50, 67–76. [Google Scholar] [CrossRef]
- Kwak, M.J.; Lee, J.K.; Park, S.; Lim, Y.J.; Kim, H.; Kim, K.N.; Je, S.M.; Park, C.R.; Woo, S.Y. Evaluation of the importance of some East Asian tree species for refinement of air quality by estimating air pollution tolerance index, anticipated performance index, and air pollutant uptake. Sustainability 2020, 12, 3067. [Google Scholar] [CrossRef] [Green Version]
- Wang, X.; Cai, F.; Zhang, C.; Zhang, M.; Li, Y.; Duan, Y. Characterization of the complete chloroplast genome of the ornamental plant Osmanthus cooperi. Mitochondrial DNA Part B 2019, 4, 2314–2315. [Google Scholar] [CrossRef] [PubMed] [Green Version]
- Arias, R.S.; Techen, N.; Rinehart, T.A.; Olsen, R.T.; Kirkbride, J.H.; Scheffler, B.E. Development of simple sequence repeat markers for Chionanthus retusus (Oleaceae) and effective discrimination of closely related taxa. HortScience 2011, 46, 23–29. [Google Scholar] [CrossRef] [Green Version]
- Nguyen, C.; Andrews, A.; Baas, P.; Bond, J.E.; Auad, M.; Dute, R. Pit membranes and their evolution in the Oleinae of the Oleaceae. IAWA J. 2017, 38, 201–219. [Google Scholar] [CrossRef]
- Alexander, L.W.; Thammina, C.S.; Kramer, M. Cross-transferability of SSR markers in Osmanthus. Genet. Resour. Crop Evol. 2018, 65, 125–136. [Google Scholar] [CrossRef]
- Ye, Y.; Tam, N.F.; Wong, Y.S.; Lu, C.Y. Growth and physiological responses of two mangrove species (Bruguiera gymnorrhiza and Kandelia candel) to waterlogging. Environ. Exp. Bot. 2003, 49, 209–221. [Google Scholar] [CrossRef]
- Keleş, Y.; Öncel, I. Response of antioxidative defence system to temperature and water stress combinations in wheat seedlings. Plant Sci. 2002, 163, 783–790. [Google Scholar] [CrossRef]
- Blanke, M.M.; Cooke, D.T. Effects of flooding and drought on stomatal activity, transpiration, photosynthesis, water potential and water channel activity in strawberry stolons and leaves. Plant Growth Regul. 2004, 42, 153–160. [Google Scholar] [CrossRef]
- Azizi, S.; Tabari, M.; Striker, G.G. Growth, physiology, and leaf ion concentration responses to long-term flooding with fresh or saline water of Populus euphratica. S. Afr. J. Bot. 2017, 108, 229–236. [Google Scholar] [CrossRef]
- Pociecha, E. Different physiological reactions at vegetative and generative stage of development of field bean plants exposed to flooding and undergoing recovery. J. Agron. Crop Sci. 2013, 199, 195–199. [Google Scholar] [CrossRef]
- Pei, B.; Zhang, G.G.; Zhang, S.Y.; Wu, Q.; Xu, Z.Q.; Xu, P. Effects of soil drought stress on photosynthesis and antioxidant enzyme activities in sea-buckthorn leaves. Acta Ecol. Sin. 2013, 33, 1386–1396. [Google Scholar]
- Zou, J.; Hu, W.; Li, Y.X.; He, J.Q.; Zhu, H.H.; Zhou, Z.G. Screening of drought resistance indices and evaluation of drought resistance in cotton (Gossypium hirsutum L.). J. Integr. Agric. 2020, 19, 495–508. [Google Scholar] [CrossRef]
- Bilger, W.; Björkman, O. Role of the xanthophyll cycle in photoprotection elucidated by measurements of light-induced absorbance changes, fluorescence and photosynthesis in leaves of Hedera canariensis. Photosynth. Res. 1990, 25, 173–185. [Google Scholar] [CrossRef]
- Javadi, T.; Rohollahi, D.; Ghaderi, N.; Nazari, F. Mitigating the adverse effects of drought stress on the morpho-physiological traits and anti-oxidative enzyme activities of Prunus avium through β-amino butyric acid drenching. Sci. Hortic. 2017, 218, 156–163. [Google Scholar] [CrossRef]
- Dhindsa, R.S.; Plumb-Dhindsa, P.; Thorpe, T.A. Leaf senescence: Correlated with increased levels of membrane permeability and lipid peroxidation, and decreased levels of superoxide dismutase and catalase. J. Exp. Bot. 1981, 32, 93–101. [Google Scholar] [CrossRef]
- Zhou, Z.; Li, G.; Chao, W.; Xu, F.; Sun, X.; Chen, Z. Physiological responses and tolerance evaluation of five poplar varieties to waterlogging. Not. Bot. Horti Agrobot. Cluj-Napoca 2019, 47, 658–667. [Google Scholar] [CrossRef] [Green Version]
- Showler, A.T. Effects of water deficit stress, shade, weed competition, and kaolin particle film on selected foliar free amino acid accumulations in cotton, Gossypium hirsutum (L.). J. Chem. Ecol. 2002, 28, 631–651. [Google Scholar] [CrossRef]
- Qi, M.; Liu, X.; Li, Y.; Song, H.; Yin, Z.; Zhang, F.; He, Q.; Xu, Z.; Zhou, G. Photosynthetic resistance and resilience under drought, flooding and rewatering in maize plants. Photosynth. Res. 2021, 148, 1–15. [Google Scholar] [CrossRef] [PubMed]
- Mafakheri, A.; Siosemardeh, A.F.; Bahramnejad, B.; Struik, P.C.; Sohrabi, Y. Effect of drought stress on yield, proline and chlorophyll contents in three chickpea cultivars. Aust. J. Crop Sci. 2010, 4, 580–585. [Google Scholar] [CrossRef]
- Nxele, X.; Klein, A.; Ndimba, B.K. Drought and salinity stress alters ROS accumulation, water retention, and osmolyte content in sorghum plants. S. Afr. J. Bot. 2017, 108, 261–266. [Google Scholar] [CrossRef]
- Verbruggen, N.; Hermans, C. Proline accumulation in plants: A review. Amino Acids 2008, 35, 753–759. [Google Scholar] [CrossRef]
- Luo, Q.; Zhang, J.L.; Hao, R.M.; Xu, W.G.; Pan, W.M.; Jiao, Z.Y. Changes of some physiological indexes of ten tree species under flooding stress and comparison of their waterlogging tolerance. J. Plant Resour. Environ. 2007, 1, 69–73. [Google Scholar]
Figure 1.
Effects of water stress on growth morphology of Chionanthus retusus clones (28 d). The top column shows the leaf state under different stress conditions, and the bottom column shows the plant growth state under different stress conditions. CK, control group; SD, slight drought treatment group; MD, moderate drought treatment group; HD, high drought treatment group; WF, flooded treatment group.
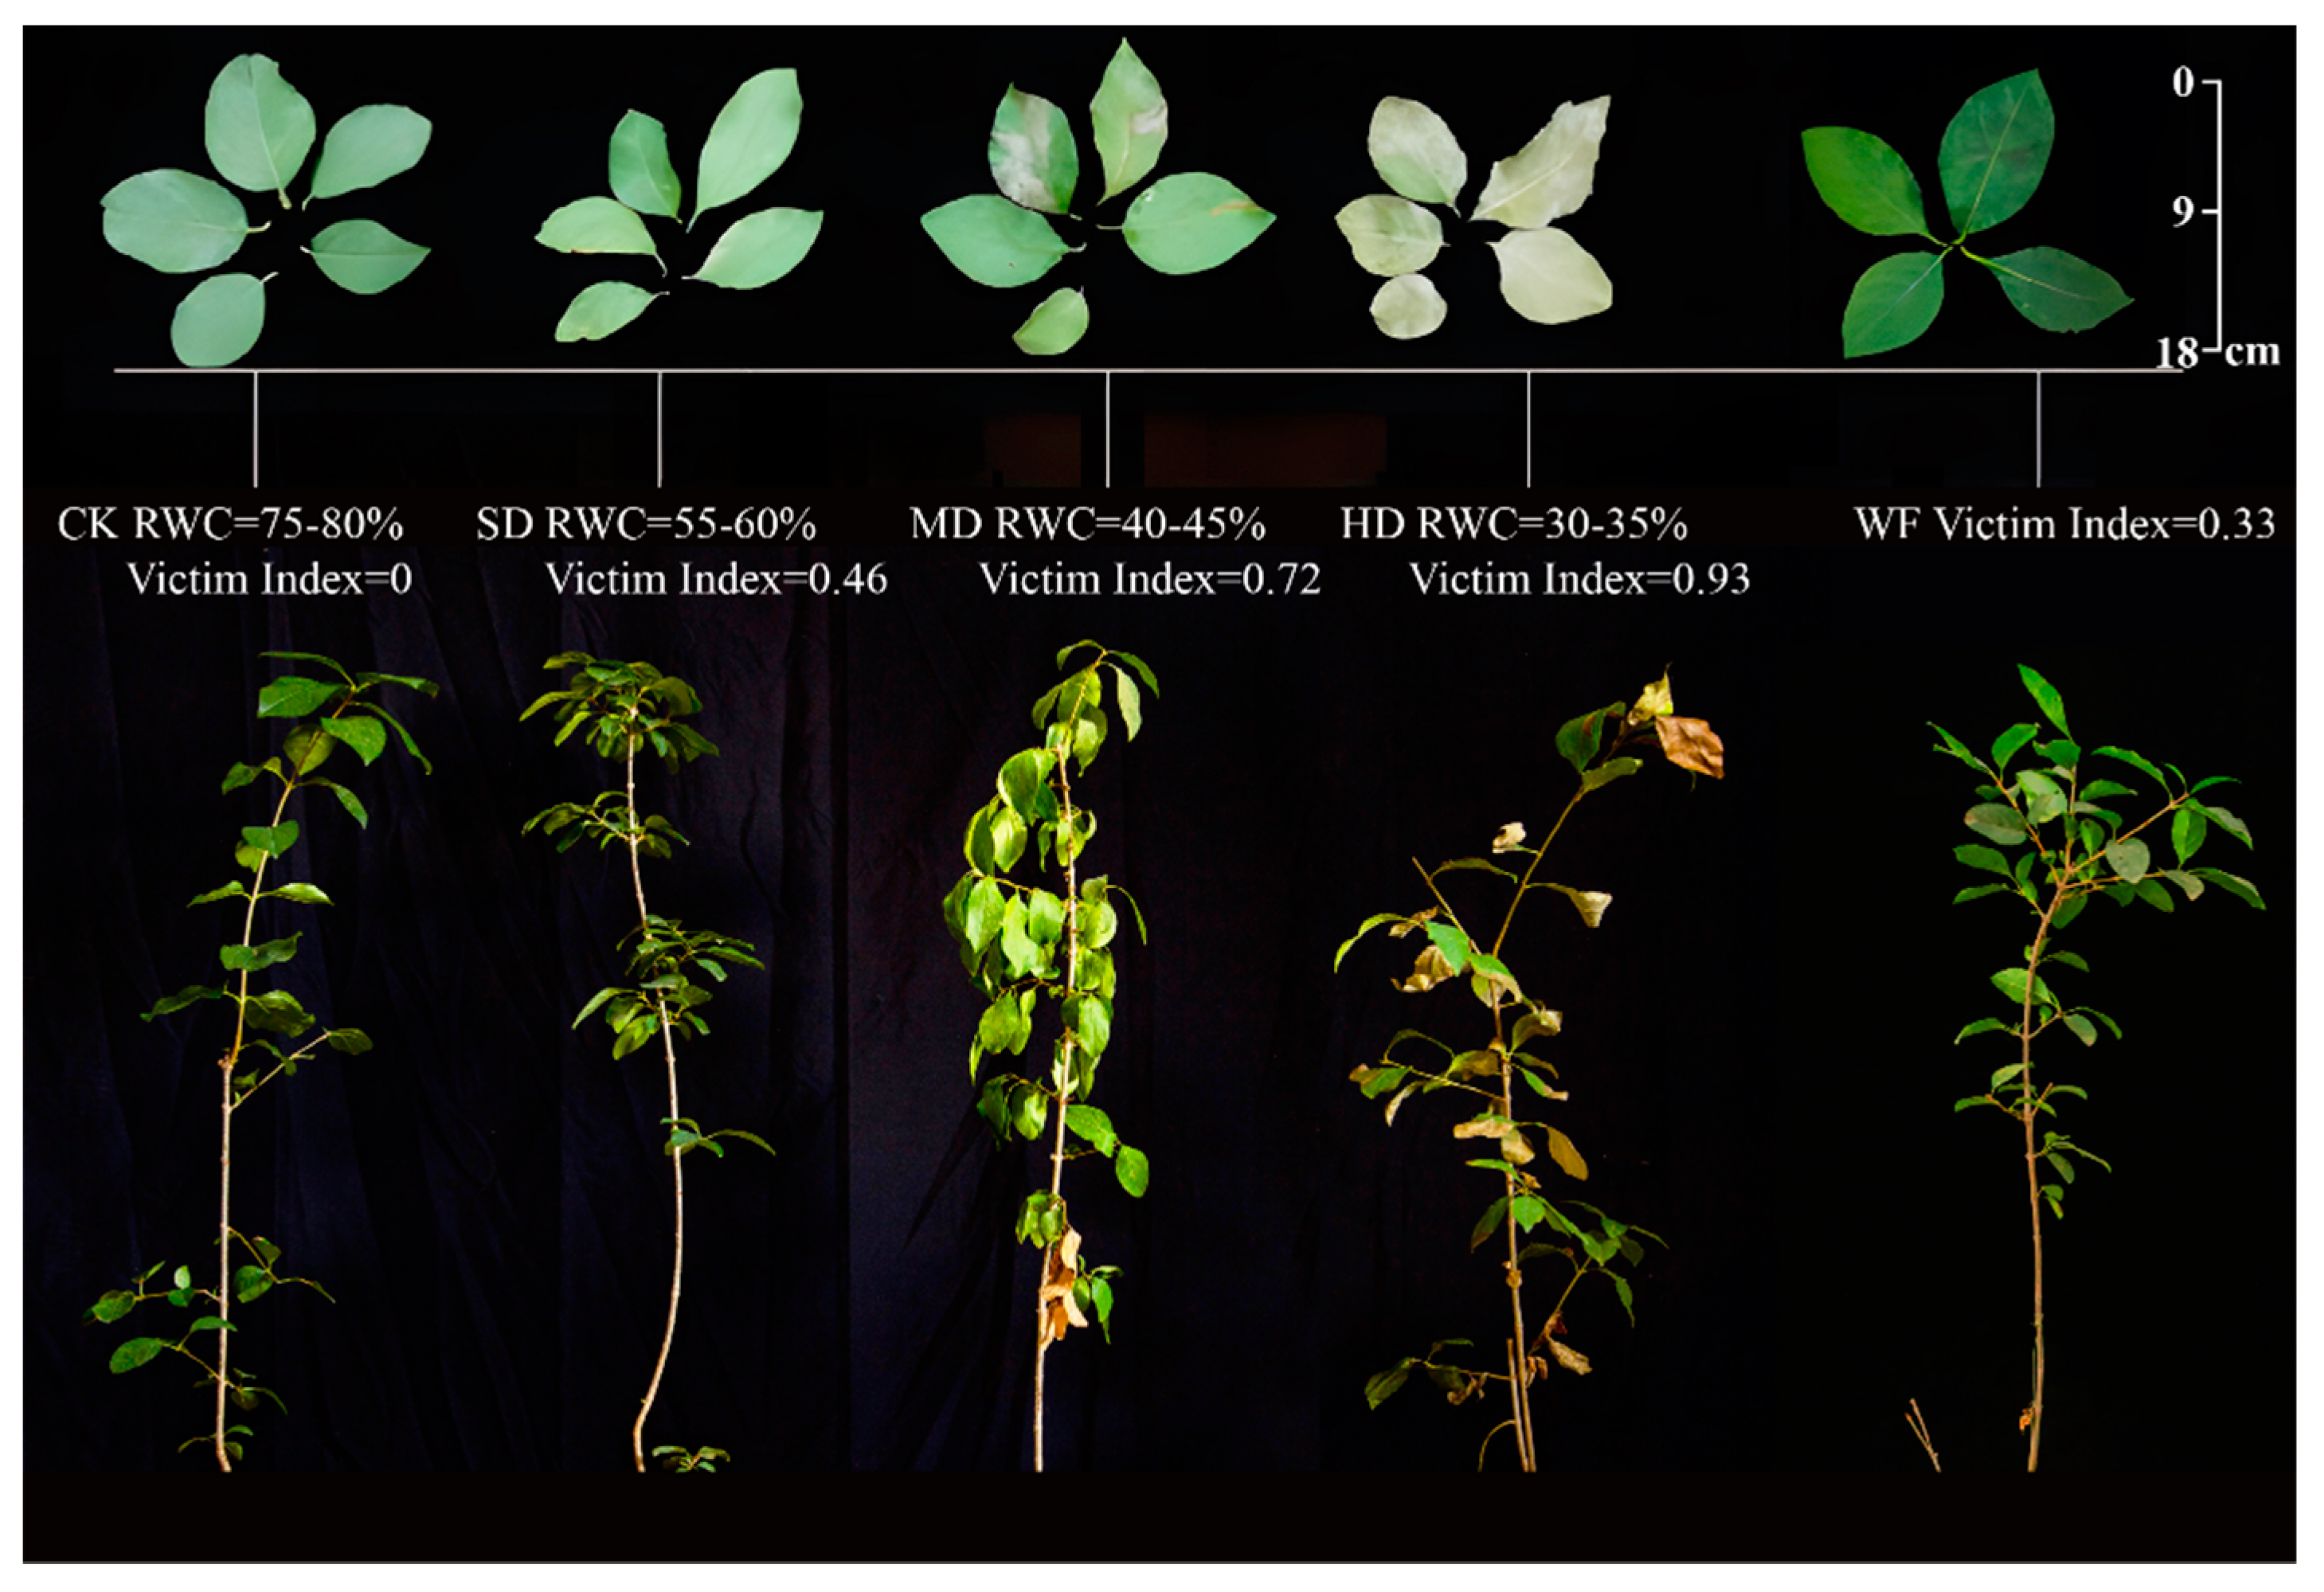
Figure 2.
Effects of water stress on photosynthetic characteristics of C. retusus leaves. (A) Effects of water stress on Pn of C. retusus leaves; (B) Effects of water stress on Gs of C. retusus leaves; (C) Effects of water stress on Tr of C. retusus leaves; (D) Effects of water stress on Ci of C. retusus leaves. Upper-case letters represent the variations in different treatment groups, and lower-case letters represent the difference in stress days within the group (significant). See the caption for Figure 1 for an explanation of abbreviations.
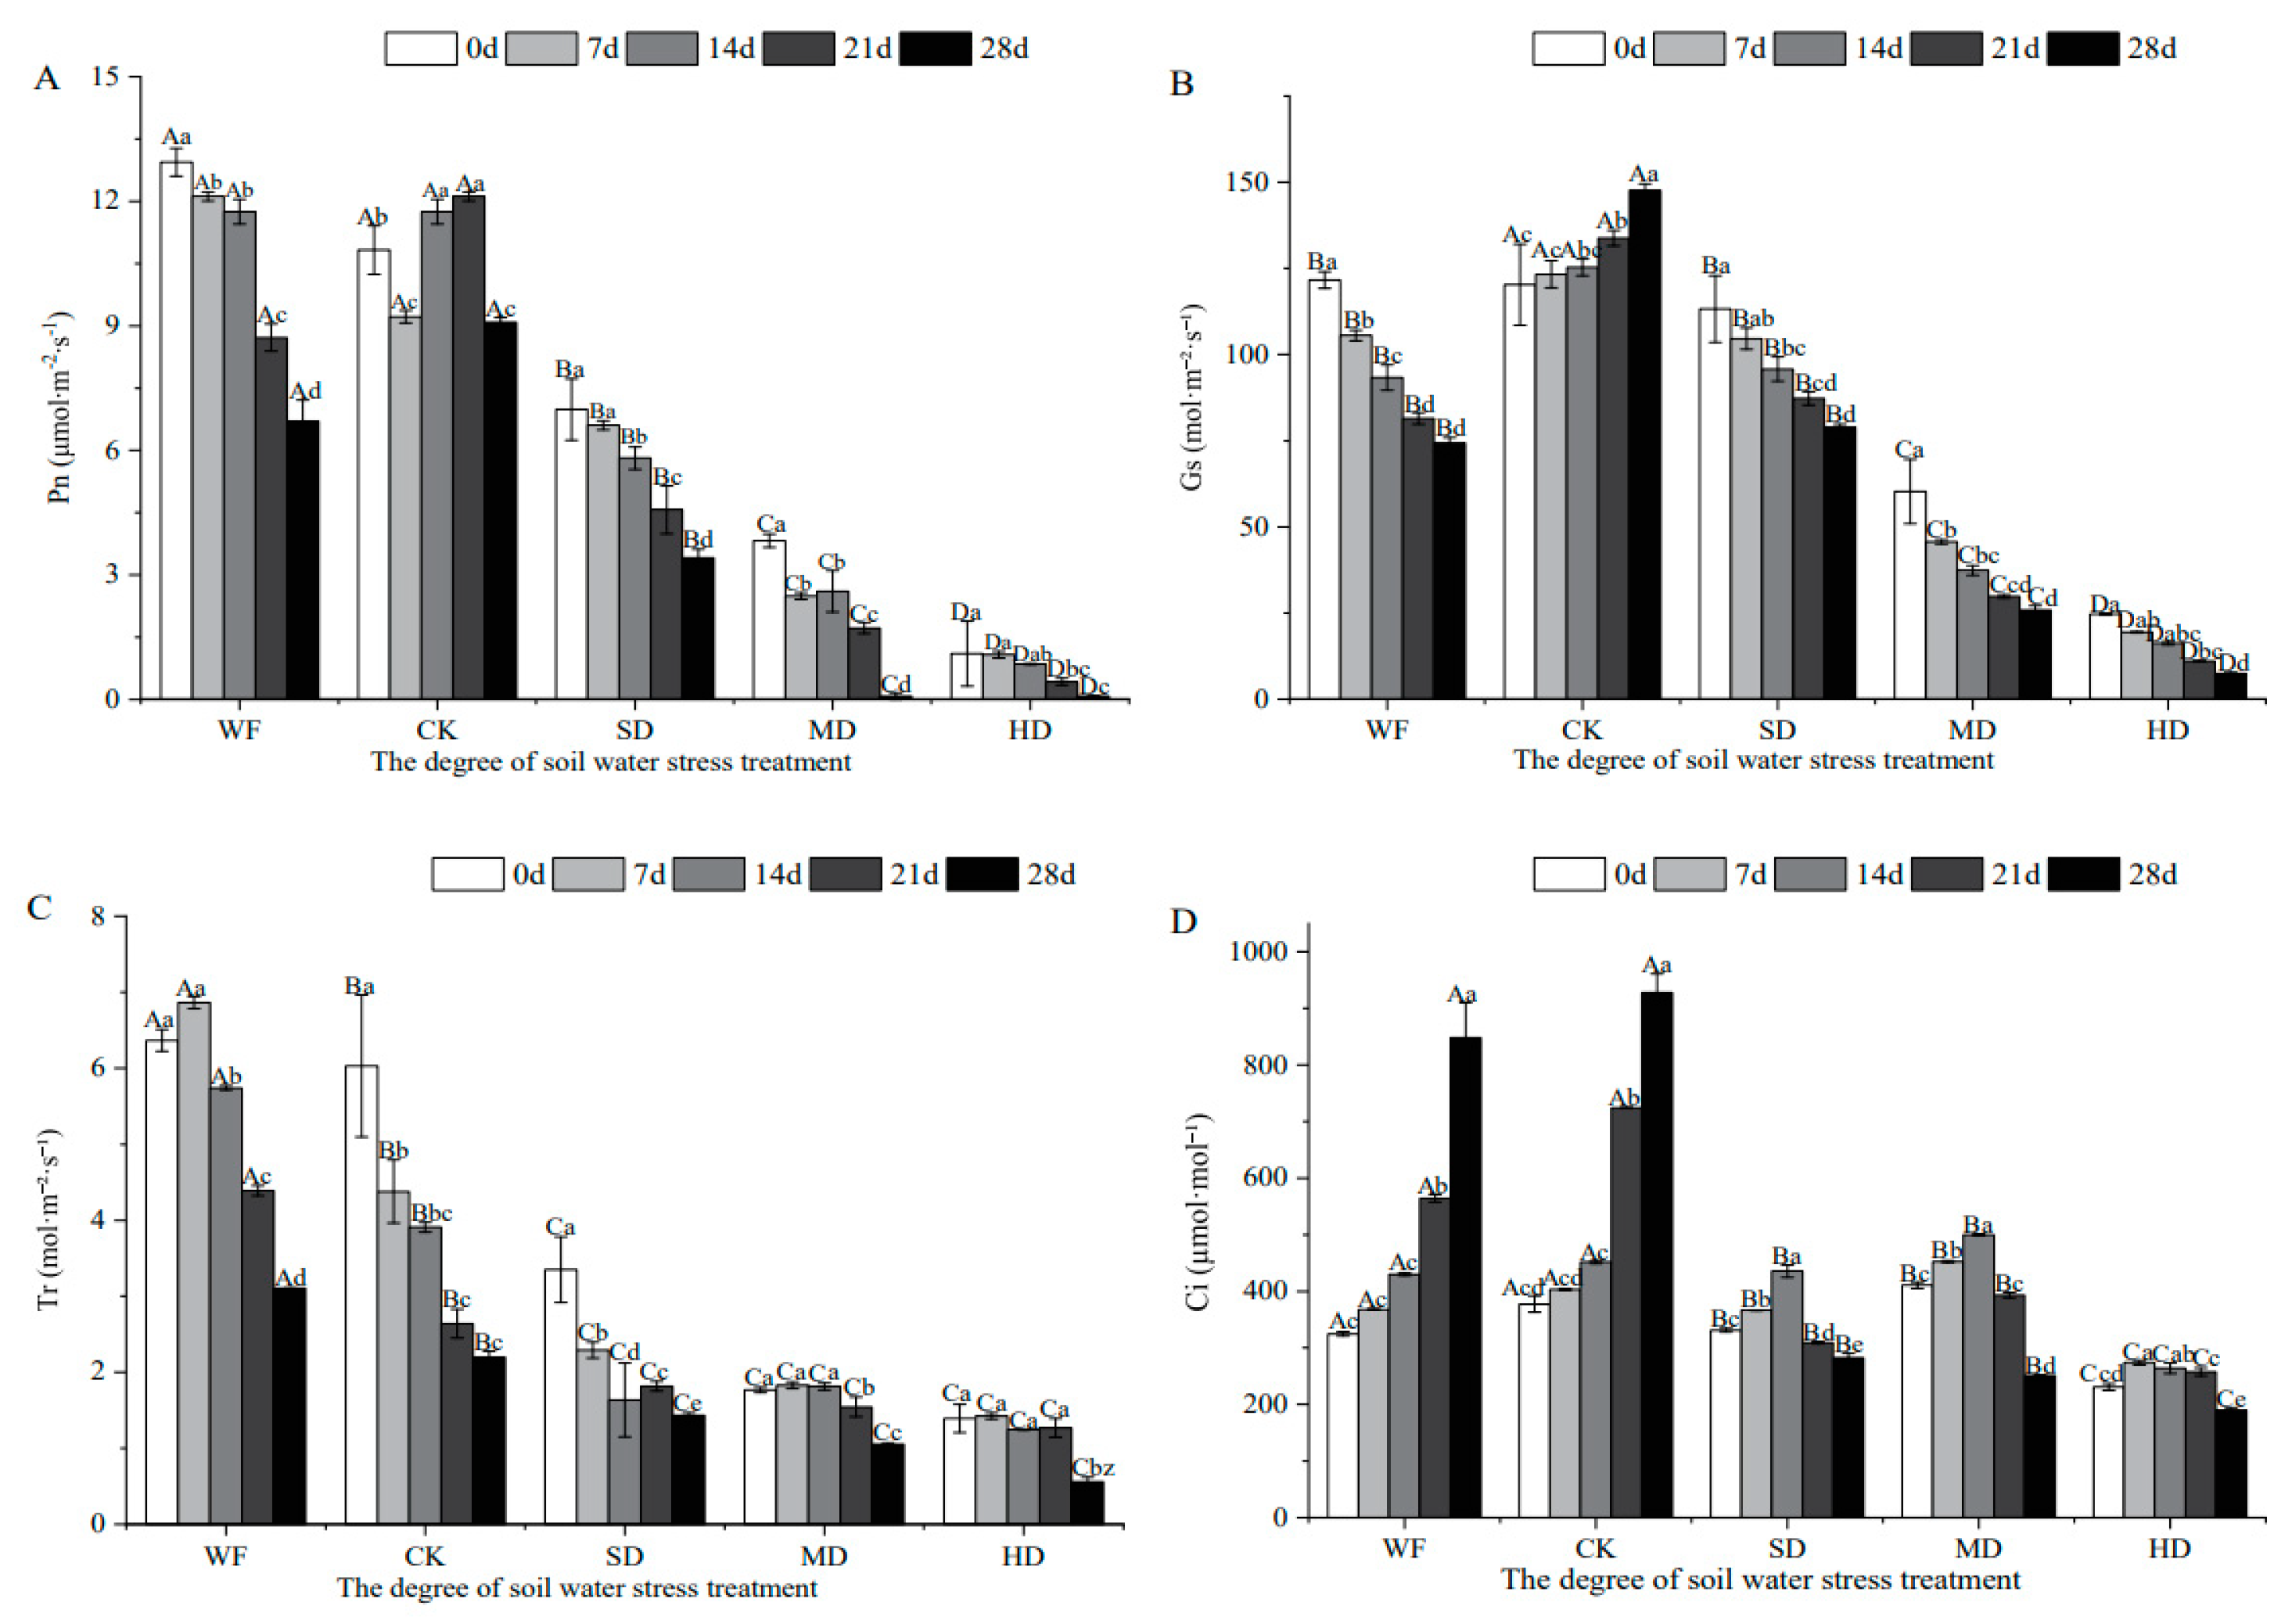
Figure 3.
Effects of water stress on chlorophyll fluorescence characteristics of C. retusus leaves. (A) Effects of water stress on Fv/Fm of C. retusus leaves; (B) Effects of water stress on ΦPSII of C. retusus leaves; (C) Effects of water stress on qP of C. retusus leaves; (D) Effects of water stress on ETR of C. retusus leaves. Upper-case letters represent the variations in different treatment groups, and lower-case letters represent the difference in stress days within the group (significant). See the caption for Figure 1 for an explanation of abbreviations.
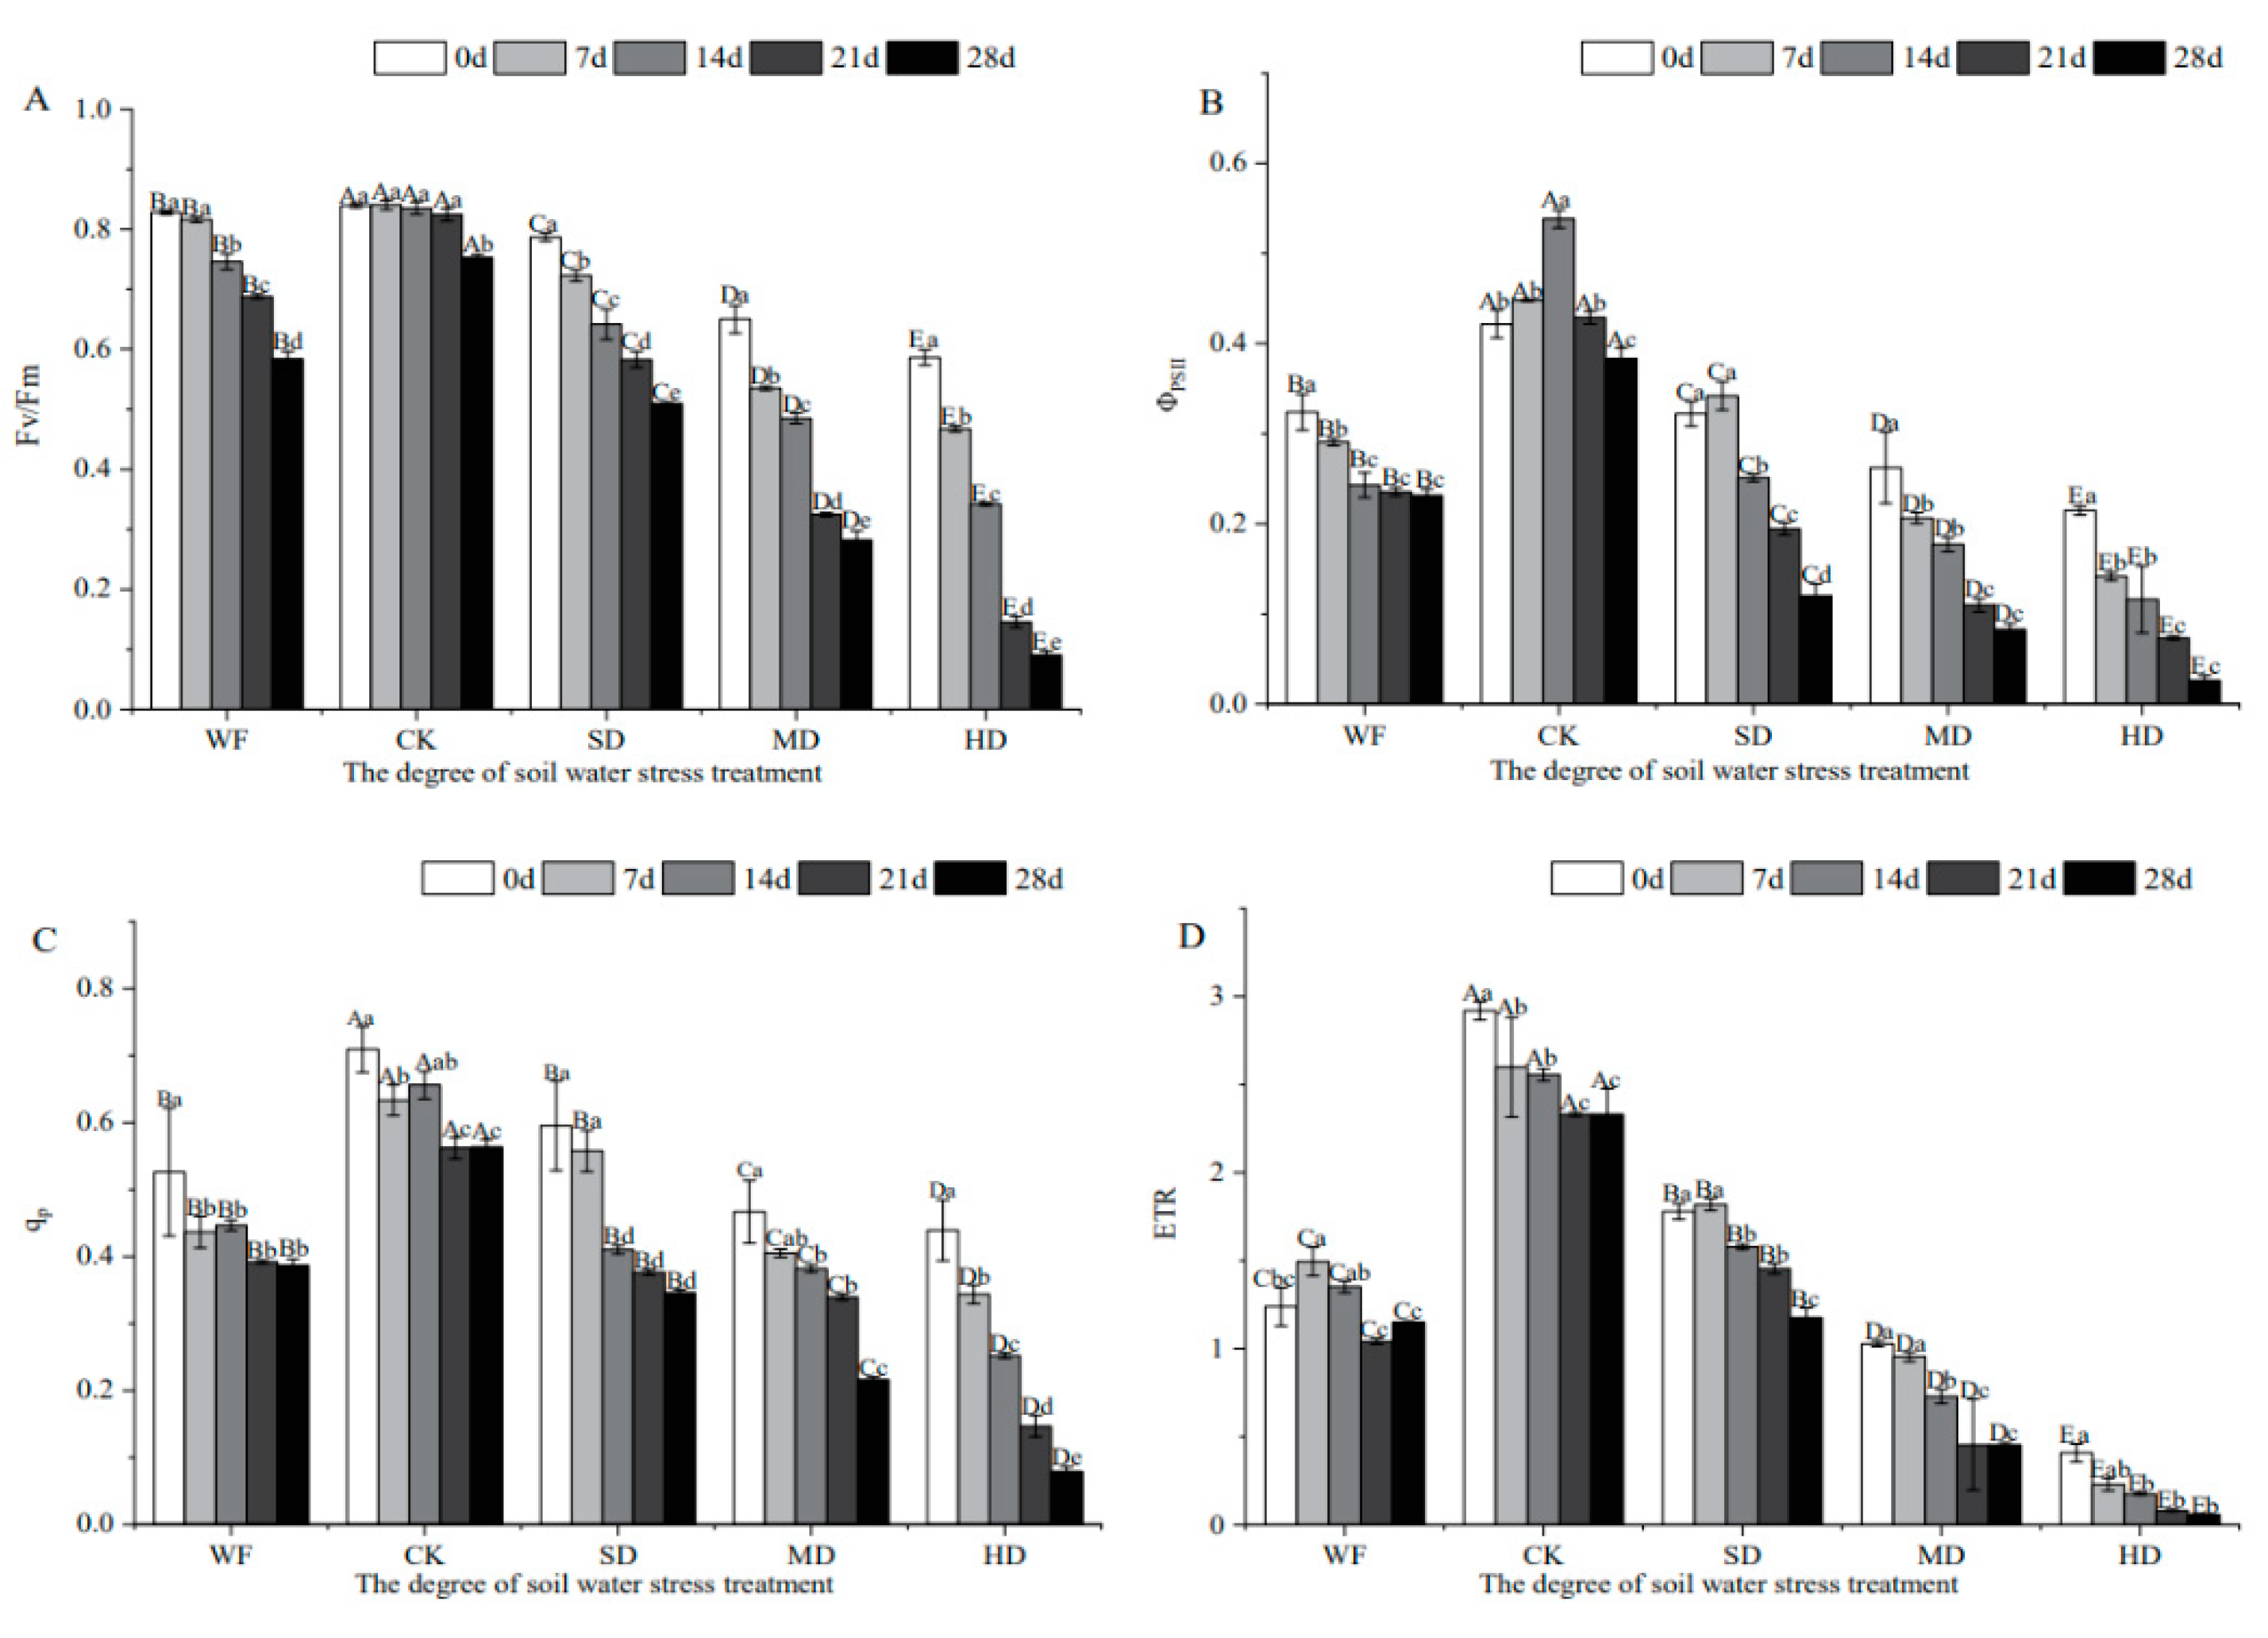
Figure 4.
Effects of water stress on protective enzyme activities of C. retusus leaves. (A) Effects of water stress on SOD activities of C. retusus leaves. (B) Effects of water stress on POD activities of C. retusus leaves. Upper-case letters represent the variations in different treatment groups, and lower-case letters represent the difference in stress days within the group (significant). See the caption for Figure 1 for an explanation of abbreviations.
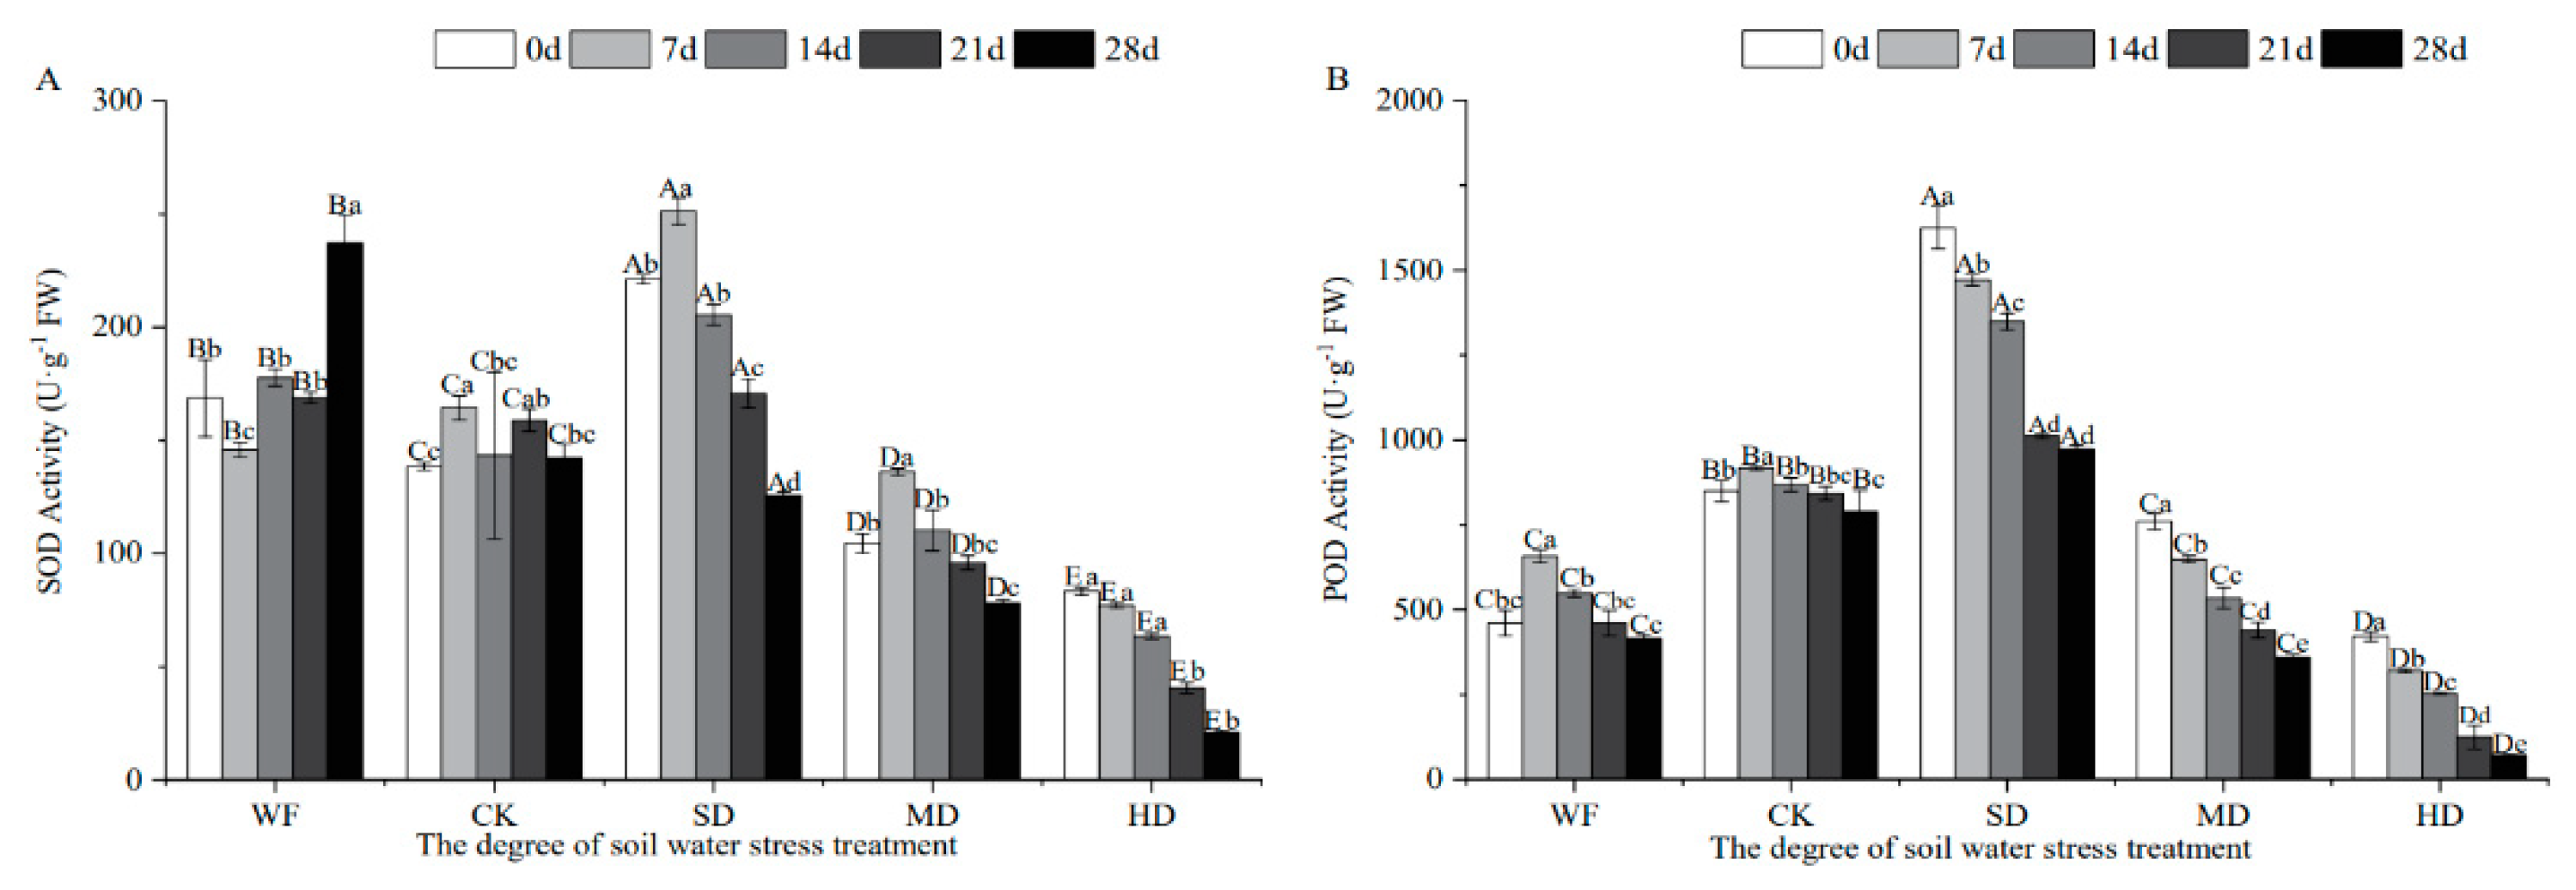
Figure 5.
Effects of water stress on malondialdehyde (MDA) content and osmoregulation substances of C. retusus leaves. (A) Effects of water stress on MDA content of C. retusus leaves; (B) Effects of water stress on Pro content of C. retusus leaves; Upper-case letters represent the variations in different treatment groups, and lower-case letters represent the difference in stress days within the group (significant). See the caption for Figure 1 for an explanation of abbreviations.

Figure 6.
Effect of water stress on the net photosynthetic rate of C. retusus leaves.
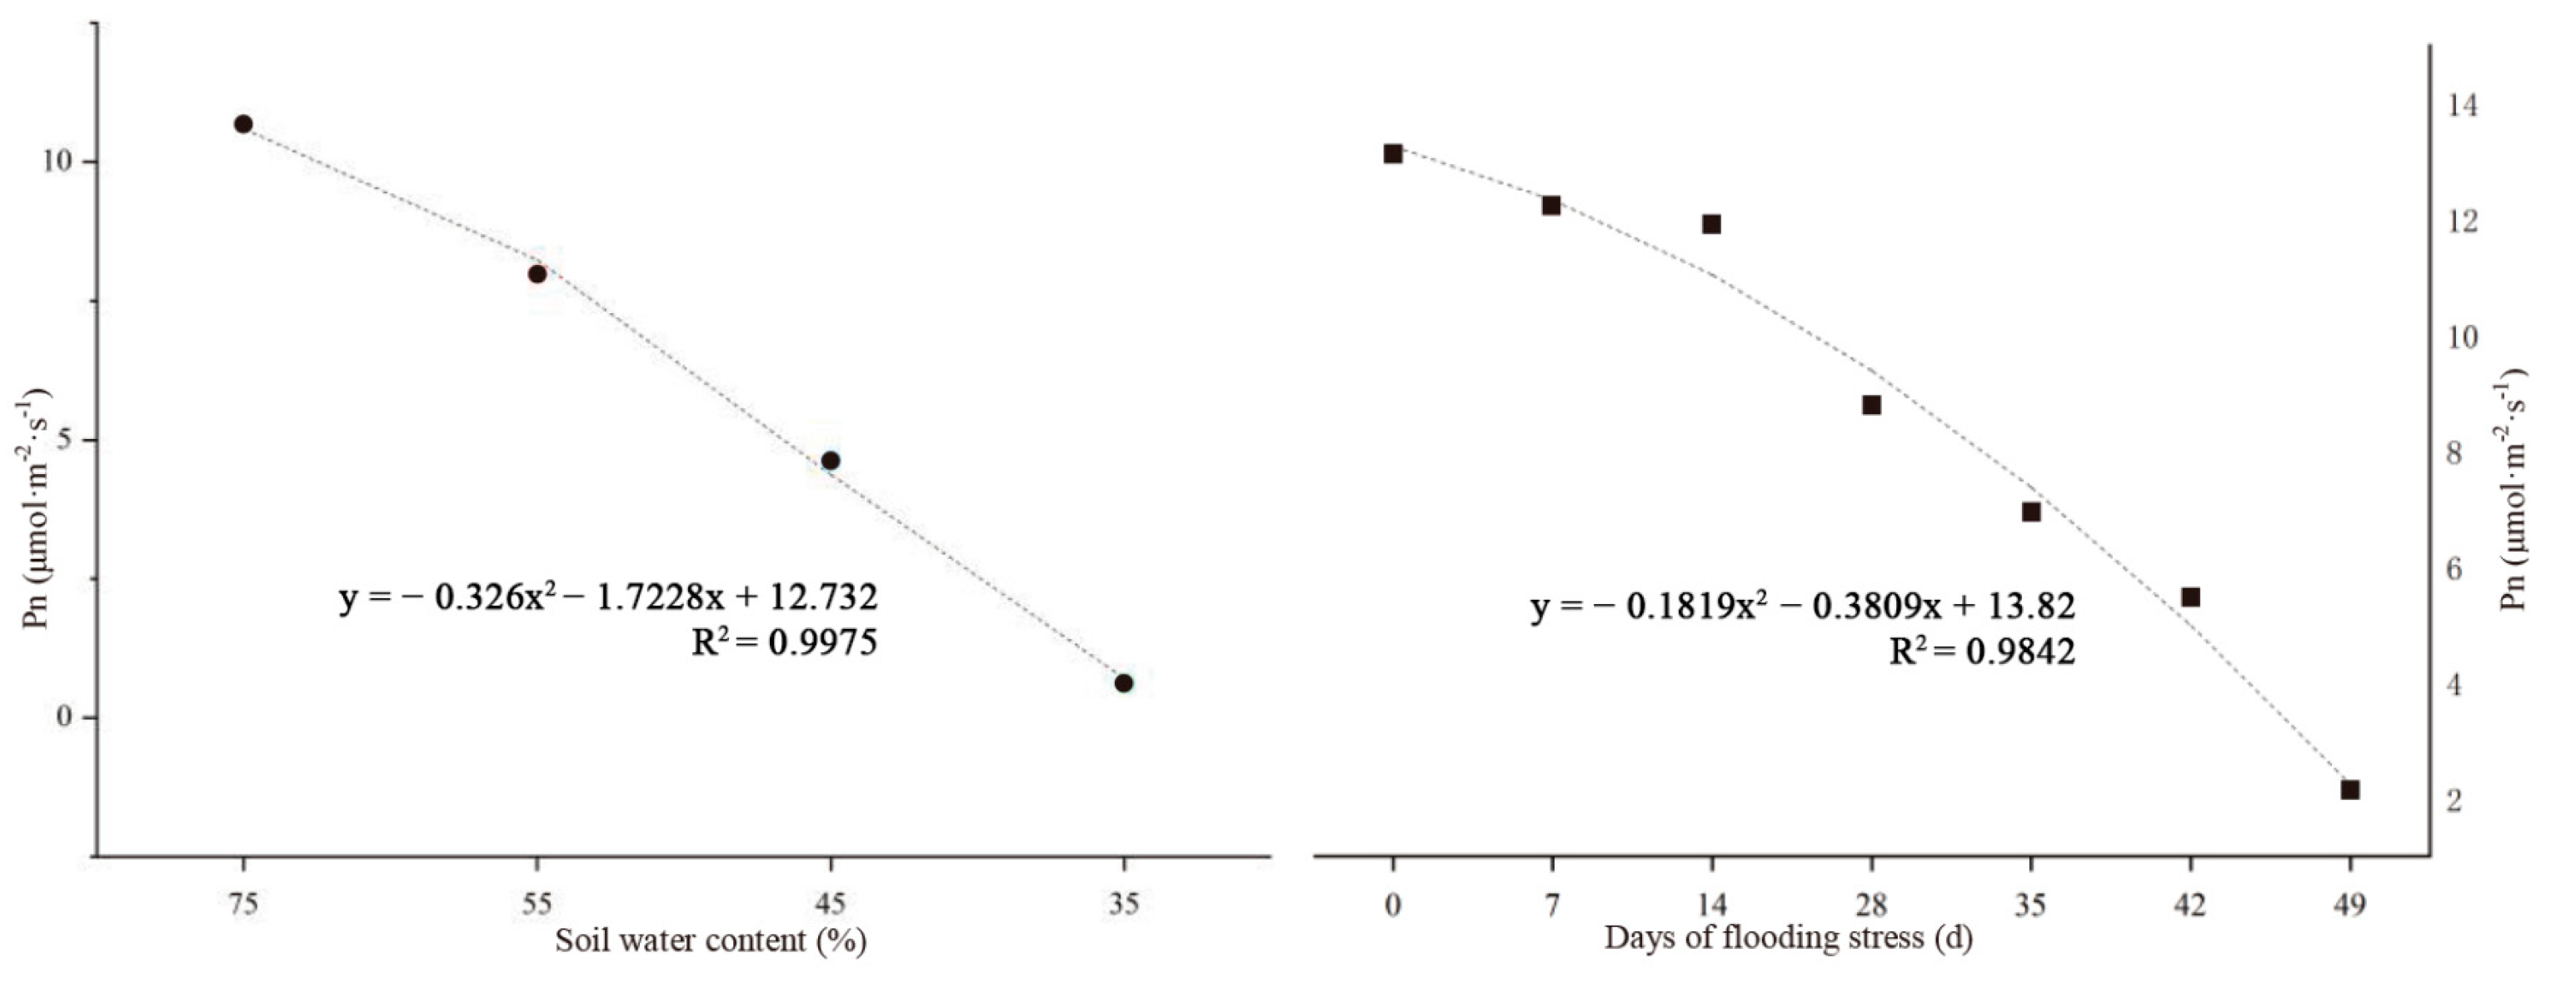
Figure 7.
Principal component score graphs of 12 indicators of different treatments for C. retusus. Red, orange, yellow, green and blue represent the principal component scores of different groups treated at days 0, 7, 14, 21, and 28 under different stress conditions, respectively. See the caption for Figure 1 for an explanation of abbreviations.
Disclaimer/Publisher’s Note: The statements, opinions and data contained in all publications are solely those of the individual author(s) and contributor(s) and not of MDPI and/or the editor(s). MDPI and/or the editor(s) disclaim responsibility for any injury to people or property resulting from any ideas, methods, instructions or products referred to in the content. |
© 2023 by the authors. Licensee MDPI, Basel, Switzerland. This article is an open access article distributed under the terms and conditions of the Creative Commons Attribution (CC BY) license (https://creativecommons.org/licenses/by/4.0/).
Share and Cite
MDPI and ACS Style
Niu, M.; Zhao, T.; Xu, D.; Liu, C.; Liu, Y.; Sun, M.; Xie, H.; Li, J. Physiological Responses of Chionanthus retusus Seedlings to Drought and Waterlogging Stresses. Forests 2023, 14, 429. https://doi.org/10.3390/f14020429
AMA Style
Niu M, Zhao T, Xu D, Liu C, Liu Y, Sun M, Xie H, Li J. Physiological Responses of Chionanthus retusus Seedlings to Drought and Waterlogging Stresses. Forests. 2023; 14(2):429. https://doi.org/10.3390/f14020429
Chicago/Turabian StyleNiu, Muge, Tianran Zhao, Dong Xu, Cuishuang Liu, Yuan Liu, Maotong Sun, Huicheng Xie, and Jihong Li. 2023. "Physiological Responses of Chionanthus retusus Seedlings to Drought and Waterlogging Stresses" Forests 14, no. 2: 429. https://doi.org/10.3390/f14020429
Note that from the first issue of 2016, this journal uses article numbers instead of page numbers. See further details here.