
Lipid Peroxidation, Antioxidant Enzyme Activities, and Osmotic Adjustment in Platycladus orientalis and Amorpha fruticosa Differ during Drought and Rewatering
 ,
, 
Abstract
:1. Introduction
2. Materials and Methods
2.1. Plant Material, Growth Conditions and Experimental Design
2.2. Physiological and Biochemical Traits Measurement
2.3. Data Analysis
3. Results
3.1. Effects of Drought Stress and Rewatering on Lipid Peroxidation
3.2. Effects of Drought Stress and Rewatering on Antioxidant Enzyme Activities
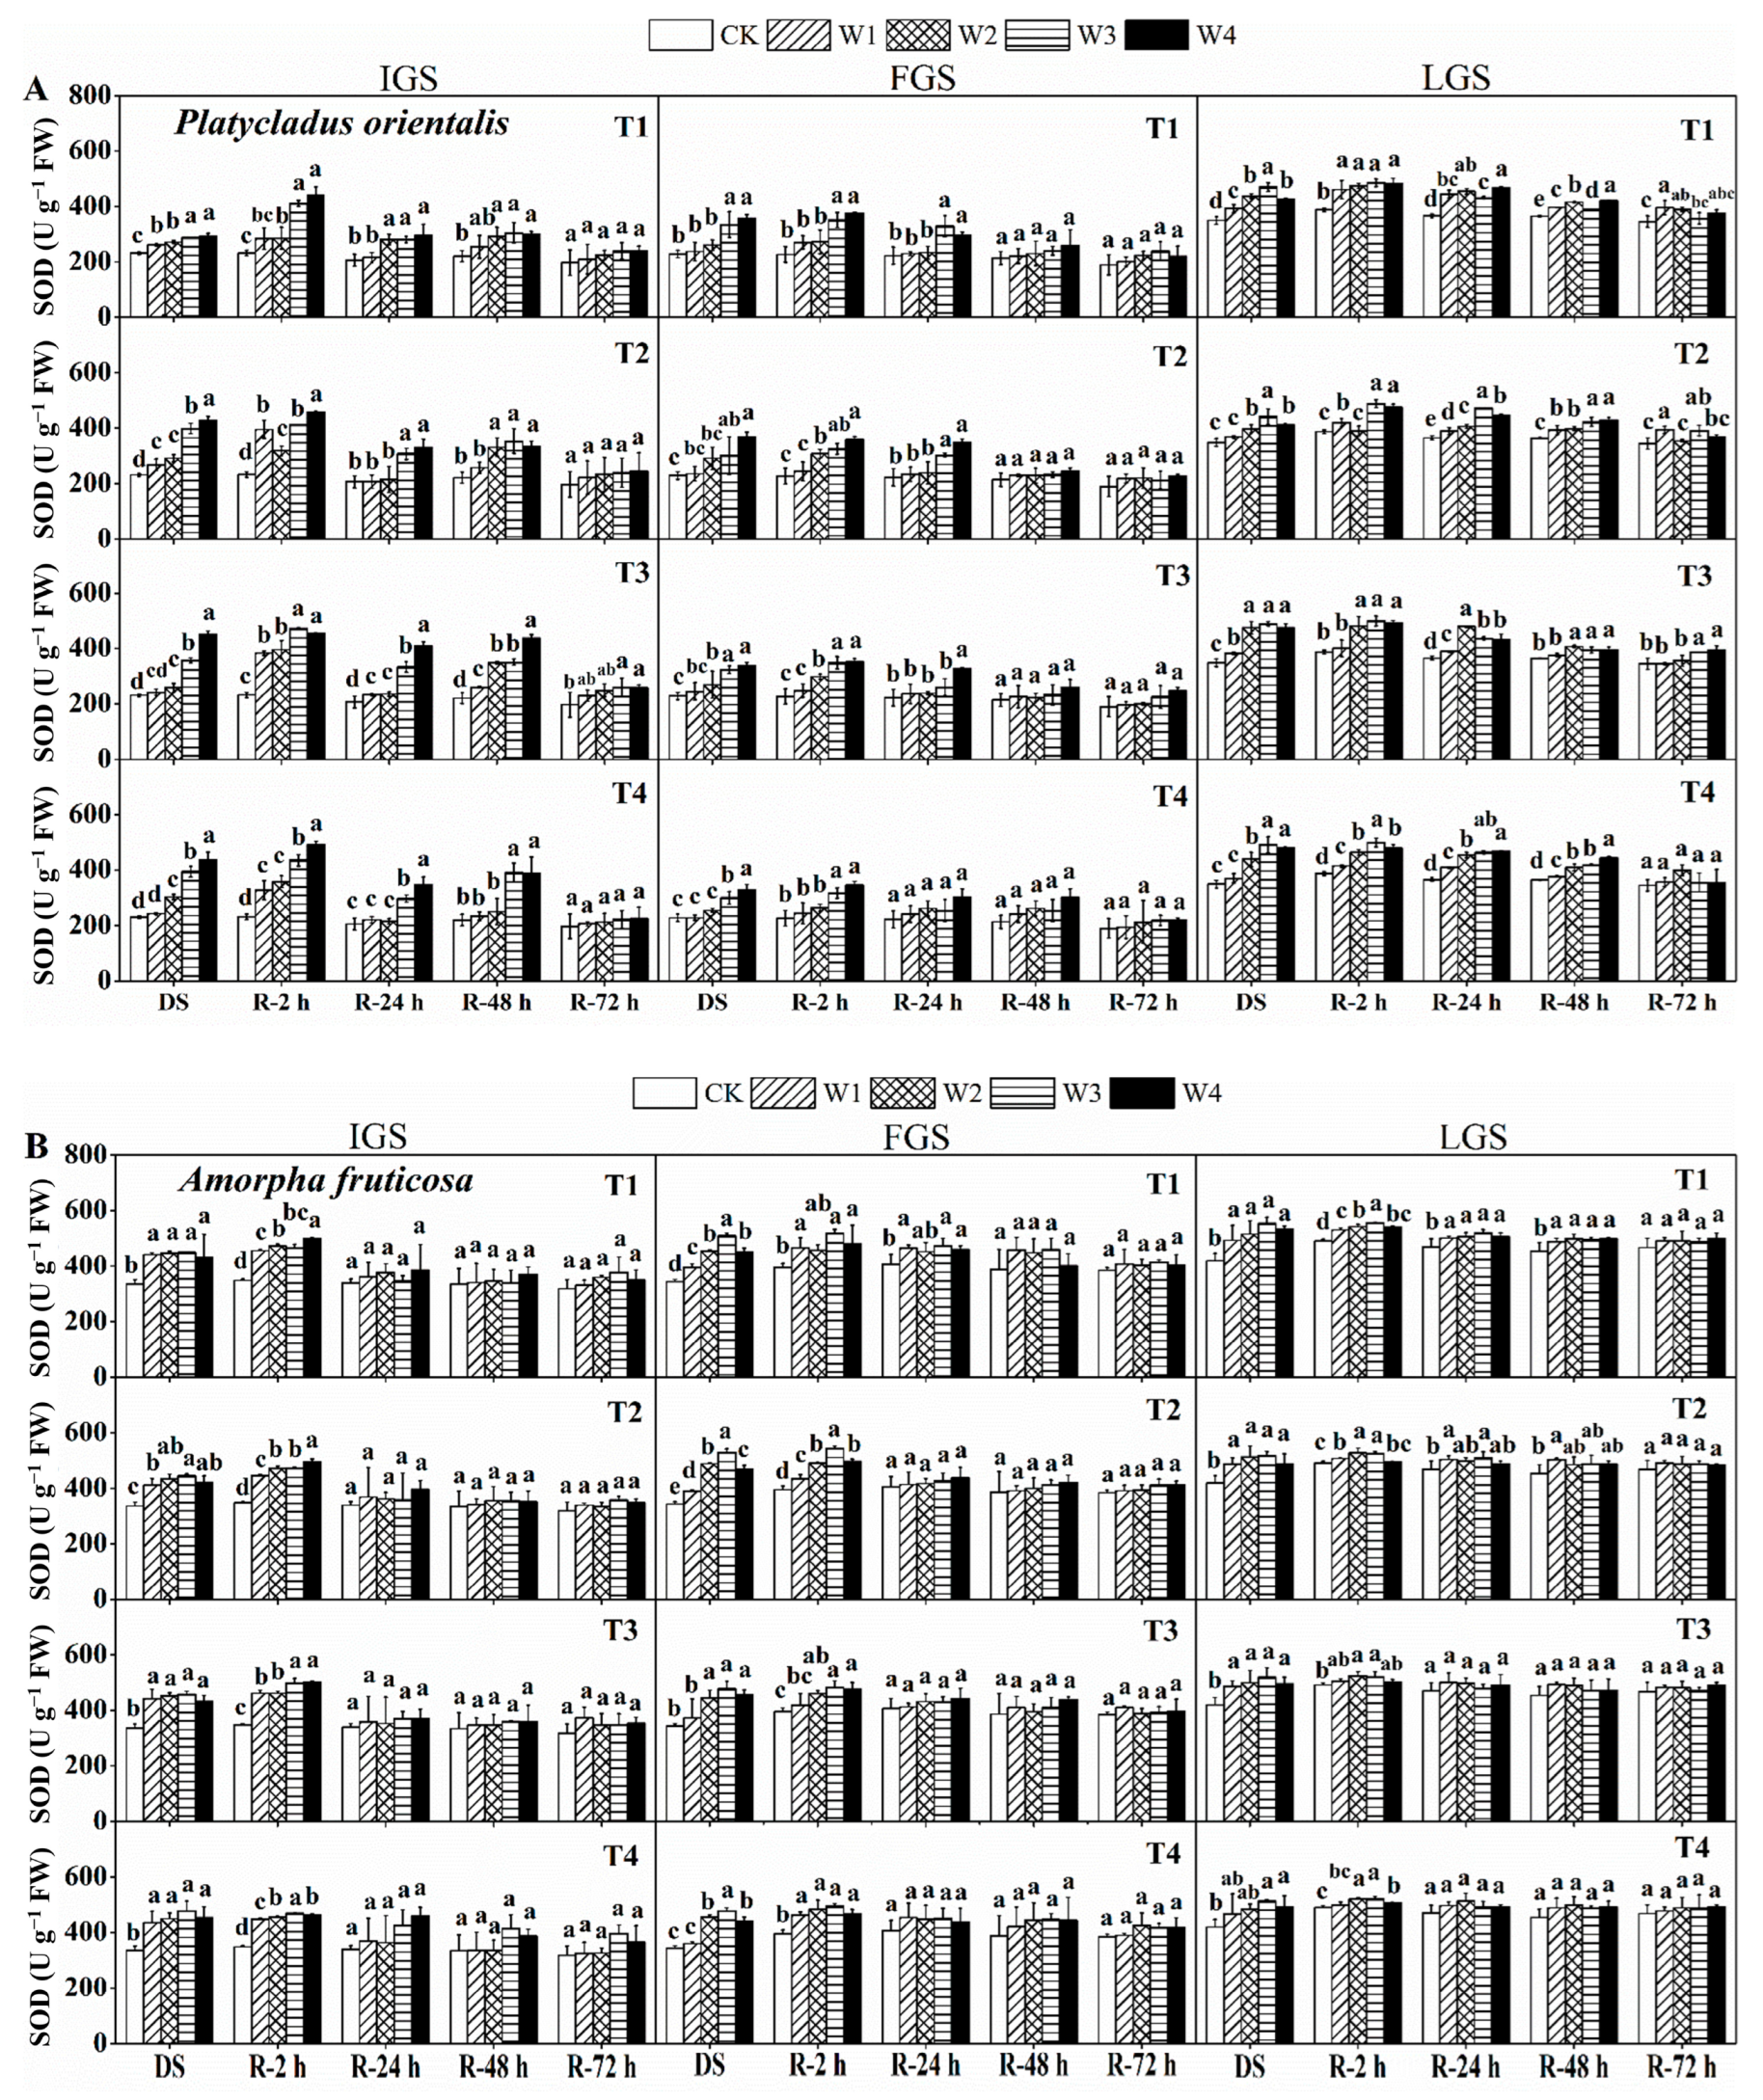
3.2.1. SOD Activity
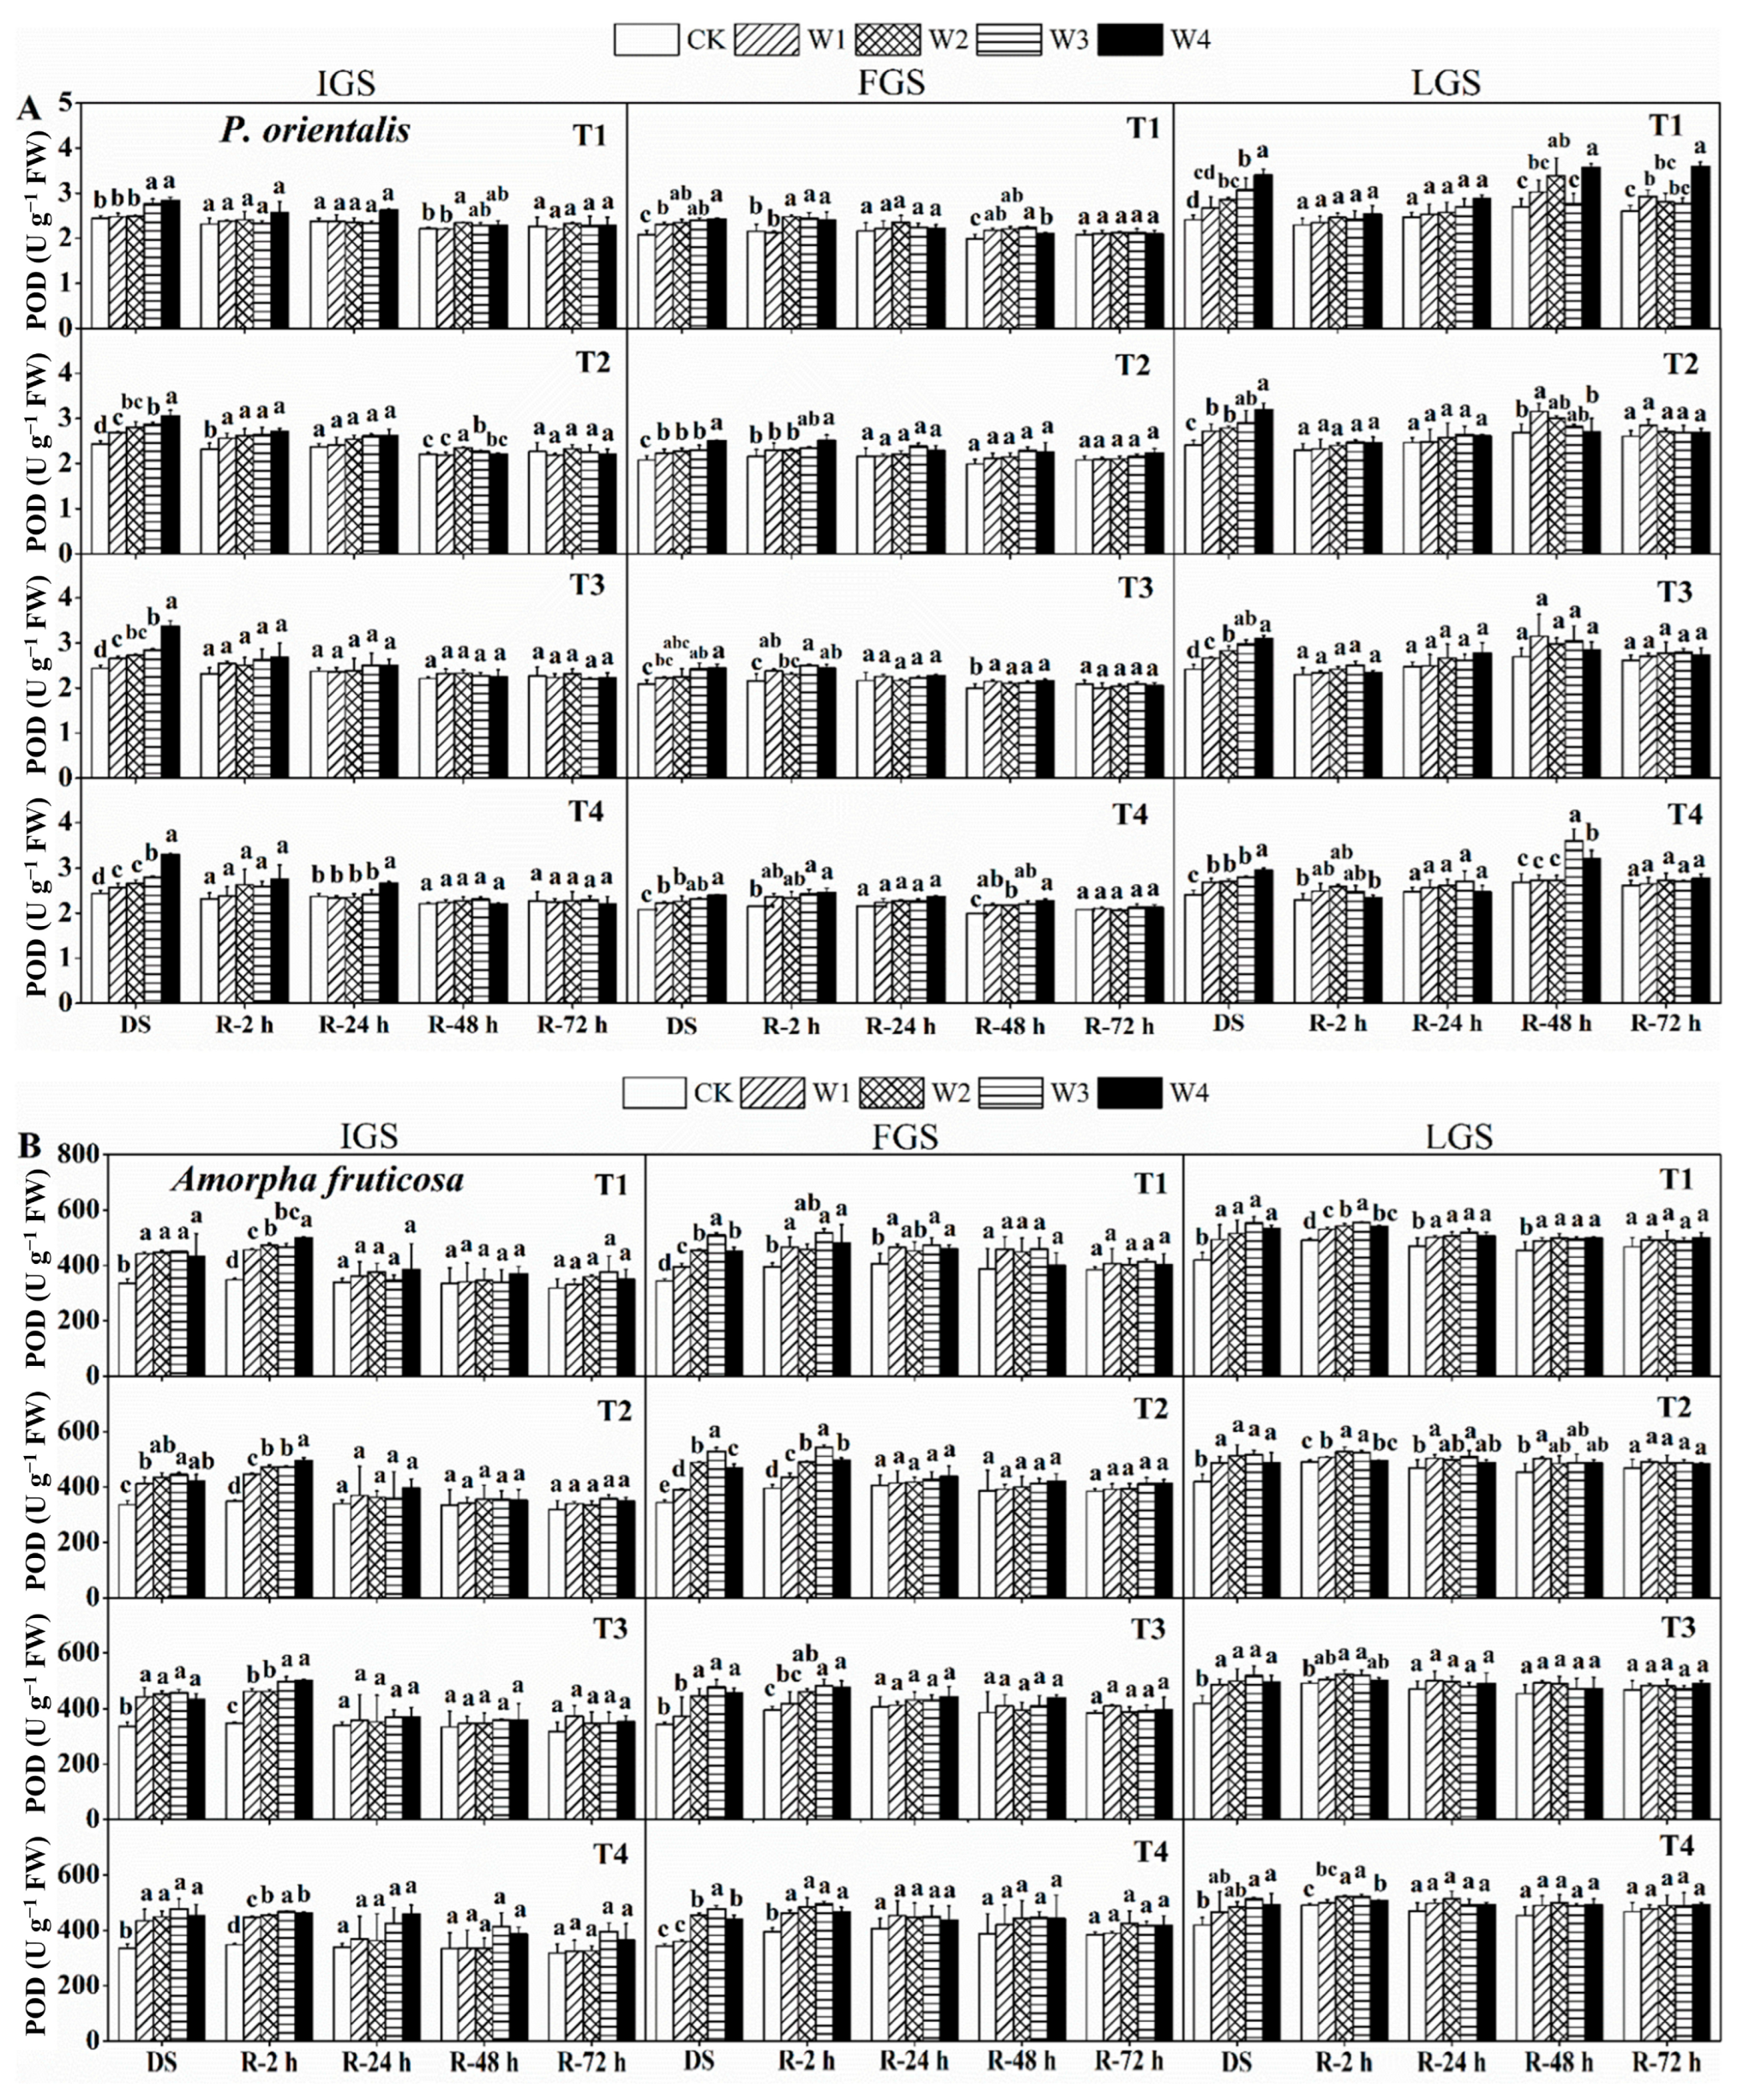
3.2.2. POD Activity
3.2.3. CAT Activity
3.3. Effects of Drought and Rewatering on Osmotic Solutes
3.3.1. Soluble Sugar Content
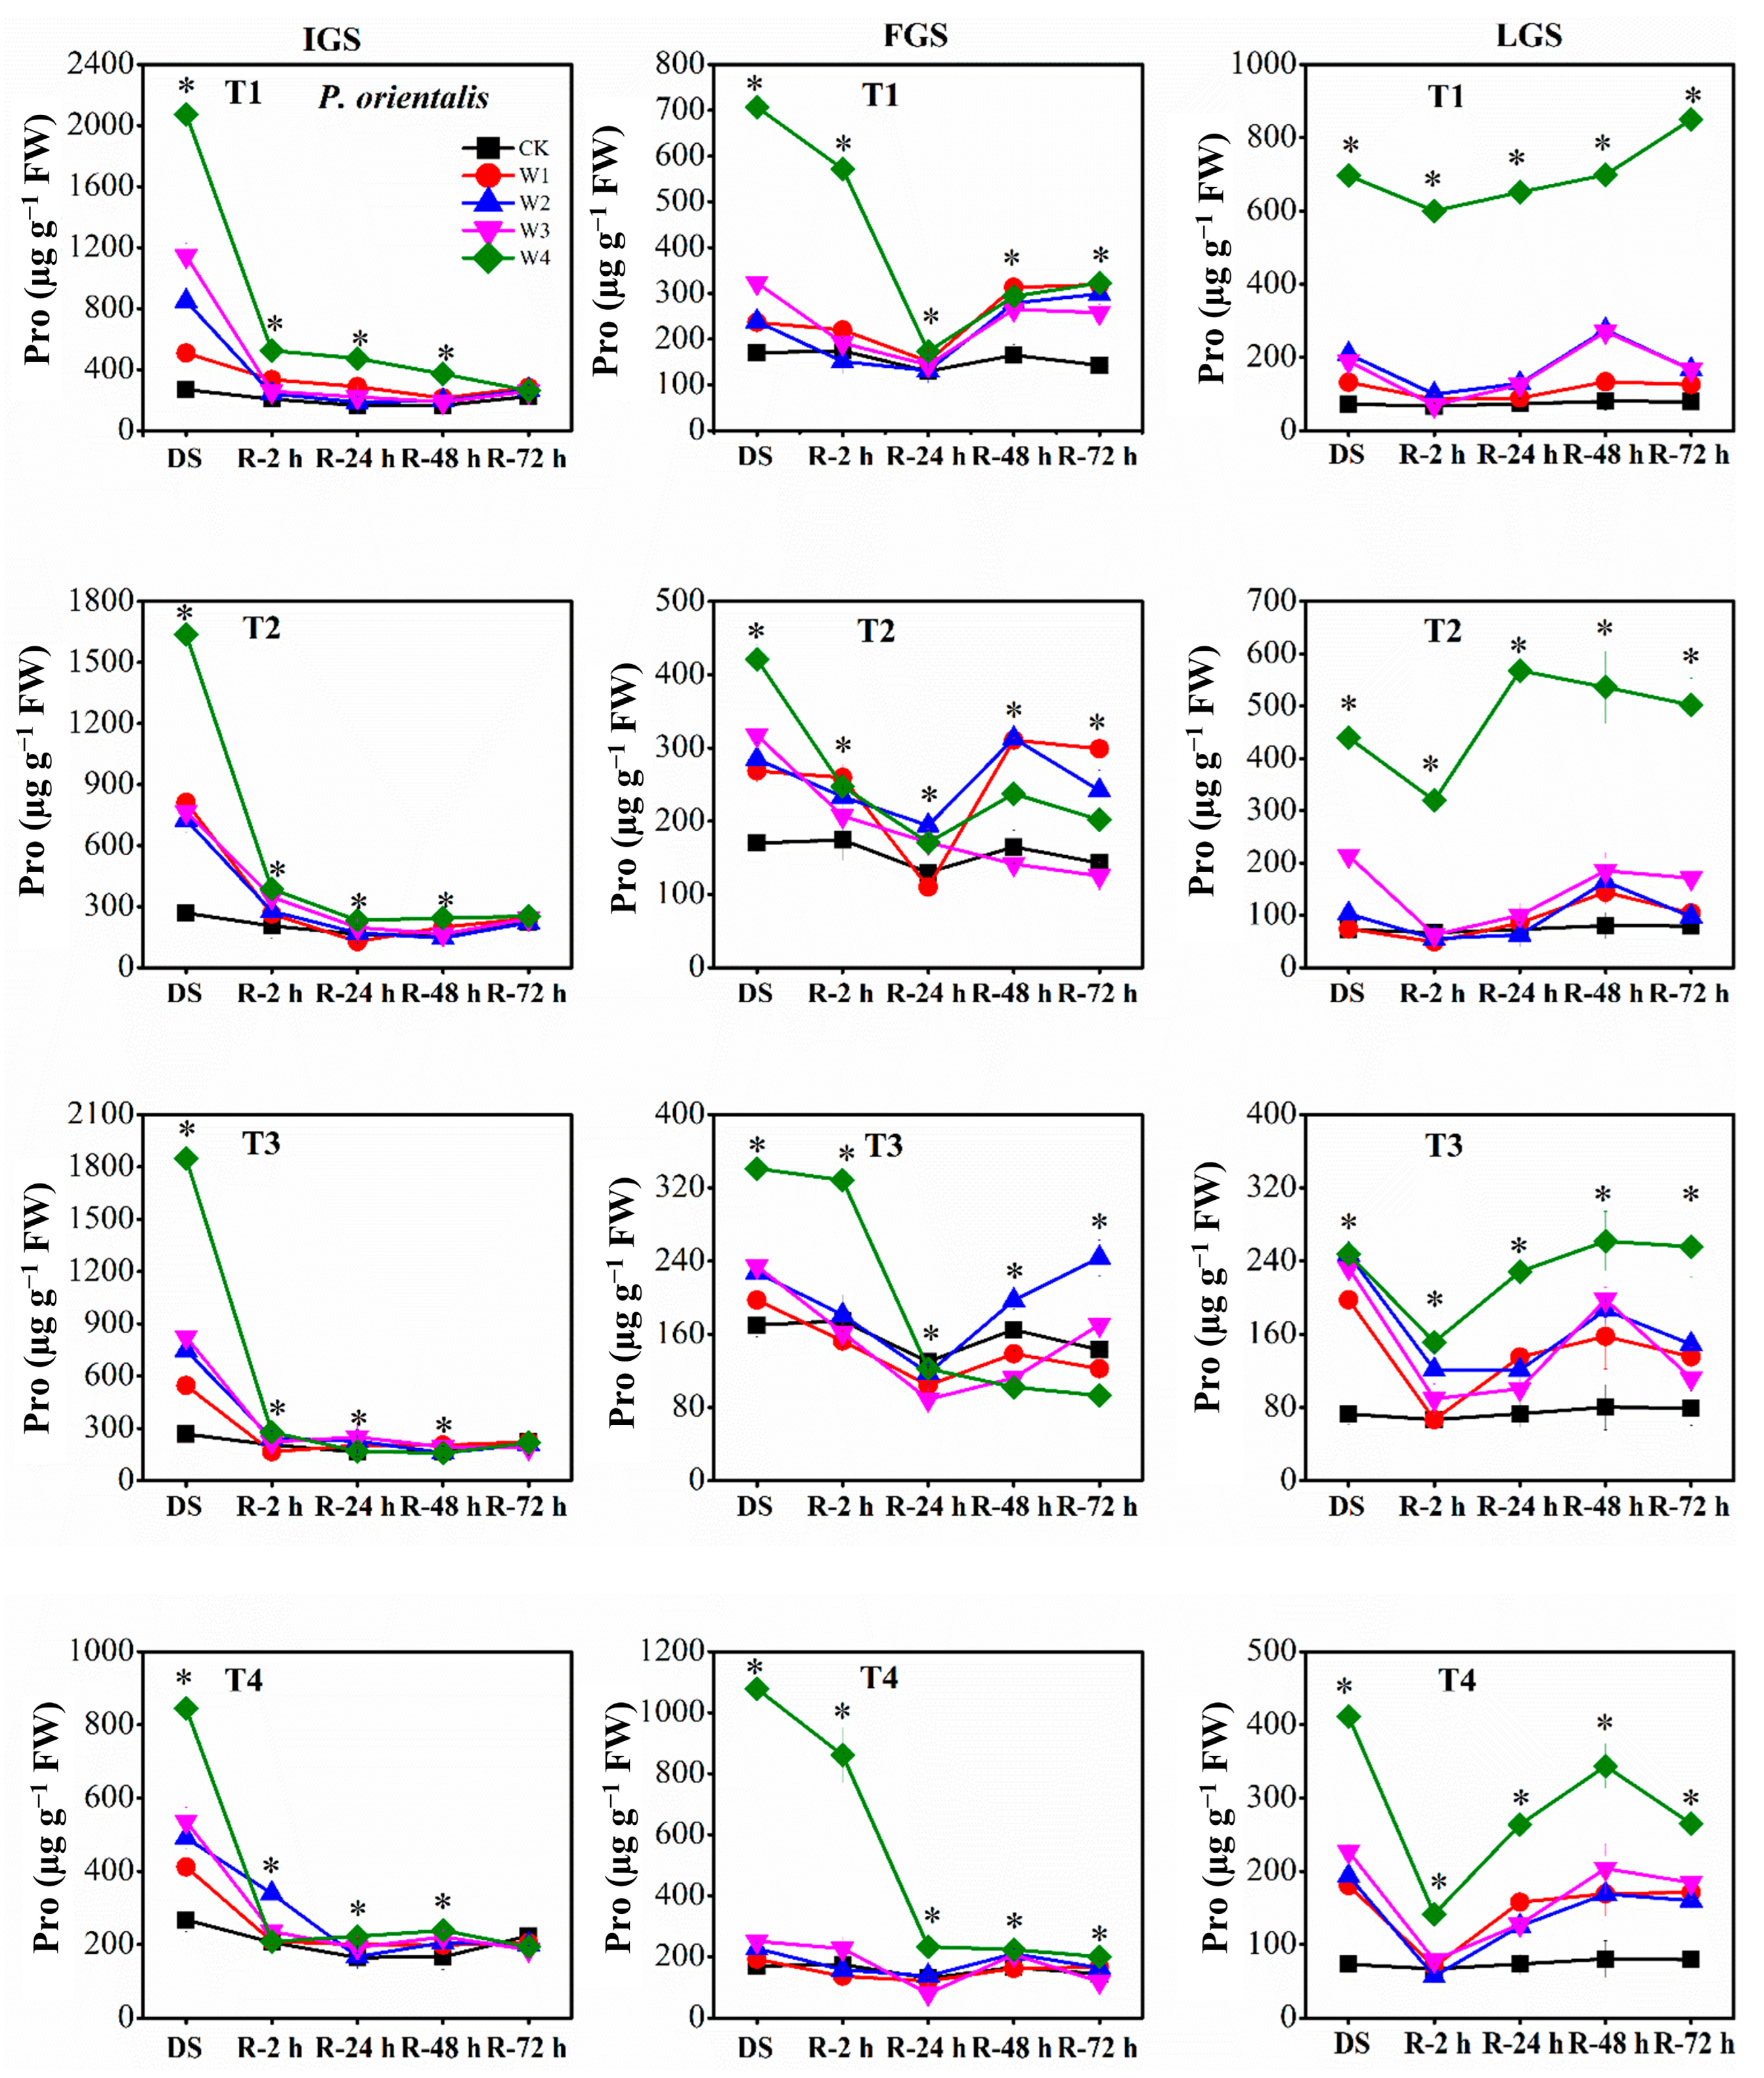
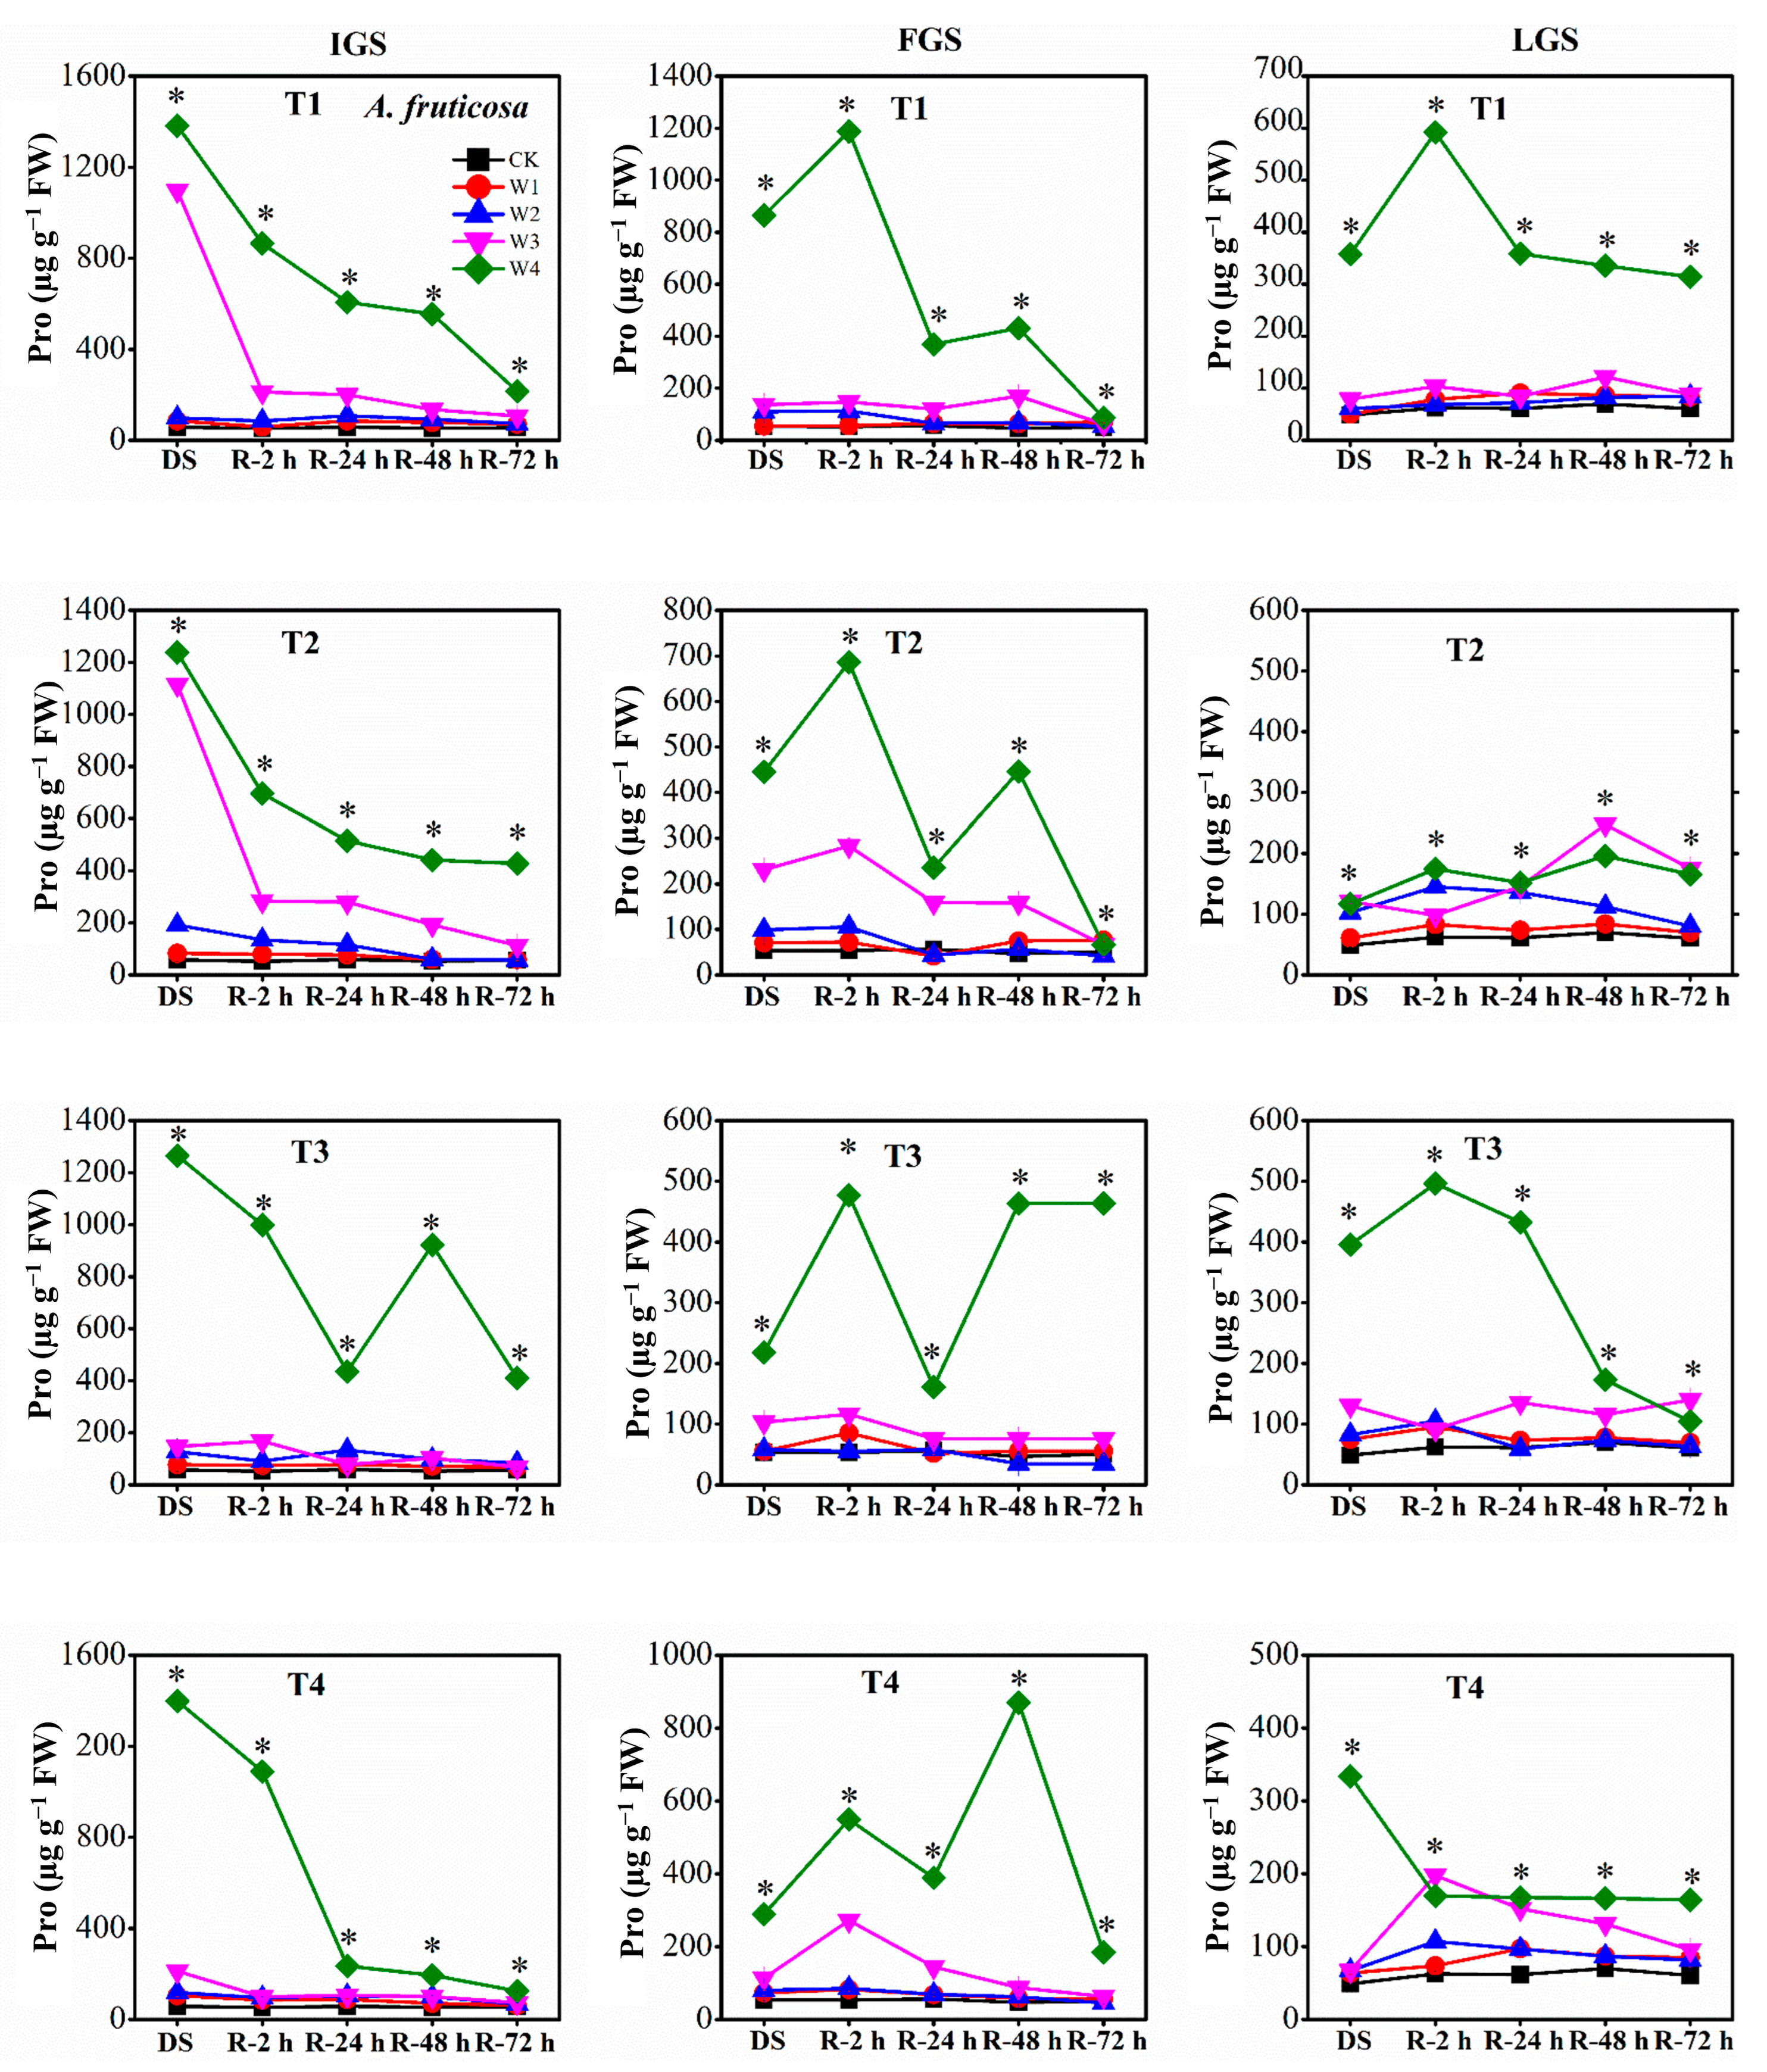
3.3.2. Proline Content
4. Discussion
5. Conclusions
Author Contributions
Funding
Data Availability Statement
Conflicts of Interest
References
- Trenberth, K.E.; Dai, A.; Van Der Schrier, G.; Jones, P.D.; Barichivich, J.; Briffa, K.R.; Sheffield, J. Global warming and changes in drought. Nat. Clim. Chang. 2014, 4, 17–22. [Google Scholar] [CrossRef]
- Cattivelli, L.; Rizza, F.; Badeck, F.W.; Mazzucotelli, E.; Mastrangelo, A.M.; Francia, E.; Marè, C.; Tondelli, A.; Stanca, A.M. Drought tolerance improvement in crop plants: An integrated view from breeding to genomics. Feild Crops Res. 2008, 105, 1–14. [Google Scholar] [CrossRef]
- Roy, R.; Mostofa, M.G.; Wang, J.; Fornara, D.; Sarker, T.; Zhang, R. Revegetation intervention of drought-prone coal-mined spoils using Caragana korshinskii under variable water and nitrogen-phosphorus resources. Agric. Water Manag. 2021, 246, 106712. [Google Scholar] [CrossRef]
- Roy, R.; Wang, J.; Mostofa, M.G.; Fornara, D. Optimal water and fertilizer applications improve growth of Tamarix chinensis in a coal mine degraded area under arid conditions. Physiol. Plant. 2021, 172, 371–390. [Google Scholar] [CrossRef]
- Shimpl, F.C.; Ferreira, M.J.; Jaquetti, R.K.; Martins, S.C.V.; de Carvalho Gonçalves, J.F. Physiological responses of young Brazil nut (Bertholletia excelsa) plants to drought stress and subsequent rewatering. Flora Morphol. Distrib. Funct. Ecol. Plants 2019, 252, 10–17. [Google Scholar] [CrossRef]
- Merwad, A.R.M.A.; Desoky, E.S.M.; Rady, M.M. Response of Water Deficit-Stressed Vigna Unguiculata Performances to Silicon, Proline or Methionine Foliar Application. Sci. Hortic. 2018, 228, 132–144. [Google Scholar] [CrossRef]
- Yan, W.; Zhong, Y.; Shangguan, Z. Rapid response of the carbon balance strategy in Robinia pseudoacacia and Amorpha fruticosa to recurrent drought. Environ. Exp. Bot. 2017, 138, 46–56. [Google Scholar] [CrossRef]
- Zhou, F.; Wang, J.; Yang, N. Growth responses, antioxidant enzyme activities and lead accumulation of Sophora japonica and Platycladus orientalis seedlings under Pb and water stress. Plant Growth Regul. 2015, 75, 383–389. [Google Scholar] [CrossRef]
- Cao, X.; Jia, J.; Zhang, C.; Li, H.; Liu, T.; Jiang, X.; Polle, A.; Peng, C.; Luo, Z. Bin Anatomical, physiological and transcriptional responses of two contrasting poplar genotypes to drought and re-watering. Physiol. Plant. 2014, 151, 480–494. [Google Scholar] [CrossRef] [PubMed]
- Chen, D.; Wang, S.; Cao, B.; Cao, D.; Leng, G.; Li, H.; Yin, L.; Shan, L.; Deng, X. Genotypic variation in growth and physiological response to drought stress and re-watering reveals the critical role of recovery in drought adaptation in maize seedlings. Front. Plant Sci. 2016, 6, 1–15. [Google Scholar] [CrossRef]
- Xu, Z.; Zhou, G.; Shimizu, H. Plant responses to drought and rewatering. Plant Signal. Behav. 2010, 5, 649–654. [Google Scholar] [CrossRef]
- Hamerlynck, E.P.; Smith, B.S.; Sheley, R.L.; Svejcar, T.J. Compensatory Photosynthesis, Water-Use Efficiency, and Biomass Allocation of Defoliated Exotic and Native Bunchgrass Seedlings. Rangel. Ecol. Manag. 2016, 69, 206–214. [Google Scholar] [CrossRef]
- Sun, C.; Gao, X.; Chen, X.; Fu, J.; Zhang, Y. Metabolic and growth responses of maize to successive drought and re-watering cycles. Agric. Water Manag. 2016, 172, 62–73. [Google Scholar] [CrossRef]
- Wang, X.L.; Wang, J.J.; Sun, R.H.; Hou, X.G.; Zhao, W.; Shi, J.; Zhang, Y.F.; Qi, L.; Li, X.L.; Dong, P.H.; et al. Correlation of the corn compensatory growth mechanism after post-drought rewatering with cytokinin induced by root nitrate absorption. Agric. Water Manag. 2016, 166, 77–85. [Google Scholar] [CrossRef]
- Roy, R.; Mostofa, M.G.; Wang, J.; Sikdar, A.; Sarker, T. Improvement of growth performance of Amorpha fruticosa under contrasting regime of water and fertilizer in coal-contaminated spoils using response surface methodology. BMC Plant Biol. 2020, 20, 1–15. [Google Scholar] [CrossRef]
- Zheng, H.; Zhang, X.; Ma, W.; Song, J.; Rahman, S.U.; Wang, J.; Zhang, Y. Morphological and physiological responses to cyclic drought in two contrasting genotypes of Catalpa bungei. Environ. Exp. Bot. 2017, 138, 77–87. [Google Scholar] [CrossRef]
- Yan, W.; Zheng, S.; Zhong, Y.; Shangguan, Z. Contrasting dynamics of leaf potential and gas exchange during progressive drought cycles and recovery in Amorpha fruticosa and Robinia pseudoacacia. Sci. Rep. 2017, 7, 1–12. [Google Scholar] [CrossRef]
- Wang, L.; Dai, Y.; Sun, J.; Wan, X. Differential hydric deficit responses of Robinia pseudoacacia and Platycladus orientalis in pure and mixed stands in northern China and the species interactions under drought. Trees-Struct. Funct. 2017, 31, 2011–2021. [Google Scholar] [CrossRef]
- Aliarab, A.; Vazifekhah, E.O.; Sadati, S.E. Effect of soil moisture content and nitrogen fertilizer on survival, growth and some physiological characteristics of Platycladus orientalis seedlings. J. For. Sci. 2020, 66, 511–523. [Google Scholar] [CrossRef]
- Ben Hamed, S.; Lefi, E.; Chaieb, M. Physiological responses of Pistacia vera L. versus Pistacia atlantica Desf. to water stress conditions under arid bioclimate in Tunisia. Sci. Hortic. 2016, 203, 224–230. [Google Scholar] [CrossRef]
- Wang, Y.; Pan, F.; Wang, G.; Zhang, G.; Wang, Y.; Chen, X.; Mao, Z. Effects of biochar on photosynthesis and antioxidative system of Malus hupehensis Rehd. seedlings under replant conditions. Sci. Hortic. 2014, 175, 9–15. [Google Scholar] [CrossRef]
- Roy, R.; Wang, J.; Golam, M.; Fornara, D.; Sikdar, A.; Sarker, T.; Wang, X.; Shah, M. Fine-tuning of soil water and nutrient fertilizer levels for the ecological restoration of coal-mined spoils using Elaeagnus angustifolia. J. Environ. Manag. 2020, 270, 110855. [Google Scholar] [CrossRef] [PubMed]
- Ekmekci, Y.; Terzioglu, S. Effects of oxidative stress induced by paraquat on wild and cultivated wheats. Pestic. Biochem. Physiol. 2005, 83, 69–81. [Google Scholar] [CrossRef]
- Beers, R.F.; Sizer, I.W. A spectrophotometric method for measuring the breakdown of Hydrogen Peroxide. J. Biol. Chem. 1952, 195, 133–140. [Google Scholar] [CrossRef] [PubMed]
- Joseph, H.R. The determination of sugar in blood and spinal fluid with anthrone reagent. J. Biol. Chem. 1955, 212, 335–343. [Google Scholar] [CrossRef]
- Bates, L.S.; Waldren, R.P.; Teare, I.D. Rapid determination of free proline for water-stress studies. Plant Soil 1973, 39, 205–207. [Google Scholar] [CrossRef]
- Khoyerdi, F.F.; Shamshiri, M.H.; Estaji, A. Changes in some physiological and osmotic parameters of several pistachio genotypes under drought stress. Sci. Hortic. 2016, 198, 44–51. [Google Scholar] [CrossRef]
- Kong, X.; Wei, B.; Gao, Z.; Zhou, Y.; Shi, F.; Zhou, X.; Zhou, Q.; Ji, S. Changes in Membrane Lipid Composition and Function Accompanying Chilling Injury in Bell Peppers. Plant Cell Physiol. 2018, 59, 167–178. [Google Scholar] [CrossRef]
- Khaleghi, A.; Naderi, R.; Brunetti, C.; Maserti, B.E.; Salami, S.A.; Babalar, M. Morphological, physiochemical and antioxidant responses of Maclura pomifera to drought stress. Sci. Rep. 2019, 9, 19250. [Google Scholar] [CrossRef]
- Goodarzian Ghahfarokhi, M.; Mansurifar, S.; Taghizadeh-Mehrjardi, R.; Saeidi, M.; Jamshidi, A.M.; Ghasemi, E. Effects of drought stress and rewatering on antioxidant systems and relative water content in different growth stages of maize (Zea mays L.) hybrids. Arch. Agron. Soil Sci. 2015, 61, 493–506. [Google Scholar] [CrossRef]
- Roy, R.; Mahboob, M.G.; Arena, C.; Kader, M.A.; Sultana, S.; Hasan, A.K.; Wang, J.; Sarker, T.; Zhang, R.; Barmon, M. The Modulation of Water, Nitrogen, and Phosphorous Supply for Growth Optimization of the Evergreen Shrubs Ammopiptanthus mongolicus for Revegetation Purpose. Front. Plant Sci. 2021, 12, 1–12. [Google Scholar] [CrossRef] [PubMed]
- Roy, R.; Nú˜nez-Delgado, A.; Sultana, S.; Wang, J.; Munir, A.; Battaglia, M.L.; Sarker, T.; Seleiman, M.F.; Barmon, M.; Zhang, R. Additions of optimum water, spent mushroom compost and wood biochar to improve the growth performance of Althaea rosea in drought-prone coal-mined spoils. J. Environ. Manag. 2021, 295, 113076. [Google Scholar] [CrossRef] [PubMed]
- Liu, J.; Zhang, R.; Zhang, G.; Guo, J.; Dong, Z. Effects of soil drought on photosynthetic traits and antioxidant enzyme activities in Hippophae rhamnoides seedlings. J. For. Res. 2017, 28, 255–263. [Google Scholar] [CrossRef]
- Hasanuzzaman, M.; Hossain, M.A.; Da Silva, J.A.T.; Fujita, M. Plant response and tolerance to abiotic oxidative stress: Antioxidant defense is a key factor. In Crop Stress and Its Management: Perspectives and Strategies; Springer Science & Business Media: Berlin, Germany, 2012; pp. 261–315. ISBN 9789400722200. [Google Scholar]
- Couchoud, M.; Salon, C.; Girodet, S.; Jeudy, C.; Vernoud, V.; Prudent, M. Pea Efficiency of Post-drought Recovery Relies on the Strategy to Fine-Tune Nitrogen Nutrition. Front. Plant Sci. 2020, 11, 204. [Google Scholar] [CrossRef]
- Abid, M.; Ali, S.; Qi, L.K.; Zahoor, R.; Tian, Z.; Jiang, D.; Snider, J.L.; Dai, T. Physiological and biochemical changes during drought and recovery periods at tillering and jointing stages in wheat (Triticum aestivum L.). Sci. Rep. 2018, 8, 4615. [Google Scholar] [CrossRef] [PubMed]


Disclaimer/Publisher’s Note: The statements, opinions and data contained in all publications are solely those of the individual author(s) and contributor(s) and not of MDPI and/or the editor(s). MDPI and/or the editor(s) disclaim responsibility for any injury to people or property resulting from any ideas, methods, instructions or products referred to in the content. |
© 2023 by the authors. Licensee MDPI, Basel, Switzerland. This article is an open access article distributed under the terms and conditions of the Creative Commons Attribution (CC BY) license (https://creativecommons.org/licenses/by/4.0/).
Share and Cite
Feng, S.; Sultana, S.; Sikdar, A.; Roy, R.; Wang, J.; Huang, Y. Lipid Peroxidation, Antioxidant Enzyme Activities, and Osmotic Adjustment in Platycladus orientalis and Amorpha fruticosa Differ during Drought and Rewatering. Forests 2023, 14, 1019. https://doi.org/10.3390/f14051019
Feng S, Sultana S, Sikdar A, Roy R, Wang J, Huang Y. Lipid Peroxidation, Antioxidant Enzyme Activities, and Osmotic Adjustment in Platycladus orientalis and Amorpha fruticosa Differ during Drought and Rewatering. Forests. 2023; 14(5):1019. https://doi.org/10.3390/f14051019
Chicago/Turabian StyleFeng, Shulin, Shirin Sultana, Ashim Sikdar, Rana Roy, Jinxin Wang, and You Huang. 2023. "Lipid Peroxidation, Antioxidant Enzyme Activities, and Osmotic Adjustment in Platycladus orientalis and Amorpha fruticosa Differ during Drought and Rewatering" Forests 14, no. 5: 1019. https://doi.org/10.3390/f14051019