
How Vegetation Colorization Design Affects Urban Forest Aesthetic Preference and Visual Attention: An Eye-Tracking Study

Abstract
:1. Introduction
- Which colorization design form and intensity is more effective in enhancing the aesthetic value of urban forest landscapes?
- How do different forms and intensities of colorization design influence eye movements?
- What is the relationship between the aesthetic value of the urban forest landscape and the eye-movement metrics?
2. Materials and Methods
2.1. Study Site
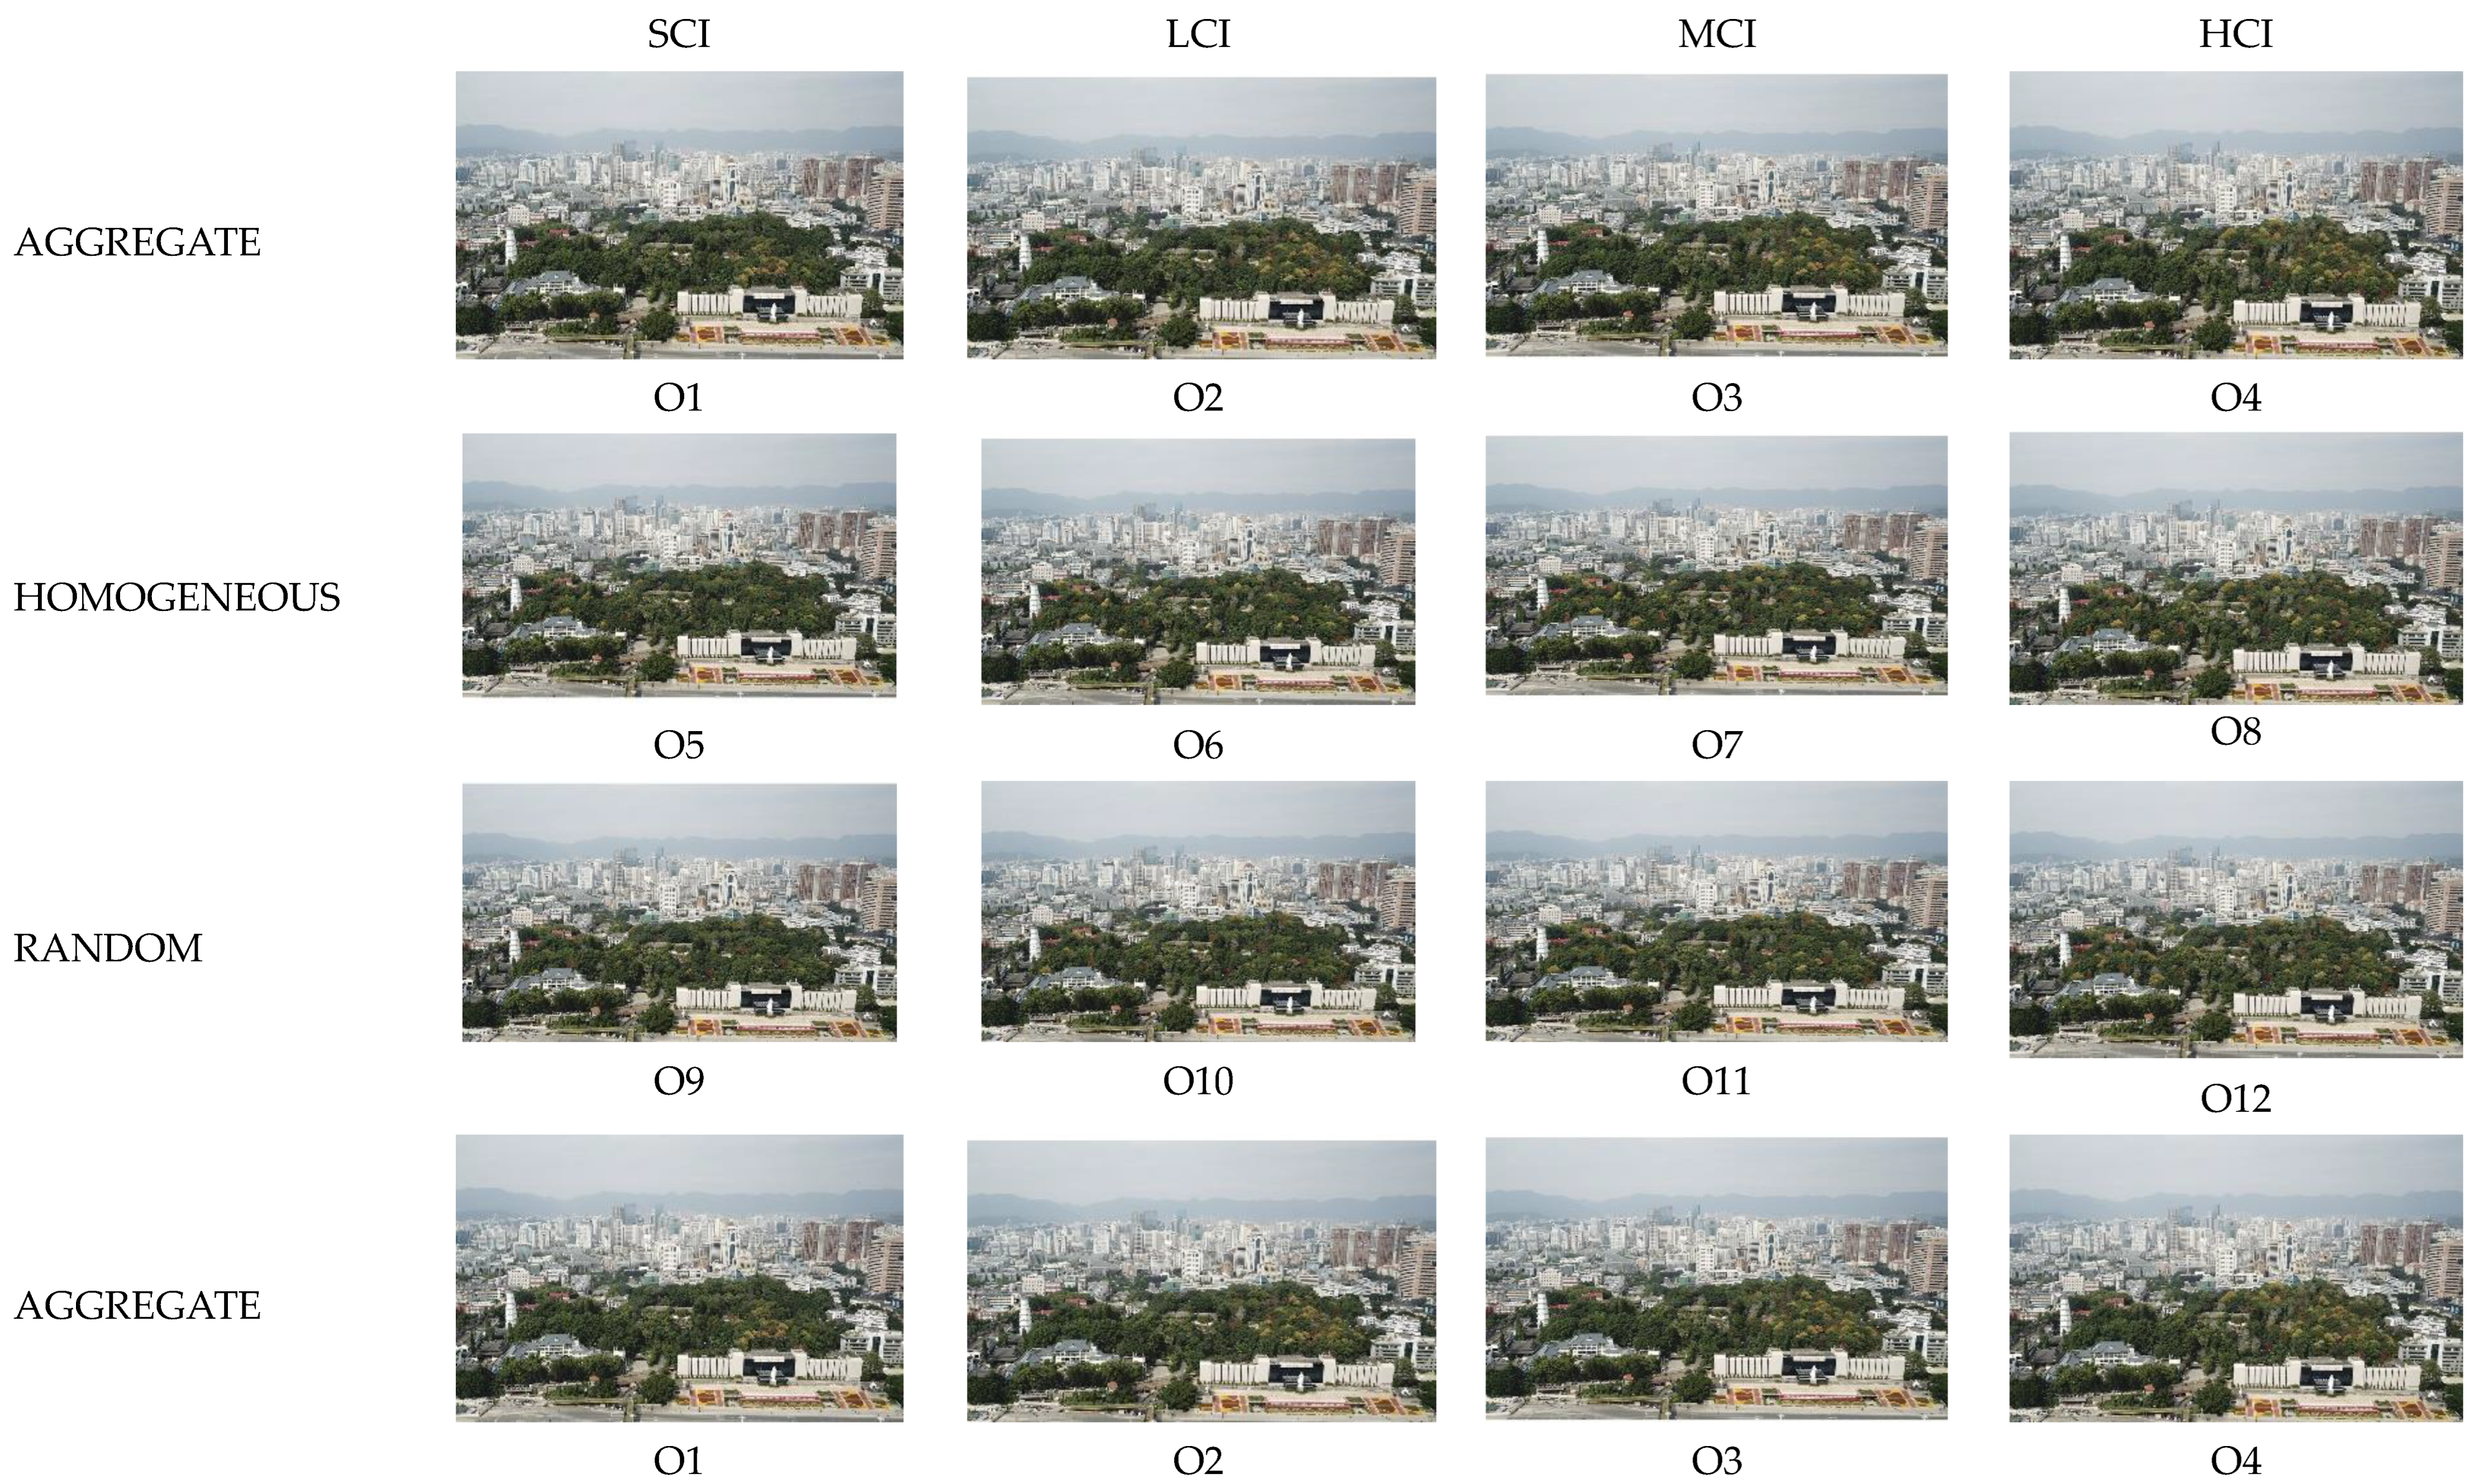
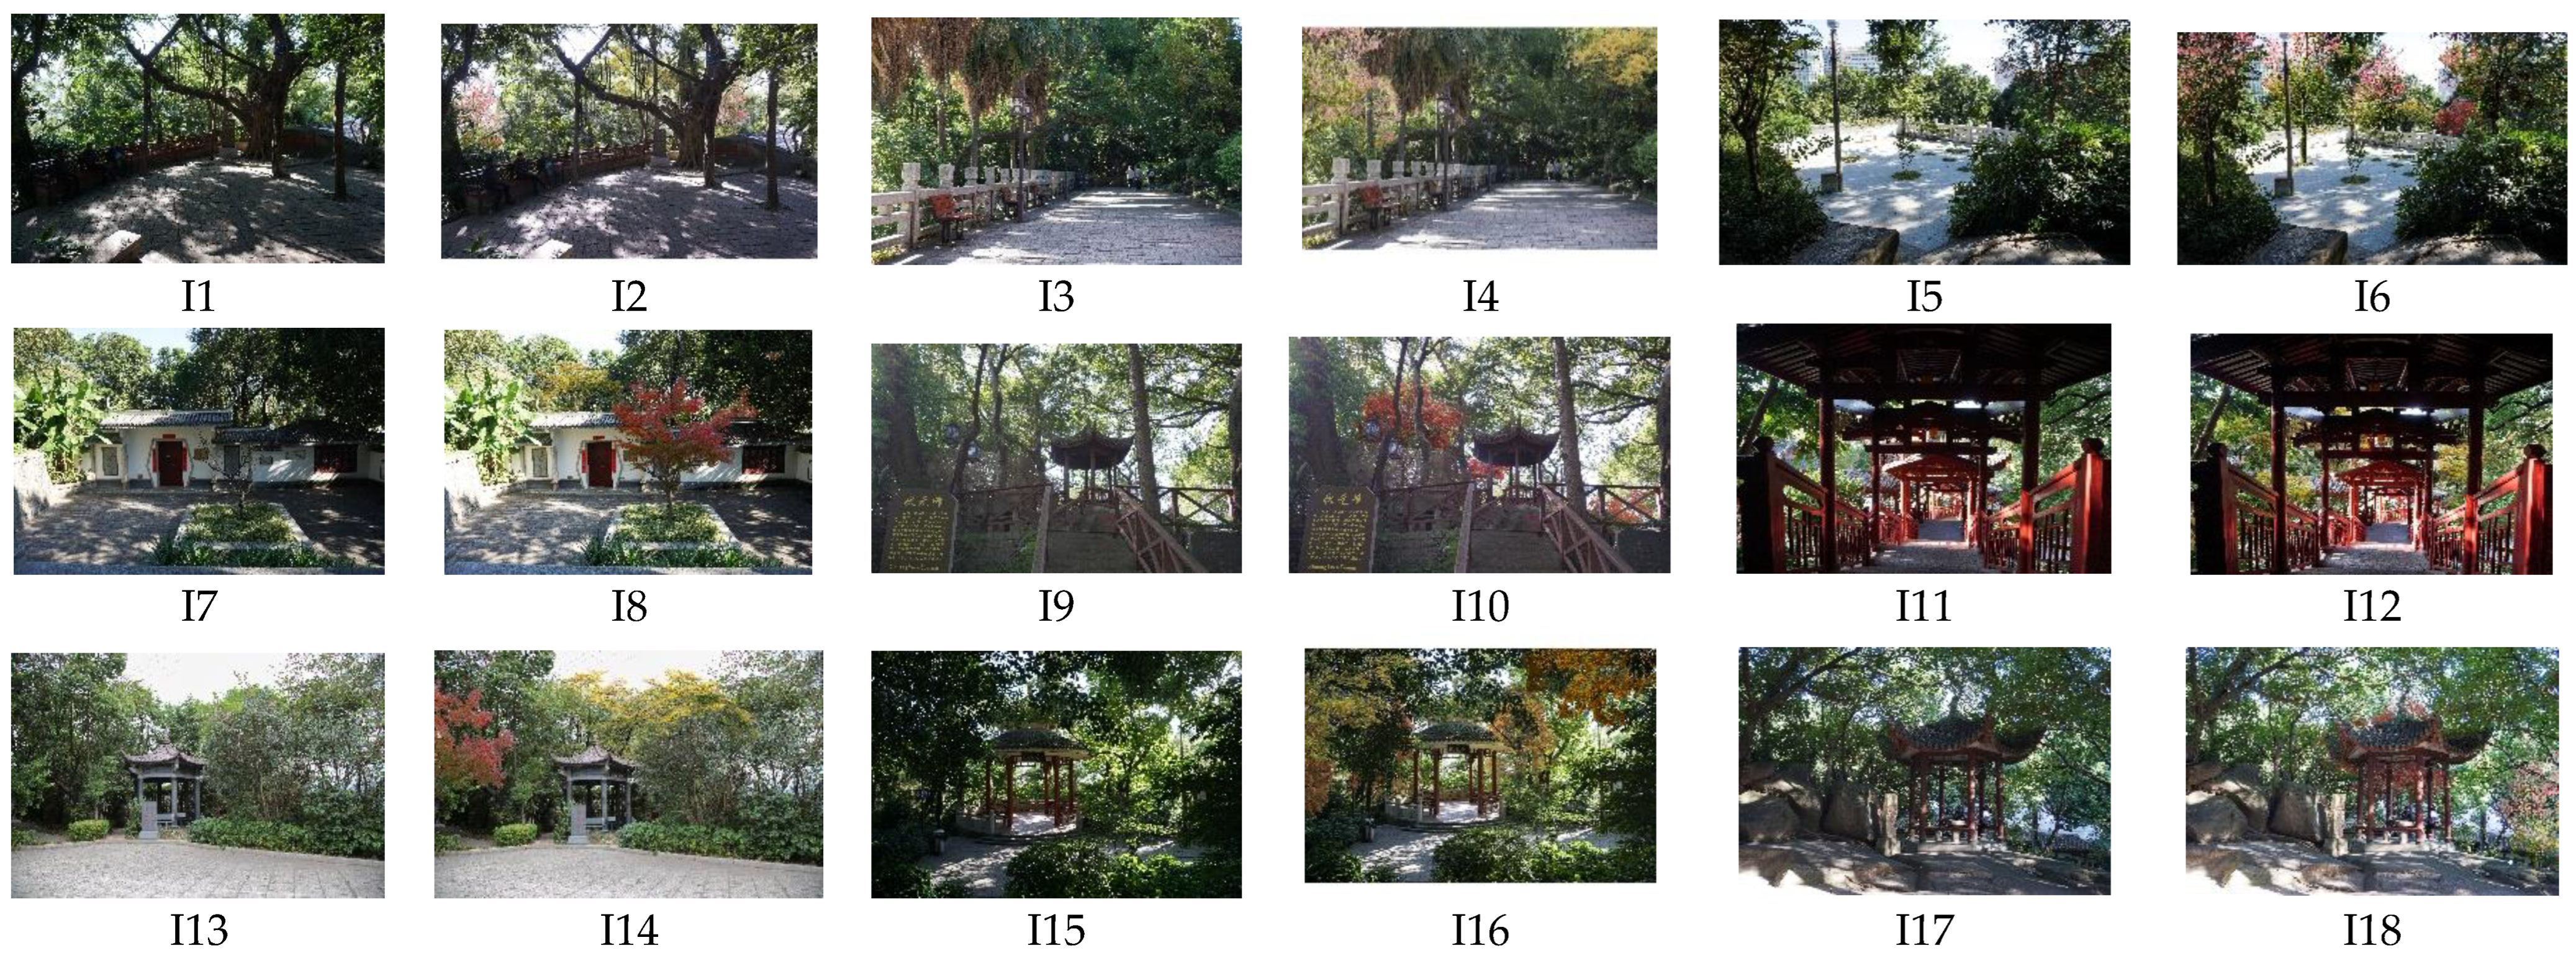
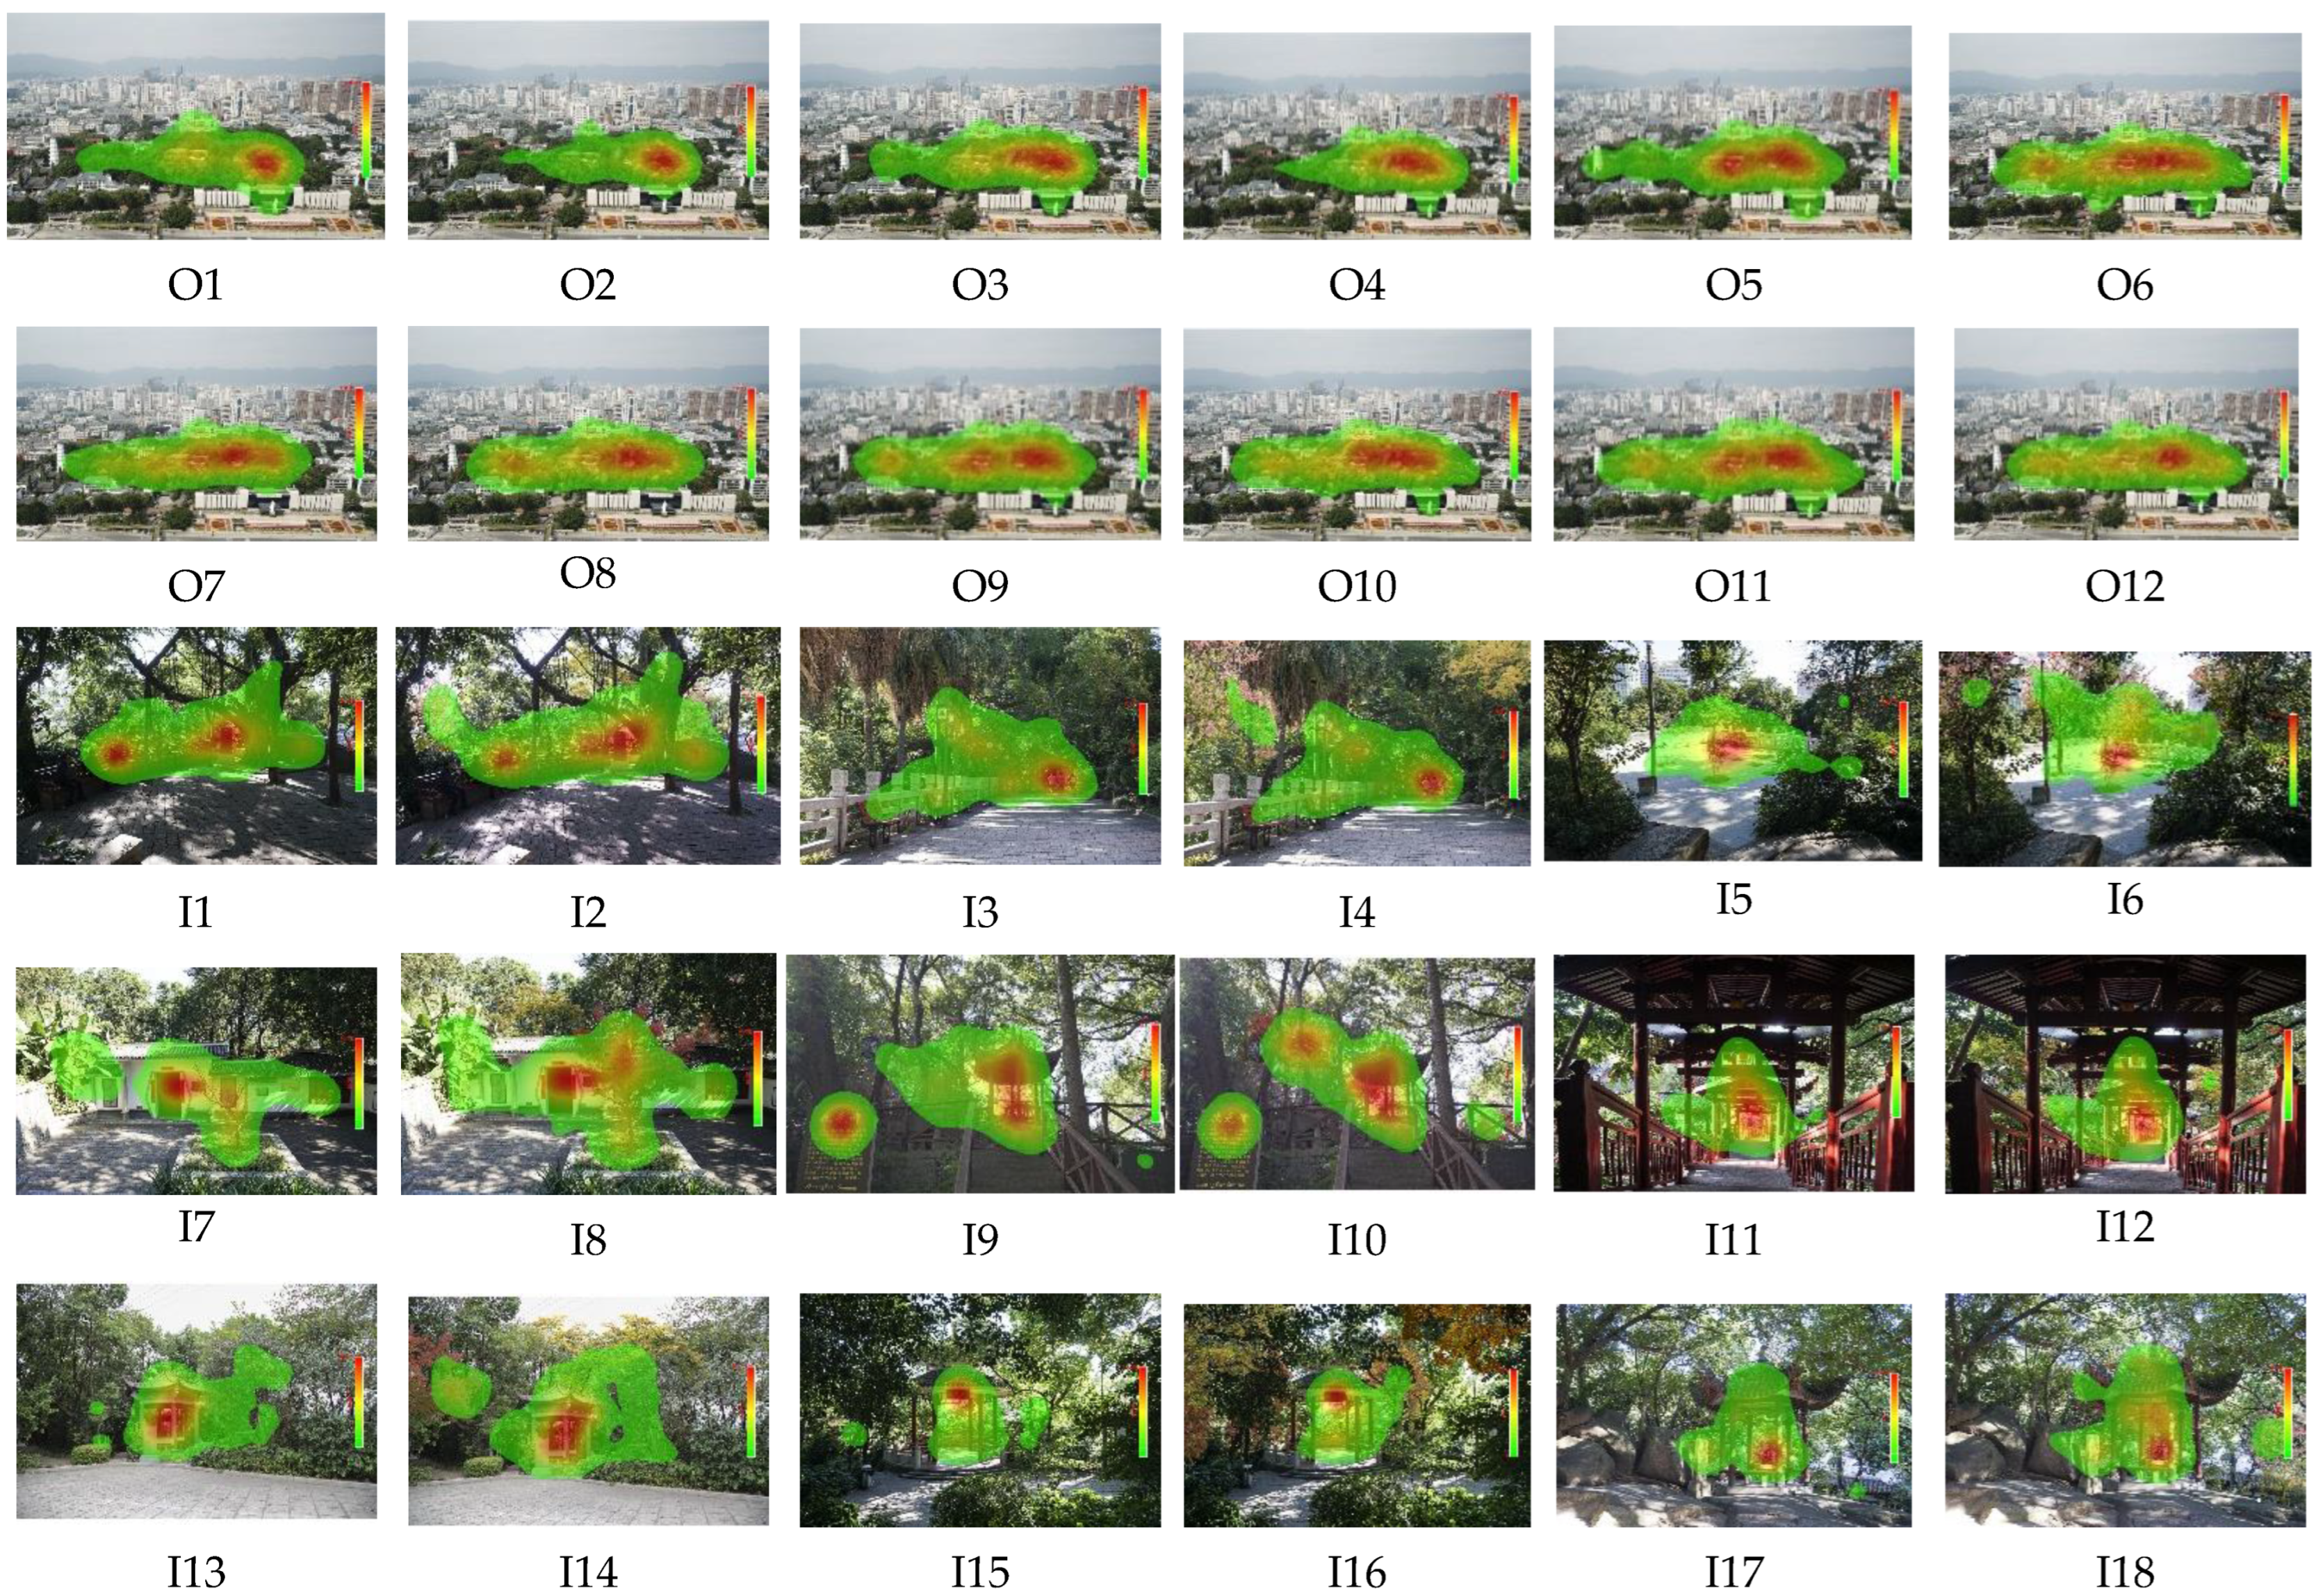
2.2. Photographic Images and Visualizations
2.3. Eye-Tracking Measures
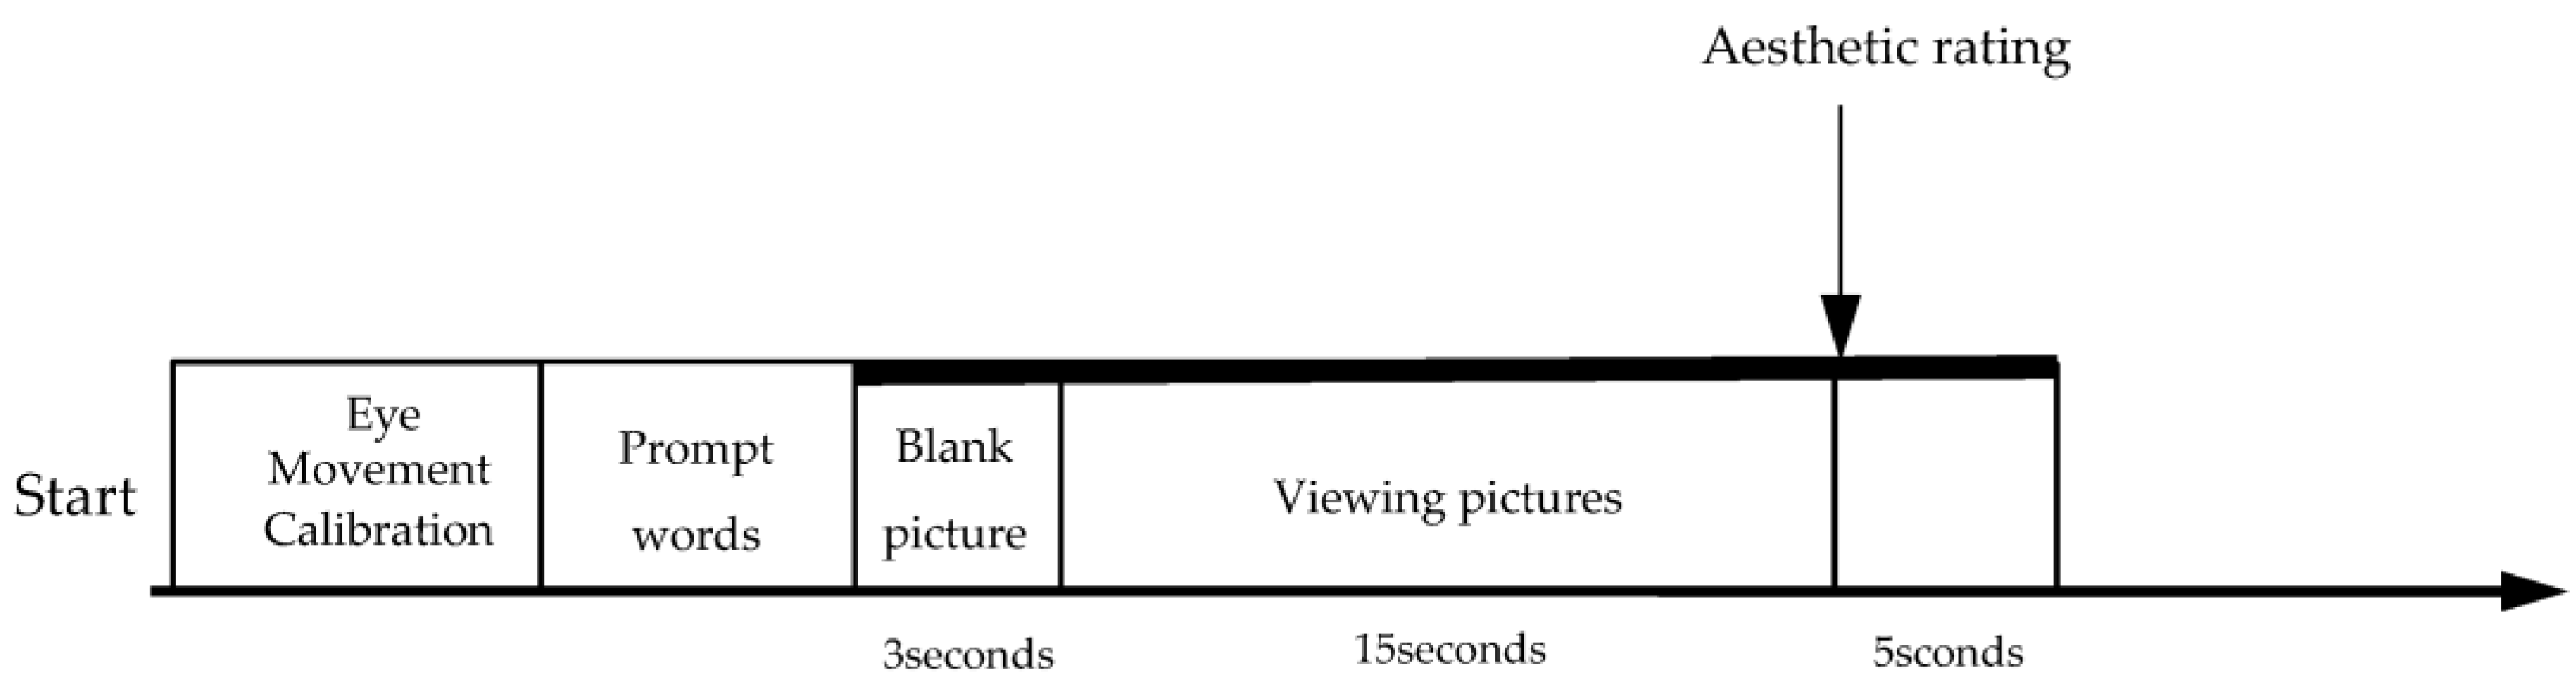
2.4. Procedure
2.5. Participants
2.6. Image Segmentation Based on Color Statistics
2.7. Analysis and Statistics
3. Results
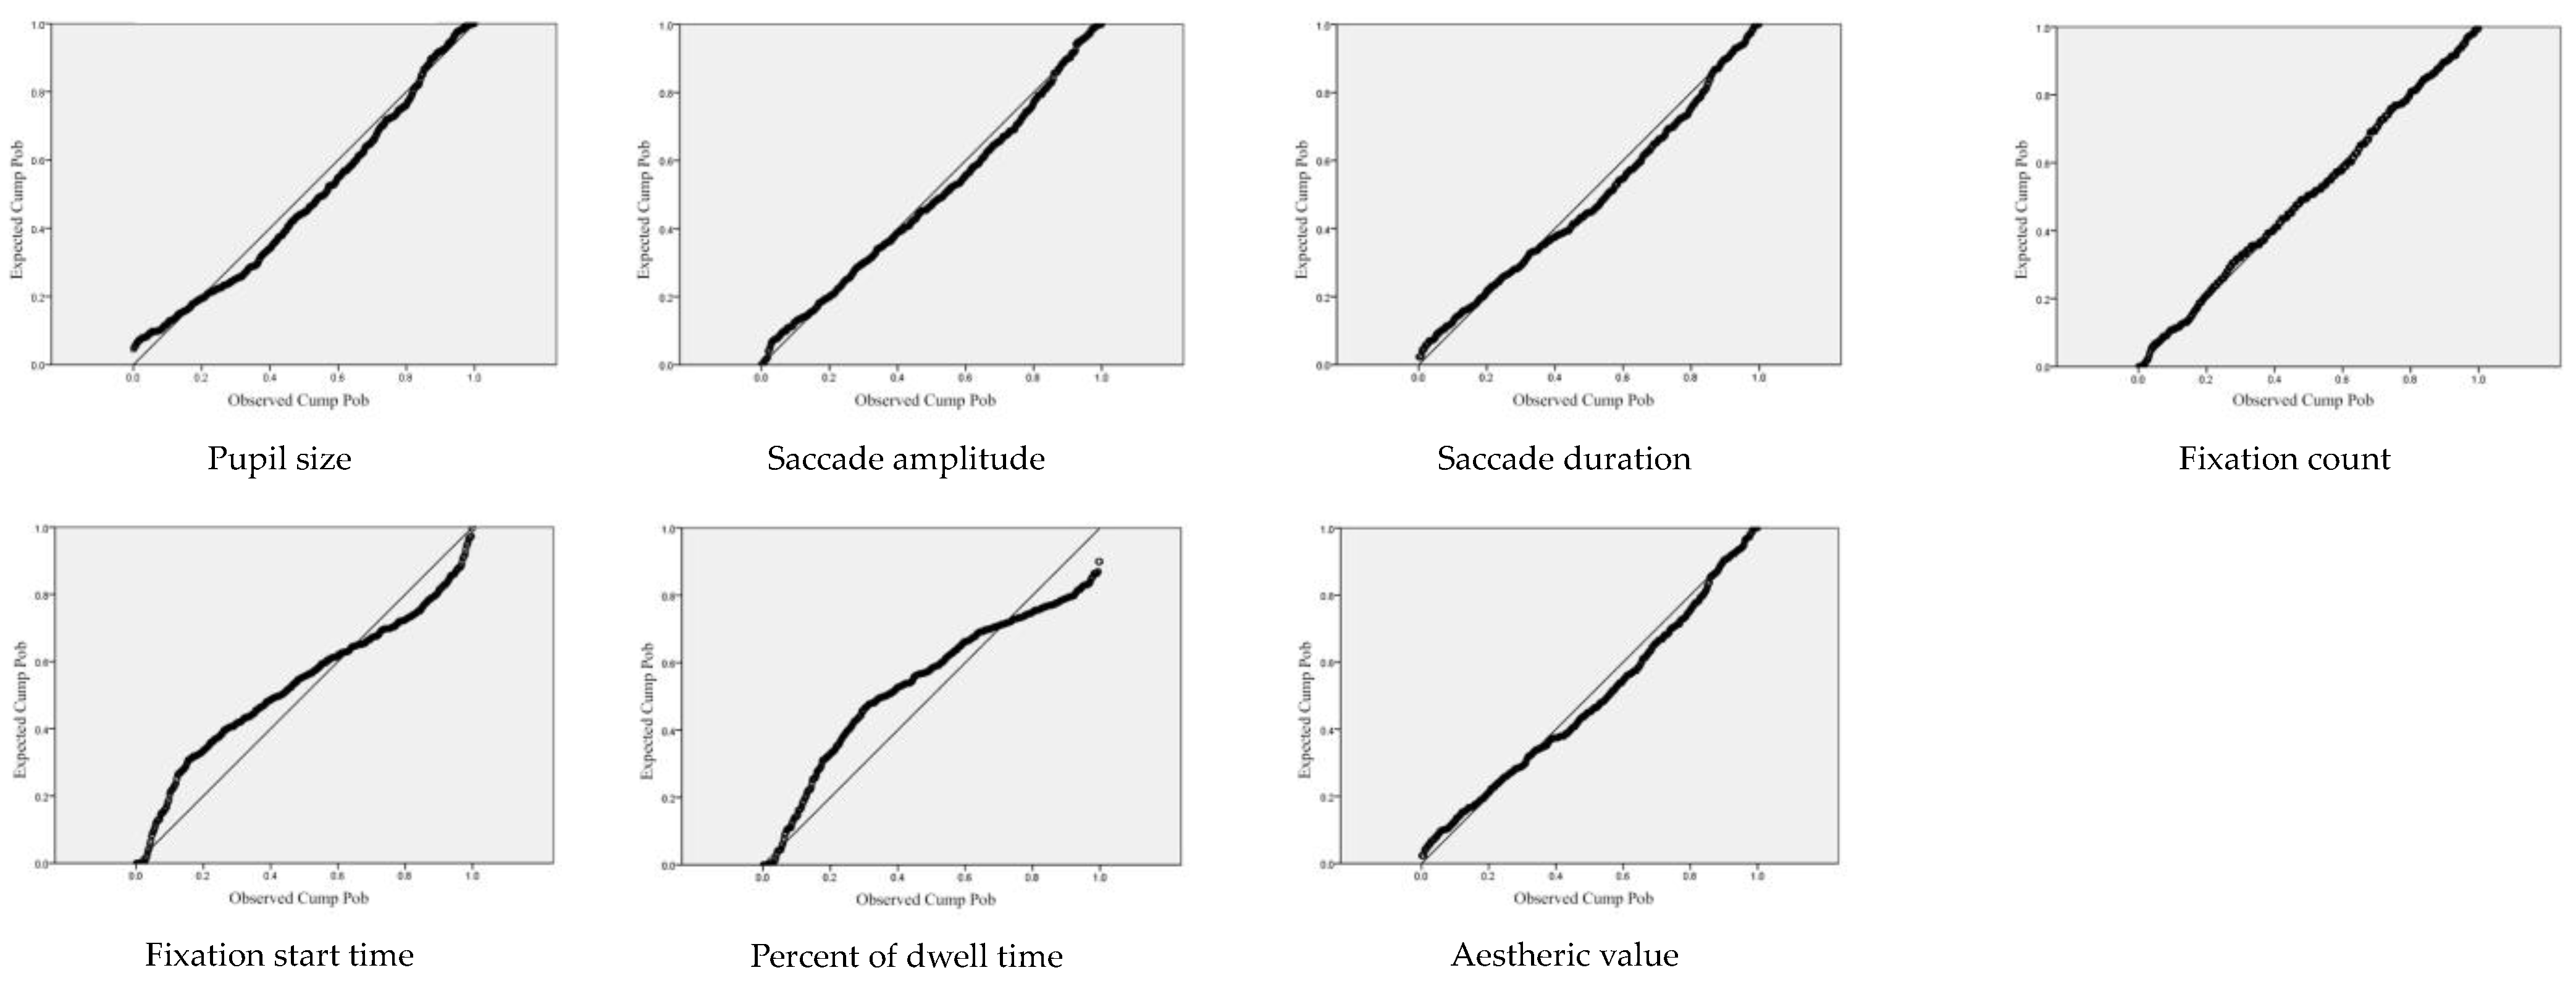
3.1. Reliability
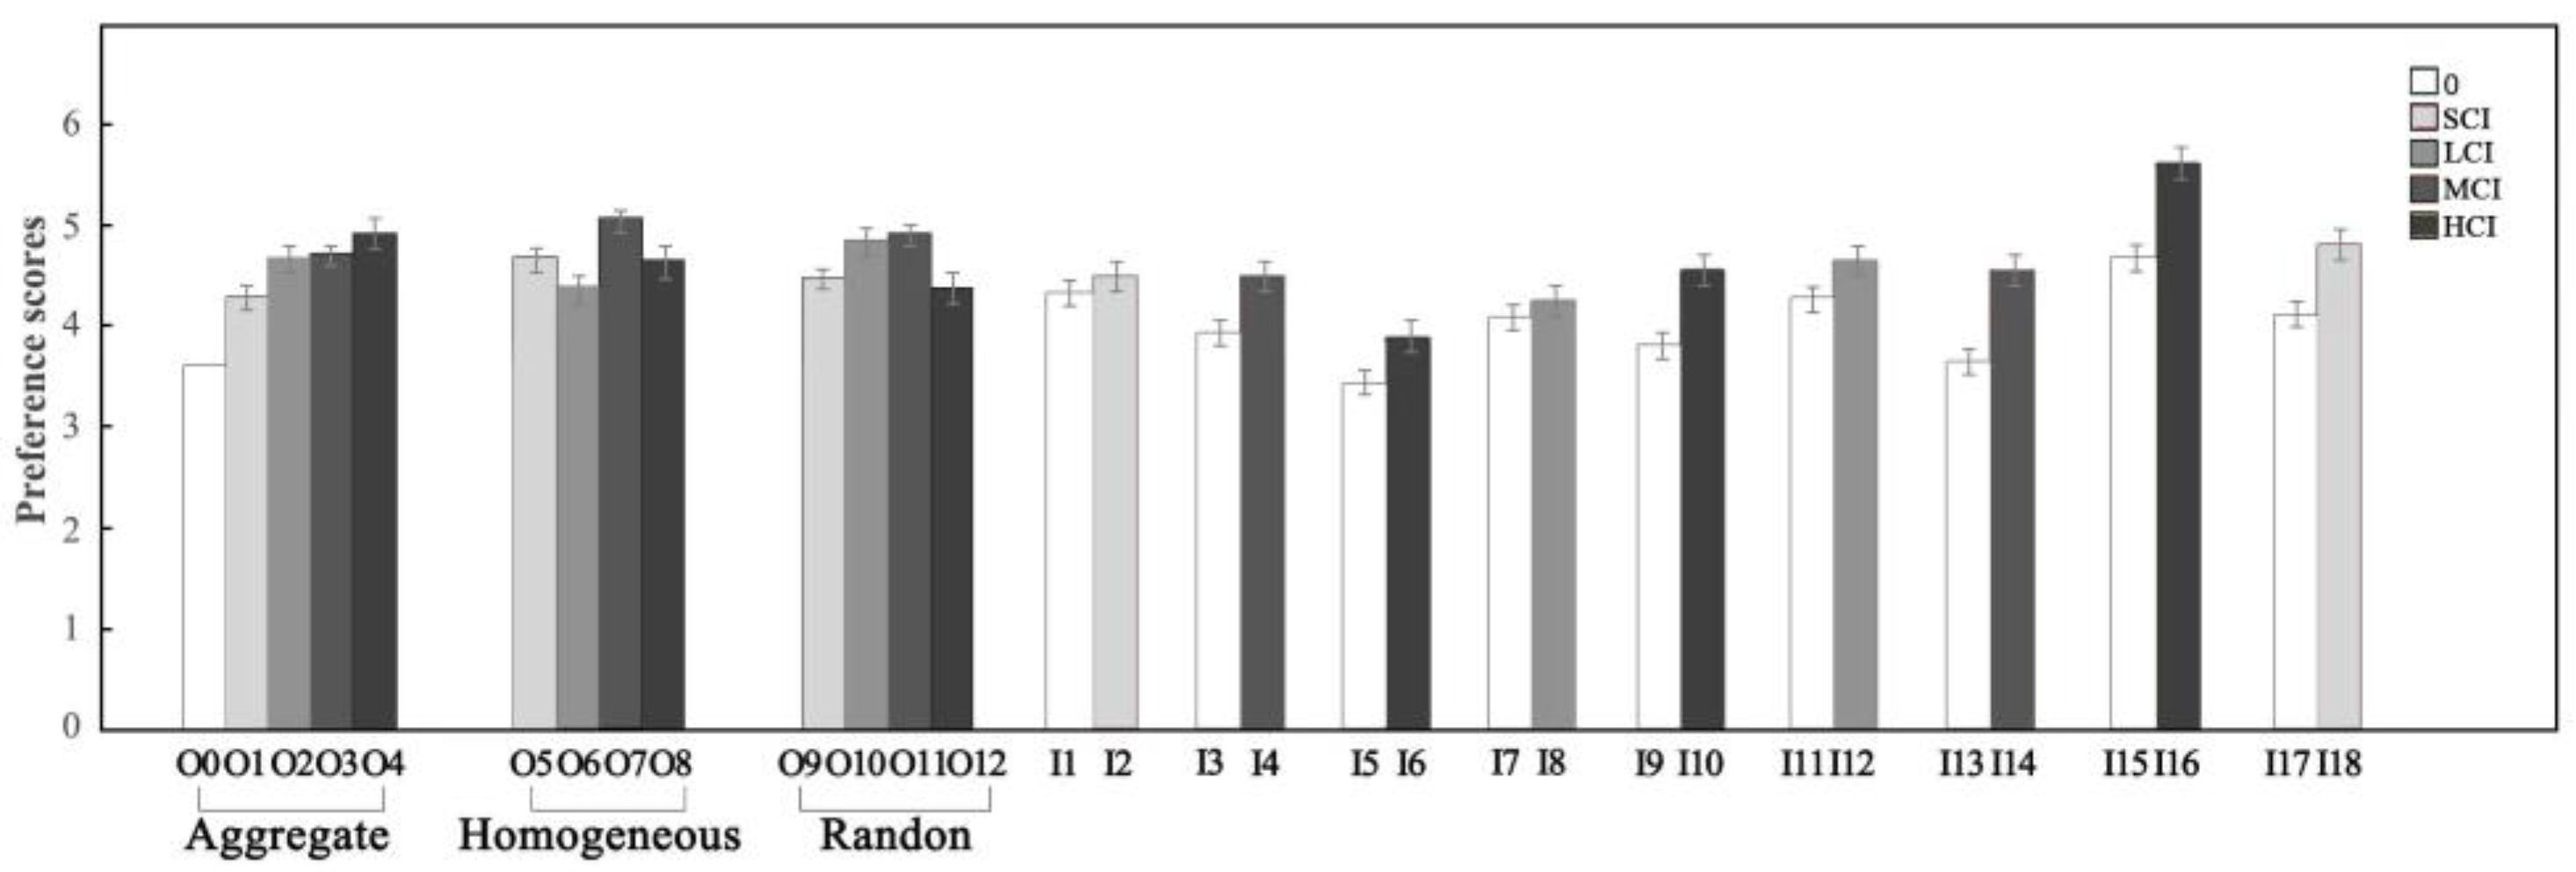
3.2. Comparison of an Aesthetic Rating between the Original Image and Visualized Images
3.2.1. Canopy Landscapes
3.2.2. Forest Landscapes
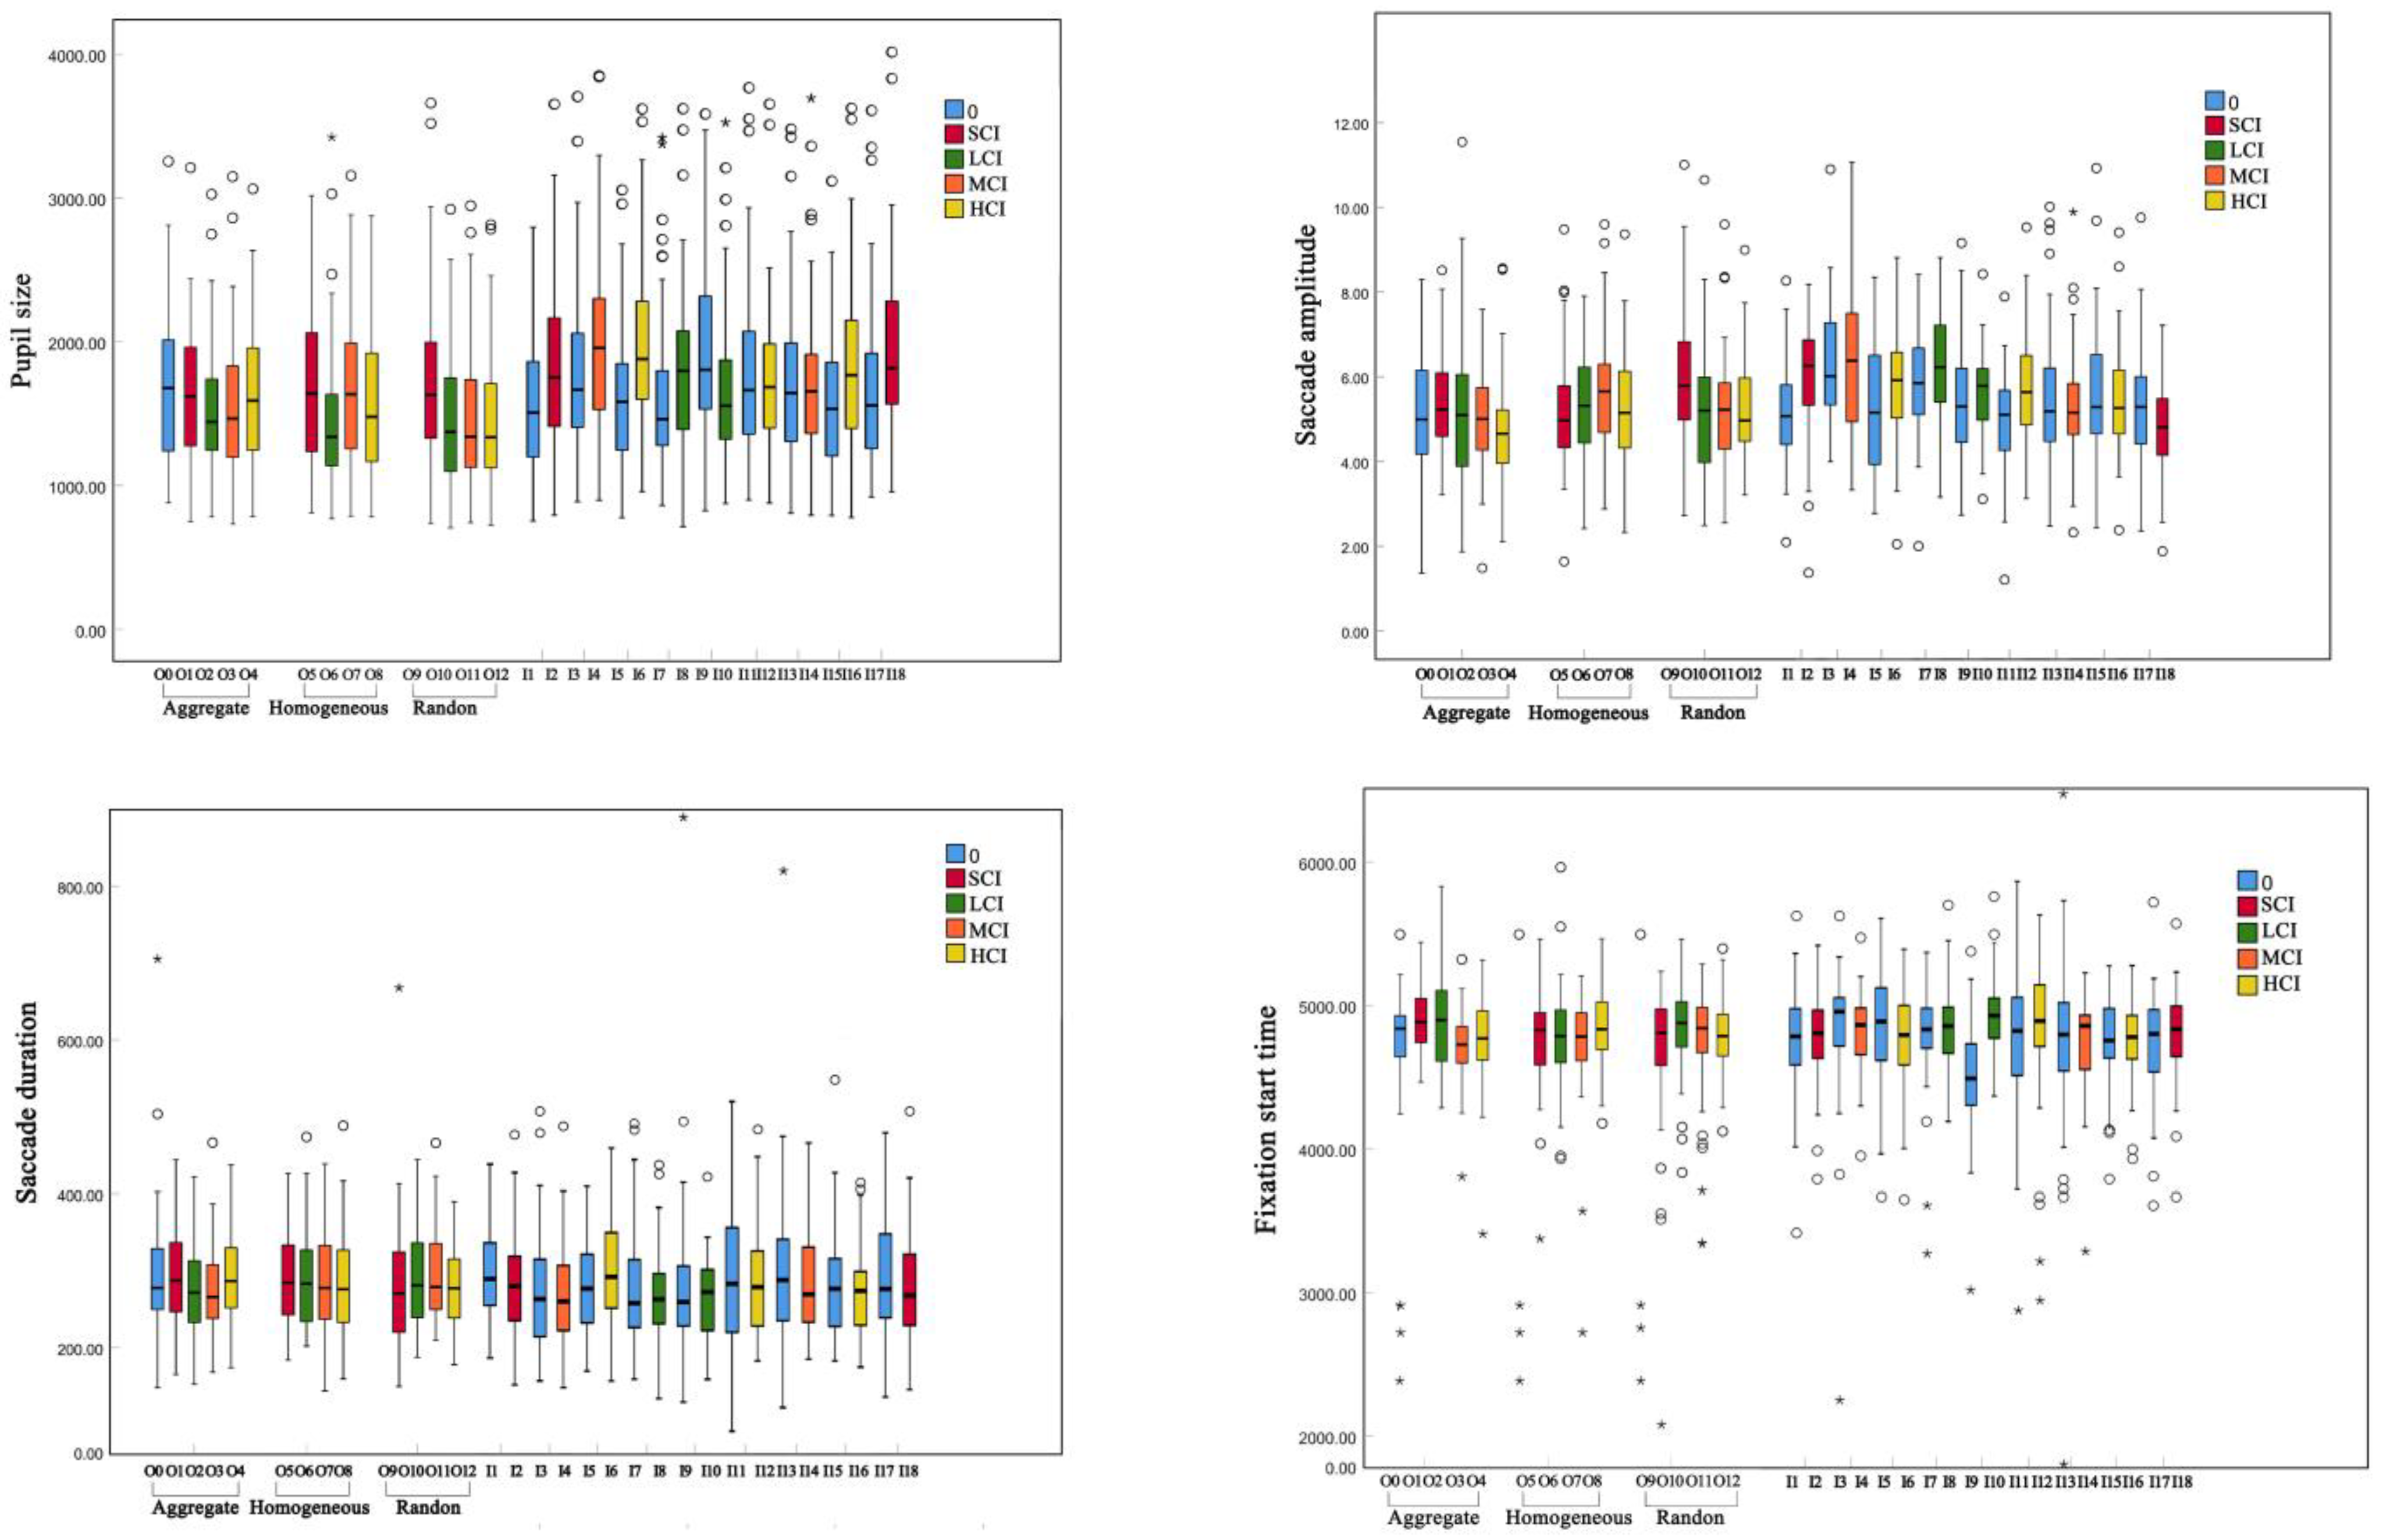
3.3. Comparison of Eye Movement between the Original Image and Visualized Images
3.3.1. Pupil Size
3.3.2. Saccade
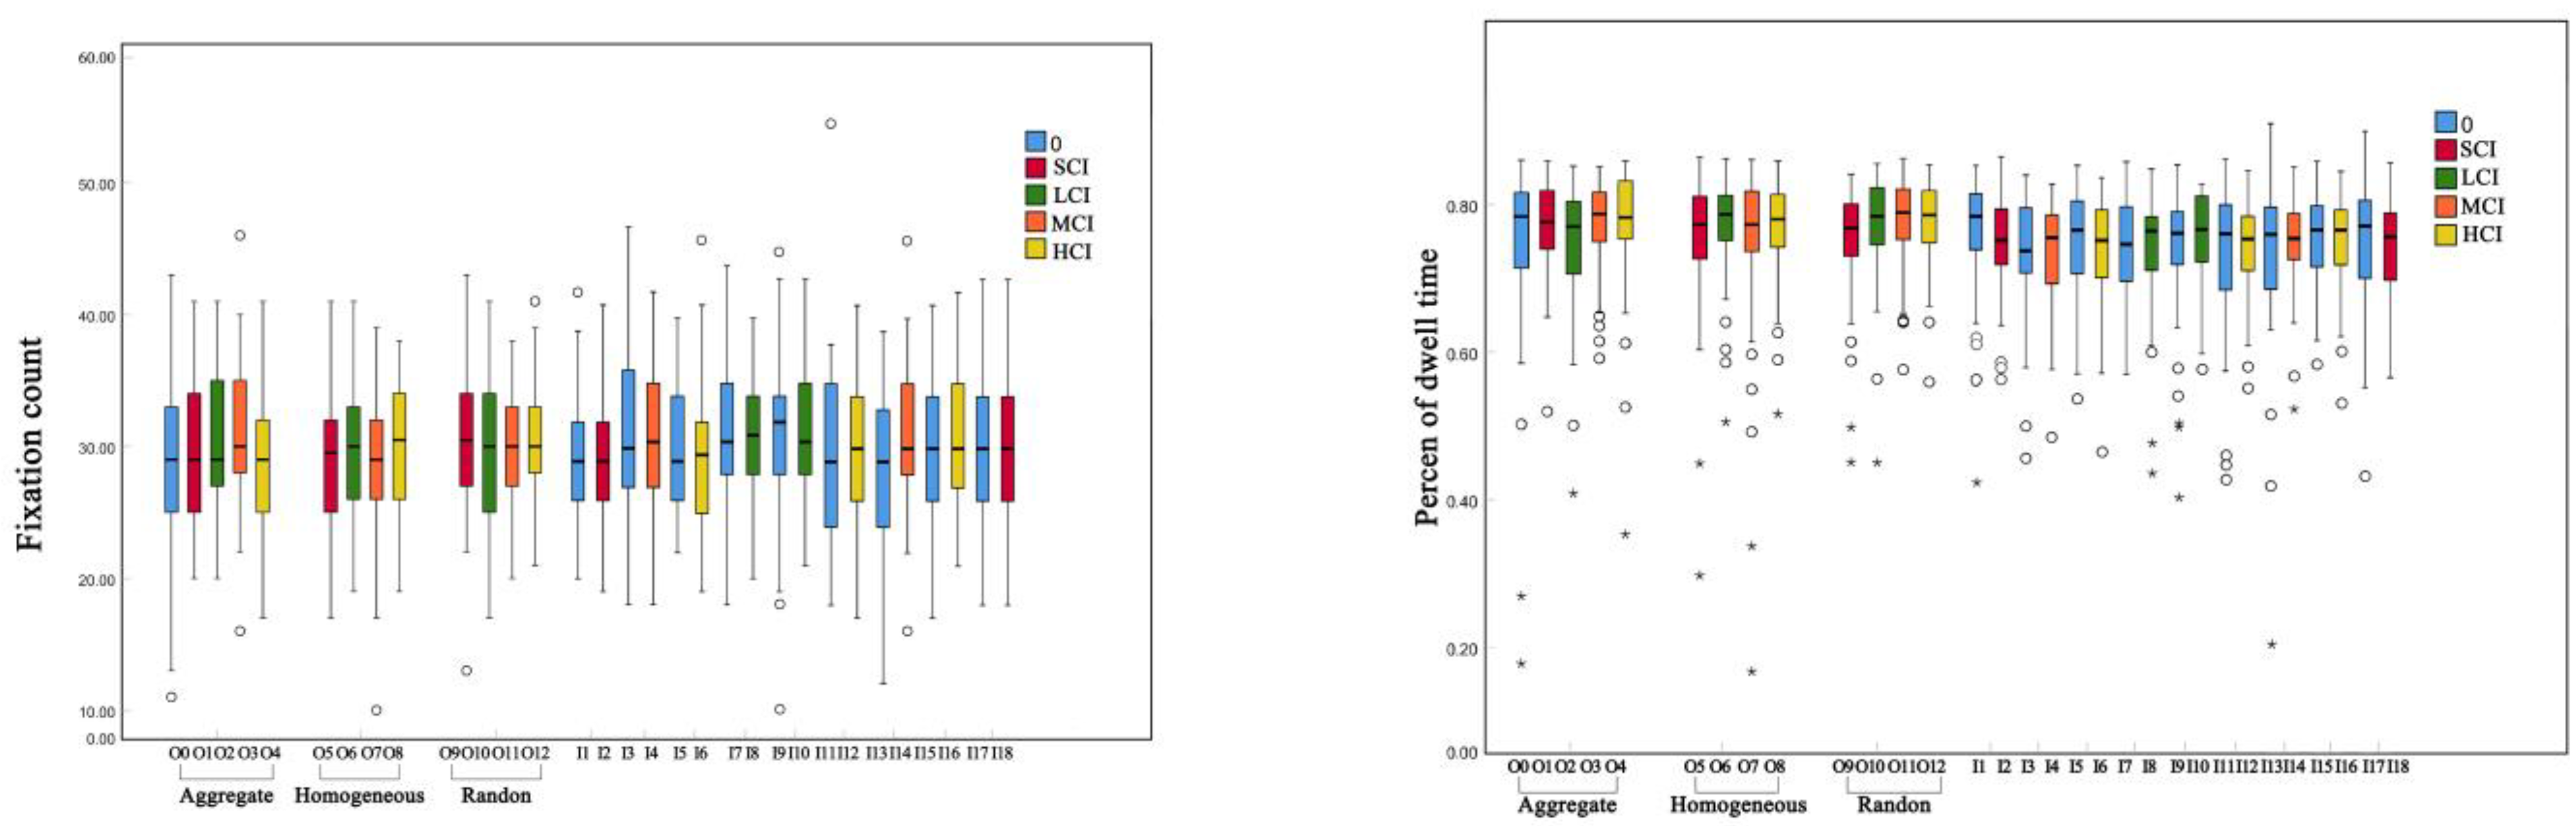
3.3.3. Fixation
3.4. Eye Movement in Relation to Colorized Areas
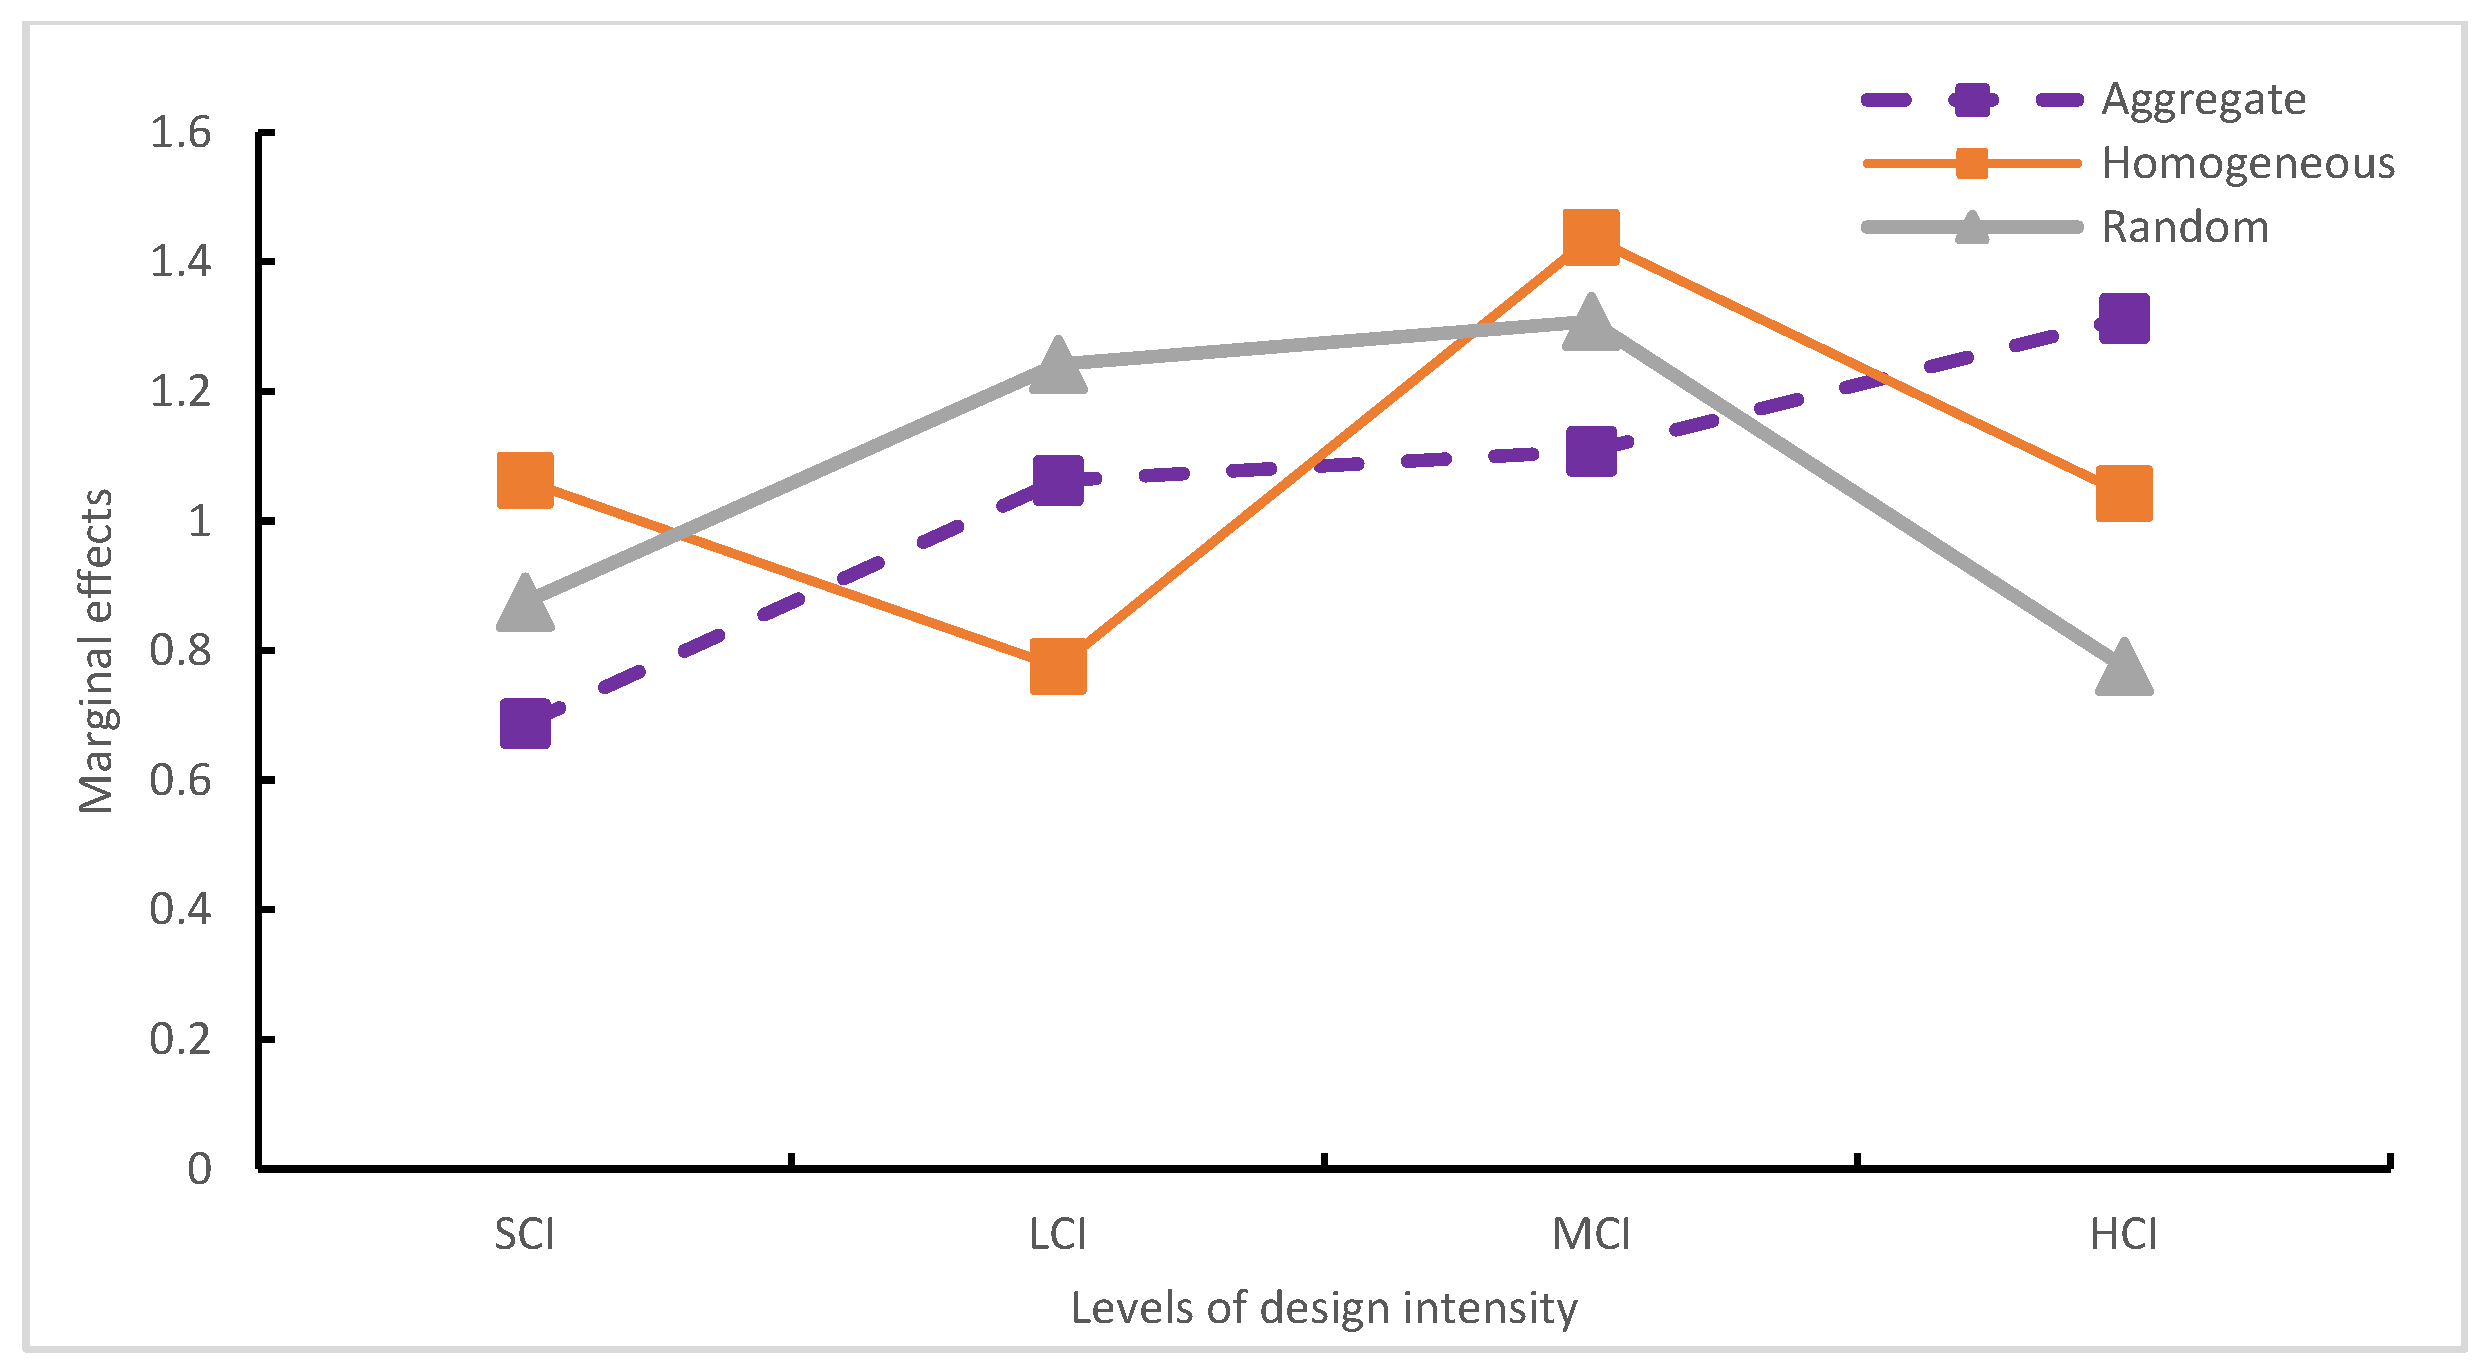
3.5. Eye movement in Relation to Colorization Design Form, Intensity, and Aesthetic Rating
4. Discussion
4.1. Colorization Design Form, Intensity, and Aesthetic Rating
4.2. Colorization Design Form, Intensity, and Eye Movement
4.3. Aesthetic Rating and Eye Movement
4.4. Limitations
5. Conclusions
Author Contributions
Funding
Data Availability Statement
Conflicts of Interest
References
- Zhang, R.; Zhang, L. Panoramic visual perception and identification of architectural cityscape elements in a virtual-reality environment. Future Gener. Comput. Syst. 2021, 118, 107–117. [Google Scholar] [CrossRef]
- Kabisch, N.; Püffel, C.; Masztalerz, O.; Hemmerling, J.; Kraemer, R. Physiological and psychological effects of visits to different urban green and street environments in older people: A field experiment in a dense inner-city area. Landsc. Urban Plan 2021, 207, 103998. [Google Scholar] [CrossRef]
- Eilola, S.; Jaalama, K.; Kangassalo, P.; Nummi, P.; Staffans, A.; Fagerholm, N. 3D visualisations for communicative urban and landscape planning: What systematic mapping of academic literature can tell us of their potential? Landsc. Urban Plan 2023, 234, 104716. [Google Scholar] [CrossRef]
- Ziru, C.; Fu, W.; Dong, J. Scenic Beauty Estimation of Urban Massif Based on Scenario Visualization—A Case Study of Fuzhou. Chin. Landsc. Archit. 2017, 33, 108–112. [Google Scholar]
- Suppakittpaisarn, P.; Chang, C.; Deal, B.; Larsen, L.; Sullivan, W.C. Does vegetation density and perceptions predict green stormwater infrastructure preference? Urban For. Urban Green. 2020, 55, 126842. [Google Scholar] [CrossRef]
- Harris, V.K.D.H. Green space context and vegetation complexity shape people’s preferences for urban public parks and esidential gardens. Landsc. Res. 2018, 43, 150–162. [Google Scholar] [CrossRef]
- Zhang, Z.; Qie, G.; Wang, C.; Jiang, S.; Li, X.; Li, M. Relationship between Forest Color Characteristics and Scenic Beauty: Case Study Analyzing Pictures of Mountainous Forests at Sloped Positions in Jiuzhai Valley, China. Forests 2017, 8, 63. [Google Scholar] [CrossRef]
- Wang, W.M.; Li, C.H.; Shu, J.W.; Chen, W. Vegetation change in southern China. Sci. China Press 2019, 49, 1308–1320. [Google Scholar] [CrossRef]
- Liu, W.; Tsao, C.; Lin, C. Tourists’ preference for colors of forest landscapes and its implications for forest landscape planning policies. For. Policy Econ 2023, 147, 102887. [Google Scholar] [CrossRef]
- Que, C.X.; Chi, M.W.; Chen, Z.; Jin, K.; Lan, S.R. Landscape Patter Changes and Driving Force of Fuzhou National Forest Park. J. Northwest For. Univ. 2017, 32, 169–177. [Google Scholar] [CrossRef]
- Mohamad Yahaya, N.A.; Awang Rambli, D.R.; Sulaiman, S.; Merienne, F.; Alyan, E. Design of Game-Based Virtual Forests for Psychological Stress Therapy. Forests 2023, 14, 288. [Google Scholar] [CrossRef]
- Chandler, T.; Richards, A.E.; Jenny, B.; Dickson, F.; Huang, J.; Klippel, A.; Neylan, M.; Wang, F.; Prober, S.M. Immersive landscapes: Modelling ecosystem reference conditions in virtual reality. Landsc. Ecol 2022, 37, 1293–1309. [Google Scholar] [CrossRef]
- Ma, B.; Hauer, R.J.; Xu, C.; Li, W. Visualizing evaluation model of human perceptions and characteristic indicators of landscape visual quality in urban green spaces by using nomograms. Urban For. Urban Green. 2021, 65, 127314. [Google Scholar] [CrossRef]
- Xu, W.; Zhao, J.; Huang, Y.; Hu, B. Design intensities in relation to visual aesthetic preference. Urban For. Urban Green. 2018, 34, 305–310. [Google Scholar] [CrossRef]
- Dupont, L.; Ooms, K.; Antrop, M.; Van Eetvelde, V. Testing the validity of a saliency-based method for visual assessment of constructions in the landscape. Landsc. Urban Plan 2017, 167, 325–338. [Google Scholar] [CrossRef]
- Nasar, J.L.; Stamps, A.E. Infill McMansions: Style and the psychophysics of size. J. Environ. Psychol. 2009, 29, 110–123. [Google Scholar] [CrossRef]
- Sheppard, S.R.J. Landscape visualisation and climate change: The potential for influencing perceptions and behaviour. Environ. Sci. Policy 2005, 8, 354–637. [Google Scholar] [CrossRef]
- Yu, H.; Wu, M.M.; He, H.S. Developing platform of 3-D visualization of forest landscape. Environ. Model. Softw. 2022, 157, 105524. [Google Scholar] [CrossRef]
- Mangone, G.; Dopko, R.L.; Zelenski, J.M. Deciphering landscape preferences: Investigating the roles of familiarity and biome types. Landsc. Urban Plan 2021, 214, 104189. [Google Scholar] [CrossRef]
- Nasr-Azadani, E.; Wardrop, D.; Brooks, R. Is the rapid development of visualization techniques enhancing the quality of public participation in natural resource policy and management? A systematic review. Landsc. Urban Plan 2022, 228, 104586. [Google Scholar] [CrossRef]
- Zhang, Z.; Gao, Y.; Zhou, S.; Zhang, T.; Zhang, W.; Meng, H. Psychological Cognitive Factors Affecting Visual Behavior and Satisfaction Preference for Forest Recreation Space. Forests 2022, 13, 136. [Google Scholar] [CrossRef]
- Allahyar, M.; Kazemi, F. Landscape preferences of a children’s hospital by children and therapists. Urban For. Urban Green. 2021, 58, 126984. [Google Scholar] [CrossRef]
- Li, J.; Hou, T. Application of Virtual Reality Technology in Analysis of the Three-Dimensional Evaluation System of Rural Landscape Planning. Math. Probl. Eng. 2021, 2021, 6693143. [Google Scholar] [CrossRef]
- Kerimova, N.; Sivokhin, P.; Kodzokova, D.; Nikogosyan, K.; Klucharev, V. Visual processing of green zones in shared courtyards during renting decisions: An eye-tracking study. Urban For. Urban Green. 2022, 68, 127460. [Google Scholar] [CrossRef]
- Jaalama, K.; Rantanen, T.; Julin, A.; Fagerholm, N.; Keitaanniemi, A.; Virtanen, J.; Handolin, H.; Vaaja, M.; Hyyppä, H. Auditing an urban park deck with 3D geovisualization—A comparison of in-situ and VR walk-along interviews. Urban For. Urban Green. 2022, 76, 127712. [Google Scholar] [CrossRef]
- Lin, H.; Chou, L.; Chang, K.; Wang, J.; Chen, S.; Hendradi, R. Visual Fatigue Estimation by Eye Tracker with Regression Analysis. J. Sens. 2022, 2022, 7642777. [Google Scholar] [CrossRef]
- Gao, Y.; Sun, X.M.; Zhang, T.; Zhan, H. Analysis on the characteristics of eye movement and the evaluation of psychological perception for forest waterscape space. IOP Conf. Ser. Earth Environ. Sci. 2021, 626, 12007. [Google Scholar] [CrossRef]
- Qi, J.; Lin, E.; Tan, P.; Ho, R.; Sia, A.; Guizzo, A.; Zhang, X.; Waykool, R. Development and application of 3D spatial metrics using point clouds for landscape visual quality assessment. Landsc. Urban Plan. 2022, 228, 104585. [Google Scholar] [CrossRef]
- Liu, L.H.; Wu, M.Y.; Ma, Y.M.; Qu, H. A Review of Eye Tracking Researches in Landscape Architecture Field. J. Hum. Settl. West China 2021, 36, 125–133. [Google Scholar]
- Qi, J.; Lan, D.; Samsung, L. Application of a decision-making framework for multi-objective optimisation of urban heat mitigation strategies. Urban Clim. 2023, 47, 101372. [Google Scholar] [CrossRef]
- Liu, Q.; Zhu, Z.; Zeng, X.; Zhuo, Z.; Ye, B.; Fang, L.; Huang, Q.; Lai, P. The impact of landscape complexity on preference ratings and eye fixation of various urban green space settings. Urban For. Urban Green. 2021, 66, 127411. [Google Scholar] [CrossRef]
- Bradley, M.M.; Miccoli, L.; Escrig, M.A.; Lang, P.J. The pupil as a measure of emotional arousal and autonomic activation. Psychophysiology 2008, 45, 602–607. [Google Scholar] [CrossRef] [Green Version]
- Scott, N.; Le, D.; Becken, S.; Connolly, R.M. Measuring perceived beauty of the Great Barrier Reef using eye-tracking technology. Curr. Issues Tour. 2020, 23, 2492–2502. [Google Scholar] [CrossRef]
- Al-Samarraie, H.; Sarsam, S.M.; Alzahrani, A.I.; Alalwan, N. Personality and individual differences: The potential of using preferences for visual stimuli to predict the Big Five traits. Cogn. Technol. Work 2018, 20, 337–349. [Google Scholar] [CrossRef]
- Batool, A.; Rutherford, P.; McGraw, P.; Ledgeway, T.; Altomonte, S. Gaze correlates of view preference: Comparing natural and urban scenes. Light. Res. Technol. 2022, 54, 576–594. [Google Scholar] [CrossRef]
- Scott, G.G.; Pinkosova, Z.; Jardine, E.; Hand, C.J. “Thinstagram”: Image content and observer body satisfaction influence the when and where of eye movements during instagram image viewing. Comput. Hum. Behav. 2023, 138, 107464. [Google Scholar] [CrossRef]
- Ugwitz, P.; Kvarda, O.; Juříková, Z.; Šašinka; Tamm, S. Eye-Tracking in Interactive Virtual Environments: Implementation and Evaluation. Appl. Sci. 2022, 12, 1027. [Google Scholar] [CrossRef]
- Zheng, J.; Tarin, M.W.K.; Jiang, D.; Li, M.; Ye, J.; Chen, L.; He, T.; Zheng, Y. Which ornamental features of bamboo plants will attract the people most? Urban For. Urban Green. 2021, 61, 127101. [Google Scholar] [CrossRef]
- Guo, S.; Sun, W.; Chen, W.; Zhang, J.; Liu, P. Impact of Artificial Elements on Mountain Landscape Perception: An Eye-Tracking Study. Land 2021, 10, 1102. [Google Scholar] [CrossRef]
- Chen, Z.; Zhu, Z.; Guo, Z.; Chen, J.; Fu, W.; Dong, J.; Ding, G. Evaluation of Forest Landscape Resources of National Forest Park in Typical Area of China. IOP Conf. Ser. Earth Environ. Sci. 2018, 170, 022161. [Google Scholar] [CrossRef]
- Dong, L.; Jiang, H.; Li, W.; Qiu, B.; Wang, H.; Qiu, W. Assessing impacts of objective features and subjective perceptions of street environment on running amount: A case study of Boston. Landsc. Urban Plan 2023, 235, 104756. [Google Scholar] [CrossRef]
- Amati, M.; Ghanbari Parmehr, E.; McCarthy, C.; Sita, J. How eye-catching are natural features when walking through a park? Eye-tracking responses to videos of walks. Urban For. Urban Green. 2018, 31, 67–78. [Google Scholar] [CrossRef]
- van der Laan, L.N.; Hooge, I.T.C.; de Ridder, D.T.D.; Viergever, M.A.; Smeets, P.A.M. Do you like what you see? The role of first fixation and total fixation duration in consumer choice. Food Qual. Prefer. 2015, 39, 46–55. [Google Scholar] [CrossRef]
- Shang, T.; Feng, M.K. Algorithm of image segmentation based on color statistics. Eng. J. Wuhan Univ. 2011, 44, 663–667. [Google Scholar]
- Chung, W.K.; Lin, M.; Chau, C.K.; Masullo, M.; Pascale, A.; Leung, T.M.; Xu, M. On the study of the psychological effects of blocked views on dwellers in high dense urban environments. Landsc. Urban Plan 2022, 221, 104379. [Google Scholar] [CrossRef]
- Jiang, B.; He, J.; Chen, J.; Larsen, L. Moderate is optimal: A simulated driving experiment reveals freeway landscape matters for driving performance. Urban For. Urban Green. 2021, 58, 126976. [Google Scholar] [CrossRef]
- Iversen, S.V.; van der Velden, N.; Convery, I.; Mansfield, L.; Kjeldsen, C.; Thorsøe, M.H.; Holt, C.D.S. Impacts of woodland planting on nature-based recreational tourism in upland England A case study. Landsc. Urban Plan 2023, 230, 104587. [Google Scholar] [CrossRef]
- de Groot, W.T.; van den Born, R.J.G. Visions of nature and landscape type preferences: An exploration in The Netherlands. Landsc. Urban Plan 2003, 63, 127–138. [Google Scholar] [CrossRef]
- Huang, A.S.L.Y. The effect of landscape color, complexity, and preference on viewing behaviour. Landsc. Res. 2020, 45, 214–227. [Google Scholar] [CrossRef]
- Jiang, X.; Li, J.; Yang, B. Luminance and saliency have impact on pedestrians’ fixation distribution during natural walking: Evidence from mobile eye-tracker. Light. Res. Technol. 2021, 53, 359–372. [Google Scholar] [CrossRef]
- Wang, P.; Yang, W.; Wang, D.; He, Y. Insights into Public Visual Behaviors through Eye-Tracking Tests: A Study Based on National Park System Pilot Area Landscapes. Land 2021, 10, 497. [Google Scholar] [CrossRef]
- Hong, X.-C.; Cheng, S.; Liu, J.; Dang, E.; Wang, J.-B.; Cheng, Y. The Physiological Restorative Role of Soundscape in Different Forest Structures. Forests 2022, 13, 1920. [Google Scholar] [CrossRef]
- Wu, J.; Luo, M.; Lin, N.; Huang, Z.; Wang, T.; Xu, T.; Zhang, L.; You, Z.; Lin, M.; Lin, K.; et al. Association of greenness exposure with coronary artery stenosis and biomarkers of myocardial injury in patients with myocardial infarction. Sci. Total. Environ. 2023, 856, 159036. [Google Scholar] [CrossRef]
- Liu, Q.; Wu, Y.; Xiao, Y.; Fu, W.; Zhuo, Z.; van den Bosch, C.C.K.; Huang, Q.; Lan, S. More meaningful, more restorative? Linking local landscape characteristics and place attachment to restorative perceptions of urban park visitors. Landsc. Urban Plan 2020, 197, 103763. [Google Scholar] [CrossRef]
- Nordh, H.; Hagerhall, C.M.; Holmqvist, K.; Sveriges, L. Tracking Restorative Components: Patterns in Eye Movements as a Consequence of a Restorative Rating Task. Landsc. Res. 2013, 38, 101–116. [Google Scholar] [CrossRef]
- Dorr, M.; Martinetz, T.; Gegenfurtner, K.R.; Barth, E. Variability of eye movements when viewing dynamic natural scenes. J. Vis. 2010, 10, 28. [Google Scholar] [CrossRef] [Green Version]
- Bazrafshan, M.; Spielhofer, R.; Wissen Hayek, U.; Kienast, F.; Grêt-Regamey, A. Greater place attachment to urban parks enhances relaxation: Examining affective and cognitive responses of locals and bi-cultural migrants to virtual park visits. Landsc. Urban Plan 2023, 232, 104650. [Google Scholar] [CrossRef]
- Półrolniczak, M.; Kolendowicz, L. The influence of weather and level of observer expertise on suburban landscape perception. Build Environ. 2021, 202, 108016. [Google Scholar] [CrossRef]
- Hong, X.-C.; Liu, J.; Wang, G.-Y. Soundscape in Urban Forests. Forests 2022, 13, 2056. [Google Scholar] [CrossRef]


| Eye Movement Metrics | |||||||
|---|---|---|---|---|---|---|---|
| Pupil Size | Saccade Amplitude | Saccade Duration | Fixation Count | Fixation Start Time | Percentage of Dwell Time | Aesthetic Value | |
| Form | −0.50 | 0.139 ** | −0.012 | 0.029 | 0.017 | 0.069 | 0.195 ** |
| Intensity | −0.90 * | −0.107 ** | −0.028 | 0.041 ** | 0.068 | 0.026 | 0.277 ** |
| Aesthetic value | −0.123 ** | −0.055 | −0.013 | −0.002 | −0.008 | −0.015 | |
Disclaimer/Publisher’s Note: The statements, opinions and data contained in all publications are solely those of the individual author(s) and contributor(s) and not of MDPI and/or the editor(s). MDPI and/or the editor(s) disclaim responsibility for any injury to people or property resulting from any ideas, methods, instructions or products referred to in the content. |
© 2023 by the authors. Licensee MDPI, Basel, Switzerland. This article is an open access article distributed under the terms and conditions of the Creative Commons Attribution (CC BY) license (https://creativecommons.org/licenses/by/4.0/).
Share and Cite
Chen, Z.; Huang, Y.; Shen, Y.; Fu, W.; Yao, X.; Huang, J.; Lan, Y.; Zhu, Z.; Dong, J. How Vegetation Colorization Design Affects Urban Forest Aesthetic Preference and Visual Attention: An Eye-Tracking Study. Forests 2023, 14, 1491. https://doi.org/10.3390/f14071491
Chen Z, Huang Y, Shen Y, Fu W, Yao X, Huang J, Lan Y, Zhu Z, Dong J. How Vegetation Colorization Design Affects Urban Forest Aesthetic Preference and Visual Attention: An Eye-Tracking Study. Forests. 2023; 14(7):1491. https://doi.org/10.3390/f14071491
Chicago/Turabian StyleChen, Ziru, Yaling Huang, Yuanping Shen, Weicong Fu, Xiong Yao, Jingkai Huang, Yuxiang Lan, Zhipeng Zhu, and Jiaying Dong. 2023. "How Vegetation Colorization Design Affects Urban Forest Aesthetic Preference and Visual Attention: An Eye-Tracking Study" Forests 14, no. 7: 1491. https://doi.org/10.3390/f14071491