
The Broken Chloroplast Gene Clusters in Gymnosperms Exhibit Elevated Substitution Rates
1
School of Life Sciences, Sun Yat-sen University, Guangzhou 510275, China
2
College of Life Sciences, South China Agricultural University, Guangzhou 510642, China
3
Research Institute of Sun Yat-sen University in Shenzhen, Shenzhen 518057, China
*
Authors to whom correspondence should be addressed.
Forests 2023, 14(8), 1681; https://doi.org/10.3390/f14081681
Submission received: 2 July 2023
/
Revised: 11 August 2023
/
Accepted: 17 August 2023
/
Published: 19 August 2023
(This article belongs to the Section Genetics and Molecular Biology)
Abstract
:Plant chloroplast (cp) gene clusters consist of genes arranged closely together on the cp genome. These genes are organized in operon structures and participate in cotranscription, typically exhibiting conservation. Broken gene clusters have been observed in gymnosperms. In order to investigate whether the substitution rates and selection pressure of associated genes are affected following the disruption of gene clusters, the cp genomes of 80 species (78 gymnosperms and 2 outgroups) were analyzed. A phylogenetic analysis was conducted using 58 shared genes to examine the evolutionary rates and selection pressure of genes associated with gene clusters and protein-coding genes in Sciadopitys verticillata. The results demonstrate that S. verticillata exhibited the highest number of rearrangements compared to the Cycas revoluta genome. Four gene clusters (rps2, psbB, rpoB, and petL clusters) in S. verticillata were disrupted, while rps2 in Callitris rhomboidea experienced disruption. Significantly increased evolutionary rates were observed in 12 out of 18 gene cluster-related genes in S. verticillata. Following disruption, S. verticillata and C. rhomboidea exhibited an increase in gene cluster-related genes, particularly rps2, and higher selection pressure on both rps2 and atpA genes compared to other species. Furthermore, among the 58 genes shared by S. verticillata, the evolutionary rates of 36 genes increased, and the selection pressure on 13 genes exceeded that of other species. These results indicate an increased substitution rate of gene clusters in S. verticillata and C. rhomboidea. The large-scale rearrangement and elevated substitution rates of the cp genome in S. verticillata were revealed. This study sheds light on the heterogeneity of cp genome evolution in gymnosperms.
1. Introduction
Chloroplasts originated from cyanobacteria that invaded or were engulfed by heterotrophic host cells (eukaryotic protozoa) around 1.5 billion years ago, giving rise to the “endosymbiosis” theory [1]. During the early stages of endosymbiogenesis, most cyanobacterial genes were lost or transferred to the nucleus of the host cell. Simultaneously, certain host genes acquired precursor sequences, facilitating their transport to the organelles [2]. The chloroplast (cp) genome is smaller compared to cyanobacteria [3]. However, it still retains some prokaryotic features, such as the organization of genes into polycistronic transcription units similar to bacterial operons [4,5]. The cp genome size of most terrestrial plants ranges between 120 and 160 kb and contains approximately 80 protein-coding genes, 4 rRNA genes, and 30 tRNA genes [6].
In 1986, Tanaka et al. discovered a cluster of eight ribosomal protein genes (rp123, rpl2, rpsl9, rp122, rps3, rpll6, rpll4, and rps8) in the tobacco cp genome, which exhibited homology to the S10 and spc operons of E. coli [7]. Later, Stern et al. observed that most cp genes are arranged in operons or operon-like structures and transcribed into polycistronic precursor molecules [8]. These precursors undergo splicing and nuclear cleavage processes to generate mature, translatable mRNA. Therefore, these cp genes clustered in operons or operon-like structures are referred to as gene clusters. Furthermore, Cui et al. utilized the bootstrap method to demonstrate that genome rearrangements in certain algae, such as Chlamydomonas, are not random. It was observed that functional genes related to translation/transcription, electron transfer, and the light system are often arranged in close proximity. Additionally, it was discovered that some newly formed gene clusters are cotranscribed, potentially representing novel regulators [9].
In the cp genome of seed plants, gene clusters are usually conserved and rarely destroyed. Four conservative gene clusters can be identified in seed plants: rps2-atpI-atpH-atpF-atpA (rps2 gene cluster), psbB-psbT-psbH-petB-petD (psbB gene cluster), rpoB-rpoC1-rpoC2 (rpoB gene cluster), and petL-petG-psaJ-rpl33-rps18 (petL gene cluster) [10]. However, in the Geraniaceae [11,12], the rps2-atpA gene cluster was lost in the latest common ancestor of Erodium texanum and Geranium palmatum, while it is still intact in Pelargonium hortorum and Phoenix speciosa. Additionally, the highly conserved S10 operon in the Geraniaceae was disrupted, with the gene cluster in E. texanum and M. speciosa being divided into two groups (rpl23-rps3 and rpl16-rpoA), while G. palmatum is divided into four parts (rpl23, rpl2, rps19-rpl22, and rps3-rpoA). Pelargonium has a complete S10 operon, although rpoA exhibits significant differences, raising questions about its function. In the cp genome of Campanulaceae, two gene clusters were destroyed: rps2-atpI-atpH-atpF-atpA and clpP-5′-rps12-rpl20 [13,14]. Similarly, in the Fabaceae cp genome, two operons (rpoB-rpoC1-rpoC2 and clpP-5′-rps12-rpl20) were lost in Trifolium [15], while recombination between the two homologous gene clusters S10A and S10B (S10, trnI-rpoA) occurred in the Vigna cp genome, leading to the rearrangement of genes within the gene cluster [16].
It has been observed that cp genes exhibit varying nucleotide substitution rates across different lineages, locations, and functional genomes [17,18,19,20]. Several factors contribute to this rate variation and influence the evolution of cp genes. These factors include differences in mutation rates between cross groups and coding/noncoding regions, as well as variations in single copy regions resulting from the presence of two inversion configurations. Gene clusters, as complete transcription units, are generally conserved. However, in some species, breakage or recombination events may occur, which can impact the transcription process and the evolutionary rates of associated protein-coding genes. In order to investigate whether gene substitution rates and selection pressures change following gene cluster breakage, this study focuses on 78 gymnosperms as research subjects. Statistical analyses are conducted on conservative gene clusters, and the evolutionary rates and selection pressures of genes are calculated within the context of the phylogenetic relationship.
2. Materials and Methods
2.1. Sequence Data
In this study, a total of 80 plants were selected, comprising 78 gymnosperms (belonging to 12 families and 51 genera) and two ferns (serving as the outgroup) (Table 1). The complete cp genomes of Callitropsis funebris and Araucaria lanceolata were sequenced in the laboratory [17], while the remaining sequences were obtained from the NCBI database. Common protein-coding genes (Table 2) were extracted using Genius Prime 2022.0.1 software [21] and further used for phylogenetic relationship construction after alignment and tandem analysis. The linear alignment of cp genomes was conducted using the “mauve module” within the Genius Prime software.
2.2. Construction of Phylogenetic Relationships
Utilizing the shared gene dataset, a neighbor joining (NJ) tree was constructed using MEGA 7.0 software [22]. Additionally, a maximum parsimony (MP) tree was built using PAUP 4.0 software [23]. For the construction of a maximum likelihood (ML) tree, RxML 8.0.20 software [24] was employed, with the GTRGAMMAI nucleotide replacement model and 1000 bootstrap replicates. A Bayesian inference (BI) tree was constructed using Mrbayes v3.2.0 software [25], specifying the following parameters: Rates = invgamma, mcmc ngen = 1,000,000. The resulting tree was manually adjusted for the analysis of evolutionary rates.
2.3. Calculation of Evolutionary Rates
Using the maximum likelihood method within the phylogeny framework, the HyPhy 2.2.4 software [26] was employed to calculate the evolutionary rates of genes. The nucleotide and HKY85 substitution models were selected for estimating the transition rate (trst), transversion rate (trsv), and the trsv/trst ratio. Moreover, the codon and MG94 × HKY85 × 3_4 substitution model were utilized to calculate the synonymous substitution rate (dS), non-synonymous substitution rate (dN), and the dN/dS (ω). Rank-sum test analysis was performed using SPSS 22 software.
2.4. Selection Pressure Analysis
The codeml program in PAML 4.9 [27] was employed to analyze the differences in selection pressure using the single ratio model (M0) and multi-ratio model (Model2) within the branching model. A likelihood ratio test was conducted between these two models to assess whether the selection pressure varied among different groups or species.
3. Results
3.1. Rearrangement and Gene Cluster Broken
Previous studies have shown that Cycas and Ginkgo biloba are typically sister taxa located at the base of gymnosperms, with shared gene order [10,28]. Therefore, taking Cycas revoluta as a reference, we conducted a comprehensive comparison with the cp genomes of Sciadopitys verticillata and Callitris rhomboidea. The results revealed that when compared to C. revoluta, S. verticillata exhibited 15 collinear blocks, with eight fragments being inverted (Figure 1a). Similarly, C. rhomboidea displayed 19 collinear blocks, with 10 fragments being inverted (Figure 1b).
The statistical results for four conserved gene clusters indicate that 76 gymnosperms possess the following gene clusters: rps2-atpI-atpH-atpF-atpA (rps2 gene cluster), psbB-psbT-psbH-petB-petD (psbB gene cluster), rpoB-rpoC1-rpoC2 (rpoB gene cluster) and petL-petG-psaJ-rpl33-rps18 (petL gene cluster). In the case of S. verticillata, four new gene clusters were formed after the original four gene clusters were broken: rps2-atpI-atpH-atpF-psbT-psbH-petB-petD, petL-petG-psaJ-rpl33-rpoC2, psbB-atpA, and rpoB-rpoC1-rps18 (Figure 2). The distance between psbB-atpA and rps2-atpI-atpH-atpF is 82.5 kb. In C. rhomboidea, the rps2 gene cluster is broken into two gene clusters, rps2-atpI and atpH-atpF-atpA, with a distance of 38.5 kb between them.
3.2. Analysis of the Evolutionary Rates of Broken Gene Clusters
This study constructed four phylogenetic relationships which showed significant differences (Figure S1). The NJ tree indicated a parallel branch relationship between Pinaceae and Zamiaceae. The positions of G. biloba and Gnetophyte exhibited notable variation. The NJ tree and MP tree suggested that Gnetophyte and other gymnosperms are sister groups, with G. biloba as a sister group to Cycads. On the other hand, both the ML tree and BI tree indicated a close relationship between Gnetophytes and Pinaceae, with G. biloba and Cycads identified as sister taxa positioned at the base of gymnosperms. Previous studies made manual adjustments to obtain phylogenetic trees for evolutionary rate analysis. According to those studies, G. biloba and Cycads form sister groups located at the base of gymnosperms, while Gnetophyte and Pinaceae are also sister groups (Figure 3).
The rps2 gene cluster is broken in S. verticillata and C. rhomboidea. Consequently, the 78 species are divided into an unbroken group (76 species) and a broken group (2 species) based on the presence or absence of the broken gene cluster. The results of the rank-sum test indicate significant differences in most of the evolutionary rate parameters between the two groups, with the broken group exhibiting rates 6 to 25 times higher than the unbroken group (Figure 4a–f). Considering both the presence of a break and its location, the 78 species are further divided into three groups: the unbroken group (76 species), C. rhomboidea, and S. verticillata. The rank-sum test results reveal significant differences among the three groups for parameters, such as trst, trsv, and dN of rps2, dS and dN of atpI, trst, trsv, ratio, and dS of atpH, trst, trsv, and dS of atpF, and dS, dN and trsv of atpA, and the substitution rates of S. verticillata and C. rhomboidea are higher compared to those of the unbroken species (Table S1).
Compared to other species, S. verticillata exhibited a significant increase in the evolutionary rates of 12 out of 18 gene cluster-related genes. Specifically, the genes rps2, atpH, atpF, psbH, rpoB and rps18 showed increased trst values (Figure 5a), while the genes atp-(A, H, F), psbB, psbH, petB, petL, rpl33, and rps18 exhibited increased trsv values (Figure 5b). Genes with increased ratio values included psbH and petD (Figure 5c), while genes with increased dN values included rps2, atpF, atpA, psbB, petL, and rps18 (Figure 5d). Additionally, genes with increased dS values included atpH, rps2, petB, petL, and rps18 (Figure 5e).
3.3. Analysis of Evolutionary Rates of Other Genes in S. verticillata
This study further investigated the evolutionary rates of other genes in S. verticillata, and the findings revealed the following: when compared to other species, 24 genes exhibited increased evolutionary rates (Figure 6, Table S2). Genes with higher trst values included atpE, cemA, psbM, petN, psaI, rbcL, rpl2, rpl14, rps-(3, 4, 7, 8, 19), and ycf2 (Figure 6a). Genes with increased trsv values consisted of atpE, petA, psaB, psb-(L, D, E, K), rpl2, rpl14, rps-(3, 7, 14), and ycf2 (Figure 6b). Genes with increased dN values included atpE, petA, psaB, psaI, psbK, rpl2, rpl14, rps-(3, 4, 7, 14), and ycf2 (Figure 6c). Additionally, genes with increased dS values included petN, psbA, psbE, rpl14, rps7, rps19, and ycf-(2, 3, 4) (Figure 6d).
3.4. Analysis of Differences in Selection Pressure
In the rps2 gene cluster, Model2-1 considers S. verticillata and C. rhomboidea as foreground branches, while Model2-2 designates them separately as foreground branches. The likelihood ratio test results comparing M0 with Model2-1 (Table 3) and M0 with Model2-2 (Table 4) indicated that the rps2 and atpA genes showed significant differences (p < 0.05), with higher selection pressure values observed in the foreground branch compared to the background branch.
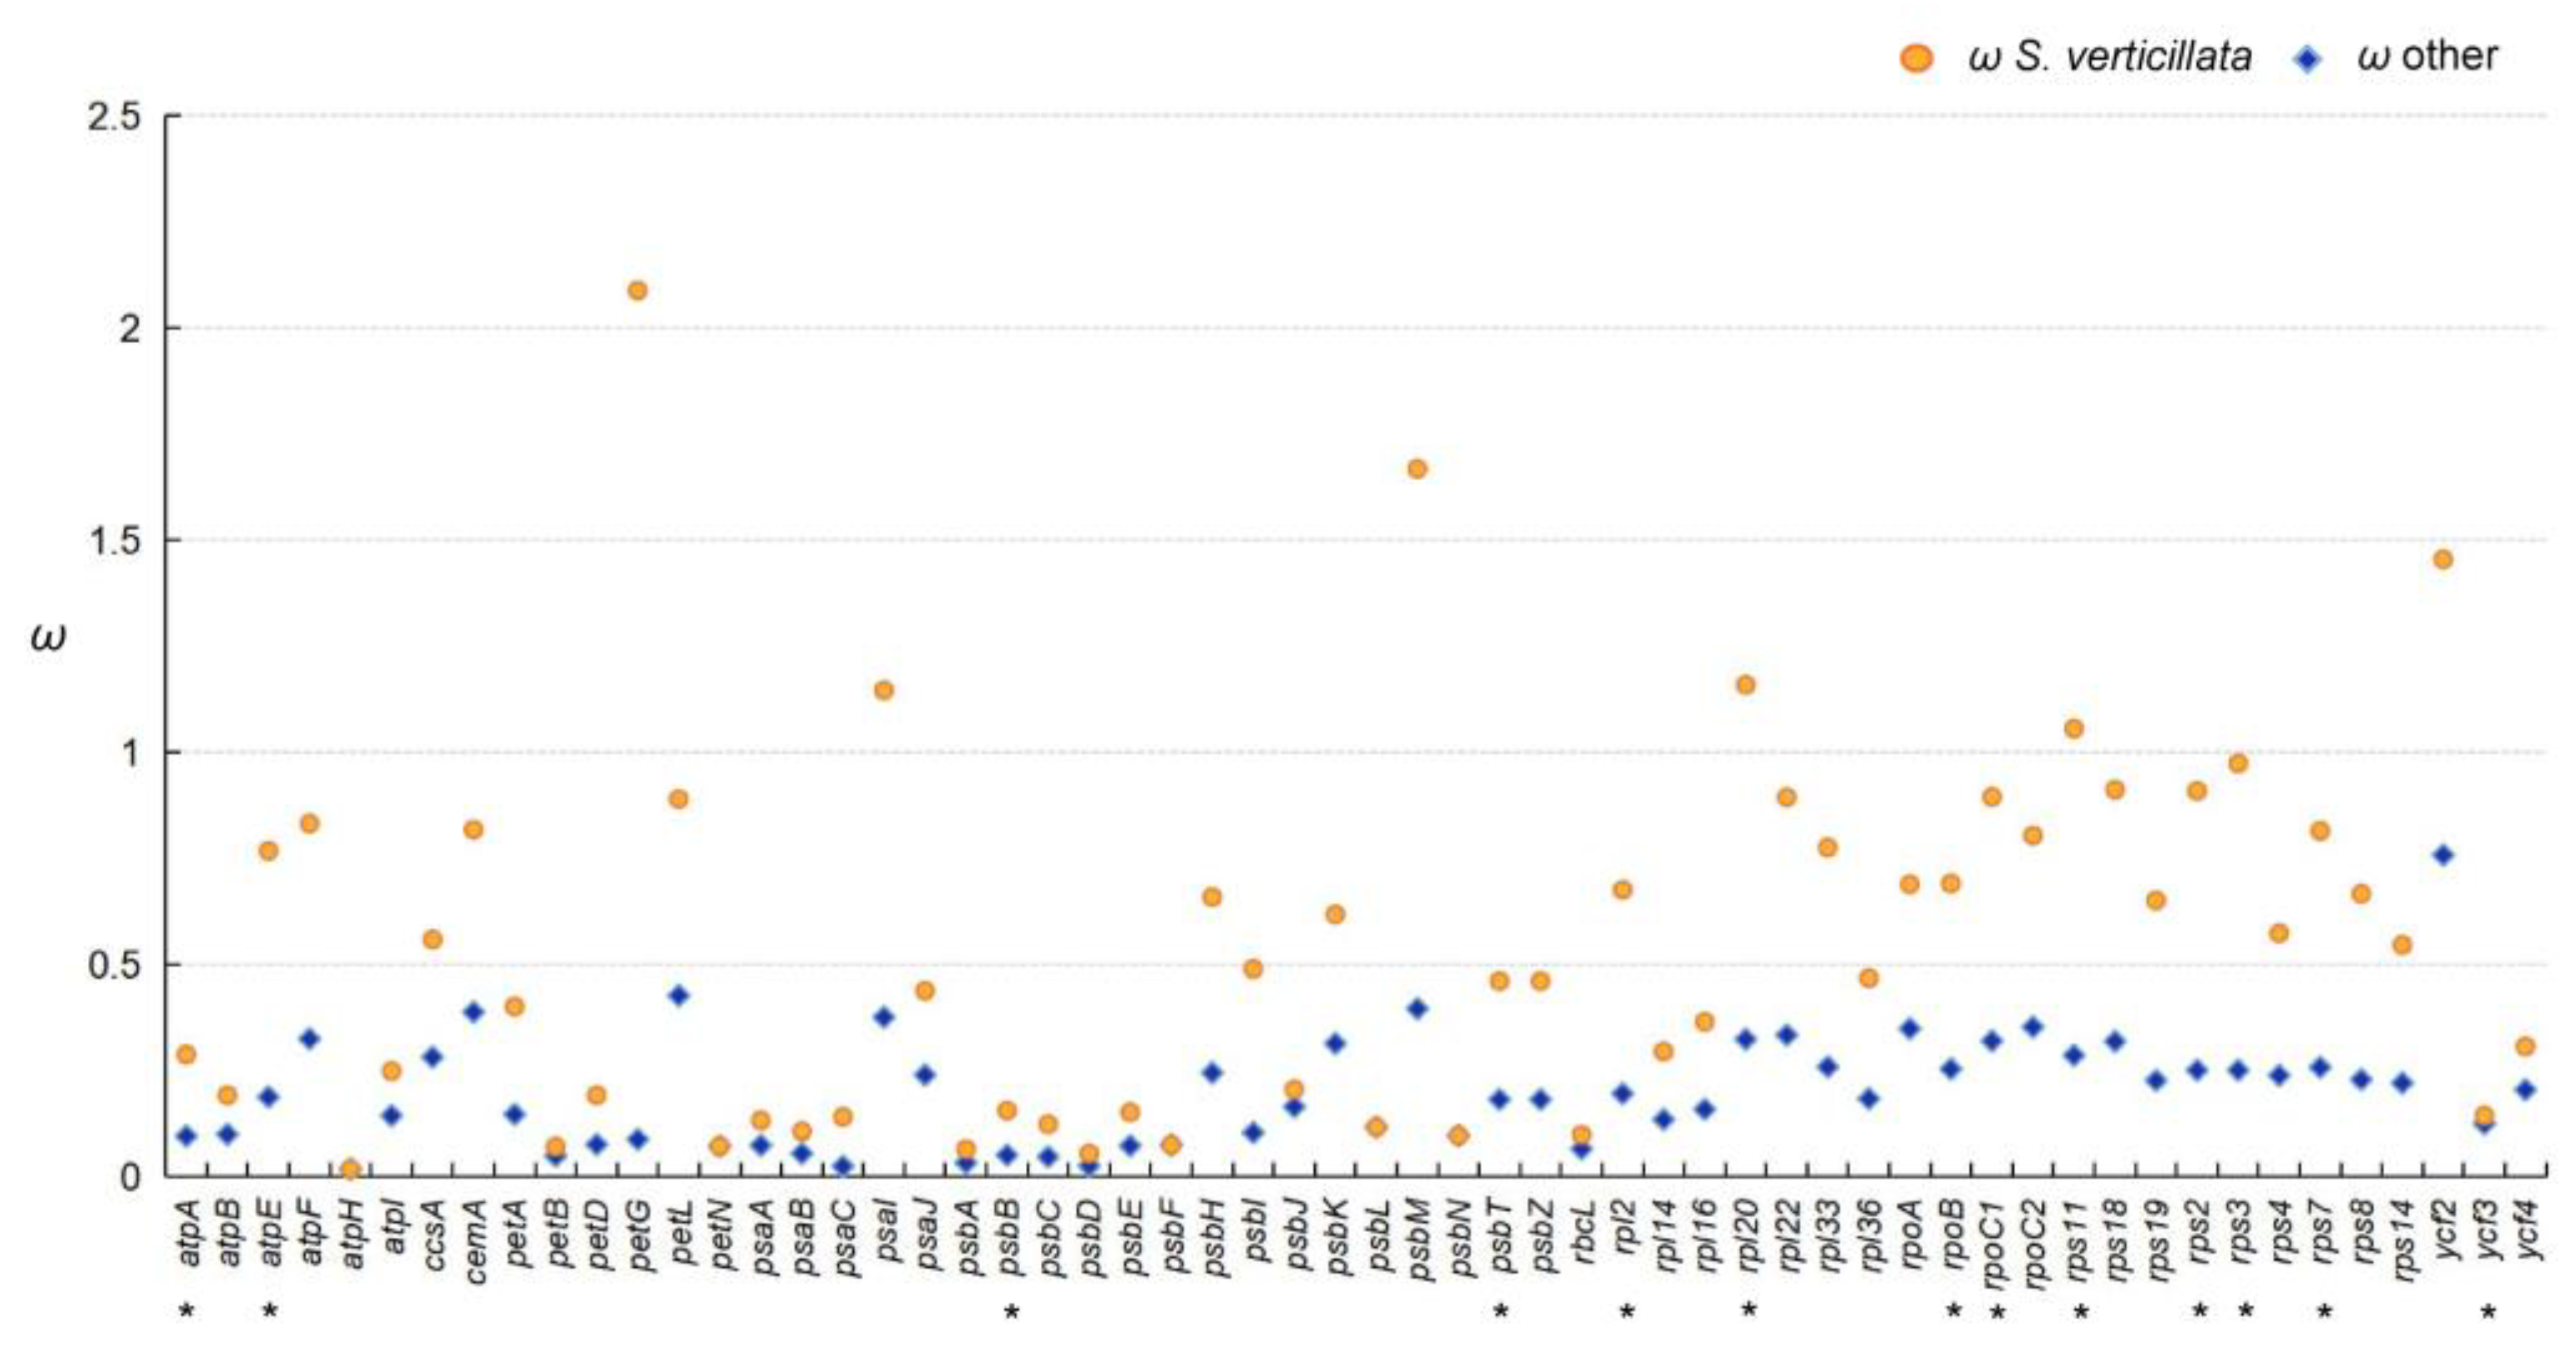
In the likelihood ratio test, where S. verticillata was considered as the foreground branch and other species were considered as the background branch, significant differences (p < 0.05) in selection pressure were observed for 13 genes (atpA, atpE, psbB, psbT, rpl2, rpl20, rpoB, rpoC1, rps11, rps2, rps3, rps7, and ycf3) between S. verticillata and the other species. Furthermore, the selection pressure value of S. verticillata was found to be higher than that of the other species (Figure 7, Table S3).
4. Discussion
4.1. Broken Chloroplast Gene Clusters Exhibit Increased Substitution Rates
During the evolutionary process of gymnosperms, the cp genome undergoes significant changes, including gene loss, genome reduction (contractions), the absence of typical inverted repeat (IR) regions in conifers, and large-scale structural rearrangements [29]. Among gymnosperms, the cp genome of S. verticillata displays substantial variation. In this study, at least 15 rearrangements were observed in S. verticillata compared to C. revoluta. Li et al. reported 8 inversions between S. verticillata and Amentotaxus formosana, as well as 10 rearrangements between S. verticillata and Cephalotaxus oliveri [30]. Furthermore, Hsu et al. identified several unique features in the S. verticillata cp genome, such as the loss of typical IR A copies, the replication and pseudogenization of four tRNA genes, extensive genome inversion, the presence of isomeric forms, and the fragmentation and recombination of gene clusters [31]. These findings collectively underscore the distinctive cp genome structure of S. verticillata. The existence of IR regions contributes to the stability of the cp genome [5,32], and the extensive rearrangements observed in the S. verticillata cp genome may be associated with the loss of IR regions.
Many genes in the plant cp genome are organized into gene clusters, similar to bacterial operons, where genes are cotranscribed. These cp gene clusters are usually highly conserved. The large-scale rearrangement, especially inversion, of the cp genome of S. verticillata resulted in the disruption of the conservative gene cluster and the formation of four new gene clusters. Among these four newly formed gene clusters, only the rpoB-rps18 gene cluster underwent no changes in the promoter sequence after inversion recombination [31]. The rearrangement in C. rhomboideais is less extensive compared to S. verticillata, but it still caused the breakage of the rps2 gene cluster, consistent with Wu and Chaw’s findings [33]. We observed a significant increase in the substitution rates of related genes when gene clusters were disrupted in both S. verticillata and C. rhomboideais. These results suggest that the disruption of gene clusters leads to an acceleration of evolutionary rates in associated genes.
Although the breakage of conservative gene clusters is rare, it has been identified in numerous species [12,13,14,15,34]. In Taxus wallichiana, the S10 gene cluster was found to be separated into two clusters, rpl23-rps8 and infA-rpoA, by an 18kb inversion. This separation resulted in a significantly increased mutation rate in these two clusters, and among the three protein-coding genes in the infA-rpoA cluster, infA and rps11 were positively selected. However, the direct relationship between the destruction of the S10 gene cluster and the positive selection of these two genes remains unclear [35]. The evolutionary rates of terrestrial plant cp genomes are much slower than those of mitochondria, and this conserved nature may be attributed to the shared gene cluster organization among cyanobacteria, green algae, and terrestrial plants [5]. Most terrestrial plant cp genomes not only exhibit highly conserved gene content but also maintain a similar gene order. The selective maintenance and directional selection of gene clusters determine the gene order. For instance, in archaebacteria, eubacteria, and plastids [36], ribosomal proteins are encoded by similar operons. In eukaryotic genomes, the coexpression of adjacent genes is significantly correlated with their functional roles [37].
4.2. Increased Substitution Rates in S. verticillata
We detected a total of 36 protein-coding genes with increased substitution rates in S. verticillata, which may be attributed to its highly mutated cp genome. The analysis of selection pressure revealed that 13 genes in S. verticillata exhibited relaxed negative selection, including four genes associated with gene clusters and five other genes, indicating that the elevated substitution rates of these genes may be influenced by selection pressure. During the evolutionary process of gymnosperms, several events of heterogeneity in evolutionary rates have been observed. For instance, there are nine genes that display differences in substitution rates between conifers (lacking typical IR regions) and non-conifers [38]. In the rps12 gene of non-conifer plants, the substitution rates of exon 1 in the single-copy region are higher than those of exons 2-3 in the IR region [19]. Zhu et al. discovered that genes that have moved away from the IR regions in conifers exhibit an accelerated nucleotide substitution rate [17]. Increased substitution rates have also been observed in Welwitschia mirabilis [39] and Gnetophytes [28,40]. The increased substitution rate in Gnetophytes may be associated with changes in selective pressure, genetic drift, and biological traits [41,42]. Weng et al. found that the increased extent of plastid genome rearrangement in Geraniaceae is correlated with accelerated dN [43]. Therefore, the increased substitution rates in the cp genes of S. verticillata could be linked to its large-scale structural rearrangements.
4.3. The Phylogenetic Relationships within Gymnosperms
The phylogenetic relationships within gymnosperms, particularly the position of G. biloba and Gnetophytes, have long been a subject of debate [29]. In this study, four phylogenetic trees revealed three different relationships. The ML and BI trees placed Gnetophytes within Pinaceae, suggesting a closer relationship between Gnetophytes and Pinaceae. Regarding the placement of Gnetophytes, three main hypotheses have been proposed: (1) Gnetophytes as a sister group to conifers, referred to as “gnetifers” [44]; (2) Gnetophytes as a sister group to Pinaceae, known as “gnepines” [28,45]; and (3) Gnetophytes as a sister group to cupressophytes, termed “gnecup” [46]. Currently, more evidence supports the “gnepines” hypothesis, based on cp genome sequences [19,45], structural features such as the loss of the rps16 gene [47] and ndh genes [48], as well as nuclear sequence data [28,49]. Regarding G. biloba, more studies have shown that it is closely related as a sister clade to the Cycads, located at the base of gymnosperms [28,47].
5. Conclusions
The cp genome of gymnosperms has undergone significant rearrangements during the evolutionary process, resulting in both a complex genome structure and an impact on gene expression. The rearrangement of the cp genomes of S. verticillata and C. rhomboidea has caused disruptions in gene clusters, leading to increased substitution rates in genes associated with these clusters. Further analysis through comparative transcriptomics is needed to determine whether the expression of genes affected by cluster disruptions changes after relocation.
Supplementary Materials
The following supporting information can be downloaded at: https://www.mdpi.com/article/10.3390/f14081681/s1, Figure S1. Phylogenetic tree constructed using four methods. (a) Neighbor-joining tree. (b) Maximum Parsimony tree. (c) Maximum likelihood tree. (d) Bayesian Inference tree. Table S1. Comparison of evolutionary rates in rps2 gene clusters among Sciadopitys verticillata, Callitris rhomboidea and other species. Table S2. Comparison of evolutionary rates in other genes between Sciadopitys verticillata and other species. Table S3. Analysis of selection pressure between Sciadopitys verticillata and other species.
Author Contributions
Writing—Original Draft Preparation and Software, J.P.; Software, X.Z.; Writing—Review and Editing and Funding Acquisition, T.W. and Y.S. All authors have read and agreed to the published version of the manuscript.
Funding
This work was supported by Natural Science Foundation of China [31670200, 31770587, 31872670, and 32071781], Guangdong Basic and Applied Basic Research Foundation [2021A1515010911], Science and Technology Projects in Guangzhou [202206010107], and Project of Department of Science and Technology of Shenzhen City, Guangdong, China [JCYJ20190813172001780 and JCYJ20210324141000001].
Data Availability Statement
Conflicts of Interest
The authors declare no conflict of interest.
References
- Chan, C.X.; Gross, J.; Yoon, H.S.; Bhattacharya, D. Plastid origin and evolution: New models provide insights into old problems. Plant Physiol. 2011, 155, 1552–1560. [Google Scholar] [CrossRef] [PubMed]
- Green, B.R. Chloroplast genomes of photosynthetic eukaryotes. Plant J. 2011, 66, 34–44. [Google Scholar] [CrossRef] [PubMed]
- Ku, C.; Nelson-Sathi, S.; Roettger, M.; Sousa, F.L.; Lockhart, P.J.; Bryant, D.; Hazkani-Covo, E.; McInerney, J.O.; Landan, G.; Martinet, W.F. Endosymbiotic origin and differential loss of eukaryotic genes. Nature 2015, 524, 427–432. [Google Scholar] [CrossRef] [PubMed]
- Sugiura, M. The chloroplast genome. Plant Mol. Biol. 1992, 19, 149–168. [Google Scholar] [CrossRef] [PubMed]
- Wicke, S.; Schneeweiss, G.M.; Depamphilis, C.W.; Müller, K.F.; Quandt, D. The evolution of the plastid chromosome in land plants: Gene content, gene order, gene function. Plant Mol. Biol. 2011, 76, 273–297. [Google Scholar] [CrossRef] [PubMed]
- Mower, J.P.; Vickrey, T. L Structural diversity among plastid genomes of land plants. Adv. Bot. Res. 2018, 85, 263–292. [Google Scholar]
- Tanaka, M.; Wakasugi, T.; Sugita, M.; Shinozaki, K.; Sugiurae, M. Genes for the eight ribosomal proteins are clustered on the chloroplast genome of tobacco (Nicotiana tabacum): Similarity to the S10 and spc operons of Escherichia coli. Proc. Natl. Acad. Sci. USA 1986, 86, 6030–6034. [Google Scholar] [CrossRef]
- Stern, D.B.; Goldschmidt-Clermont, M.; Hanson, M.R. Chloroplast RNA metabolism. Annu. Rev. Plant Biol. 2010, 61, 125–155. [Google Scholar] [CrossRef]
- Cui, L.; Leebens-Mack, J.; Wang, L.S.; Tang, J.J.; Rymarquis, L.; Stern, D.B.; DePamphilis, C.W. Adaptive evolution of chloroplast genome structure inferred using a parametric bootstrap approach. BMC Evol. Biol. 2006, 6, 13. [Google Scholar] [CrossRef]
- Jansen, R.K.; Ruhlman, T.A. Plastid genomes of seed plants. In Genomics of Chloroplasts and Mitochondria; Bock, R., Knoop, V., Eds.; Springer: Dordrecht, Switzerland, 2012; Volume 35, pp. 103–126. [Google Scholar]
- Chumley, T.W.; Palmer, J.D.; Mower, J.P.; Fourcade, H.M.; Calie, P.J.; Boore, J.L.; Jansen, R.K. The complete chloroplast genome sequence of Pelargonium × hortorum: Organization and evolution of the largest and most highly rearranged chloroplast genome of land plants. Mol. Biol. Evol. 2006, 23, 2175–2190. [Google Scholar] [CrossRef]
- Guisinger, M.M.; Kuehl, J.V.; Boore, J.L.; Jansen, R.K. Extreme reconfiguration of plastid genomes in the angiosperm family Geraniaceae: Rearrangements, repeats, and codon usage. Mol. Biol. Evol. 2011, 28, 583–600. [Google Scholar] [CrossRef] [PubMed]
- Haberle, R.C. Phylogeny and comparative chloroplast genomics of the Campanulaceae. Ph.D. Thesis, University of Texas, Austin, TX, USA, 2006. [Google Scholar]
- Haberle, R.C.; Fourcade, H.M.; Boore, J.L.; Jansen, R.K. Extensive rearrangements in the chloroplast genome of Trachelium caeruleum are associated with repeats and tRNA genes. J. Mol. Evol. 2008, 66, 350–361. [Google Scholar] [CrossRef] [PubMed]
- Cai, Z.; Guisinger, M.; Kim, H.G.; Ruck, E.; Blazier, J.C.; McMurtry, V.; Kuehl, J.V.; Boore, J.L.; Jansen, R.K. Extensive reorganization of the plastid genome of Trifolium subterraneum (Fabaceae) is associated with numerous repeated sequences and novel DNA insertions. J. Mol. Evol. 2008, 67, 696–704. [Google Scholar] [CrossRef]
- Perry, A.S.; Brennan, S.; Murphy, D.J.; Kavanagh, T.A.; Wolfe, K.H. Evolutionary re-organisation of a large operon in adzuki bean chloroplast DNA caused by inverted repeat movement. DNA Res. 2002, 9, 157–162. [Google Scholar] [CrossRef] [PubMed]
- Zhu, A.-D.; Guo, W.-H.; Gupta, S.; Fan, W.S.; Mower, J.P. Evolutionary dynamics of the plastid inverted repeat: The effects of expansion, contraction, and loss on substitution rates. New Phytol. 2016, 209, 1747–1756. [Google Scholar] [CrossRef] [PubMed]
- Li, F.W.; Kuo, L.Y.; Pryer, K.M.; Rothfels, C.J. Genes translocated into the plastid inverted repeat show decelerated substitution rates and elevated GC content. Genome Biol. Evol. 2016, 8, 2452–2458. [Google Scholar] [CrossRef] [PubMed]
- Ping, J.-Y.; Feng, P.-P.; Hao, J.; Li, J.-Y.; Su, Y.-J.; Wang, T. The molecular evolution pattern of rps12 gene in gymnosperms. Chin. Sci. Bull. 2021, 66, 3182–3193. (In Chinese) [Google Scholar] [CrossRef]
- Ping, J.-Y.; Li, A.-M.; Feng, P.-P.; Zhu, M.; Su, Y.-J.; Wang, T. The highly conserved rps12 gene in ferns provides strong evidence for decreased substitution rates in the inverted repeat region. Plant Syst. Evol. 2021, 307, 26. [Google Scholar] [CrossRef]
- Kearse, M.; Moir, R.; Wilson, A.; Stones-Havas, S.; Cheung, M.; Sturrock, S.; Buxton, S.; Cooper, A.; Markowitz, S.; Duran, C.; et al. Geneious basic: An integrated and extendable desktop software platform for the organization and analysis of sequence data. Bioinformatics 2012, 28, 1647–1649. [Google Scholar] [CrossRef]
- Kumar, S.; Stecher, G.; Li, M.; Knyaz, C.; Tamura, K. MEGA X: Molecular evolutionary genetics analysis across computing platforms. Mol. Biol. Evol. 2018, 35, 1547–1549. [Google Scholar] [CrossRef]
- Swofford, D.L. PAUP*: Phylogenetic Analysis Using Parsimony (and Other Methods), Version 4.0b10; Sinauer Associates: Sunderland, MA, USA, 2002. [Google Scholar]
- Stamatakis, A. RaxML version 8: A tool for phylogenetic analysis and post-analysis of large phylogeies. Bioinformatics 2014, 30, 1312–1313. [Google Scholar] [CrossRef] [PubMed]
- Huelsenbeck, J.P.; Ronquist, F. MRBAYES: Bayesian inference of phylogenetic trees. Bioinformatics 2001, 17, 754–755. [Google Scholar] [CrossRef]
- Pond, S.L.; Frost, S.D.; Muse, S.V. HyPhy: Hypothesis testing using phylogenies. Bioinformatics 2005, 21, 676–679. [Google Scholar] [CrossRef] [PubMed]
- Yang, Z.H. PAML 4: Phylogenetic analysis by maximum likelihood. Mol. Biol. Evol. 2007, 24, 1586–1591. [Google Scholar] [CrossRef] [PubMed]
- Ran, J.-H.; Shen, T.-T.; Wang, M.-M.; Wang, X.-Q. Phylogenomics resolves the deep phylogeny of seed plants and indicates partial convergent or homoplastic evolution between Gnetales and angiosperms. Proc. R. Soc. B 2018, 285, 20181012. [Google Scholar] [CrossRef]
- Chaw, S.M.; Wu, C.S.; Sudianto, E. Evolution of gymnosperm plastid genomes. In Advances in Botanical Research; Chaw, S.M., Jansen, R.K., Eds.; Academic Press: New York, NY, USA, 2018; Volume 85, pp. 195–222. [Google Scholar]
- Li, J.; Gao, L.; Chen, S.; Tao, K.; Su, Y.-J.; Wang, T. Evolution of short inverted repeat in cupressophytes: Transfer of accD to nucleus in Sciadopitys verticillata and phylogenetic position of Sciadopityaceae. Sci. Rep. 2016, 6, 20934. [Google Scholar] [CrossRef] [PubMed]
- Hsu, C.Y.; Wu, C.S.; Chaw, S.M. Birth of four chimeric plastid gene clusters in Japanese Umbrella Pine. Genome Biol. Evol. 2016, 6, 1776–1784. [Google Scholar] [CrossRef] [PubMed]
- Palmer, J.D.; Thompson, W. F Chloroplast DNA rearrangements are more frequent when a large inverted repeat sequence is lost. Cell 1982, 29, 537–550. [Google Scholar] [CrossRef] [PubMed]
- Wu, C.; Chaw, S. Large-Scale Comparative analysis reveals the mechanisms driving plastomic compaction, reduction, and inversions in Conifers II (Cupressophytes). Genome Biol. Evol. 2016, 8, 3740–3750. [Google Scholar] [CrossRef]
- Palmer, J.D.; Osorio, B.; Thompson, W.F. Evolutionary significance of inversions in legume chloroplast DNAs. Curr. Genet. 1988, 14, 65–74. [Google Scholar] [CrossRef]
- Hsu, C.Y.; Wu, C.S.; Chaw, S.M. Ancient nuclear plastid DNA in the yew family (Taxaceae). Genome Biol. Evol. 2014, 6, 2111–2121. [Google Scholar] [CrossRef] [PubMed]
- Stoebe, B.; Kowallik, K.V. Gene-cluster analysis in chloroplast genomics. Trends Genet. 1999, 15, 344–347. [Google Scholar] [CrossRef] [PubMed]
- Lercher, M.J.; Urrutia, A.O.; Hurst, L.D. Clustering of housekeeping genes provides a unified model of gene order in the human genome. Nat. Genet. 2002, 31, 180–183. [Google Scholar] [CrossRef] [PubMed]
- Ping, J.-Y.; Hao, J.; Li, J.-Y.; Su, Y.-J.; Wang, T. Loss of the IR region in conifer plastomes: Changes in the selection pressure and substitution rate of protein-coding genes. Ecol. Evol. 2022, 12, e8499. [Google Scholar] [CrossRef] [PubMed]
- Mccoy, S.; Kuehl, J.; Boore, J.; Raubeson, L.A. The complete plastid genome sequence of Welwitschia mirabilis: An unusually compact plastome with accelerated divergence rates. BMC Evol. Biol. 2008, 8, 130. [Google Scholar] [CrossRef]
- Wang, B.; Jiang, B.; Zhou, Y.; Su, Y.-J.; Wang, T. Higher substitution rates and lower dN/dS for the plastid genes in Gnetales than other gymnosperms. Biochem. Syst. Ecol. 2015, 59, 278–287. [Google Scholar] [CrossRef]
- Fry, A.J.; Wernegreen, J.J. The roles of positive and negative selection in the molecular evolution of insect endosymbionts. Gene 2005, 355, 1–10. [Google Scholar] [CrossRef] [PubMed]
- Lanfear, R.; Welch, J.J.; Bromham, L. Watching the clock: Studying variation in rates of molecular evolution between species. Trends Ecol. Evol. 2010, 25, 495–503. [Google Scholar] [CrossRef] [PubMed]
- Weng, M.L.; Blazier, J.C.; Govindu, M.; Jansen, R.K. Reconstruction of the ancestral plastid genome in Geraniaceae reveals a correlation between genome rearrangements, repeats, and nucleotide substitution rates. Mol. Biol. Evol. 2014, 31, 645–659. [Google Scholar] [CrossRef]
- Chaw, S.M.; Zharkikh, A.; Sung, H.M.; Lau, T.C.; Li, W.H. Molecular phylogeny of extant gymnosperms and seed plant evolution: Analysis of nuclear 18S rRNA sequences. Mol. Biol. Evol. 1997, 14, 56–68. [Google Scholar] [CrossRef]
- Zhong, B.; Deusch, O.; Goremykin, V.V.; Penny, D.; Biggs, P.J.; Atherton, R.A.; Nikiforova, S.V.; Lockhart, P.J. Systematic error in seed plant phylogenomics. Genome Biol.Evol. 2011, 3, 1340–1348. [Google Scholar] [CrossRef] [PubMed]
- Ruhfel, B.R.; Gitzendanner, M.A.; Soltis, P.S.; Soltis, D.E.; Burleigh, J.G. From algae to angiosperms—Inferring the phylogeny of green plants (Viridiplantae) from 360 plastid genomes. BMC Evol. Biol. 2014, 14, 23. [Google Scholar] [CrossRef] [PubMed]
- Wu, C.S.; Chaw, S.M.; Huang, Y.Y. Chloroplast phylogenomics indicates that Ginkgo biloba is sister to cycads. Genome Biol. Evol. 2013, 5, 243–254. [Google Scholar] [CrossRef] [PubMed]
- Braukmann, T.W.; Kuzmina, M.; Stefanovic, S. Loss of all plastid ndh genes in Gnetales and conifers: Extent and evolutionary significance for the seed plant phylogeny. Curr. Genet. 2009, 55, 323–337. [Google Scholar] [CrossRef] [PubMed]
- Li, Z.; De La Torre, A.R.; Sterck, L.; Canovas, F.M.; Avila, C.; Merino, I.; Cabezas, J.A.; Cervera, M.T.; Ingvarsson, P.K.; Van de Peer, Y. Single-copy genes as molecular markers for phylogenomic studies in seed plants. Genome Biol. Evol. 2017, 9, 1130–1147. [Google Scholar] [CrossRef] [PubMed]
Figure 1.
Synteny alignment of the chloroplast genome. (a) Sciadopitys verticillata and Cycas revoluta. (b) Callitris rhomboidea and C. revoluta.
Figure 1.
Synteny alignment of the chloroplast genome. (a) Sciadopitys verticillata and Cycas revoluta. (b) Callitris rhomboidea and C. revoluta.
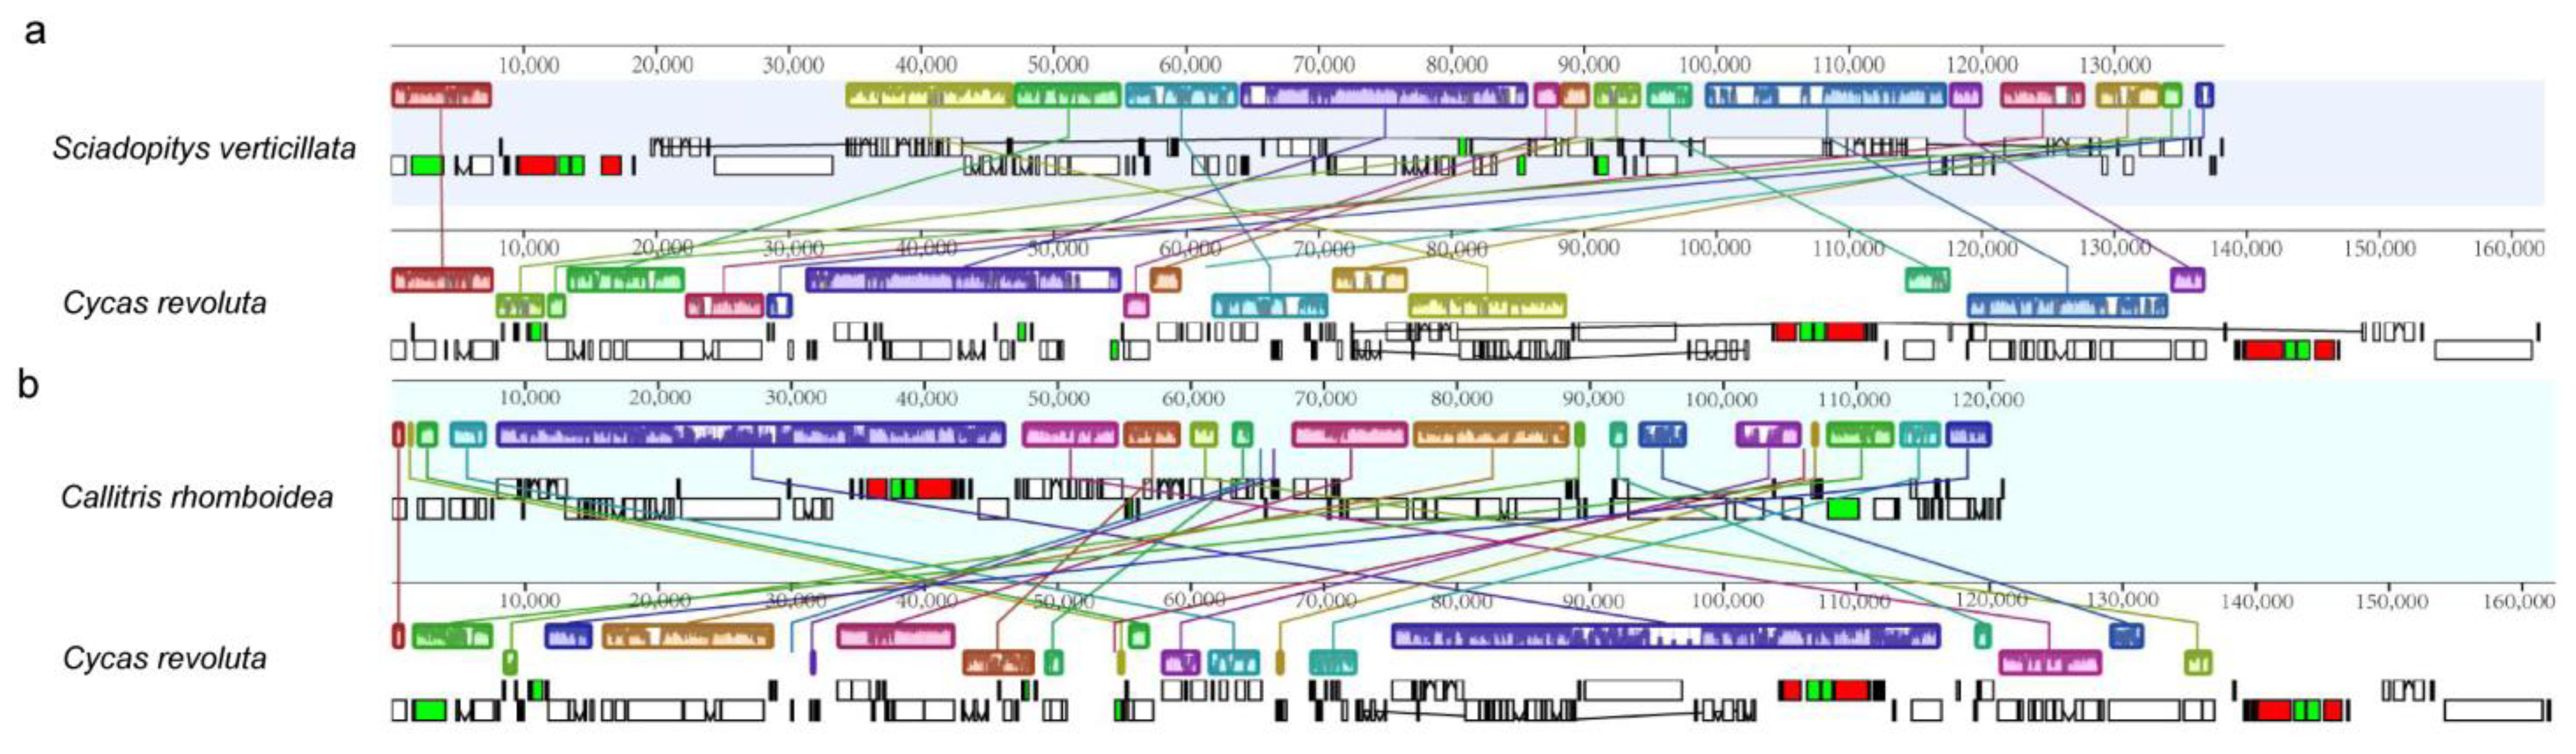
Figure 2.
The breakage and recombination of four gene clusters in the chloroplast genome of Sciadopitys verticillata.
Figure 2.
The breakage and recombination of four gene clusters in the chloroplast genome of Sciadopitys verticillata.
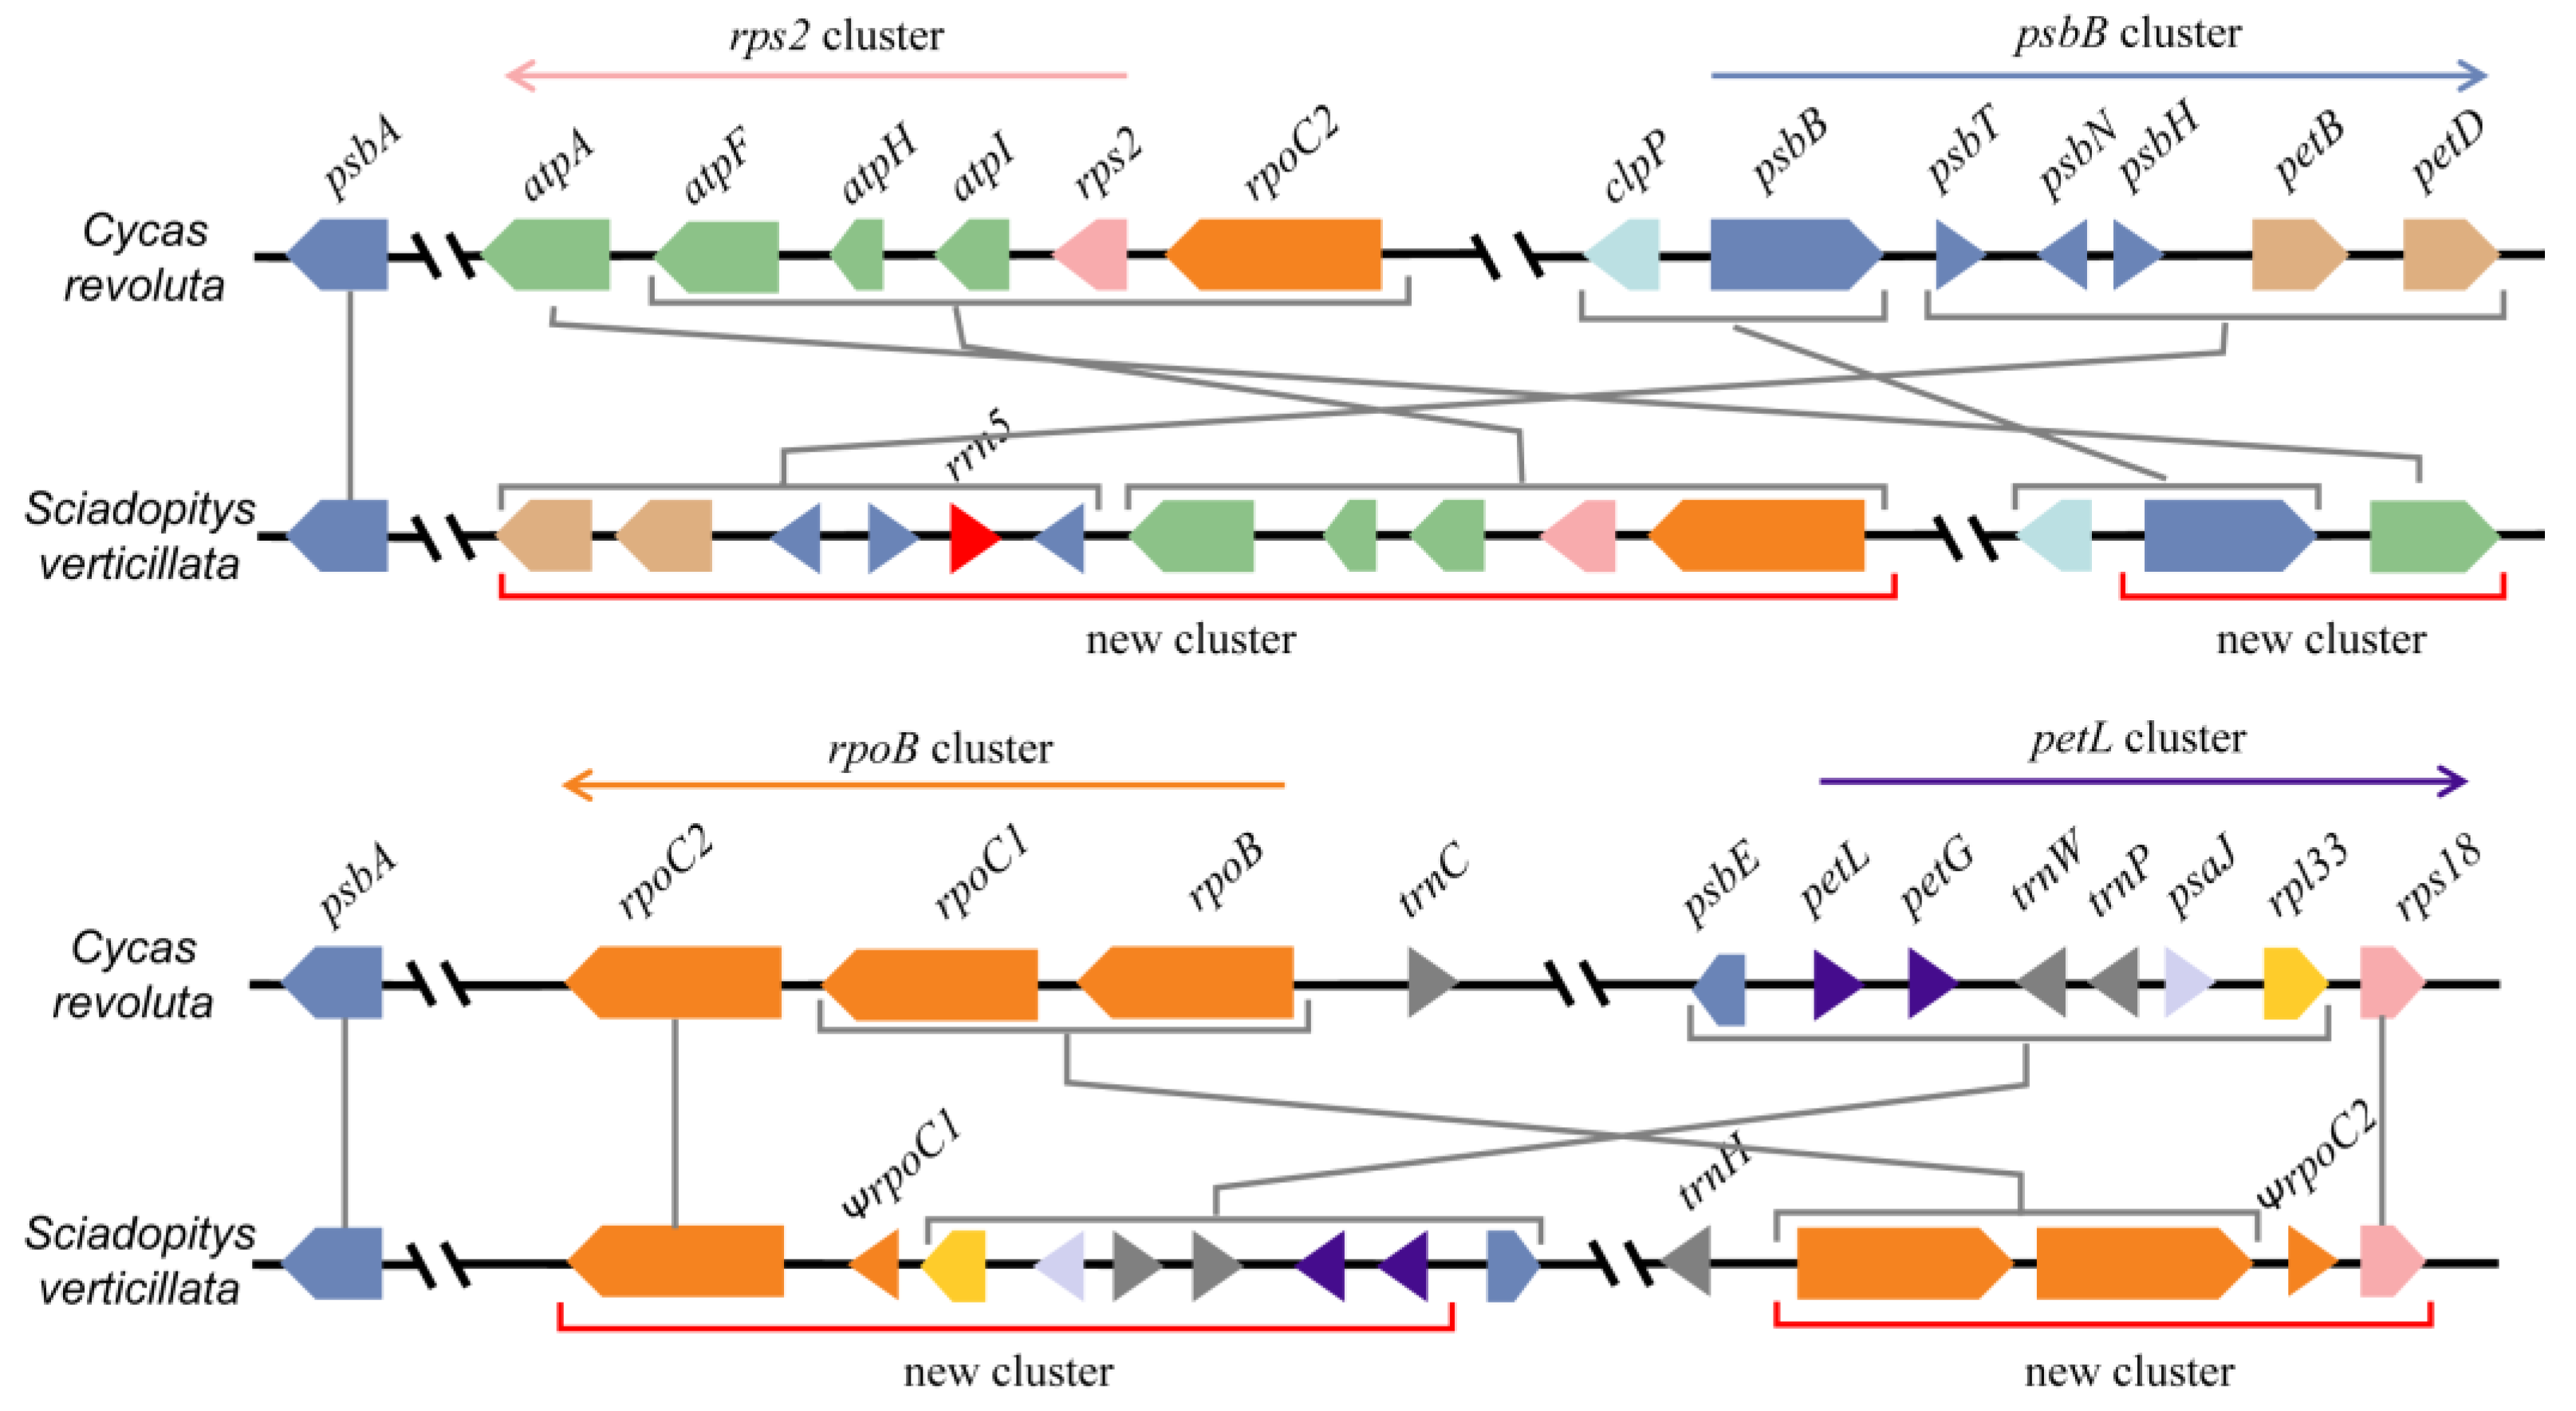
Figure 3.
Phylogenetic relationships of sampled species.
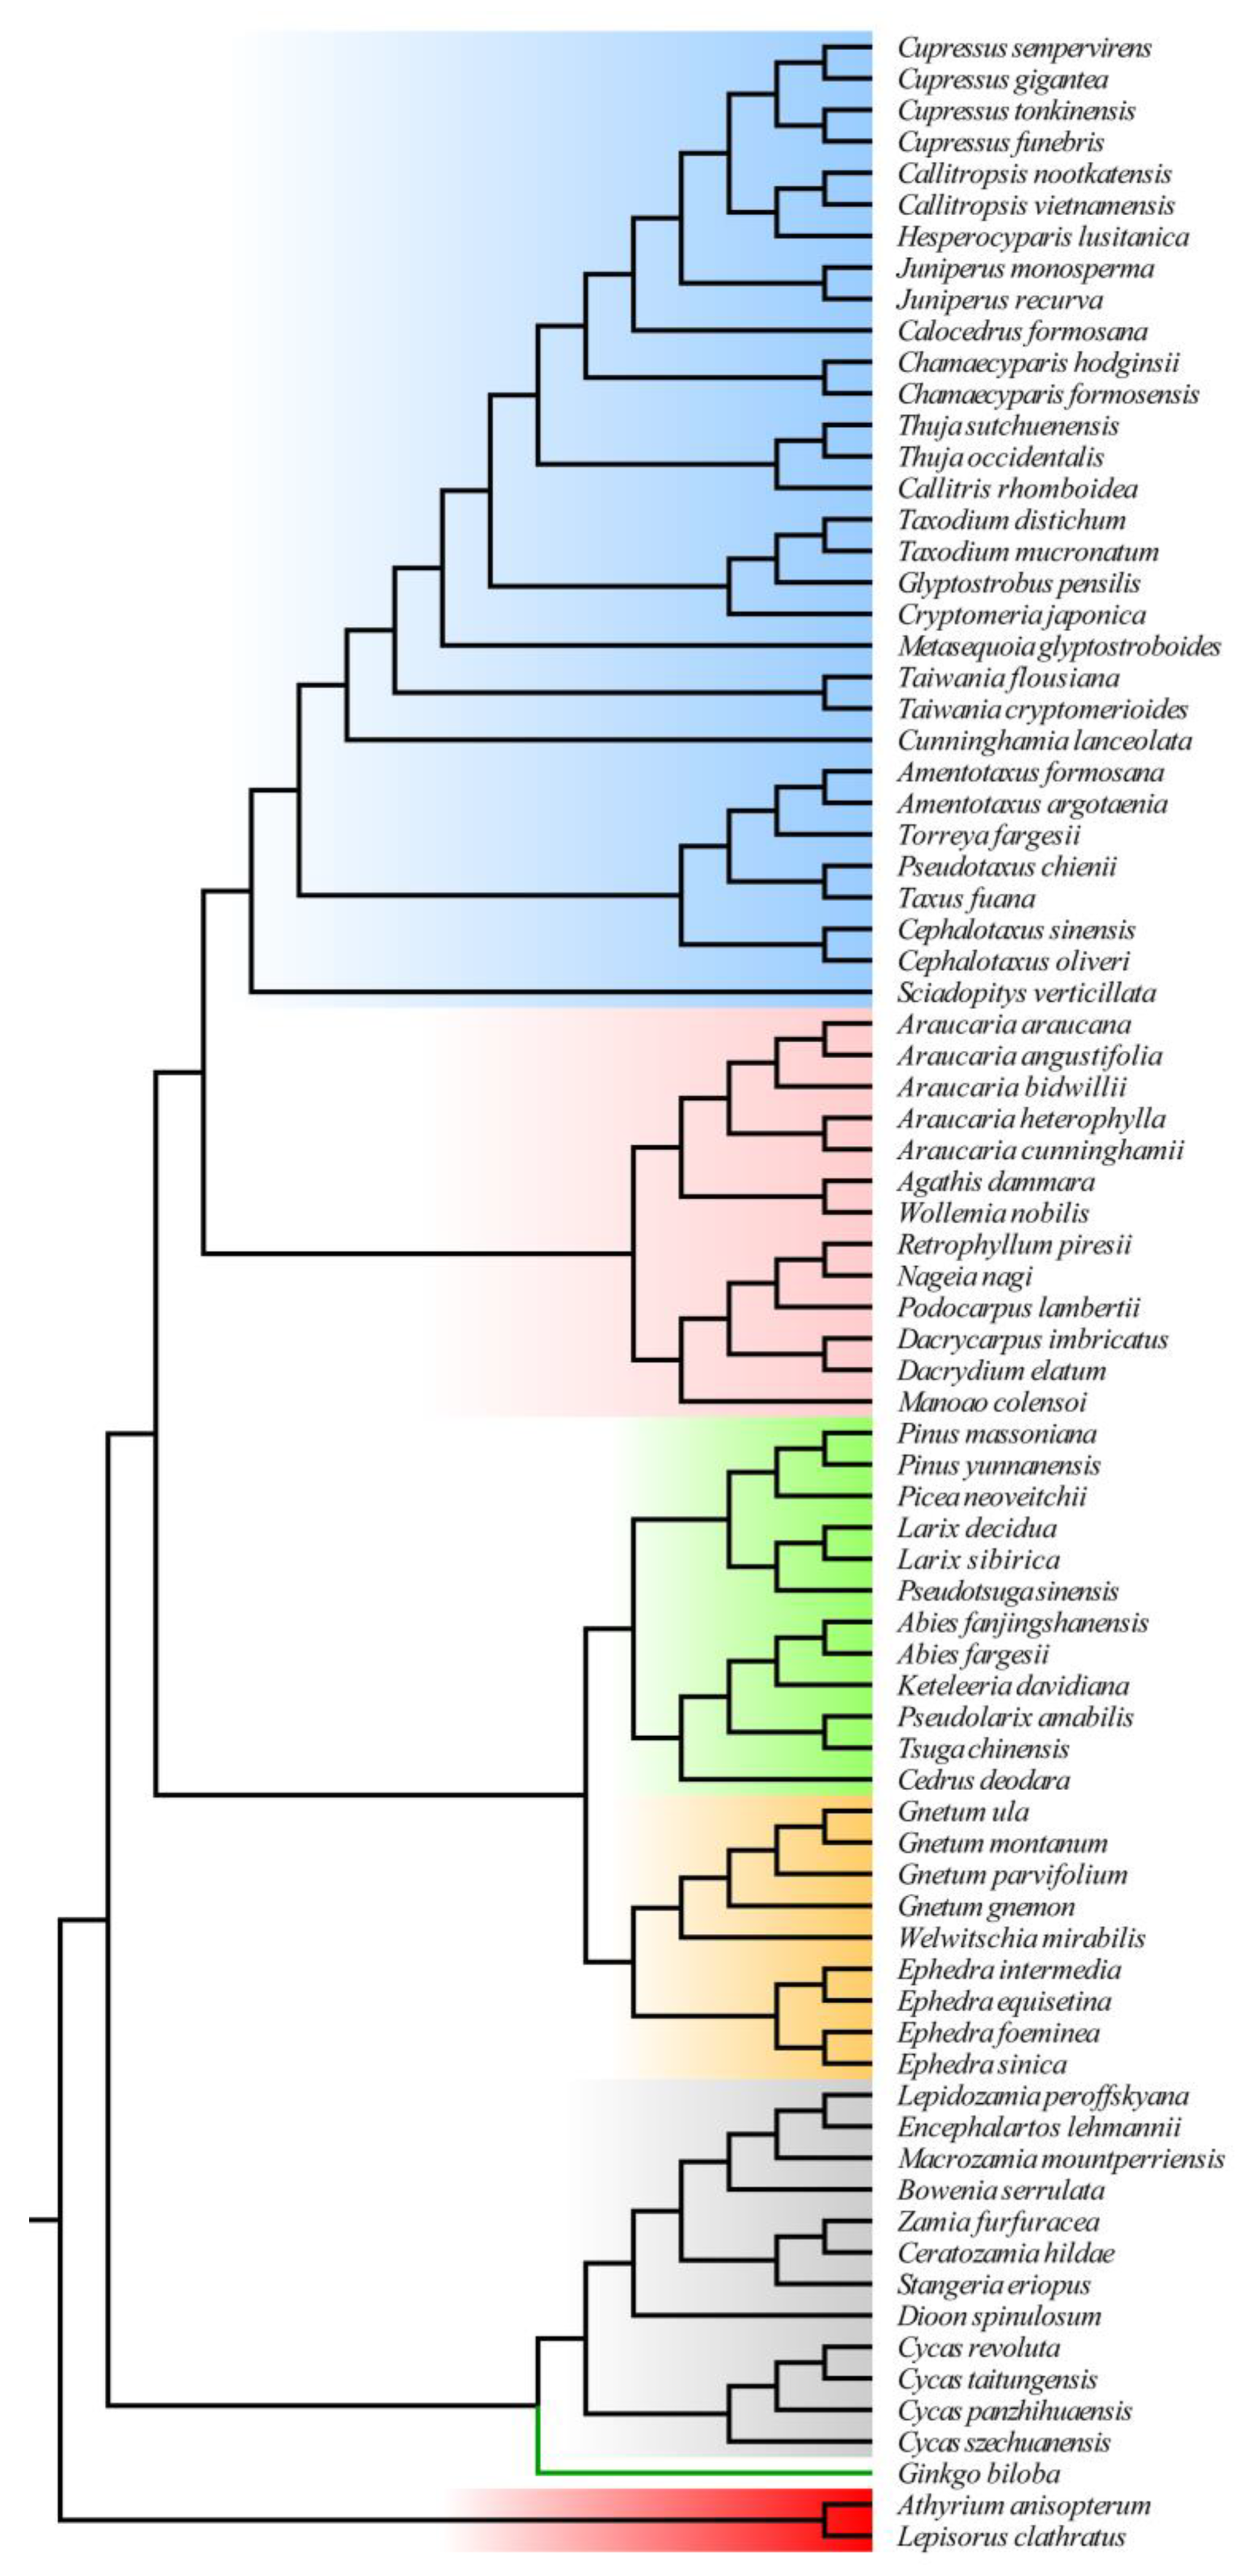
Figure 4.
Comparison of evolutionary rates between the broken and unbroken groups in the rps2 gene cluster. (a) Transition rate (trst). (b) Transversion rate (trsv). (c) ratio (trsv/trst). (d) Nonsynonymous substitution rate (dN). (e) Synonymous substitution rate (dS). (f) ω(dN/dS). * indicates statistical significance at p < 0.05.

Figure 5.
Comparison of evolutionary rates among three gene clusters between S. verticillata and other species. (a) Transition rate (trst). (b) Transversion rate (trsv). (c) ratio (trsv/trst). (d) Nonsynonymous substitution rate (dN). (e) Synonymous substitution rate (dS). (f) ω(dN/dS). * indicates statistical significance at p < 0.05.
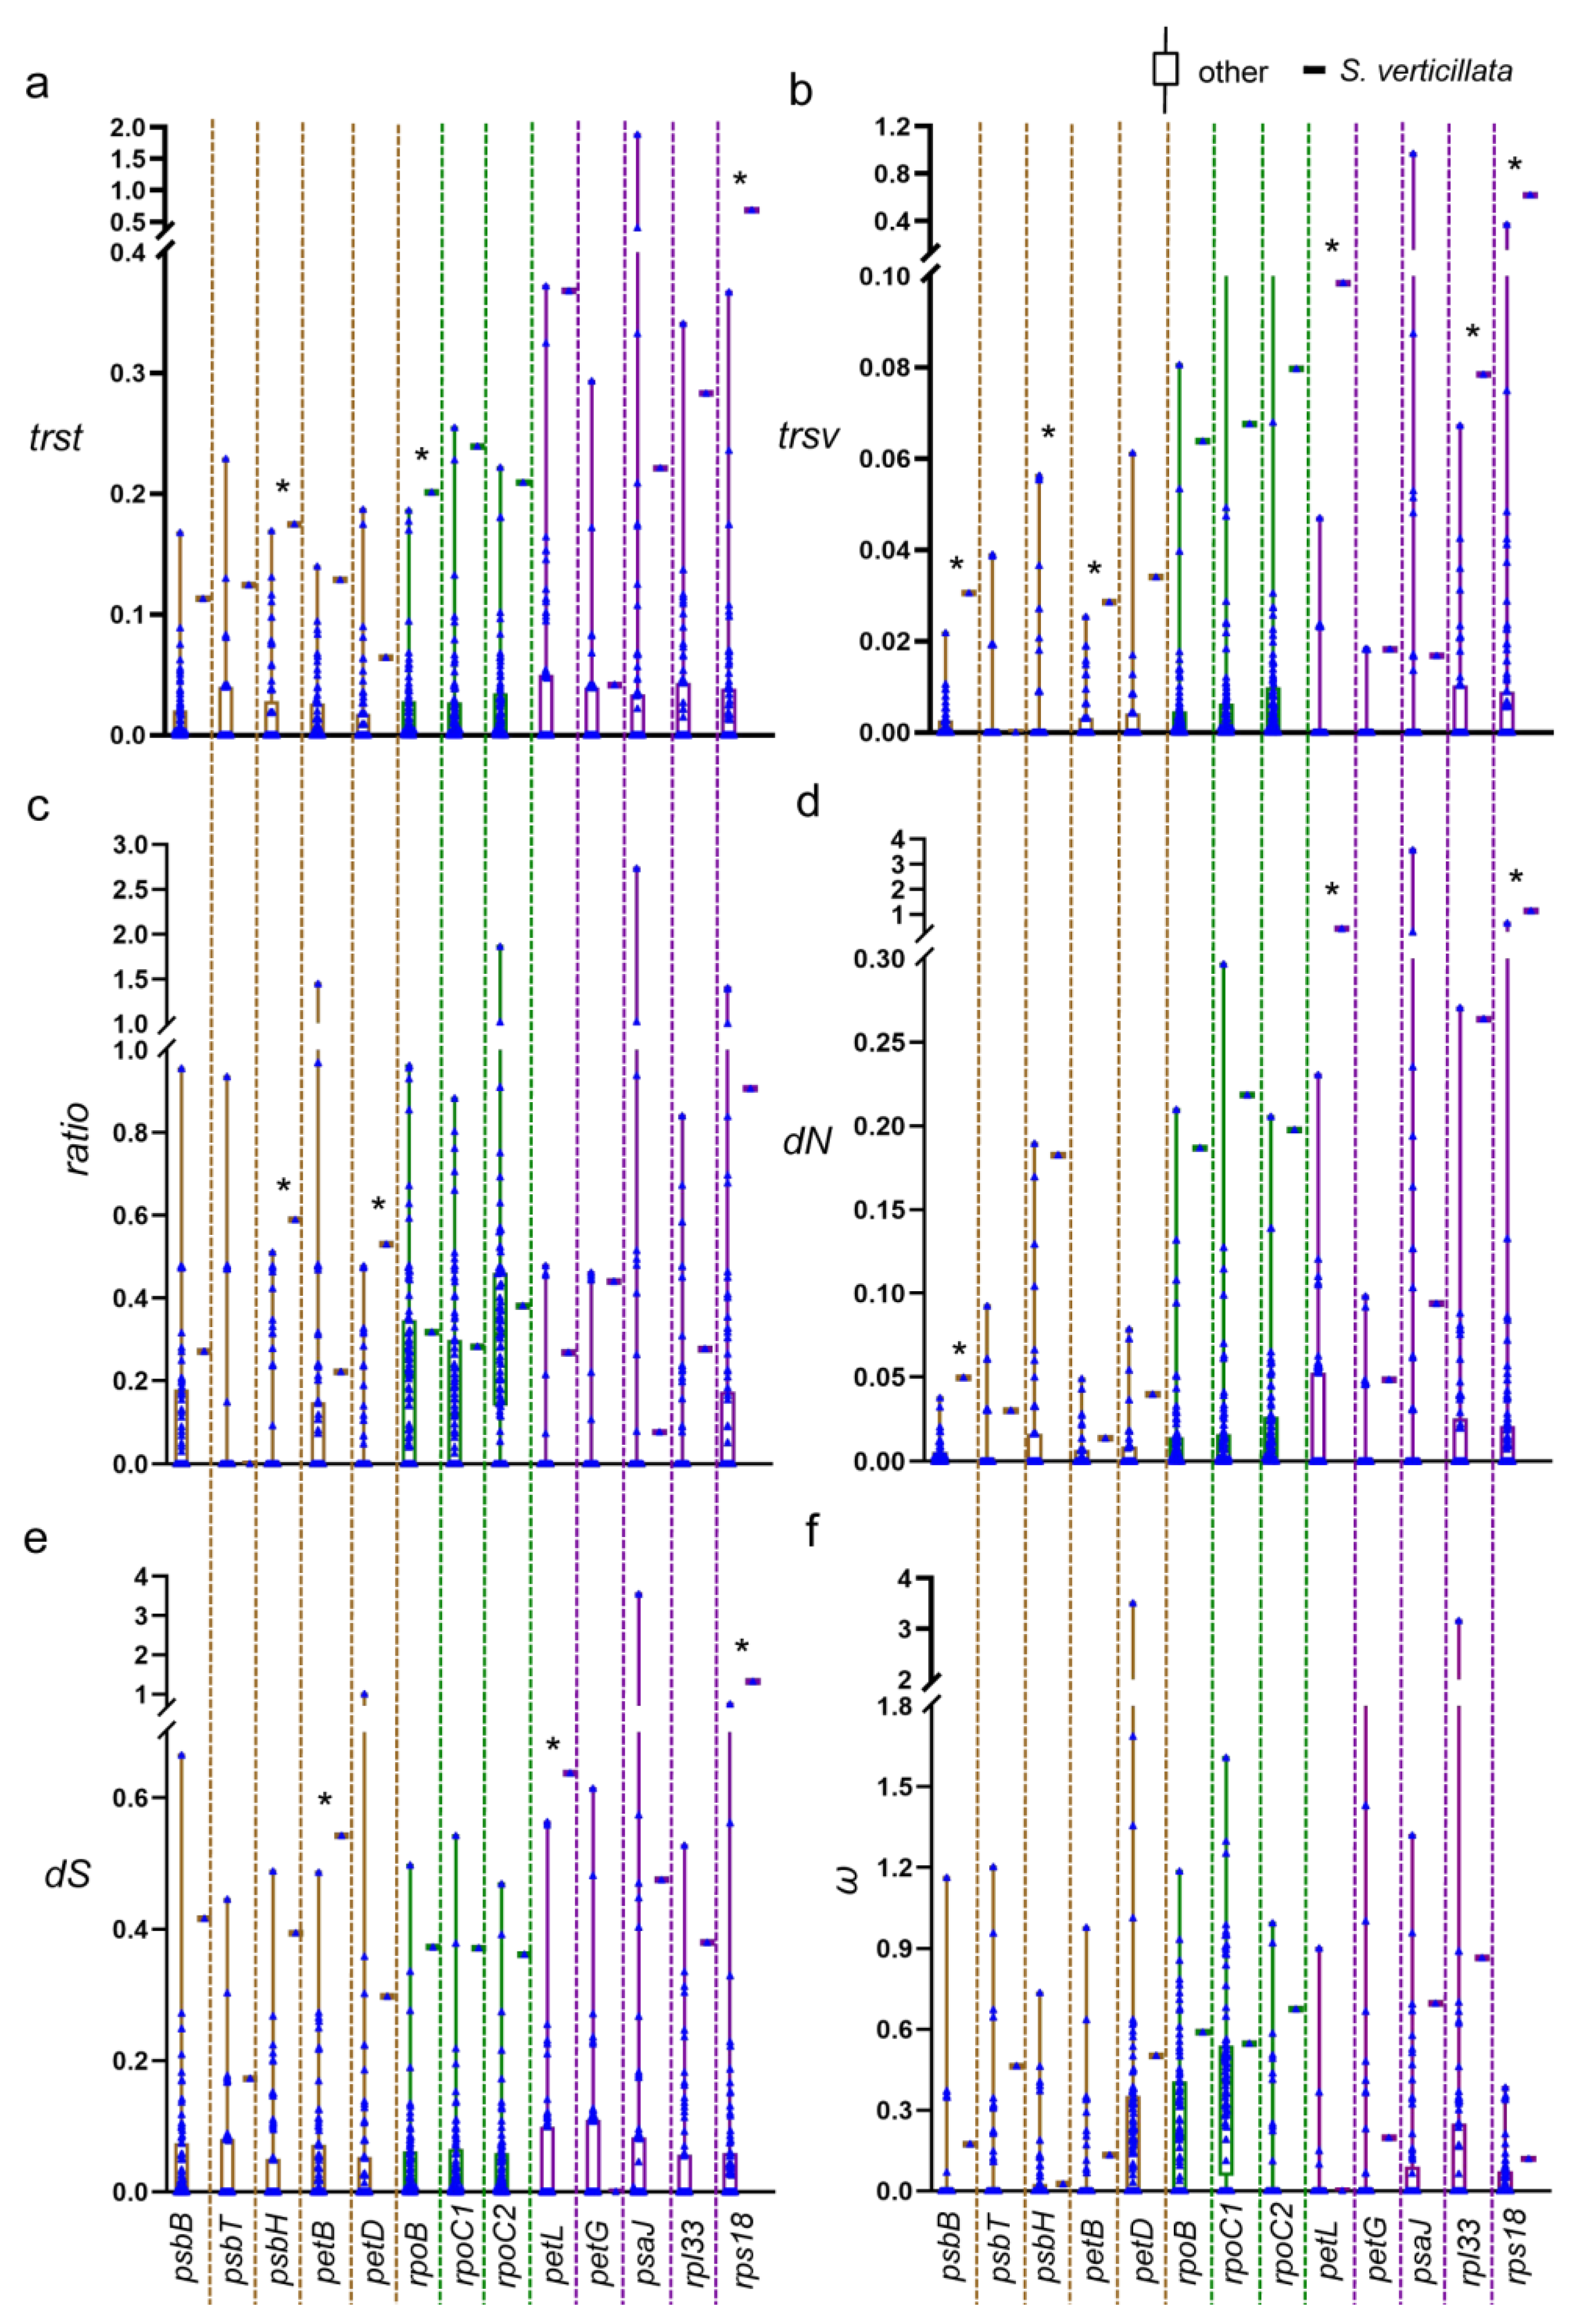
Figure 6.
Genes exhibiting divergent evolutionary rates between Sciadopitys verticillata and other species. (a) Transition rate (trst). (b) Transversion rate (trsv). (c) Nonsynonymous substitution rate (dN). (d) Synonymous substitution rate (dS).
Figure 6.
Genes exhibiting divergent evolutionary rates between Sciadopitys verticillata and other species. (a) Transition rate (trst). (b) Transversion rate (trsv). (c) Nonsynonymous substitution rate (dN). (d) Synonymous substitution rate (dS).
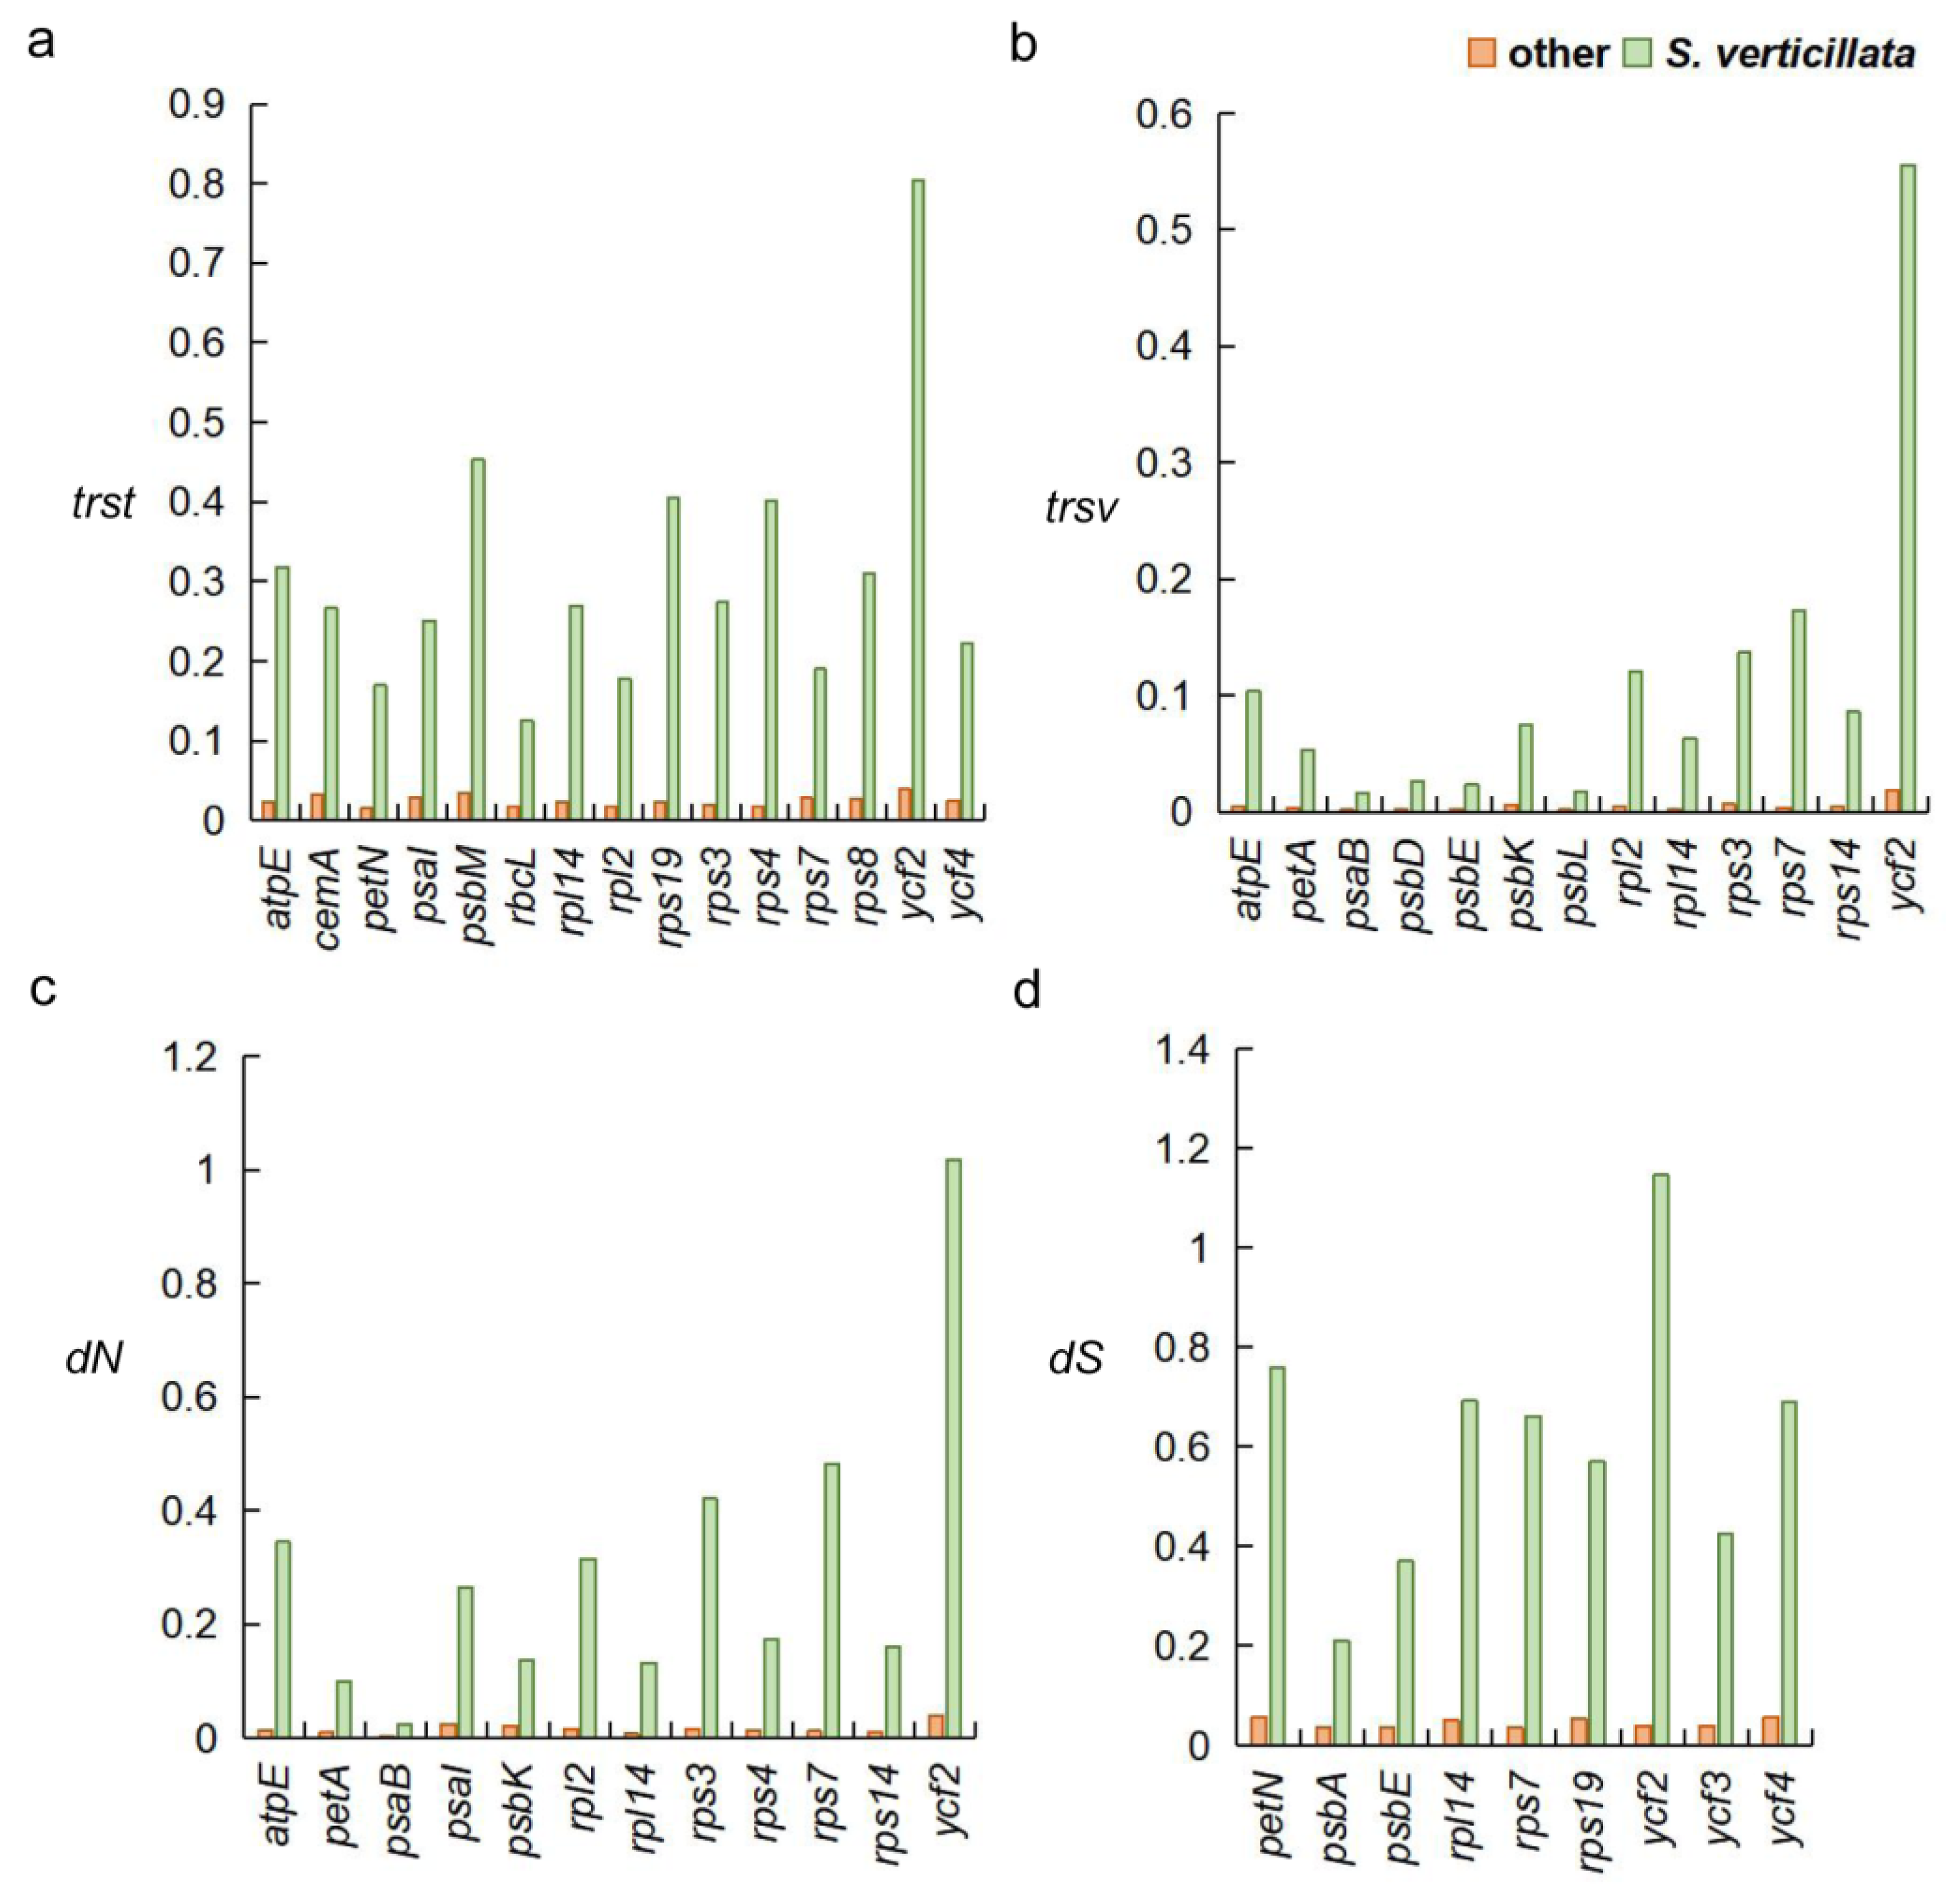
Figure 7.
Analysis of selection pressure between Sciadopitys verticillata and other species. * indicates statistical significance at p < 0.05.
Figure 7.
Analysis of selection pressure between Sciadopitys verticillata and other species. * indicates statistical significance at p < 0.05.

Table 1.
Information for sampled species.
| Faimly Name | Species Name | Genbank Assession No. |
|---|---|---|
| Cycadaceae | Cycas revoluta Thunb. | JN867588 |
| Cycas panzhihuaensis L. Zhou & S. Y. Yang | KX713899 | |
| Cycas szechuanensis W. C. Cheng & L. K. Fu | MH341576 | |
| Cycas taitungensis C. F. Shen, K. D. Hill, C. H. Tsou & C. J. Chen | AP009339 | |
| Zamiaceae | Stangeria eriopus (Kunze) Baill. | JX416858 |
| Ceratozamia hildae G. P. Landry & M. C. Wilson | JX407108 | |
| Dioon spinulosum Dyer ex Eichler | LC049070 | |
| Zamia furfuracea L. f. | JX416857 | |
| Encephalartos lehmannii Lehm. | LC049336 | |
| Lepidozamia peroffskyana Regel | LC049207 | |
| Macrozamia mountperriensis F. M. Bailey | LC049069 | |
| Bowenia serrulata (W. Bull) Chamb. | JX402774 | |
| Ginkgoaceae | Ginkgo biloba L. | NC_016986 |
| Gnetaceae | Gnetum montanum Markgr. | KC427271 |
| Gnetum parvifolium (Warb.) C. Y. Cheng ex Chun | AP009569 | |
| Gnetum ula Brongn. | AP014923 | |
| Gnetum gnemon L. | KP099649 | |
| Ephedraceae | Ephedra equisetina Bunge | AP010819 |
| Ephedra foeminea Forssk. | KT934791 | |
| Ephedra intermedia Schrenk ex C. A. Mey. | MH161421 | |
| Ephedra sinica Stapf | MH161422 | |
| Welwitschiaceae | Welwitschia mirabilis Hook. f. | EU342371 |
| Cupressaceae | Cryptomeria japonica (Thunb. ex L. f.) D. Don | AP009377 |
| Taiwania cryptomerioides Hayata | AP012266 | |
| Taiwania flousiana Gaussen | NC_021441 | |
| Cunninghamia lanceolata (Lamb.) Hook. | KC427270 | |
| Juniperus monosperma (Engelm.) Sarg. | NC_024022 | |
| Juniperus recurva Buch.-Ham. ex D. Don | MK375217 | |
| Taxodium distichum (L.) Rich. | LC177556 | |
| Taxodium mucronatum Ten. | MN535011 | |
| Calocedrus formosana (Florin) Florin | NC_023121 | |
| Cupressus tonkinensis Silba | MH121046 | |
| Cupressus gigantea W. C. Cheng & L. K. Fu | KT315754 | |
| Cupressus sempervirens L. | KP099643 | |
| Callitropsis funebris (Endl.) de Laub. & Husby | MT227813 | |
| Callitropsis nootkatensis (D. Don) Florin | KP099642 | |
| Callitropsis vietnamensis (Farjon & T.H.Nguyen) D.P.Little | KP099645 | |
| Hesperocyparis lusitanica (Mill.) Bartel | MH121051 | |
| Chamaecyparis formosensis Matsum. | LC177668 | |
| Chamaecyparis hodginsii (Dunn) Rushforth | MG269834 | |
| Glyptostrobus pensilis (Staunton ex D.Don) K.Koch | KU302768 | |
| Metasequoia glyptostroboides Hu & W.C.Cheng | NC_027423 | |
| Thuja sutchuenensis Franch. | KY272867 | |
| Thuja occidentalis L. | KY295906 | |
| Callitris rhomboidea R.Br. ex Rich. & A.Rich. | LC177555 | |
| Taxaceae | Cephalotaxus sinensis (Rehder & E. H. Wilson) H. L. Li | MG385662 |
| Cephalotaxus oliveri Mast. | KC136217 | |
| Amentotaxus argotaenia (Hance) Pilg. | KR780582 | |
| Amentotaxus formosana H.L.Li | AP014574 | |
| Taxus fuana Nan Li & R.R.Mill | MF278259 | |
| Pseudotaxus chienii (W.C.Cheng) W.C.Cheng | NC_041503 | |
| Torreya fargesii Franch. | KT027377 | |
| Sciadopityaceae | Sciadopitys verticillata (Thunb.) Siebold & Zucc. | NC_029734 |
| Pinaceae | Cedrus deodara (Roxb. ex D.Don) G.Don | AB480043 |
| Pinus massoniana Lamb. | KC427272 | |
| Pinus yunnanensis Franch. | MK007968 | |
| Pseudolarix amabilis (J. Nelson) Rehder | LC095867 | |
| Pseudotsuga sinensis Dode | MZ779058 | |
| Picea neoveitchii Mast. | MH986606 | |
| Keteleeria davidiana (C. E. Bertrand) Beissn. | AP010820 | |
| Tsuga chinensis (Franch.) E. Pritz. | LC095866 | |
| Larix sibirica Ledeb. | MF795085 | |
| Larix decidua Mill. | AB501189 | |
| Abies fargesii Franch. | MH706716 | |
| Abies fanjingshanensis W. L. Huang, Y. L. Tu & S. Z. Fang | MH706717 | |
| Podocarpaceae | Nageia nagi (Thunb.) Kuntze | NC_023120 |
| Podocarpus lambertii Klotzsch ex Endl. | NC_023805 | |
| Dacrycarpus imbricatus (Blume) de Laub. | NC_034942 | |
| Retrophyllum piresii (Silba) C. N. Page | NC_024827 | |
| Dacrydium elatum (Roxb.) Wall. ex Hook. | NC_045880 | |
| Manoao colensoi (Hook.) Molloy | NC_044893 | |
| Araucariaceae | Agathis dammara (Lamb.) Rich. & A. Rich. | NC_023119 |
| Wollemia nobilis W. G. Jones, K. D. Hill & J. M. Allen | KP259800 | |
| Araucaria cunninghamii Mudie | MT227812 | |
| Araucaria angustifolia (Bertol.) Kuntze | NC_039155 | |
| Araucaria heterophylla (Salisb.) Franco | NC_026450 | |
| Araucaria araucana (Molina) K. Koch | NC_045394 | |
| Araucaria bidwillii Hook. | NC_045395 | |
| Polypodiaceae | Lepisorus clathratus (C. B. Clarke) Ching | NC_035739 |
| Athyriaceae | Athyrium anisopterum Christ | NC_035738 |
Table 2.
Common genes of sample species.
| Gene Type | Gene Name | |
|---|---|---|
| Genes for photosynthesis | Photosystem Ⅰ | psaA psaB psaC psaI psaJ |
| Photosystem Ⅱ | psbA psbB psbC psbD psbE psbF psbH psbI | |
| psbJ psbK psbL psbM psbN psbT psbZ | ||
| Cytochrome | petA petB petD petG petL petN | |
| ATP Synthase | atpA atpB atpE atpF atpH atpI | |
| RubiscoCO large subunit | rbcL | |
| Genetic system genes | Ribosomal Proteins (LSU) | rpl2 rpl14 rpl16 rpl20 rpl22 rpl33 rpl36 |
| Ribosomal Proteins (SSU) | rps2 rps3 rps4 rps7 rps8 rps11 rps14 rps18 rps19 | |
| RNA Polymerase | rpoA rpoB rpoC1 rpoC2 | |
| Others genes | Envelop membrane protein | cemA |
| c-type cytochrome synthesis | ccsA | |
| Hypothetical chloroplast reading frames | ycf2 ycf3 ycf4 | |
Table 3.
Likelihood ratio test between M0 and Model2-1 in the rps2 gene cluster.
| Gene Name | M0 | Model2-1 | 2 ΔƖ | p | ||
|---|---|---|---|---|---|---|
| lnL (np = 160) | lnL (np = 161) | ωSciadopitys verticillata + Callitris rhomboidea | ωother | |||
| rps2 | −8508.885 | −8486.906 | 0.917 | 0.233 | 43.959 | 0 |
| atpI | −6561.487 | −6561.473 | 0.150 | 0.143 | 0.028 | 0.867 |
| atpH | −1392.720 | −1391.571 | 0.000 | 0.018 | 2.299 | 0.129 |
| atpF | −6587.056 | −6585.811 | 0.479 | 0.321 | 2.491 | 0.115 |
| atpA | −13257.085 | −13252.557 | 0.160 | 0.095 | 9.055 | 0.003 |
Table 4.
Likelihood ratio test between M0 and Model2-2 in the rps2 gene cluster.
| Gene Name | M0 | Model2-2 | 2 ΔƖ | p | |||
|---|---|---|---|---|---|---|---|
| lnL (np = 160) | lnL (np = 162) | ωother | ωSciadopitys verticillata | ωCallitris rhomboidea | |||
| rps2 | −8508.885 | −8485.576 | 0.234 | 0.663 | 1.352 | 46.618 | 0 |
| atpI | −6561.487 | −6560.851 | 0.143 | 0.105 | 0.195 | 1.273 | 0.529 |
| atpH | −1392.720 | −1391.571 | 0.018 | 0 | 0 | 2.299 | 0.317 |
| atpF | −6587.056 | −6585.777 | 0.321 | 0.507 | 0.446 | 2.558 | 0.278 |
| atpA | −13257.085 | −13251.853 | 0.095 | 0.192 | 0.125 | 10.464 | 0.005 |
Disclaimer/Publisher’s Note: The statements, opinions and data contained in all publications are solely those of the individual author(s) and contributor(s) and not of MDPI and/or the editor(s). MDPI and/or the editor(s) disclaim responsibility for any injury to people or property resulting from any ideas, methods, instructions or products referred to in the content. |
© 2023 by the authors. Licensee MDPI, Basel, Switzerland. This article is an open access article distributed under the terms and conditions of the Creative Commons Attribution (CC BY) license (https://creativecommons.org/licenses/by/4.0/).
Share and Cite
MDPI and ACS Style
Ping, J.; Zhong, X.; Wang, T.; Su, Y. The Broken Chloroplast Gene Clusters in Gymnosperms Exhibit Elevated Substitution Rates. Forests 2023, 14, 1681. https://doi.org/10.3390/f14081681
AMA Style
Ping J, Zhong X, Wang T, Su Y. The Broken Chloroplast Gene Clusters in Gymnosperms Exhibit Elevated Substitution Rates. Forests. 2023; 14(8):1681. https://doi.org/10.3390/f14081681
Chicago/Turabian StylePing, Jingyao, Xiaona Zhong, Ting Wang, and Yingjuan Su. 2023. "The Broken Chloroplast Gene Clusters in Gymnosperms Exhibit Elevated Substitution Rates" Forests 14, no. 8: 1681. https://doi.org/10.3390/f14081681
Note that from the first issue of 2016, this journal uses article numbers instead of page numbers. See further details here.