Article

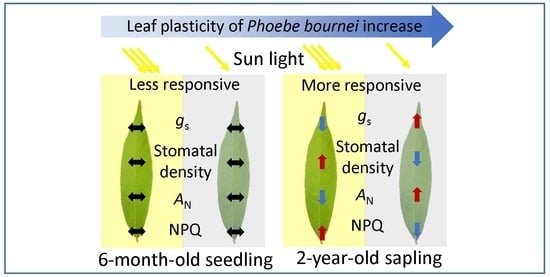
Leaf Plasticity of the Subtropical Evergreen Tree Phoebe bournei Increases with Ontogeny in Response to Sun and Shade

State Key Laboratory of Subtropical Silviculture, College of Forestry and Biotechnology, Zhejiang A&F University, Hangzhou 311300, China
*
Authors to whom correspondence should be addressed.
These authors contributed equally to this work.
Forests 2023, 14(8), 1683; https://doi.org/10.3390/f14081683
Submission received: 24 July 2023 / Revised: 14 August 2023 / Accepted: 17 August 2023 / Published: 20 August 2023
(This article belongs to the Special Issue Adaptive Mechanisms of Tree Seedlings to Adapt to Stress)

Abstract

:
Variation in shade tolerance is a primary mechanism driving succession in subtropical forests. However, little attention has been given to ontogenetic variation in light tolerance of late succession tree species such as Phoebe bournei. To investigate the differences in adaptive strategies between seedlings and saplings in response to sun and shade, we systematically studied the physiological and morphological leaf plasticity of P. bournei and how these variables are influenced by ontogeny. This study provided experimental evidence that leaf plasticity increases with the ontogeny of juvenile P. bournei adapting to the changing light resources. Investment in leaf construction increased with age and light resources in the evergreen P. bournei, as shown by leaf mass per unit area (LMA). Six-month-old seedlings lacked the adjustment of stomatal conductance (gs) and stomatal density responding to sun and shade. For seedlings, maintaining high gs under sun conditions increased stress risk instead of carbon gain. However, the leaves of 2-year-old saplings accumulated more soluble sugars and showed lower stomatal conductance and higher stomatal density under the sun than under shade conditions. The nonphotochemical quenching of sun leaves increased with plant age, indicating that the photoprotective capacity was enhanced with ontogeny. The leaf plasticity increasing along the ontogeny of juvenile P. bournei may contribute to the adaptation from shade to sun. Our study provides new insights into understanding the influence of ontogeny on shade responses of late succession trees in subtropical forests.

Graphical Abstract

1. Introduction

Tropical and subtropical moist broadleaf forests are responsible for a great proportion of global terrestrial gross primary production. One reason for the high productivity of tropical and subtropical forests is that they harbor a high diversity of species that form complex canopies with multiple layers [1]. As light availability decreases with forest succession, the common progression is that shade-tolerant species progressively replace shade-intolerant ones. The species replacement in humid forests arises mainly because of the trade-off between survival in low light and growth under open conditions [2,3].
Shading within canopies is a major threat to the survival and succession of plants in natural environments. Therefore, species have developed two major strategies in crowded stands and understories [4]. The first is an escape response, termed shade avoidance. Most sun-loving plants undergo a suite of changes, including stem and petiole elongation, apical dominance, and resource allocation to shoot growth [5]. Such shade avoidance responses generate a slender phenotype that maximizes the elevation towards canopy gaps and improves the ability to capture and utilize photosynthetically active radiation. However, elongation growth often occurs at the expense of other desirable functions, such as plant defense and storage organ development [6].
The second strategy is shade tolerance which describes the suite of leaf-level traits that permit maximal net carbon fixation and/or increase stress tolerance and survival rates under low irradiance [1]. Late-successional shade-tolerant evergreens conserve their ratio of leaf area to biomass as they grow by accumulating many overlapping leaf cohorts [3,7]. In order to maximize light harvesting through a low light compensation point and low internal self-shading, shade-adapted leaves tend to be thin and invest in chlorophyll for capturing light instead of carbon fixation proteins such as ribulose-1,5-bisphosphate carboxylase/oxygenase (Rubisco) [8]. Sun flecks contribute 10%–80% of the photosynthetically active radiation by understory plants [9]. The efficient harvesting of sun flecks by high post-illumination carbon fixation can avoid photoinhibition [10]. The rapid induction of nonphotochemical quenching (NPQ) of photosystem II by increases in light intensity avoids over-reduction of the PQ-pool and dissipates excess energy as heat [11]. Moreover, the light understory is composed of a high proportion of blue light compared to full sunlight due to the absorption of red light by the canopy. Shade-tolerant plants increase the efficiency of blue light absorption by synthesizing chlorophyll b, resulting in a lower ratio of chlorophyll a to chlorophyll b [3]. However, the contribution of blue light absorption to shade tolerance may be low [12].
The trait of a species’ shade tolerance is often assumed to be fixed, but some work has reported size-related changes in the relative and absolute light requirements of woody taxa [13]. There is evidence that both absolute and relative light requirements of species can change during development. In closed forests, the seeds of canopy species can germinate soon after dispersal and establish seedlings. Tree seedlings and saplings are in a sensitive life stage [14]. They must fine-tune the balance between light demand and stress resistance and wait for canopy gaps to allow light penetration.
The broad-leaved subtropical evergreen forest tree species Phoebe bournei (Hemsl.) Yang, which belongs to the Lauraceae family, is endemic in China. Phoebe timber has been used for high-quality furniture and buildings in Asia for centuries and is an important source of bioactive compounds for medicine [15]. P. bournei is threatened in natural forests owing to the low survival rate of seedlings, intensive deforestation, and illegal logging for timber. Environmental constraints remarkably restrict the seedling growth and succession of P. bournei in nature stands. As a late succession tree species, P. bournei trees belong to the canopy class. According to our field observations, many seedlings and saplings of P. bournei are distributed in the understory instead of the forest edge. In humid subtropical forests, light is the resource most diminished by vegetation development and best correlated with juvenile tree survival and growth [7]. The light demand and shade tolerance of P. bournei may change with the development stage. However, little attention has been given to the relationship between ontogenetic variation in the light response of juvenile P. bournei and the ability to survive in low light and growth under field conditions. In order to investigate the differences in adaptive strategies of P. bournei seedlings and saplings responding to sun and shade, our study determined the physiological and morphological sun–shade leaf plasticity of P. bournei and how these variables are influenced by ontogeny.

2. Materials and Methods

2.1. Plant Materials and Growth Conditions

The seedlings of Phoebe bournei (Hemsl.) Yang were planted in pots in February from 2018 to 2020 and grown in the experimental field of Zhejiang A&F University, located in Hangzhou, Zhejiang, China (30°26′ N, 119°72′ E). Before the experiments, all P. bournei plants of varying ages were shaded by black shading net at noon during the growth season, and these plants were watered two to three times a week and fertilized every month. By 15 July 2020, when the experiment started, the plant ages were 5 months old, 1.5 years old, and 2.5 years old, respectively. For the convenience of description, the 6-month-old seedlings, 1-year-old and 2-year-old saplings were used to refer to the plantlets of varying ages. At that time, the average height of the 6-month-old, 1-year-old, and 2-year-old plantlets was 9.4 cm, 62.9 cm, and 116.7 cm, respectively.
Subsequently, the P. bournei plantlets of each age were divided into three different treatment groups for the sun and shade treatments, and each group included sixteen plantlets of each age. One group was transferred to open field with full sunlight (the full sun group). While the other two groups of P. bournei plantlets were moved into two shade sheds next to the full sun group for shade treatments. The two sheds were covered on all sides with one layer (the medium shade group) and two layers (the deep shade group) of high-density black polyethylene net, respectively. The average photosynthetically active radiation (PAR) was determined with a quantum sensor at 11 a.m. on a sunny day in July. PAR was 1663 ± 25 µmol m−2 s−1, 570 ± 12 µmol m−2 s−1, and 169 ± 5 µmol m−2 s−1 under full sun, medium shade, and deep shade, respectively. This confirmed that the light levels under sheds were 30% of full sun for the medium shade group and 10% for the deep shade group, respectively. The photoperiod at the experimental field was about 13 h, and average temperature was 23.5 to 30.5 °C. After one month experiment, the samples were collected and measured in August 2020.

2.2. Plant Morphology Measurements and Leaf Structural Analysis

The height of the plantlet was measured from the pot’s surface to the top of the plant with a tape measure. The ground diameter of the stem was measured at the soil surface of the plantlets with a vernier caliper, and each plantlet was measured twice from two directions to take the average. The height and ground diameter of P. bournei plants were determined twice at the beginning and the end of the treatment on 15 July 2020 and 25 September 2020, respectively, and the difference between two measurements for each plant was calculated as the growth of height and ground diameter during the experiment. The newly expanded leaves during the treatments were sampled on 29 August 2020 to obtain the LMA and stomatal density. Stomatal pictures were captured using a fluorescence microscope Leica DM4000 B LED (Leica, Wetzlar, Germany). The stomatal density was calculated using IMAGEJ software (version 1.51j8, National Institutes of Health, Bethesda, MD, USA). Leaves were scanned, and the leaf area was calculated using IMAGEJ software. Subsequently, leaves were cut into 2 × 2 cm pieces and oven-dried at 80 °C for 48 h before being weighed. The LMA was obtained as the ratio between the dry mass (g) and the area (m2) of the leaves. Each measurement was made with ten replicates. Leaf thickness and the palisade and spongy mesophyll ratios were measured using the images of light microscopy. The number of chloroplasts and plastoglobulus were measured using the images of transmission electron microscopy (TEM). The detailed methods for light microscopy and TEM are described below.

2.3. Gas Exchange Measurements

The rates of CO2 assimilation were measured with a Li-6400 (Li-Cor, Lincoln, NE, USA) from 9 to 11 a.m. on sunny days in late August 2020. Net assimilation rates (AN) were recorded with CO2 concentration of 400 µmol m−2 s−1 at a saturating light intensity of 1000 µmol photons m−2 s−1 when a steady-state of CO2 exchange is achieved according to Ensminger et al. [16]. The cuvette temperature was set to 28 °C, and the airflow rate was set to 400 µmol s−1. The intrinsic water-use efficiency was calculated as the ratio of AN to transpiration rate (WUE = AN/E). The stomatal limitations were calculated as the ratio of AN to Ci. Four randomly selected, mature leaves from spring shoots of current year were measured on each occasion.

2.4. Chlorophyll Fluorescence Measurements

The same leaf was used for chlorophyll fluorescence measurements right after gas-exchange measurements with a PAM-2500 fluorometer (Walz, Effeltrich, Germany). Leaves were dark acclimated for 30 min with leaf clips. The actinic light (278 µmol photons m−2 s−1) was turned on for 5 min with Saturation Pulse (10,000 µmol photons m−2 s−1 for 300 ms) every 30 s. The minimum fluorescence (Fo) and maximum chlorophyll fluorescence after the dark acclimation (Fm) and during illumination (Fm’) was determined. Light curve with saturation pulse was applied with a sequence of increasing actinic light intensity of 0, 2, 42, 142, 278, 511, 874, 1378, 1974, and 2859 µmol photons m−2 s−1 with 30 s intervals. Photosynthetic parameters were calculated as described in the literature [17,18]. The Fv/Fm (maximum quantum yield of PSII) was calculated as (FmFo)/Fm. The relative ETR (the electron transport rate of PSII) was calculated as Y(II)×light intensity (µmol m−2 s−1). The quantum yields, which are displayed as the parameters Y(II), Y(NPQ), and Y(NO), comprehensively describe the fate of excitation energy in PS II. The sum of these quantum yields is always unity: Y(II) + Y(NPQ) +Y(NO) = 1. Y(II) = (Fm’ − F)/Fm’. Y(NO) = F/Fm. Y(NPQ) = F/Fm’ − F/Fm. Data are presented as mean ± SE of four independent measurements.

2.5. Light and Transmission Electron Microscopy

After gas exchange and chlorophyll fluorescence measurements, the same leaf was collected with a modified procedure, according to Zhang et al. [19]. The middle region of leaves was cut into 0.5 × 0.5 mm pieces without big veins. The sample preparation for TEM was performed as described previously [20]. Ultra-thin sections were prepared using a Leica EM UC7 ultramicrotome (Germany), then mounted on copper grids and stained with 5% uranyl acetate (dissolved in MQ water) and Reynolds lead citrate. Whole cells and chloroplasts were photographed with an H7650 transmission electron microscope (HITACHI, Tokyo, Japan). Semi-thin sections for light microscopy were prepared using a Leica RM2265 microtome (Germany). Semi-thin sections were stained with toluidine blue and viewed in the bright field with a fluorescence microscope Leica DM4000 B LED (Leica, Wetzlar, Germany) and photographed with a digital camera (Sony E3ISPM05000KPA, Tokyo, Japan).

2.6. Carbohydrate, Chlorophyll, and Oxidative Parameter Analyses

Carbohydrates were extracted from mature leaves of current-year spring shoots, according to Lundell [21]. The same leaf used for gas exchange and chlorophyll fluorescence measurements was collected and immediately frozen in liquid nitrogen for biochemical determination. The contents of soluble sugar and starch were determined using the anthrone method with a commercial kit (Solarbio Life Science, Beijing, China). Standard curves were derived using δ-d-(+)-glucose with an absorbance of 620 nm. Leaf pigments were extracted from leaf powder which was ground in liquid N2 with 80% acetone [22]. The extracts were centrifuged, and the supernatant was collected and stored at −20 °C until analysis. The contents of chlorophyll a and b were measured at 663 and 645 nm and calculated according to Wellburn and Lichtenthaler [23]. The activity of peroxidase (POD) was measured on the basis of guaiacol oxidation at 470 nm by using a commercial kit (Nanjing Jiancheng Bioengineering Institute, China) according to the manufacturer’s instructions. The concentrations of H2O2 were determined on the absorbance at 405 nm using a commercial kit (Nanjing Jiancheng Bioengineering Institute, Nanjing, China) in accordance with the manufacturer’s instruction. The absorbance was determined using the SpectraMax 190 (Molecular Devices, San Jose, CA, USA). Each analysis was repeated three times.

2.7. Statistical Analysis

An index of leaf phenotypic plasticity at each treatment was calculated by dividing the difference between the minimum and maximum mean values among the three sun and shade treatments by the maximum mean [PI = (Xmax − Xmin)/Xmax] [24]. The means and calculated standard error (SE) were reported for all of the measurements. Differences were evaluated by one-way analysis of variance (ANOVA) and LSD test with SPSS 16.0 (SPSS Inc., Chicago, IL, USA), and p-values were shown in the figures with asterisks (p ≤ 0.05). Graphs were plotted with PowerPoint (Microsoft, Silicon Valley, CA, USA).

3. Results

3.1. Growth and Morphological Variation Due to Sun and Shade

Over the two months of shade treatment in the field, the average height growth varied from 5.3–22.3 cm in P. bournei plants of different ages (Figure 1A). For the convenience of description, the 6-month-old seedlings, 1-year-old and 2-year-old saplings were used to refer to the plantlets. The growth of 1-year-old saplings was highest due to new shoots sprouting during the treatment (Figure 1A). When comparing sun and shade treatments, both one and two-year-old saplings grew taller under shade than in full sun conditions, suggesting a shade avoidance response (SAR). However, no difference was observed among sun and shade treatments for the height of 6-month-old seedlings (Figure 1A). In addition, the height increments of 6-month-old seedlings showed little variation among seedlings within the same treatment (Figure 1A). In contrast, both 1-year-old and 2-year-old saplings presented significant variation among saplings within the same treatment, particularly for the 1-year-old saplings grown under both shade conditions (Figure 1A). This variation among elder saplings may indicate their potential for a regulatory response to shade. The stem growth of 6-month-old seedlings was slower than that of elder saplings (Figure 1B). The characteristics of newly expanded leaves during treatments showed that sun leaves had higher leaf dry mass per unit leaf area (LMA) and higher stomatal density than deep shade leaves (Figure 1C). However, 6-month-old seedlings showed no differences in stomatal density among treatments (Figure 1D). Overall, the seedling growth and leaf stomatal density of 6-month-old seedlings were less responsive to sun and shade than those of older saplings.

3.2. Anatomical Differences of P. bournei Plants Due to Sun and Shade

Leaves that developed during spring were sampled for anatomical analysis. Extensive anatomical differences were observed in leaves from plants of different ages. Thinner leaves were found in the 6-month-old seedlings than in 2-year-old saplings (Figure 1E and Figure 2). Among all samples, the leaves were thinnest in 6-month-old seedlings grown under shade conditions. The mesophyll porosity (volume of internal air space) increased with shade intensity in all plants (Figure 2). The palisade mesophyll cells were tidily arranged with uniform cell shapes in leaves under full sun conditions. In contrast, the intercellular space of palisade mesophyll increased, and the cell shape was heterogenous in leaves under deep shade conditions (Figure 2). The palisade/spongy ratio was about 0.8 in 1- or 2-year-old saplings and showed no significant differences between sun or shade conditions (Figure 1F). However, in 6-month-old seedlings, the palisade/spongy ratio was higher in the sun leaves than in shade leaves (p < 0.05). These results suggested the leaf structure of all three ages of P. bournei changed in response to shade. Still, the differentiation of the mesophyll cells was more sensitive to illumination in younger seedlings than in older saplings.

3.3. Transmission Electron Micrographs of Chloroplasts

We analyzed the chloroplast ultrastructure of P. bournei plants in response to light via transmission electron micrographs (TEM). The leaves showed extensive remodeling of chloroplast ultra-structure in response to sun and shade (Figure 3A–I). In general, the total number of thylakoid membranes per chloroplast increased with shade intensity. In contrast, most thylakoids were stacked with only a few layers in the leaves of 2-year-old saplings grown under sun conditions. This suggested there were protective mechanisms regarding chloroplast ultrastructure responses to light. Plastids of the 6-month seedlings under deep shade conditions had a higher number of swollen thylakoid lamellae, indicating a disarrangement of the membranes throughout the chloroplast (Figure 3C). Large starch grains (St) were detected in almost all chloroplasts, especially in the leaves of older saplings (Figure 3A–I). Meanwhile, large plastoglobuli were commonly observed in the chloroplasts of P. bournei. More plastoglobuli occurred in sun leaves of 1- or 2-year-old saplings than in shade leaves (Figure 3 and Figure 4B). In contrast, the number of plastoglobuli was higher in shade leaves than in the sun leaves of the 6-month seedlings (Figure 3 and Figure 4B). The chloroplast number per cell was similar in 6-month-old seedlings grown under sun and shade conditions. However, there were more chloroplasts per cell in 1- and 2-year-old sapling leaves under medium shade than under deep shade conditions (Figure 4A).

3.4. ROS and Chlorophyll Changes in Response to Sun and Shade H2O2

Hydrogen peroxide (H2O2) is a signaling molecule that performs a vital role in the induction of physiological and biochemical responses under stress conditions [25]. Contents of H2O2 accumulate when plants are exposed to oxidative stress, and high concentrations of H2O2 cause cellular damage and even cell death. In the 6-month-old seedlings, the H2O2 contents were maintained at a low level, and no significant difference (p > 0.05) was found between sun and shade conditions (Figure 4C). However, H2O2 was significantly accumulated in the 2-year-old saplings under medium shade (Figure 4C). H2O2 enhances the antioxidant capacity by inducing the synthesis of ROS-scavenging enzymes such as peroxidase (POD). Biochemical analysis of P. bournei plants revealed that POD activities were higher in the sun leaves than in shade leaves (Figure 4D).

3.5. Chlorophyll Fluorescence

Chlorophyll contents varied similarly in their response to sun and shade in all three age classes (Supplementary Figure S1). Both chlorophyll a and b contents were higher, and the chlorophyll a/b ratio was lower in shade leaves than in the sun leaves. Measurements of chlorophyll fluorescence showed that the maximum PSII quantum yield (Fv/Fm) values were lower in sun leaves than shade leaves, and the values were lower in young seedlings than older saplings (Figure 5A). The ETR(II) derived from the light curve was consistently lower in sun leaves than in shade leaves (Figure 5E). There was no clear evidence for photodamage in 6-month seedlings due to full sun conditions. By measuring the light curve, the half-saturation light intensity (Ik) was calculated, and it was similar for all plants suggesting the leaves could tolerate the same level of light intensity (Supplementary Figure S2). Nonphotochemical quenching (NPQ) increased with plant age, and the NPQ of 2-year-old saplings was 1.7 times higher in the sun leaves than in deep shade leaves (Figure 5D). In contrast, the NPQ of 6-month seedlings was less than half that of 2-year-old saplings. Meanwhile, the Y(NO) indicated the excess light energy was not dissipated by regulation, suggesting an over-accumulation of ROS. Y(NO) values were low in the sun leaves of 2-year-old saplings (Figure 5C). These results suggested that regulating energy dissipation protected the photosynthetic machinery in 2-year-old saplings.

3.6. Leaf Photosynthetic Capacity Changes by Gas Exchange Analysis

To investigate the physiological response of P. bournei to different shade conditions, we analyzed the characteristics of CO2 assimilation via gas exchange. Saturating CO2 assimilation rates at 400 ppm CO2 concentration (AN) were similar in sun and shade leaves from 6-month seedlings (Figure 6A). However, the AN of the shade leaves was significantly higher in 2-year-old saplings (p < 0.05, Figure 6A). Although the intercellular air space increased in deep shade leaves from plants of different ages, an increase in leaf-internal CO2 concentrations (Ci) was only detected in 6-month seedlings and 1-year-old saplings (Figure 2 and Figure 6B). Interestingly, the stomatal conductance (gs) was higher in shade leaves than in the sun leaves from 1- and 2-year-old saplings, correlated with the high AN (Figure 6C). Our results showed that AN was positively correlated with gs in Phoebe bournei (Supplementary Figure S3). The stomatal limitations were also in line with the AN (Figure 6F). Changes in transpiration rate (E) in response to shade differed among the three age samples (Figure 6D). For 6-month seedlings, E was lower in deep shade leaves. The E of 1-year-old saplings was higher in shade leaves, but there were no differences in E between sun and shade leaves in 2-year-old saplings (Figure 6D). Although the water use efficiency was higher in the deep shade leaves from 6-month seedlings and 2-year-old saplings, the causes were different due to different responses of the AN and E parameters (Figure 6E). The 6-month seedlings had increased ETR(II)/AN ratio with the decrease in light illumination (Supplementary Figure S4). However, there was no significant difference in ETR(II)/AN ratio among sun and shade treatments in 1-year-old saplings (Supplementary Figure S4).

3.7. Nonstructural Carbohydrate (NSC) Accumulation

High levels of soluble sugars were detected in sun leaves of 2-year-old saplings (Figure 7A). The starch reduction was observed in deep shade leaves of 2-year-old saplings (Figure 7B). In contrast, there were no differences in nonstructural carbohydrate (NSC) accumulation between the leaves of 6-month-old seedlings grown under full sun and shaded conditions (Figure 7). This differential pattern of starch and soluble sugar accumulation due to light was inconsistent at three ages of P. bournei. In line with the NSC results, the growth of 6-month-old seedlings was also similar under various light conditions (Figure 1A,B). These results suggested the carbon gain of 6-month-old seedlings did not benefit from full sun, but the 2-year-old saplings profit with high carbon gain.

3.8. Plasticity Index

Fifteen selected phenotypic and physiologic parameters reflecting leaf plasticity index (PI) were calculated for each age of P. bournei. Leaf plasticity was found to be specific in P. bournei plantlets of different ages (Table 1). Overall, phenotypic characteristics and physiological traits showed over half of the PI was the smallest in 6-month-old seedlings compared with elder plantlets (Table 1). The average PI was also lowest in 6-month-old seedlings. The parameters related to light energy distribution (including Y(II), Y(NPQ), and Y(NO)) and chloroplast number showed an increase in plasticity with plant age, indicating those characteristics are more sensitive as the ontogeny develops.

4. Discussion

This study aimed to explore the differences in adaptive strategies of subtropical evergreens such as P. bournei in response to sun and shade and how these morphological and physiological variables are influenced by ontogeny. With a controlled experimental approach under full sun and shade conditions, we investigated a broad range of structural, biochemical, and physiological traits in P. bournei at different ages.

4.1. Investments for Constructing New Leaves Increase with Light Intensity and Age of Juvenile P. bournei

Light is one of the major constraints for seedling growth and succession in natural stands of late-successional tree species such as P. bournei. Seedlings were analogous to human startup firms, which should be built with lower construction costs than established plants [26]. This is almost always true in terms of LMA. Seedling leaves are constructed with low investments to maximize the light-harvesting area [26]. The LMA of sapling leaves from individual species ranged from ~80% to 40% of adult tree leaves across 17 tropical forest species [27]. Consistent with previous studies, the LMA progressively increased with the age of juvenile P. bournei in analyses comparing the newly matured leaves with similar leaf ages (Figure 1C). Moreover, the LMA decreased with light intensity [1]. In this study, sun leaves had higher LMA than deep-shade leaves (Figure 1C). In summary, our results demonstrated that the light-response plasticity in LMA was more important than the effect of plant age.
Variation in LMA was not only due to leaf thickness but also cell density. Comparing the anatomical micrographs of newly expanded leaves with similar age, the leaves from 2-year-old saplings were thicker than leaves from 6-month-old seedlings, with the mesophyll cells tidily and closely arranged rather than with large intercellular spaces (Figure 2).

4.2. Full Sun Condition Increases Stress Risks Instead of Carbon Gain in Seedlings of P. bournei

Shade-tolerant species are commonly defined as those with equal survival in gaps and shade [8,28]. The Fv/Fm value is usually close to 0.8 in healthy leaves of most plant species. Therefore, a lower value indicates photoinhibition, commonly observed in plants under stress [29]. In light-demanding species such as Populus and pines, the Fv/Fm was around 0.8 and did not decrease when grown under sun conditions [20]. However, in P. bournei, a shade-tolerant species, the Fv/Fm of sun leaves was lower than that of shaded leaves, suggesting high light stress (Figure 5). Moreover, it is possible that the high temperatures during the experiment may have contributed to the decrease in Fv/Fm. Interestingly, the Fv/Fm was higher in sun leaves of 2-year-old saplings than 6-month-old seedlings, suggesting photoinhibition was alleviated with increasing age. One of the major PSII photoprotective mechanisms in plants is dissipating the excess excitation energy as heat which can be determined by NPQ [30]. The NPQ of sun leaves increased with age, indicating that the photoprotective mechanism was enhanced with ontogeny (Figure 5D). In addition to high light stress, the 6-month-old seedlings maintained a high transpiration rate even under full sun conditions, which increased the risk of water loss and further exacerbated the high light stress (Figure 6D). The result of the ETR(II)/AN ratio showed there were differences in allocation portion between CO2 fixation and alternative electronic pathways in P. bournei with different ages when grown under sun or shade conditions (Supplementary Figure S4). It is possible that the tolerance of P. bournei to high light stress increased with the tree age.
Although the 6-month-old seedlings increased investments for constructing new leaves under full sun conditions, they did not obtain additional carbon gain compared with shade conditions. There were no differences in growth and NSC accumulation between 6-month-old seedlings grown under sun and shade conditions (Figure 1 and Figure 7). These results suggested the carbon gain of P. bournei seedlings did not benefit from full sun. In contrast, in 2-year-old saplings, increasing investments in new leaf construction in full sun were accompanied by a higher accumulation of soluble sugars compared with shaded leaves (Figure 7). In summary, the 6-month-old seedlings of P. bournei grown under sun conditions faced the challenge of high light and water loss but did not have an increased carbon gain, whereas 2-year-old saplings could appropriately respond to stress risks and profit with high carbon gain from full sun conditions.

4.3. Leaf Plasticity of P. bournei Increases with Ontogeny

Until now, little attention has been paid to the variability in phenotypic plasticity of woody species in response to shade with respect to their ontogeny. Late successional species are adapted to conditions of high humidity and variable light in the understory of tropical and subtropical forests. They tend to open the stomata because CO2 assimilation is more critical than the loss of water [31]. The average PI was lowest in 6-month-old seedlings (Table 1). As the PI showed, the 6-month-old seedlings of P. bournei showed similar stomatal conductance (gs) and stomatal density indiscriminately under sun or shade conditions to maximize the CO2 assimilation rate (Figure 1 and Figure 6, and Table 1). This strategy ensured young P. bournei seedlings could survive and persist in a harsh understory by competition. In contrast, the leaf plasticity of 1- and 2-year-old saplings showed high variability with decreased stomatal conductance and increased stomatal density under the sun compared to shade conditions (Figure 1 and Figure 6, and Table 1). One possible reason is that the water loss risk is too high for older plants with a larger number of leaves.
The H2O2 can act as a signaling molecule to regulate plant responses to stress. Large-scale transcriptomic analysis has strongly suggested that H2O2 involving phytohormone signaling networks governs plant stress growth and development [32,33]. A previous study on rice demonstrated that stomatal closure and density could be regulated by modulating H2O2 homeostasis [34]. In line with the stomatal plasticity difference, H2O2 was significantly accumulated in 1- and 2-year-old saplings under medium shade conditions (Figure 4C). However, the 6-month-old seedlings did not show differences in response to sun and shade (Figure 4C). When the rate of photosynthesis reaches saturation, absorption of excess light causes a decrease in thylakoid lumen pH, an increase in the reduction state of the plastoquinone pool and thiols in the chloroplast, production of various ROS (mainly including H2O2 and singlet oxygen) and perturbation of chlorophyll biosynthesis [35]. Full sun condition can cause excess light accumulation to shade-tolerant trees which further cause oxidative damage such as Torreya grandis [36]. The activity of POD was higher under full sun conditions in comparison with shade conditions for each age, which was beneficial for maintaining H2O2 levels and avoiding oxidative damage (Figure 4D). Our results suggest that P. bournei has developed a fine regulation of H2O2 homeostasis with ontogeny through complex signaling networks to determine responses to various light conditions.

5. Conclusions

This study explored the differences in adaptive strategies of subtropical evergreens such as P. bournei in response to sun and shade and how these morphological and physiological variables are influenced by ontogeny. Investments in leaf construction increased with age and light intensity, and the photoprotective capacity was enhanced with ontogeny in the evergreen P. bournei. In addition, the ability to adjust stomatal conductance (gs) and stomatal density in response to sun and shade in elder samplings suggests leaf plasticity of P. bournei increases with ontogeny. As a late succession tree, leaf plasticity changing with tree ontogeny of P. bournei may be advantageous for adapting to environmental changes from low light under the canopy to high light above the canopy. Moreover, this leaf plasticity change occurs during the juvenile stage of tree growth.

Supplementary Materials

The following supporting information can be downloaded at: https://www.mdpi.com/article/10.3390/f14081683/s1, Figure S1: Chlorophyll contents of Phoebe bournei with different ages under sun and shade treatments. Contents of chlorophyll a (A), chlorophyll b (B) and the sum of chlorophyll a and b (C). (D) Chlorophyll a/b, the ratio of chlorophyll a to chlorophyll b. Values (mean ± S.E., n = 3) followed by different letters for each plantlets age under three light treatments are significantly different at p < 0.05 based on LSD test; Figure S2: The chlorophyll fluorescence parameter of Phoebe bournei with different ages under sun and shade treatments. (A) Ik, the light saturation point. (B) ETRmax, maximum rate of electron transport. Values (mean ± S.E., n = 4) followed by different letters for each plantlets age under three light treatments are significantly different at p < 0.05 based on LSD test. Figure S3: Positive correlations between AN and gs of Phoebe bournei; Figure S4: The responses of ratio of electron transport rate to net photosynthetic rate (ETR(II)/AN) to sun and shade of Phoebe bournei with different ages. Values (mean ± S.E., n = 4) followed by different letters for each plantlets age under three light treatments are significantly different at p < 0.05 based on LSD test.

Author Contributions

Q.Y., J.-H.Z. and Z.-K.T. conceived the experiment; X.-B.L., C.-C.L., J.-X.C., M.-M.Z. and Q.Y. performed the experiment and analyzed the data; all the authors contributed to writing and revising the manuscript. All authors have read and agreed to the published version of the manuscript.

Funding

This research was supported by the Key Scientific and Technological Grant of Zhejiang for Breeding New Agricultural Varieties (2021C02070-10), National Natural Science Foundation of China (32201581) and the Scientific Development and Research Foundation of Zhejiang A&F University (2020FR037).

Data Availability Statement

Data is contained within this article and supplementary material. The data presented in this study are available in this article and supplementary material. And raw data of all assays presented in this study are available on request from the corresponding author.

Acknowledgments

We are appreciated for editors and two anonymous reviewers’ valuable comments and suggestions.

Conflicts of Interest

The authors declare that the research was conducted in the absence of any commercial or financial relationships that could be construed as a potential conflict of interest.

References

  1. Ntawuhiganayo, E.B.; Uwizeye, F.K.; Zibera, E.; Dusenge, M.E.; Ziegler, C.; Ntirugulirwa, B.; Nsabimana, D.; Wallin, G.; Uddling, J. Traits controlling shade tolerance in tropical montane trees. Tree Physiol. 2020, 40, 183–197. [Google Scholar] [CrossRef]
  2. Lusk, C.H.; Falster, D.S.; Jara-Vergara, C.K.; Jimenez-Castillo, M.; Saldaña-Mendoza, A. Ontogenetic variation in light requirements of juvenile rainforest evergreens. Funct. Ecol. 2008, 22, 454–459. [Google Scholar] [CrossRef]
  3. Henry, H.A.L.; Aarssen, L.W. On the relationship between shade tolerance and shade avoidance strategies in woodland plants. Oikos 1997, 80, 575. [Google Scholar] [CrossRef]
  4. Franklin, K.A. Photomorphogenesis: Plants Feel Blue in the Shade. Curr. Biol. 2016, 26, R1275–R1276. [Google Scholar] [CrossRef] [PubMed]
  5. Fernandez-Milmanda, G.L.; Ballare, C.L. Shade Avoidance: Expanding the Color and Hormone Palette. Trends Plant Sci. 2021, 26, 509–523. [Google Scholar] [CrossRef] [PubMed]
  6. Ballare, C.L.; Pierik, R. The shade-avoidance syndrome: Multiple signals and ecological consequences. Plant Cell Environ. 2017, 40, 2530–2543. [Google Scholar] [CrossRef]
  7. Lusk, C.H.; Perez-Millaqueo, M.M.; Piper, F.I.; Saldana, A. Ontogeny, understorey light interception and simulated carbon gain of juvenile rainforest evergreens differing in shade tolerance. Ann. Bot. 2011, 108, 419–428. [Google Scholar] [CrossRef]
  8. He, P.; Wright, I.J.; Zhu, S.; Onoda, Y.; Liu, H.; Li, R.; Liu, X.; Hua, L.; Oyanoghafo, O.O.; Ye, Q. Leaf mechanical strength and photosynthetic capacity vary independently across 57 subtropical forest species with contrasting light requirements. New Phytol. 2019, 223, 607–618. [Google Scholar] [CrossRef]
  9. Way, D.A.; Pearcy, R.W. Sunflecks in trees and forests: From photosynthetic physiology to global change biology. Tree Physiol. 2012, 32, 1066–1081. [Google Scholar] [CrossRef] [PubMed]
  10. Kono, M.; Noguchi, K.; Terashima, I. Roles of the cyclic electron flow around PSI (CEF-PSI) and O2-dependent alternative pathways in regulation of the photosynthetic electron flow in short-term fluctuating light in Arabidopsis thaliana. Plant Cell Environ. 2014, 55, 990–1004. [Google Scholar] [CrossRef]
  11. Allahverdiyeva, Y.; Suorsa, M.; Tikkanen, M.; Aro, E.M. Photoprotection of photosystems in fluctuating light intensities. J. Exp. Bot. 2015, 66, 2427–2436. [Google Scholar] [CrossRef] [PubMed]
  12. Osunkoya, O.O.; Ash, J.E.; Hopkins, M.S.; Graham, A.W. Influence of seed size and seedling ecological attributes on shade-tolerance of rain-forest tree species in northern Queensland. J. Ecol. 1994, 82, 149–163. [Google Scholar] [CrossRef]
  13. Niinemets, U.L.O. The controversy over traits conferring shade-tolerance in trees: Ontogenetic changes revisited. J. Ecol. 2006, 94, 464–470. [Google Scholar] [CrossRef]
  14. Piovesan, G.; Lüttge, U. Tree growth dynamics during early ontogenetic stages in closed forests. Trees 2018, 32, 671–673. [Google Scholar] [CrossRef]
  15. Tariq, A.; Pan, K.; Olatunji, O.A.; Graciano, C.; Li, Z.; Sun, F.; Sun, X.; Song, D.; Chen, W.; Zhang, A.; et al. Phosphorous application improves drought tolerance of Phoebe zhennan. Front. Plant Sci. 2017, 8, 1561. [Google Scholar] [CrossRef]
  16. Ensminger, I.; Schmidt, L.; Lloyd, J. Soil temperature and intermittent frost modulate the rate of recovery of photosynthesis in Scots pine under simulated spring conditions. New Phytol. 2008, 177, 428–442. [Google Scholar] [CrossRef] [PubMed]
  17. Baker, N.R. Chlorophyll fluorescence: A probe of photosynthesis in vivo. Annu. Rev. Plant Biol. 2008, 59, 89–113. [Google Scholar] [CrossRef]
  18. Klughammer, C.; Schreiber, U. Complementary PS II quantum yields calculated from simple fluorescence parameters measured by PAM fluorometry and the Saturation Pulse method. PAM Appl. Notes 2008, 1, 27–35. [Google Scholar]
  19. Zhang, S.; Jiang, H.; Peng, S.; Korpelainen, H.; Li, C. Sex-related differences in morphological, physiological, and ultrastructural responses of Populus cathayana to chilling. J. Exp. Bot. 2011, 62, 675–686. [Google Scholar] [CrossRef]
  20. Lin, X.Y.; Wang, X.X.; Zeng, Q.Y.; Yang, Q. Leaf structure and photosynthesis in Populus alba under naturally fluctuating environments. Photosynthetica 2022, 60, 240–250. [Google Scholar] [CrossRef]
  21. Lundell, R.; Saarinen, T.; Åström, H.; Hänninen, H. The boreal dwarf shrub Vaccinium vitis-idaea retains its capacity for photosynthesis through the winter. Botany 2008, 86, 491–500. [Google Scholar] [CrossRef]
  22. Tóth, V.R.; Mészáros, I.; Veres, S.; Nagy, J. Effects of the available nitrogen on the photosynthetic activity and xanthophyll cycle pool of maize in field. J. Plant Physiol. 2002, 159, 627–634. [Google Scholar] [CrossRef]
  23. Wellburn, A.R.; Lichtenthaler, H. Formulae and program to determine total carotenoids and chlorophylls A and B of leaf extracts in different solvents. In Advances in Photosynthesis Research; Sybesma, C., Ed.; Springer: Dordrecht, The Netherlands, 1984; Volume 12, pp. 9–12. [Google Scholar]
  24. Valladares, F.; Wright, S.J.; Lasso, E.; Kitajima, K.; Pearcy, R.W. Plastic phenotypic response to light of 16 congeneric shrubs from a panamanian rainforest. Ecology 2000, 81, 1925–1936. [Google Scholar] [CrossRef]
  25. Yang, Q.; Liu, Y.-J.; Zeng, Q.-Y. Overexpression of three orthologous glutathione S-transferases from Populus increased salt and drought resistance in Arabidopsis. Biochem. Syst. Ecol. 2019, 83, 57–61. [Google Scholar] [CrossRef]
  26. Westoby, M.; Schrader, J.; Falster, D. Trait ecology of startup plants. New Phytol. 2022, 235, 842–847. [Google Scholar] [CrossRef] [PubMed]
  27. Houter, N.C.; Pons, T.L. Ontogenetic changes in leaf traits of tropical rainforest trees differing in juvenile light requirement. Oecologia 2012, 169, 33–45. [Google Scholar] [CrossRef]
  28. Kitajima, K. Relative importance of photosynthetic traits and allocation patterns as correlates of seedling shade tolerance of 13 tropical trees. Oecologia 1994, 98, 419–428. [Google Scholar] [CrossRef] [PubMed]
  29. Ashraf, M.; Harris, P.J.C. Photosynthesis under stressful environments: An overview. Photosynthetica 2013, 51, 163–190. [Google Scholar] [CrossRef]
  30. Hughes, N.M.; Burkey, K.O.; Cavender-Bares, J.; Smith, W.K. Xanthophyll cycle pigment and antioxidant profiles of winter-red (anthocyanic) and winter-green (acyanic) angiosperm evergreen species. J. Exp. Bot. 2012, 63, 1895–1905. [Google Scholar] [CrossRef] [PubMed]
  31. Kardiman, R.; Raebild, A. Relationship between stomatal density, size and speed of opening in Sumatran rainforest species. Tree Physiol. 2018, 38, 696–705. [Google Scholar] [CrossRef]
  32. Sewelam, N.; Jaspert, N.; Van Der Kelen, K.; Tognetti, V.B.; Schmitz, J.; Frerigmann, H.; Stahl, E.; Zeier, J.; Van Breusegem, F.; Maurino, V.G. Spatial H2O2 signaling specificity: H2O2 from chloroplasts and peroxisomes modulates the plant transcriptome differentially. Mol. Plant 2014, 7, 1191–1210. [Google Scholar] [CrossRef]
  33. Hieno, A.; Naznin, H.A.; Inaba-Hasegawa, K.; Yokogawa, T.; Hayami, N.; Nomoto, M.; Tada, Y.; Yokogawa, T.; Higuchi-Takeuchi, M.; Hanada, K.; et al. Transcriptome analysis and identification of a transcriptional regulatory network in the response to H2O2. Plant Physiol. 2019, 180, 1629–1646. [Google Scholar] [CrossRef] [PubMed]
  34. Huang, X.Y.; Chao, D.Y.; Gao, J.P.; Zhu, M.Z.; Shi, M.; Lin, H.X. A previously unknown zinc finger protein, DST, regulates drought and salt tolerance in rice via stomatal aperture control. Genes Dev. 2009, 23, 1805–1817. [Google Scholar] [CrossRef] [PubMed]
  35. Li, Z.; Wakao, S.; Fischer, B.B.; Niyogi, K.K. Sensing and Responding to Excess Light. Annu. Rev. Plant Biol. 2009, 60, 239–260. [Google Scholar] [CrossRef] [PubMed]
  36. Tang, H.; Hu, Y.-Y.; Yu, W.-W.; Song, L.-L.; Wu, J.-S. Growth, photosynthetic and physiological responses of Torreya grandis seedlings to varied light environments. Trees 2015, 29, 1011–1022. [Google Scholar] [CrossRef]
Figure 1. The growth and leaf traits of juvenile Phoebe bournei with different ages under sun and shade treatments. The growth of height (A) and stem diameter at ground level (B) from July to September 2020. Data are shown as violin plots (n = 10); white dots represent the median. LMA, leaf dry mass per unit leaf area (C) and stomatal density (D) of newly expanded leaves. (E) Leaf thickness. (F) The ratio of palisade parenchyma to spongy parenchyma thickness. The bar plots display the results of the plants subjected to full sun (orange), medium shade (yellow), and deep shade (green) treatments, correspondingly. Values are mean ± S.E., n = 4. Different letters for each plantlets age under three light treatments are significantly different at p < 0.05 based on LSD test.
Forests 14 01683 g001
Figure 2. The light micrographs of leaf cross-sections of Phoebe bournei with different ages under sun and shade treatments. Scale bar: 50 μm.
Forests 14 01683 g002
Figure 3. Transmission electron micrographs (TEM) of chloroplast structures in Phoebe bournei with different ages under sun and shade treatments. Leaf samples were collected from 6-month seedlings (AC), 1-year old saplings (DF) and 2-year old saplings (GI) grown under full sun, medium shade and deep shade conditions, respectively. Representative images are shown. st stromal thylakoid (unstacked), gt grana thylakoid (stacked), pg plastoglobulus, sg starch granule. Scale bar: 1 μm.
Forests 14 01683 g003
Figure 4. Oxidative related parameters analysis of Phoebe bournei with different ages under sun and shade treatments. The statistics of chloroplasts (A) and plastoglobulus number (B) from the TEM micrographs (mean ± S.E., n = 20). The hydrogen peroxide (H2O2) contents (C) and the peroxidase activities (D) of mature leaves (mean ± S.E., n = 3). The bar plots display the results of the plants subjected to full sun (orange), medium shade (yellow), and deep shade (green) treatments, correspondingly. Values followed by different letters for each plantlets age under three light treatments are significantly different at p < 0.05 based on LSD test.
Forests 14 01683 g004
Figure 5. The electron transport parameters of Phoebe bournei with different ages under sun and shade treatments. (A) Fv/Fm, maximum efficiency of PSII. (B) Y(II), quantum yield of photochemical energy conversion in PSII. (C) Y(NO), quantum yield of non-regulated nonphotochemical energy loss in PSII. (D) Y(NPQ), quantum yield of regulated nonphotochemical energy loss in PSII. The bar plots display the results of the plants subjected to full sun (orange), medium shade (yellow), and deep shade (green) treatments, correspondingly. (E) ETR (II), the PSII electron transport rate of the light curve. For interpretation of line color in this figure, please the inset of figure (E). Values (mean ± S.E., n = 4) followed by different letters for each plantlets age under three light treatments are significantly different at p < 0.05 based on LSD test.
Forests 14 01683 g005
Figure 6. Gas exchange parameters of Phoebe bournei with different ages under sun and shade treatments. (A) AN, photosynthetic rate. (B) Ci, intercellular CO2 concentration. (C) gs, stomatal conductance. (D) E, transpiration rate. (E) iWUE, intrinsic water use efficiency. (F) Stomatal limitations. The bar plots display the results of the plants subjected to full sun (orange), medium shade (yellow), and deep shade (green) treatments, correspondingly. The measurements were recorded with CO2 concentration of 400 µmol m−2 s−1 at a light intensity of 1000 µmol photons m−2 s−1. Values (mean ± S.E., n = 4) followed by different letters for each plantlets age under three light treatments are significantly different at p < 0.05 based on LSD test.
Forests 14 01683 g006
Figure 7. The variances of nonstructural carbohydrate (NSC) content including soluble sugar (A) and starch (B) in Phoebe bournei leaves. The bar plots display the results of the plants subjected to full sun (orange), medium shade (yellow), and deep shade (green) treatments, correspondingly. Values (mean ± S.E., n = 4) followed by different letters for each plantlets age under three light treatments are significantly different at p < 0.05 based on LSD test.
Forests 14 01683 g007
Table 1. Plasticity index (PI) of leaf morphological, physiological and anatomic traits in responding to sun and shade in Phoebe bournei plantlets with different ages.
Leaf Traits6 mon1 yr2 yr
LMA0.26 0.12 0.22
Stomatal density0.09 0.18 0.15
Leaf thickness0.22 0.19 0.10
Chloroplast number0.05 0.24 0.35
Plastoglobule number0.33 0.51 0.36
Fv/Fm0.10 0.10 0.08
YII0.25 0.27 0.31
Y(NO)0.05 0.07 0.11
Y(NPQ)0.26 0.36 0.37
AN0.21 0.51 0.36
Ci0.10 0.16 0.02
gs0.12 0.60 0.44
E0.42 0.44 0.09
iWUE0.28 0.11 0.41
Stomatal limitations0.28 0.49 0.35
Total0.20 0.29 0.25
Disclaimer/Publisher’s Note: The statements, opinions and data contained in all publications are solely those of the individual author(s) and contributor(s) and not of MDPI and/or the editor(s). MDPI and/or the editor(s) disclaim responsibility for any injury to people or property resulting from any ideas, methods, instructions or products referred to in the content.

