Predicting the Distributions of Morus notabilis C. K. Schneid under Climate Change in China
Abstract
:1. Introduction
2. Materials and Methods
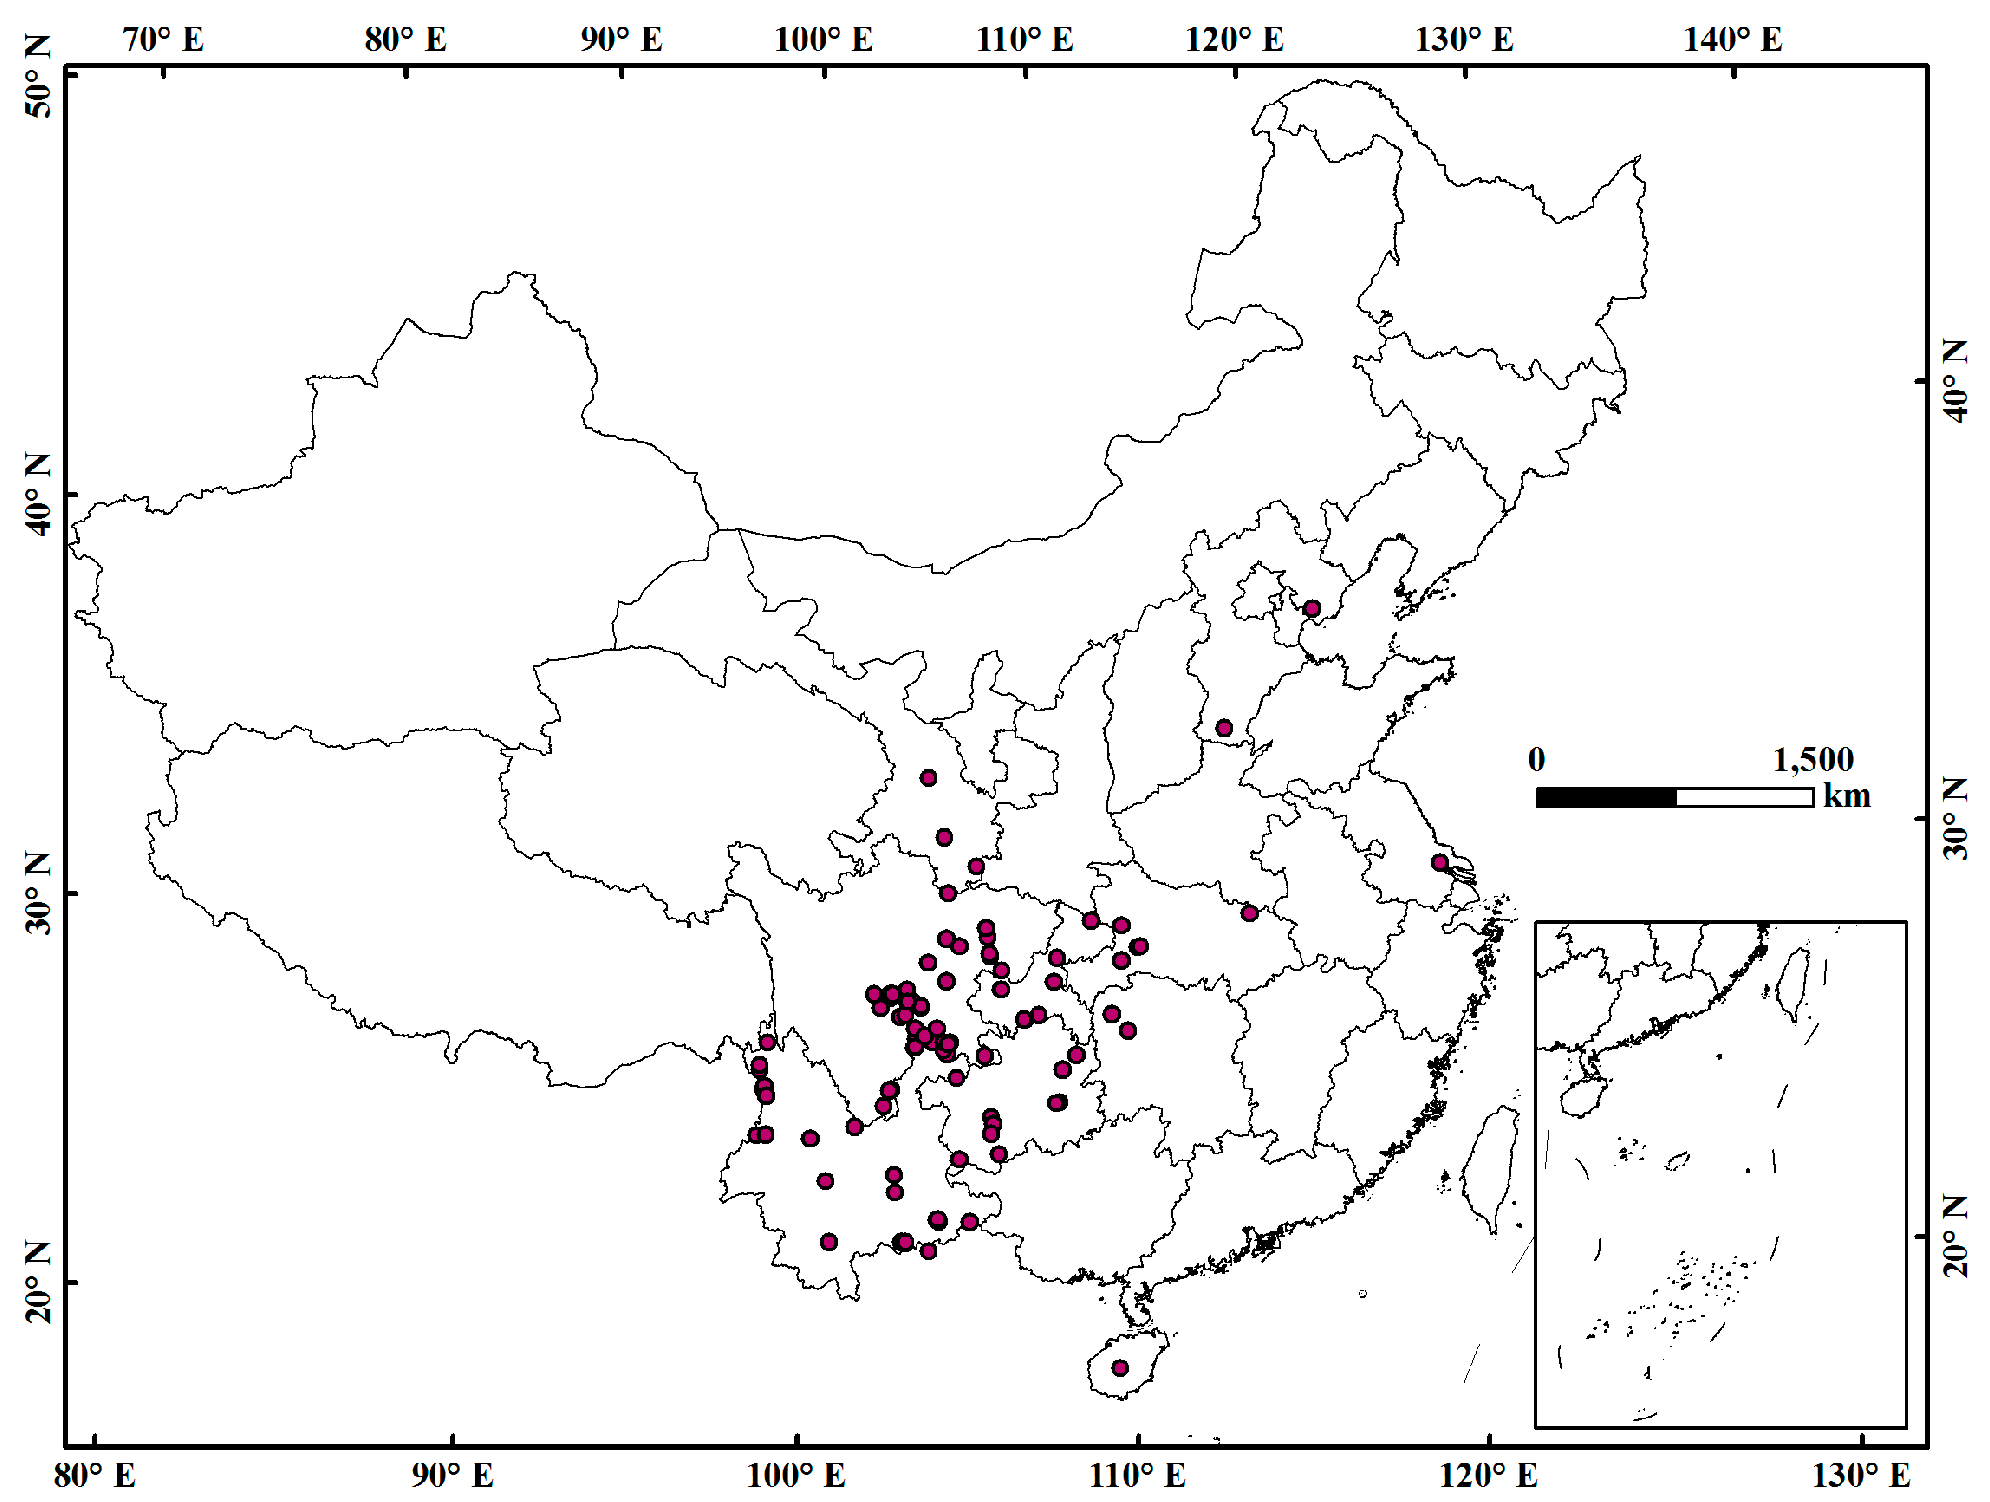
2.1. Species Data Sources and Processing
2.2. Environmental Factors
2.3. MaxEnt Modeling
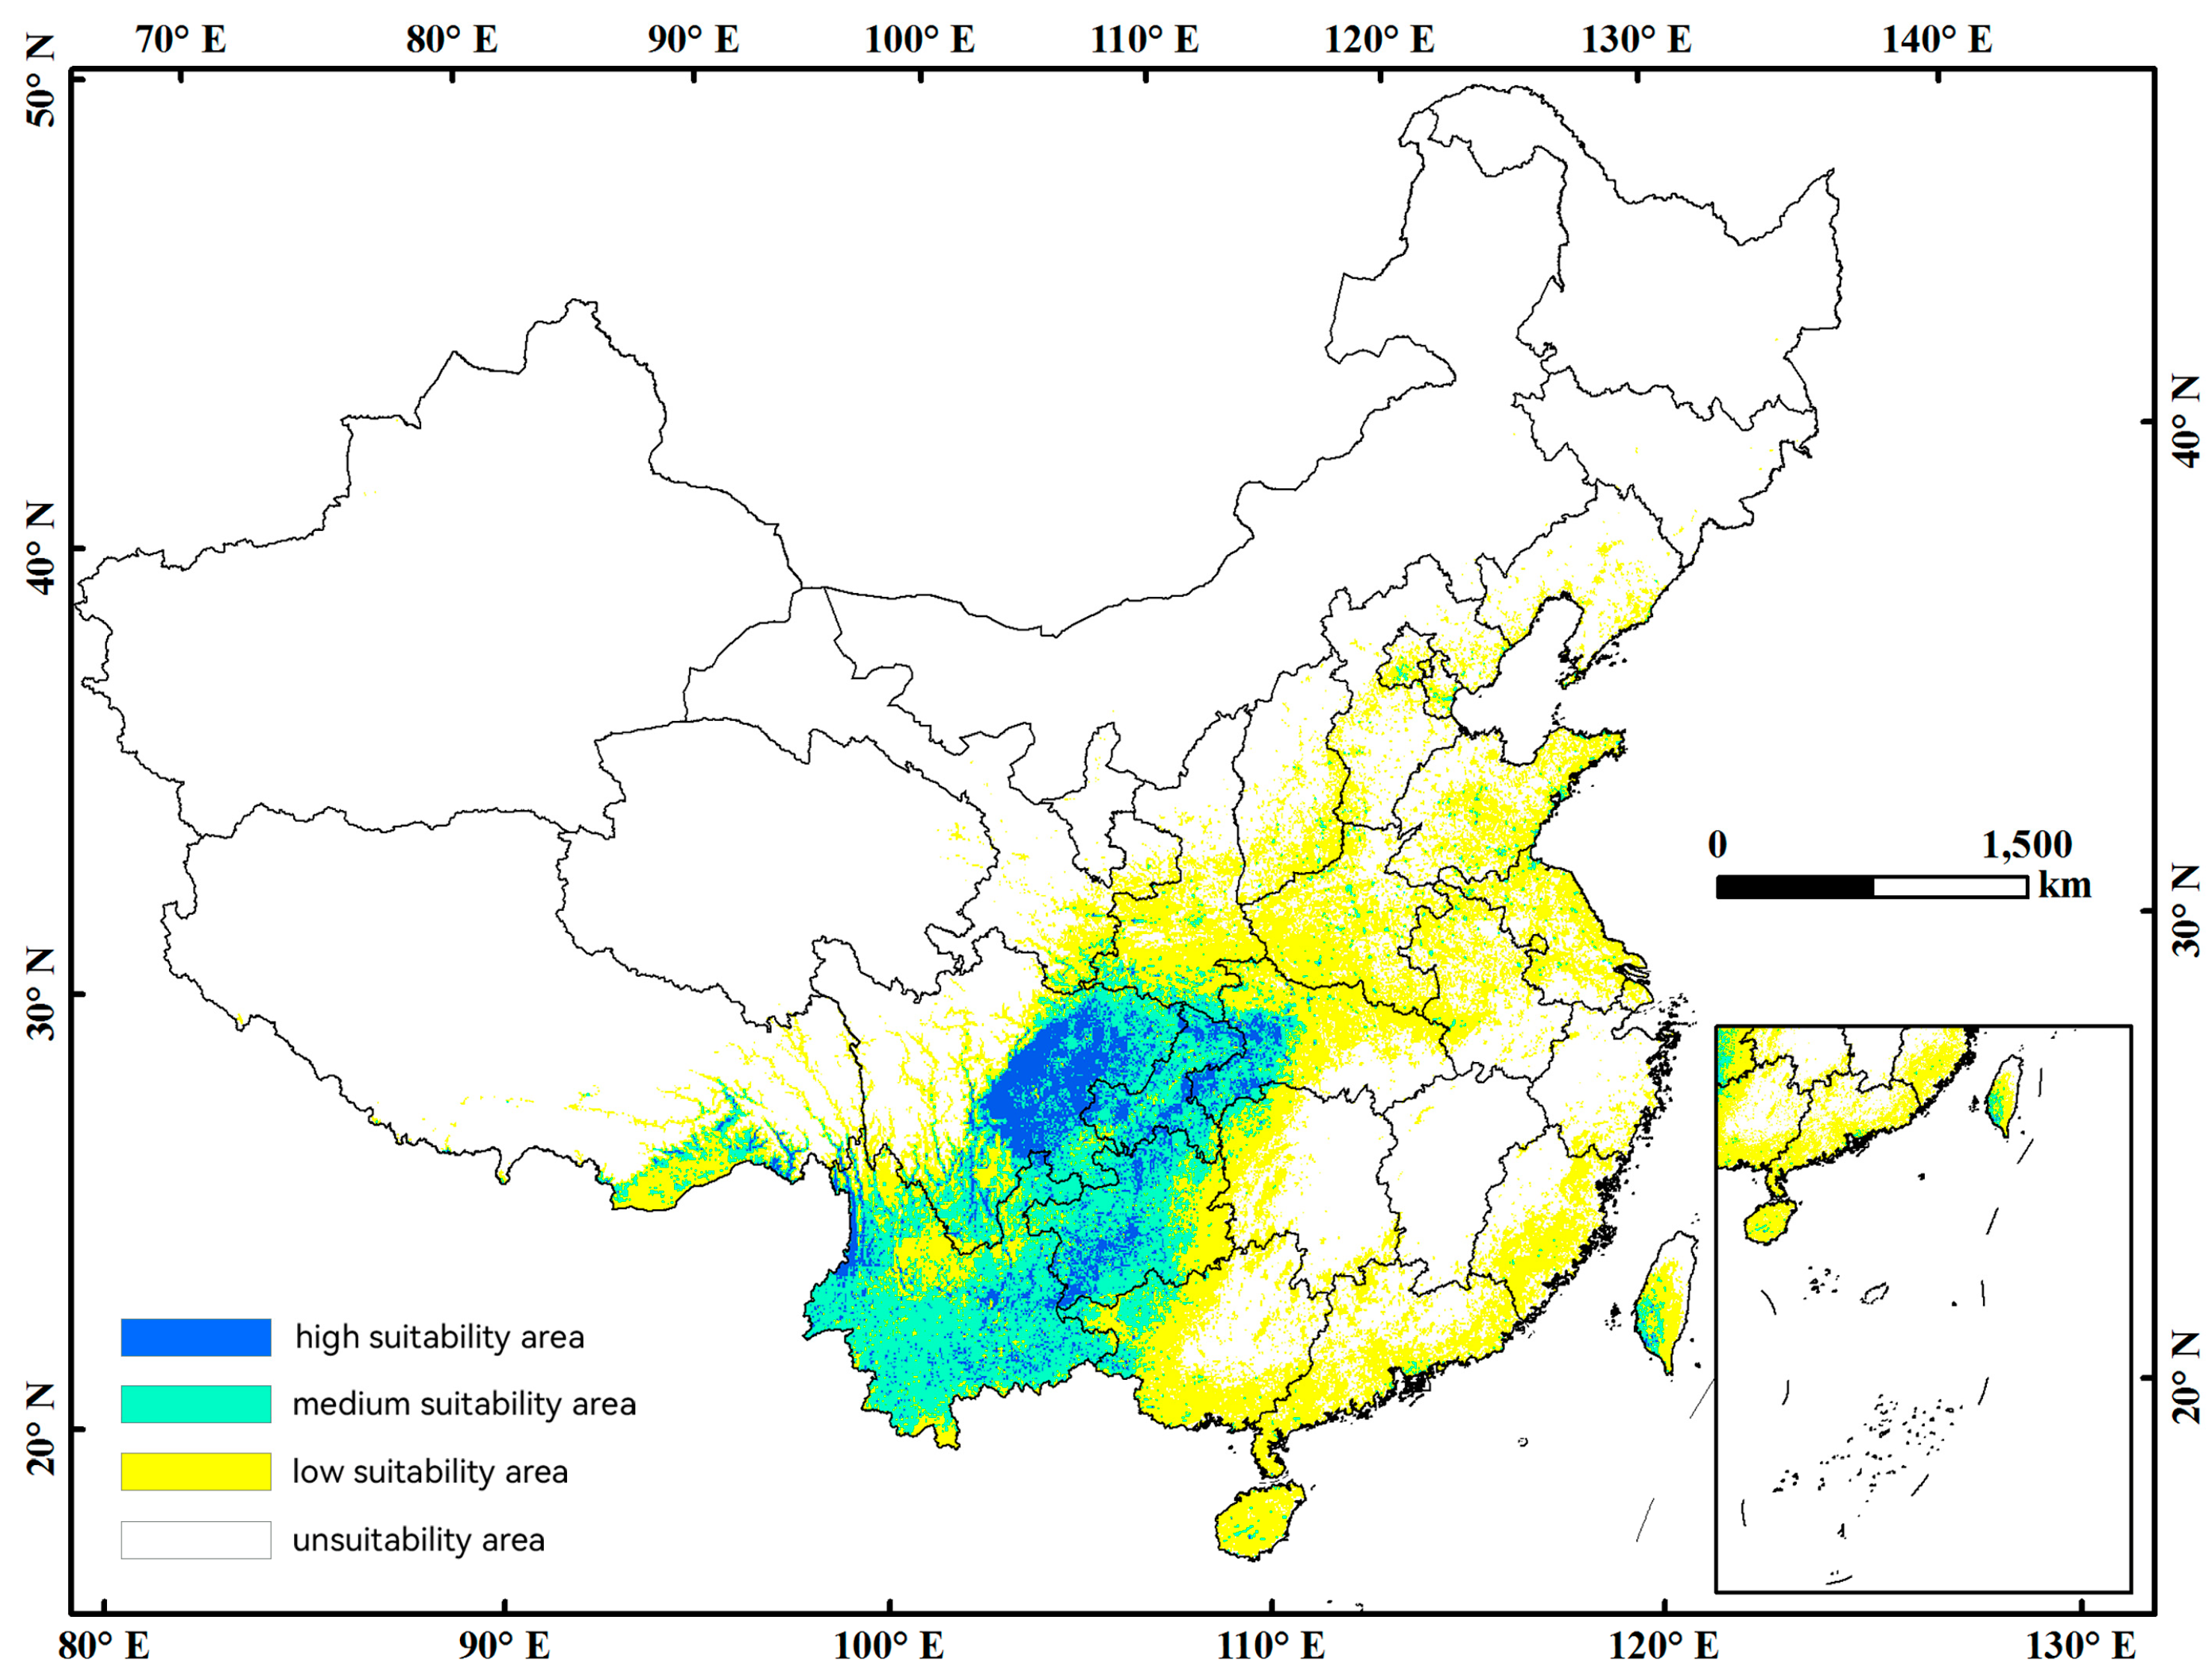
2.4. Classification of Suitable Grades
3. Results
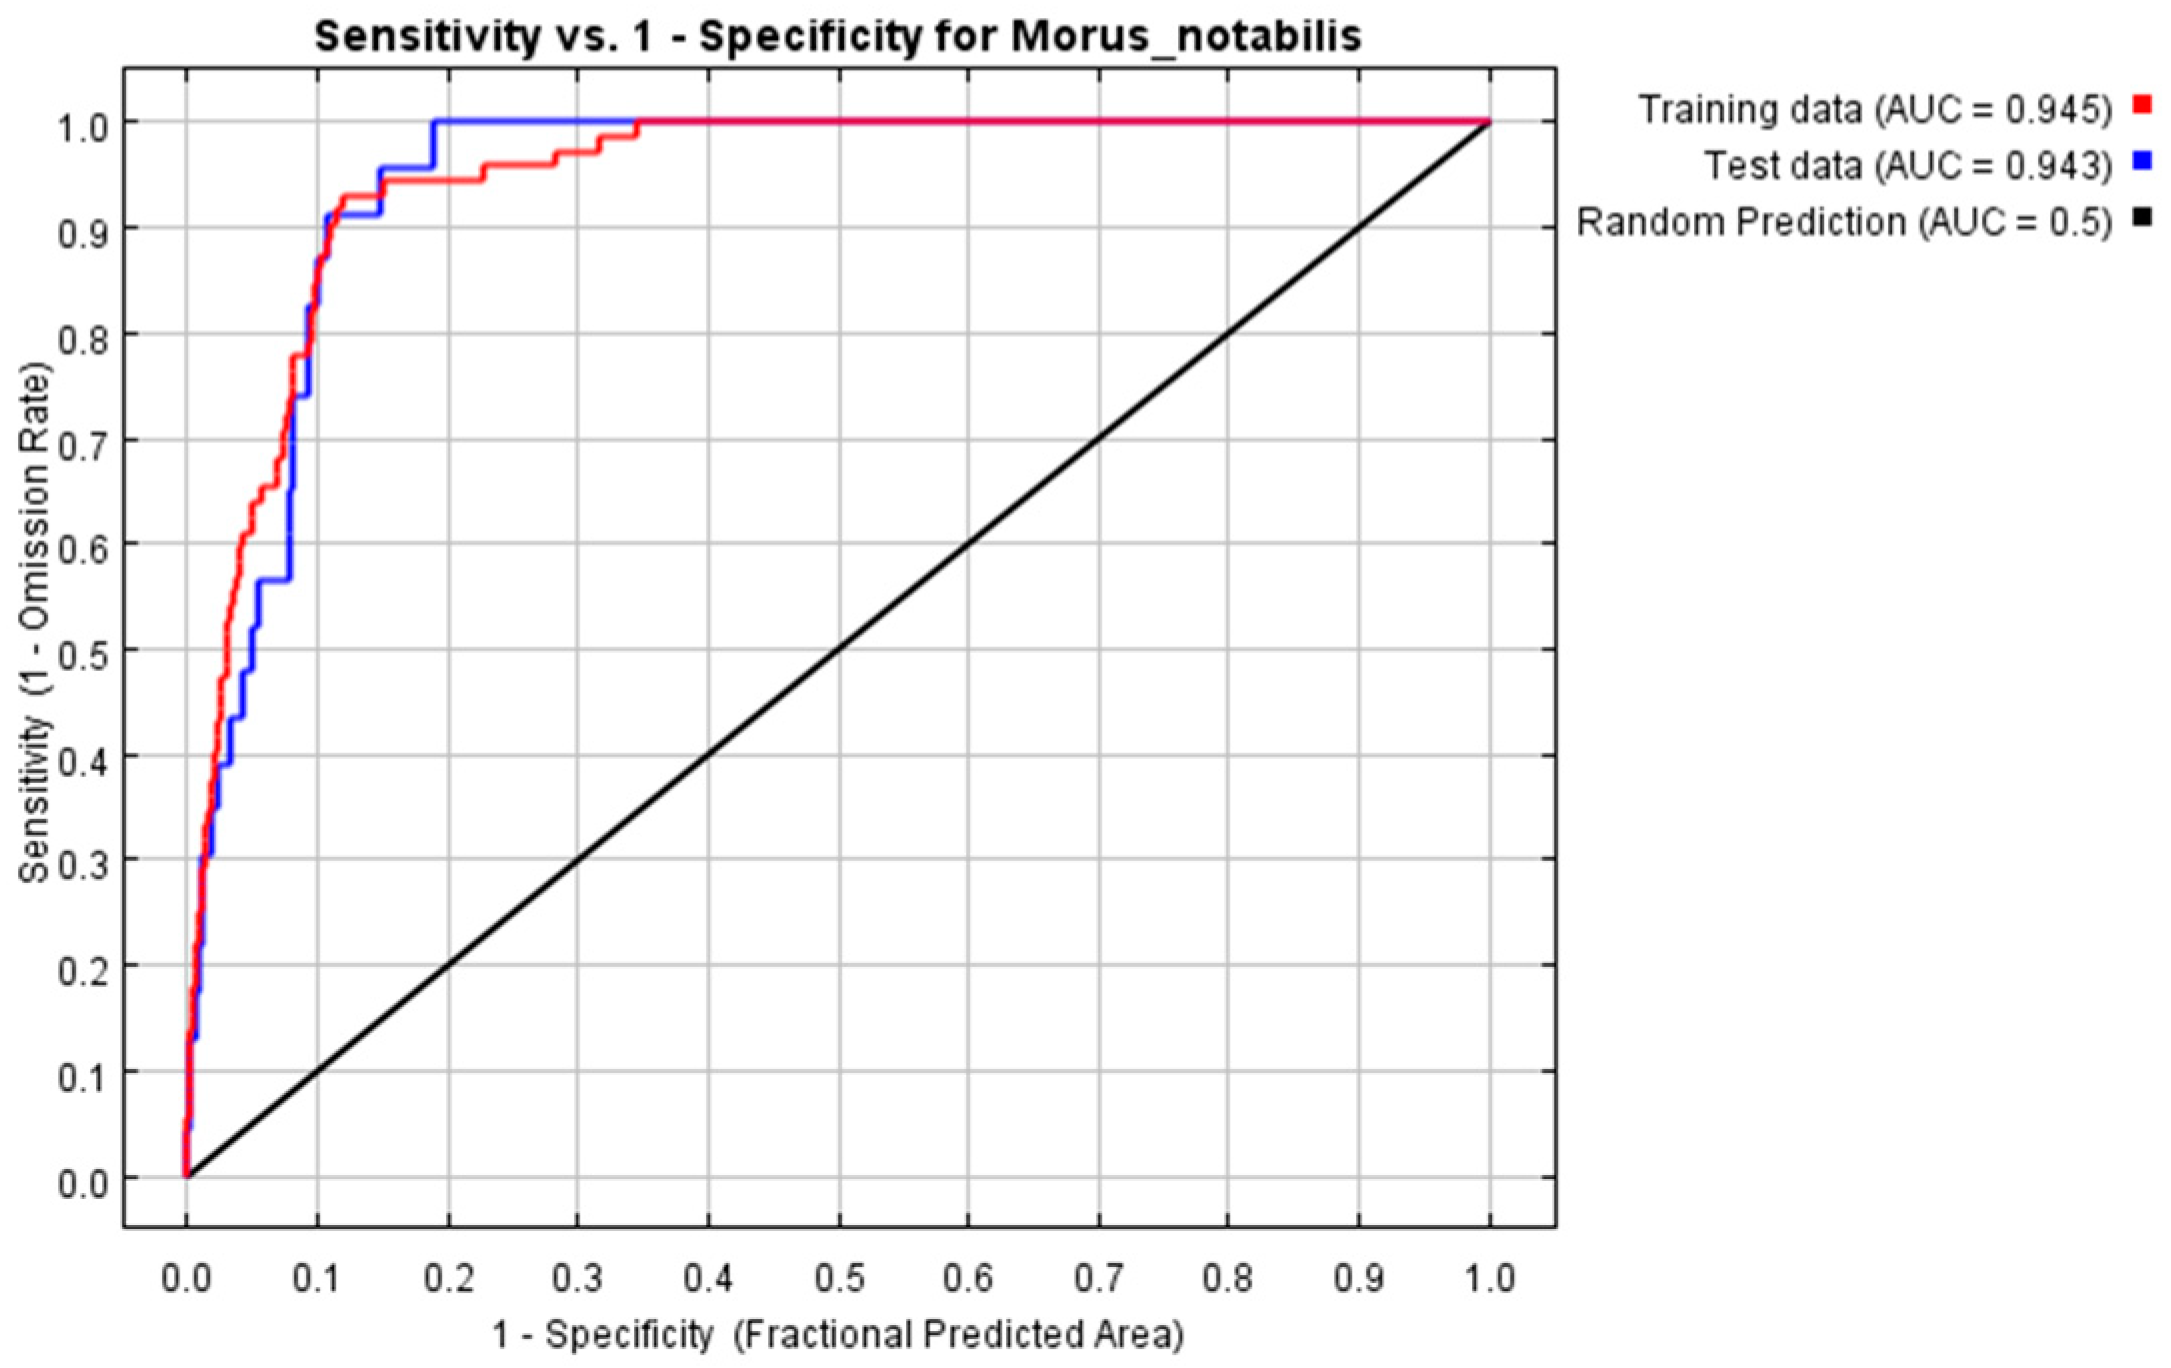
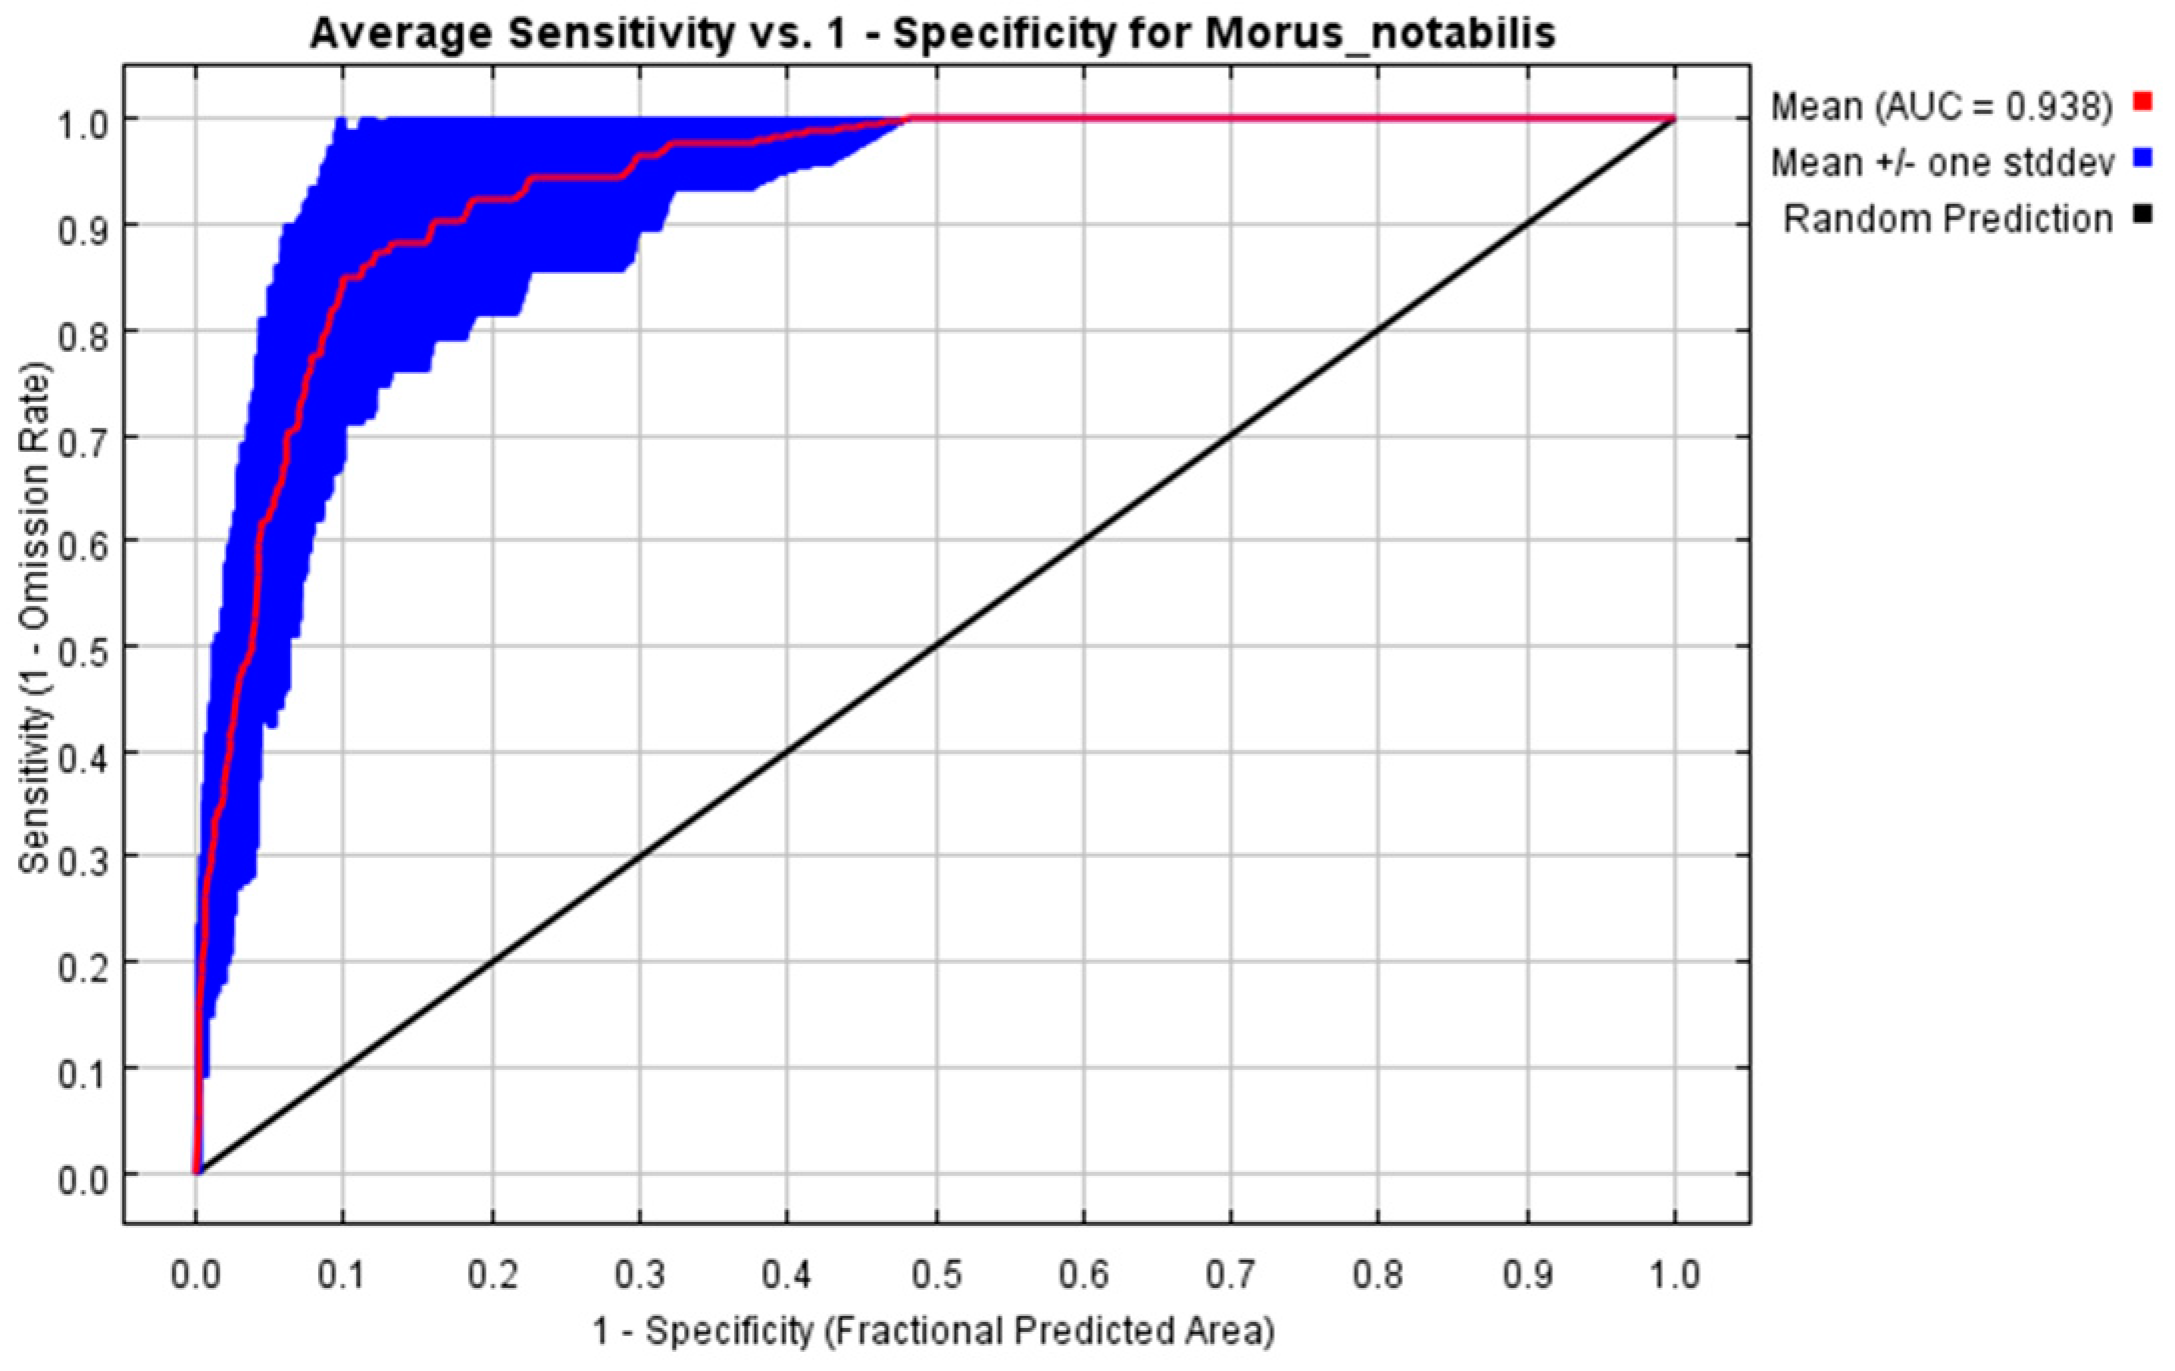
3.1. Model Optimization Results and Accuracy Evaluation
3.2. Model Performance and Key Environment Variables
3.3. Predicting the Current Distribution of Morus notabilis C. K. Schneid in China
3.4. Potential Distribution of Morus notabilis C. K. Schneid in the Future Period
3.5. Environmental Variable Analysis
4. Discussion
5. Conclusions
Author Contributions
Funding
Data Availability Statement
Conflicts of Interest
References
- Hou, C.; Chao, N.; Dai, M.; Liu, L. Screening of 4CL Family Genes in Mulberry and Functional Study of Mm4CL2. Acta Sericol. Sin. 2022, 48, 18–24. [Google Scholar]
- Zhou, Y. Preliminary Study on the Function of Mulberry FBA380 and FBK70 in Fruit Coloration. Master’s Thesis, Southwest University, Chongqing, China, 2022. [Google Scholar]
- Liu, D.; Meng, S.; Xiang, Z.; He, N.; Yang, G. Antimicrobial mechanism of reaction products of Morus notabilis C.K. Schneid (mulberry) polyphenol oxidases and chlorogenic acid. Phytochemistry 2019, 163, 1–10. [Google Scholar] [CrossRef]
- Kılınçer, İ.; Khanyile, L.; Gürcan, K.; Şimşek, Ö.; Uzun, A.; Nikbakht-Dehkordi, A. Decosaploid sour black mulberry (Morus nigra L.) in Western Asia: Features, domestication history, and unique population genetics. Genet. Resour. Crop Eviron. 2023, 1–18. [Google Scholar] [CrossRef]
- Zheng, S.; Zhu, Y.; Liu, C.; Fan, W.; Xiang, Z.; Zhao, A. Genome-wide identification and characterization of genes involved in melatonin biosynthesis in Morus notabilis C.K. Schneid (wild mulberry). Phytochemistry 2021, 189, 112819. [Google Scholar] [CrossRef] [PubMed]
- Vanhaelewyn, L.; Prinsen, E.; Van Der Straeten, D.; Vandenbussche, F. Hormone-controlled UV-B responses in plants. J. Exp. Bot. 2016, 67, 4469–4482. [Google Scholar] [CrossRef] [PubMed]
- Sun, Z.; Kumar, R.M.S.; Li, J.; Yang, G.; Xie, Y. In Silico search and biological validation of MicroR171 family related to abiotic stress response in mulberry (Morus alba L.). Hortic. Plant J. 2022, 8, 184–194. [Google Scholar] [CrossRef]
- Liu, D.; Zeng, Y.; Qiu, C.; Lin, Q. Molecular Cloning and Adversity Stress Expression Analysis of SPDS Genes in Mulberry (Morus notabilis C.K. Schneid). Russ. J. Plant Physiol. 2021, 68, 1186–1193. [Google Scholar] [CrossRef]
- Sharma, R.; Khan, S.; Kaul, V. Predicting the potential habitat suitability and distribution of “Weed-Onion” (Asphodelus tenuifolius Cavan.) in India under predicted climate change scenarios. J. Agric. Food Res. 2023, 14, 100697. [Google Scholar] [CrossRef]
- Sekhar, K.M.; Reddy, K.S.; Reddy, A.R. Amelioration of drought-induced negative responses by elevated CO2 in field grown short rotation coppice mulberry (Morus spp.), a potential bio-energy tree crop. Photosynth. Res. 2017, 132, 151–164. [Google Scholar] [CrossRef]
- Imani Wa Rusaati, B.; Won Kang, J. MaxEnt modeling for predicting the potential distribution of Lebrunia bushaie Staner (Clusiaceae) under different climate change scenarios in Democratic Republic of Congo. J. Asia-Pac. Biodivers. 2023; in press. [Google Scholar] [CrossRef]
- Zhuo, Z.; Xu, D.; Pu, B.; Wang, R.; Ye, M. Predicting distribution of Zanthoxylum bungeanum Maxim. in China. BMC Ecol. 2020, 20, 46. [Google Scholar] [CrossRef]
- Liu, Z.; Zhou, P.; Zhang, F.; Liu, X.; Chen, G. Spatiotemporal characteristics of dryness/wetness conditions across Qinghai Province, Northwest China. Agric. For. Meteorol. 2013, 182–183, 101–108. [Google Scholar] [CrossRef]
- Xin, X.; Jiang, X.; Thomas, A.; Niu, B.; Zhang, M.; Xu, X.; Zhang, R.; Li, H.; Gui, Z. Studies on 1-deoxynojirimycin biosynthesis in mulberry (Morus alba L.) seeds through comparative transcriptomics. Nat. Prod. Res. 2023, 1–10. [Google Scholar] [CrossRef] [PubMed]
- Wu, B.; Zhou, L.; Qi, S.; Jin, M.; Hu, J.; Lu, J. Effect of habitat factors on the understory plant diversity of Platycladus orientalis (Linnaeus) plantations in Beijing mountainous areas based on MaxEnt model. Ecol. Indic. 2021, 129, 107917. [Google Scholar] [CrossRef]
- He, P.; Li, J.; Li, Y.; Xu, N.; Gao, Y.; Guo, L.; Huo, T.; Peng, C.; Meng, F. Habitat protection and planning for three Ephedra using the MaxEnt and Marxan models. Ecol. Indic. 2021, 133, 108399. [Google Scholar] [CrossRef]
- Thakur, S.; Rai, I.D.; Singh, B.; Dutt, H.C.; Musarella, C.M. Predicting the suitable habitats of Elwendia persica (Boiss.) in the Indian Himalayan Region (IHR). Plant Biosyst.—Int. J. Deal. All Asp. Plant Biol. 2023, 157, 769–778. [Google Scholar] [CrossRef]
- Ji, W.; Gao, Y.; Wei, J. Potential Global Distribution of Daktulosphaira vitifoliae (Fitch) under Climate Change Based on MaxEnt. Insects 2021, 12, 347. [Google Scholar] [CrossRef] [PubMed]
- Xia, Z.; Dai, X.; Fan, W.; Liu, C.; Zhang, M.; Bian, P.; Zhou, Y.; Li, L.; Zhu, B.; Liu, S.; et al. Chromosome-level Genomes Reveal the Genetic Basis of Descending Dysploidy and Sex Determination in Morus Plants. Genom. Proteom. Bioinf. 2022, 20, 1119–1137. [Google Scholar] [CrossRef] [PubMed]
- Gao, H. Method of improving the conversion of Cadmium-containing plant biomass energy under the background of soil pollution. Energy Rep. 2022, 8, 10803–10811. [Google Scholar] [CrossRef]
- Zhao, H.; Xian, X.; Guo, J.; Yang, N.; Zhang, Y.; Chen, B.; Huang, H.; Liu, W. Monitoring the little fire ant, Wasmannia auropunctata (Roger 1863), in the early stage of its invasion in China: Predicting its geographical distribution pattern under climate change. J. Integr. Agric. 2023, 22, 2783–2795. [Google Scholar] [CrossRef]
- Li, X.; Xu, D.; Jin, Y.; Zhuo, Z.; Yang, H.; Hu, J.; Wang, R. Predicting the current and future distributions of Brontispa longissimi (Gestro) (Coleoptera: Chrysomelidae) under climate change in China. Glob. Ecol. Conserv. 2020, 25, e1444. [Google Scholar] [CrossRef]
- Xu, D.; Zhuo, Z.; Li, X.; Wang, R. Distribution and invasion risk assessment of Oryctes rhinoceros (L.) in China under changing climate. J. Appl. Entomol. 2022, 146, 385–395. [Google Scholar] [CrossRef]
- Islam, K.N.; Rana, L.R.S.; Islam, K.; Hossain, M.S.; Hossain, M.M.; Hossain, M.A. Climate change and the distribution of two Ficus spp. in Bangladesh—Predicting the spatial shifts. Trees For. People 2021, 4, 100086. [Google Scholar] [CrossRef]
- Wan, J.; Qi, G.; Ma, J.; Ren, Y.; Wang, R.; McKirdy, S. Predicting the potential geographic distribution of Bactrocera bryoniae (Tryon) and Bactrocera neohumeralis (Hardy) (Diptera: Tephritidae) in China using MaxEnt ecological niche modeling. J. Integr. Agric. 2020, 19, 2072–2082. [Google Scholar] [CrossRef]
- Yuyuan, X.; Chen, L.; Ningning, Z.; Wencheng, L.; Jingyuan, S.; Xuehong, W. Prediction of Suitable Habitat of Tibetan Migratory Locust in Changdu City Based on MaxEnt Model. J. Plateau Agric. 2023, 7, 249–258. [Google Scholar] [CrossRef]
- Maurya, A.; Semwal, M.; Mishra, B.P.; Mohan, R.; Rana, T.S.; Nair, N.K. Distribution modeling for predicting habitat suitability for citron (Citrus medica L.) under climate change scenarios. Flora 2023, 304, 152298. [Google Scholar] [CrossRef]
- Shishir, S.; Mollah, T.H.; Tsuyuzaki, S.; Wada, N. Predicting the probable impact of climate change on the distribution of threatened Shorea robusta Gaertn. f. forest in Purbachal, Bangladesh. Glob. Ecol. Conserv. 2020, 24, e1250. [Google Scholar] [CrossRef]
- Xu, D.; Zhuo, Z.; Wang, R.; Ye, M.; Pu, B. Modeling the distribution of Zanthoxylum armatum DC. in China with MaxEnt modeling. Glob. Ecol. Conserv. 2019, 19, e691. [Google Scholar] [CrossRef]
- Cheng, Z.; Aakala, T.; Larjavaara, M. Elevation, aspect, and slope influence woody vegetation structure and composition but not species richness in a human-influenced landscape in northwestern Yunnan, China. Front. Glob. Chang. 2023, 6, 1187724. [Google Scholar] [CrossRef]
- Jain, M.; Bansal, J.; Rajkumar, M.S.; Sharma, N.; Khurana, J.P.; Khurana, P. Draft genome sequence of Indian mulberry (Morus indica L.) provides a resource for functional and translational genomics. Genomics 2022, 114, 110346. [Google Scholar] [CrossRef]
- Brunel, N.; Meza, F.; Ros, R.; Santibáñez, F. Effects of topsoil loss on wheat productivity in dryland zones of Chile. J. Soil Sci. Plant Nutr. 2011, 11, 129–137. [Google Scholar] [CrossRef]
- Ries, G.; Heller, W.; Puchta, H.; Sandermann, H.; Seidlitz, H.K.; Hohn, B. Elevated UV-B radiation reduces genome stability in plants. Nature 2000, 406, 98–101. [Google Scholar] [CrossRef]
- Angst, G.; Messinger, J.; Greiner, M.; Häusler, W.; Hertel, D.; Kirfel, K.; Kögel-Knabner, I.; Leuschner, C.; Rethemeyer, J.; Mueller, C.W. Soil organic carbon stocks in topsoil and subsoil controlled by parent material, carbon input in the rhizosphere, and microbial-derived compounds. Soil Biol. Biochem. 2018, 122, 19–30. [Google Scholar] [CrossRef]
- Yang, J.; Huang, Y.; Jiang, X.; Chen, H.; Liu, M.; Wang, R. Potential geographical distribution of the edangred plant Isoetes under human activities using MaxEnt and GARP. Glob. Ecol. Conserv. 2022, 38, e2186. [Google Scholar] [CrossRef]
- Naasko, K.I.; Naylor, D.; Graham, E.B.; Couvillion, S.P.; Danczak, R.; Tolic, N.; Nicora, C.; Fransen, S.; Tao, H.; Hofmockel, K.S.; et al. Influence of soil depth, irrigation, and plant genotype on the soil microbiome, metaphenome, and carbon chemistry. mBio 2023, 14, e175823. [Google Scholar] [CrossRef]
- Soilhi, Z.; Sayari, N.; Benalouache, N.; Mekki, M. Predicting current and future distributions of Mentha pulegium L. in Tunisia under climate change conditions, using the MaxEnt model. Ecol. Inform. 2022, 68, 101533. [Google Scholar] [CrossRef]
- Gruber, H.; Ulm, R.; Heijde, M. Regulation of UV-B-induced photomorphogenesis in Arabidopsis. Comp. Biochem. Physiol. A-Mol. Integr. Physiol.—Comp. Biochem. Physiol. Part A 2009, 153, S200. [Google Scholar] [CrossRef]
- Wiśniewski, P.; Märker, M. Comparison of Topsoil Organic Carbon Stocks on Slopes under Soil-Protecting Forests in Relation to the Adjacent Agricultural Slopes. Forests 2021, 12, 390. [Google Scholar] [CrossRef]
- Hyyryläinen, A.; Turunen, M.; Rautio, P.; Huttunen, S. Sphagnum mosses in a changing UV-B environment: A review. Perspect. Plant Ecol. Evol. Syst. 2018, 33, 1–8. [Google Scholar] [CrossRef]
- Swart, C.; Donaldson, J.; Barker, N. Predicting the distribution of Encephalartos latifrons (Lehmann), a critically endangered cycad in South Africa. Biodivers. Conserv. 2018, 27, 1961–1980. [Google Scholar] [CrossRef]
- Mapunda, K.K.; Andrew, S.M. Predicting the distribution of critically endangered tree species Karomia gigas (Faden) under climate change in Tanzania. Ecol. Eng. 2023, 195, 107065. [Google Scholar] [CrossRef]
- Yost, M.A.; Kitchen, N.R.; Sudduth, K.A.; Thompson, A.L.; Allphin, E. Topsoil Thickness Influences Nitrogen Management of Switchgrass. Bioenerg. Res. 2017, 10, 465–477. [Google Scholar] [CrossRef]
- Cajigas Gandia, A.; Alonso Bosch, R.; Mancina, C.A.; Herrel, A. Climatic variation along the distributional range in Cuban Anolis lizards: Species and ecomorphs under future scenarios of climate change. Glob. Ecol. Conserv. 2023, 42, e2401. [Google Scholar] [CrossRef]
| Bio-Climatic Variables | Abbreviation | Percent Contribution/% | Permutation Importance/% |
|---|---|---|---|
| Annual Precipitation | Bio12 | 39.8 | 0.3 |
| Min Temperature of Coldest Month | Bio6 | 18.1 | 0 |
| Temperature Annual Range (bio5–bio6) | Bio7 | 13 | 3.3 |
| Precipitation of Coldest Quarter | Bio19 | 10.5 | 11.4 |
| Precipitation of Warmest Quarter | Bio18 | 8.1 | 1.8 |
| Max Temperature of Warmest Month | Bio5 | 3.4 | 6 |
| Precipitation Seasonality (Coefficient of Variation) | Bio15 | 2.7 | 1.5 |
| Mean Temperature of Driest Quarter | Bio9 | 1.1 | 12.5 |
| Precipitation of Driest Month | Bio14 | 1.1 | 2.3 |
| Isothermality (bio 2/bio 7) (*100) | Bio3 | 0.8 | 1.7 |
| Mean Temperature of Warmest Quarter | Bio10 | 0.5 | 4.1 |
| Temperature Seasonality (SD *100) | Bio4 | 0.4 | 48.5 |
| Precipitation of Wettest Quarter | Bio16 | 0.2 | 0 |
| Precipitation of Wettest Month | Bio13 | 0.1 | 1.4 |
| Mean Temperature of Wettest Quarter | Bio8 | 0.1 | 3.1 |
| Annual Mean Temperature | Bio1 | 0.1 | 1.3 |
| Mean Temperature of Coldest Quarter | Bio11 | 0.1 | 1 |
| Mean Diurnal Range (Mean of monthly [max temp–min temp]) | Bio2 | 0 | 0 |
| Precipitation of Driest Quarter | Bio17 | 0 | 0 |
| Variable Classification | Environmental Variables | Unit | Abbreviation |
|---|---|---|---|
| Bio-climatic variables | Annual Precipitation | mm | Bio12 |
| Min Temperature of Coldest Month | °C | Bio6 | |
| Temperature Annual Range (bio5–bio6) | °C | Bio7 | |
| Precipitation of Coldest Quarter | mm | Bio19 | |
| Precipitation of Warmest Quarter | mm | Bio18 | |
| Max Temperature of Warmest Month | °C | Bio5 | |
| Precipitation Seasonality (Coefficient of Variation) | mm | Bio15 | |
| Precipitation of Driest Month | mm | Bio14 | |
| Isothermality (bio 2/bio 7) (×100) | ×100 | Bio3 | |
| Soil variables | Soil reference depth | / | Ref-depth |
| Soil acidity and alkalinity | / | pH | |
| Upper soil sediment content | %wt. | T-sand | |
| Organic carbon content | %wt. | TOC | |
| Soil evaluation indicators | / | USDA | |
| Terrain variables | The orientation of the terrain slope | Degree | Aspect |
| The degree of steepness and gentleness of surface units | ° | Slope | |
| Altitude | m | Alt | |
| Chemical variables | Ultraviolet-B radiation | nm | UV-B |
| Human variables | Human footprint | / | Hf |
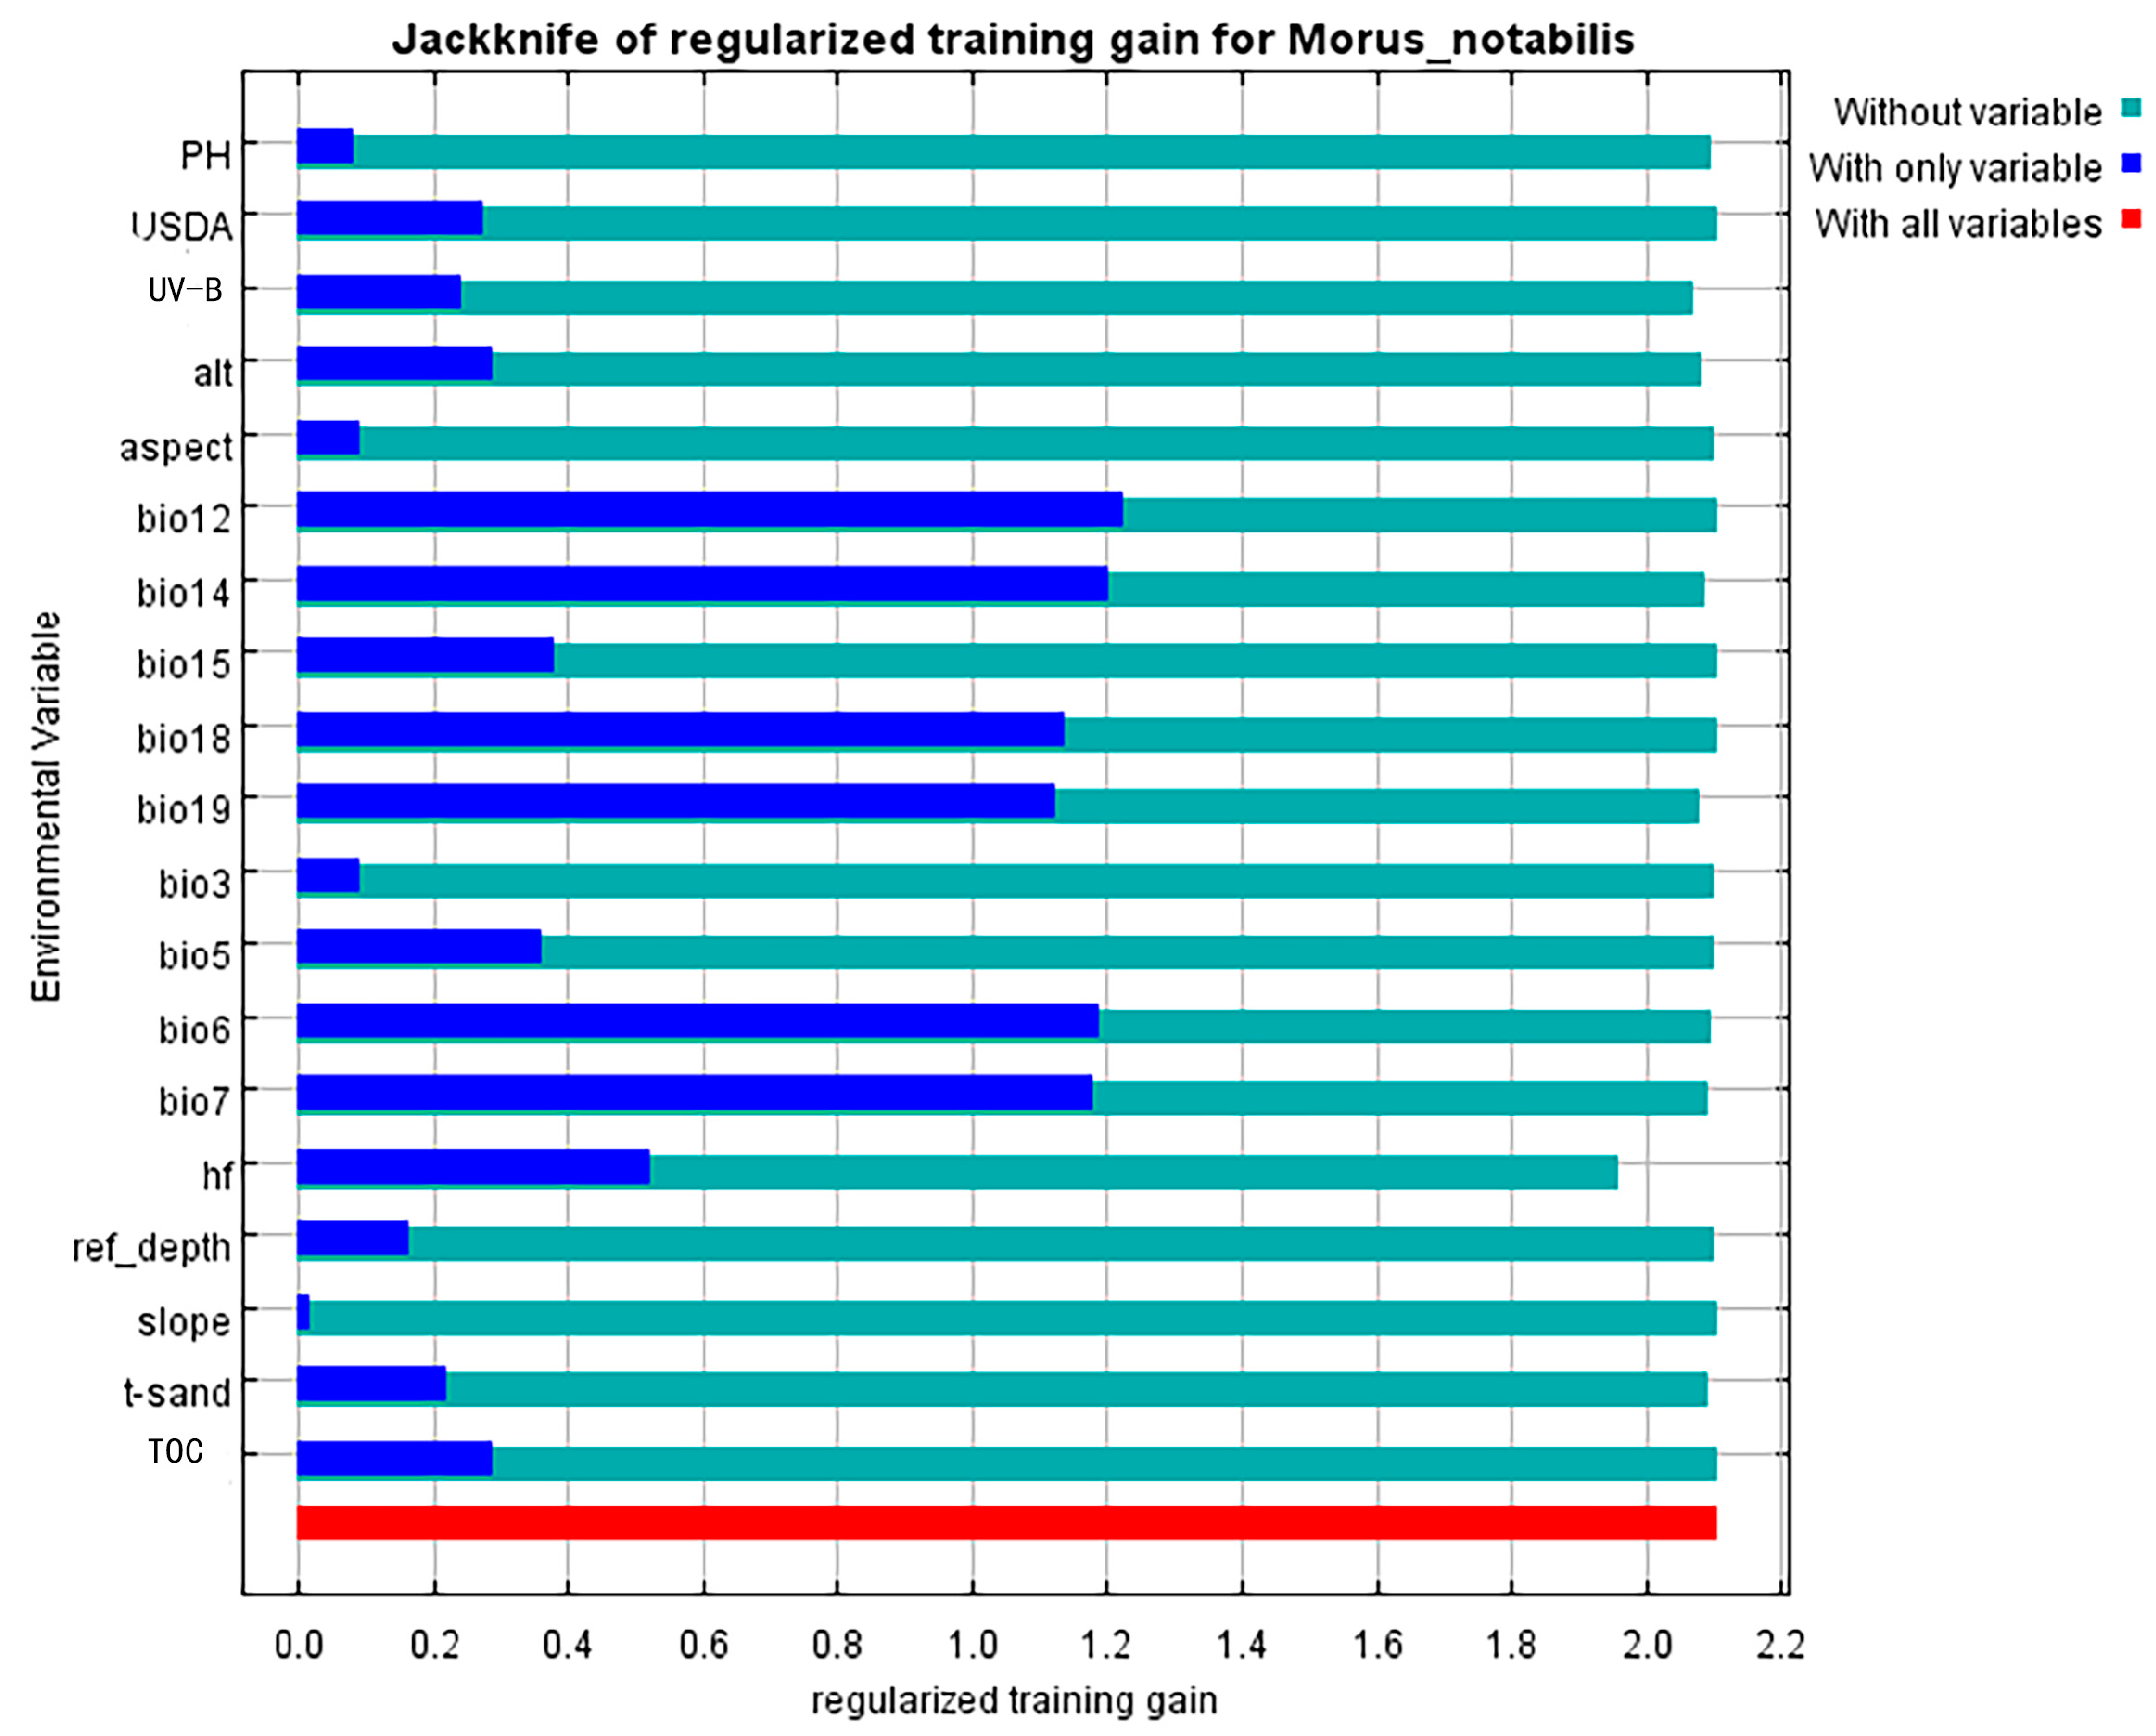
| Variable Classification | Abbreviation | Percent Contribution/% | Permutation Importance/% |
|---|---|---|---|
| Annual Precipitation | Bio12 | 42.6 | 0.4 |
| Altitude | alt | 11 | 8.8 |
| Min Temperature of Coldest Month | Bio6 | 9.2 | 26.3 |
| Human footprint | hf | 8.5 | 6.1 |
| Temperature Annual Range (bio5–bio6) | Bio7 | 7.5 | 19.4 |
| Precipitation of Coldest Quarter | Bio19 | 5.7 | 15.2 |
| Ultraviolet-B radiation | UV-B | 4.5 | 5.8 |
| Precipitation of Driest Month | Bio14 | 3.8 | 7.2 |
| Precipitation of Warmest Quarter | Bio18 | 3 | 3.2 |
| Soil reference depth | Ref-depth | 1 | 0.7 |
| Soil acidity and alkalinity | pH | 0.8 | 1.8 |
| Precipitation Seasonality (Coefficient of Variation) | Bio15 | 0.5 | 0.2 |
| The orientation of the terrain slope | Aspect | 0.4 | 1.1 |
| Soil evaluation indicators | USDA | 0.4 | 0.1 |
| Upper soil sediment content | T-sand | 0.3 | 2.1 |
| Max Temperature of Warmest Month | Bio5 | 0.3 | 1 |
| Isothermality (bio 2/bio 7) (×100) | Bio3 | 0.1 | 0.6 |
| Organic carbon content | TOC | 0.1 | 0.1 |
| The degree of steepness and gentleness of surface units | Slope | 0 | 0 |
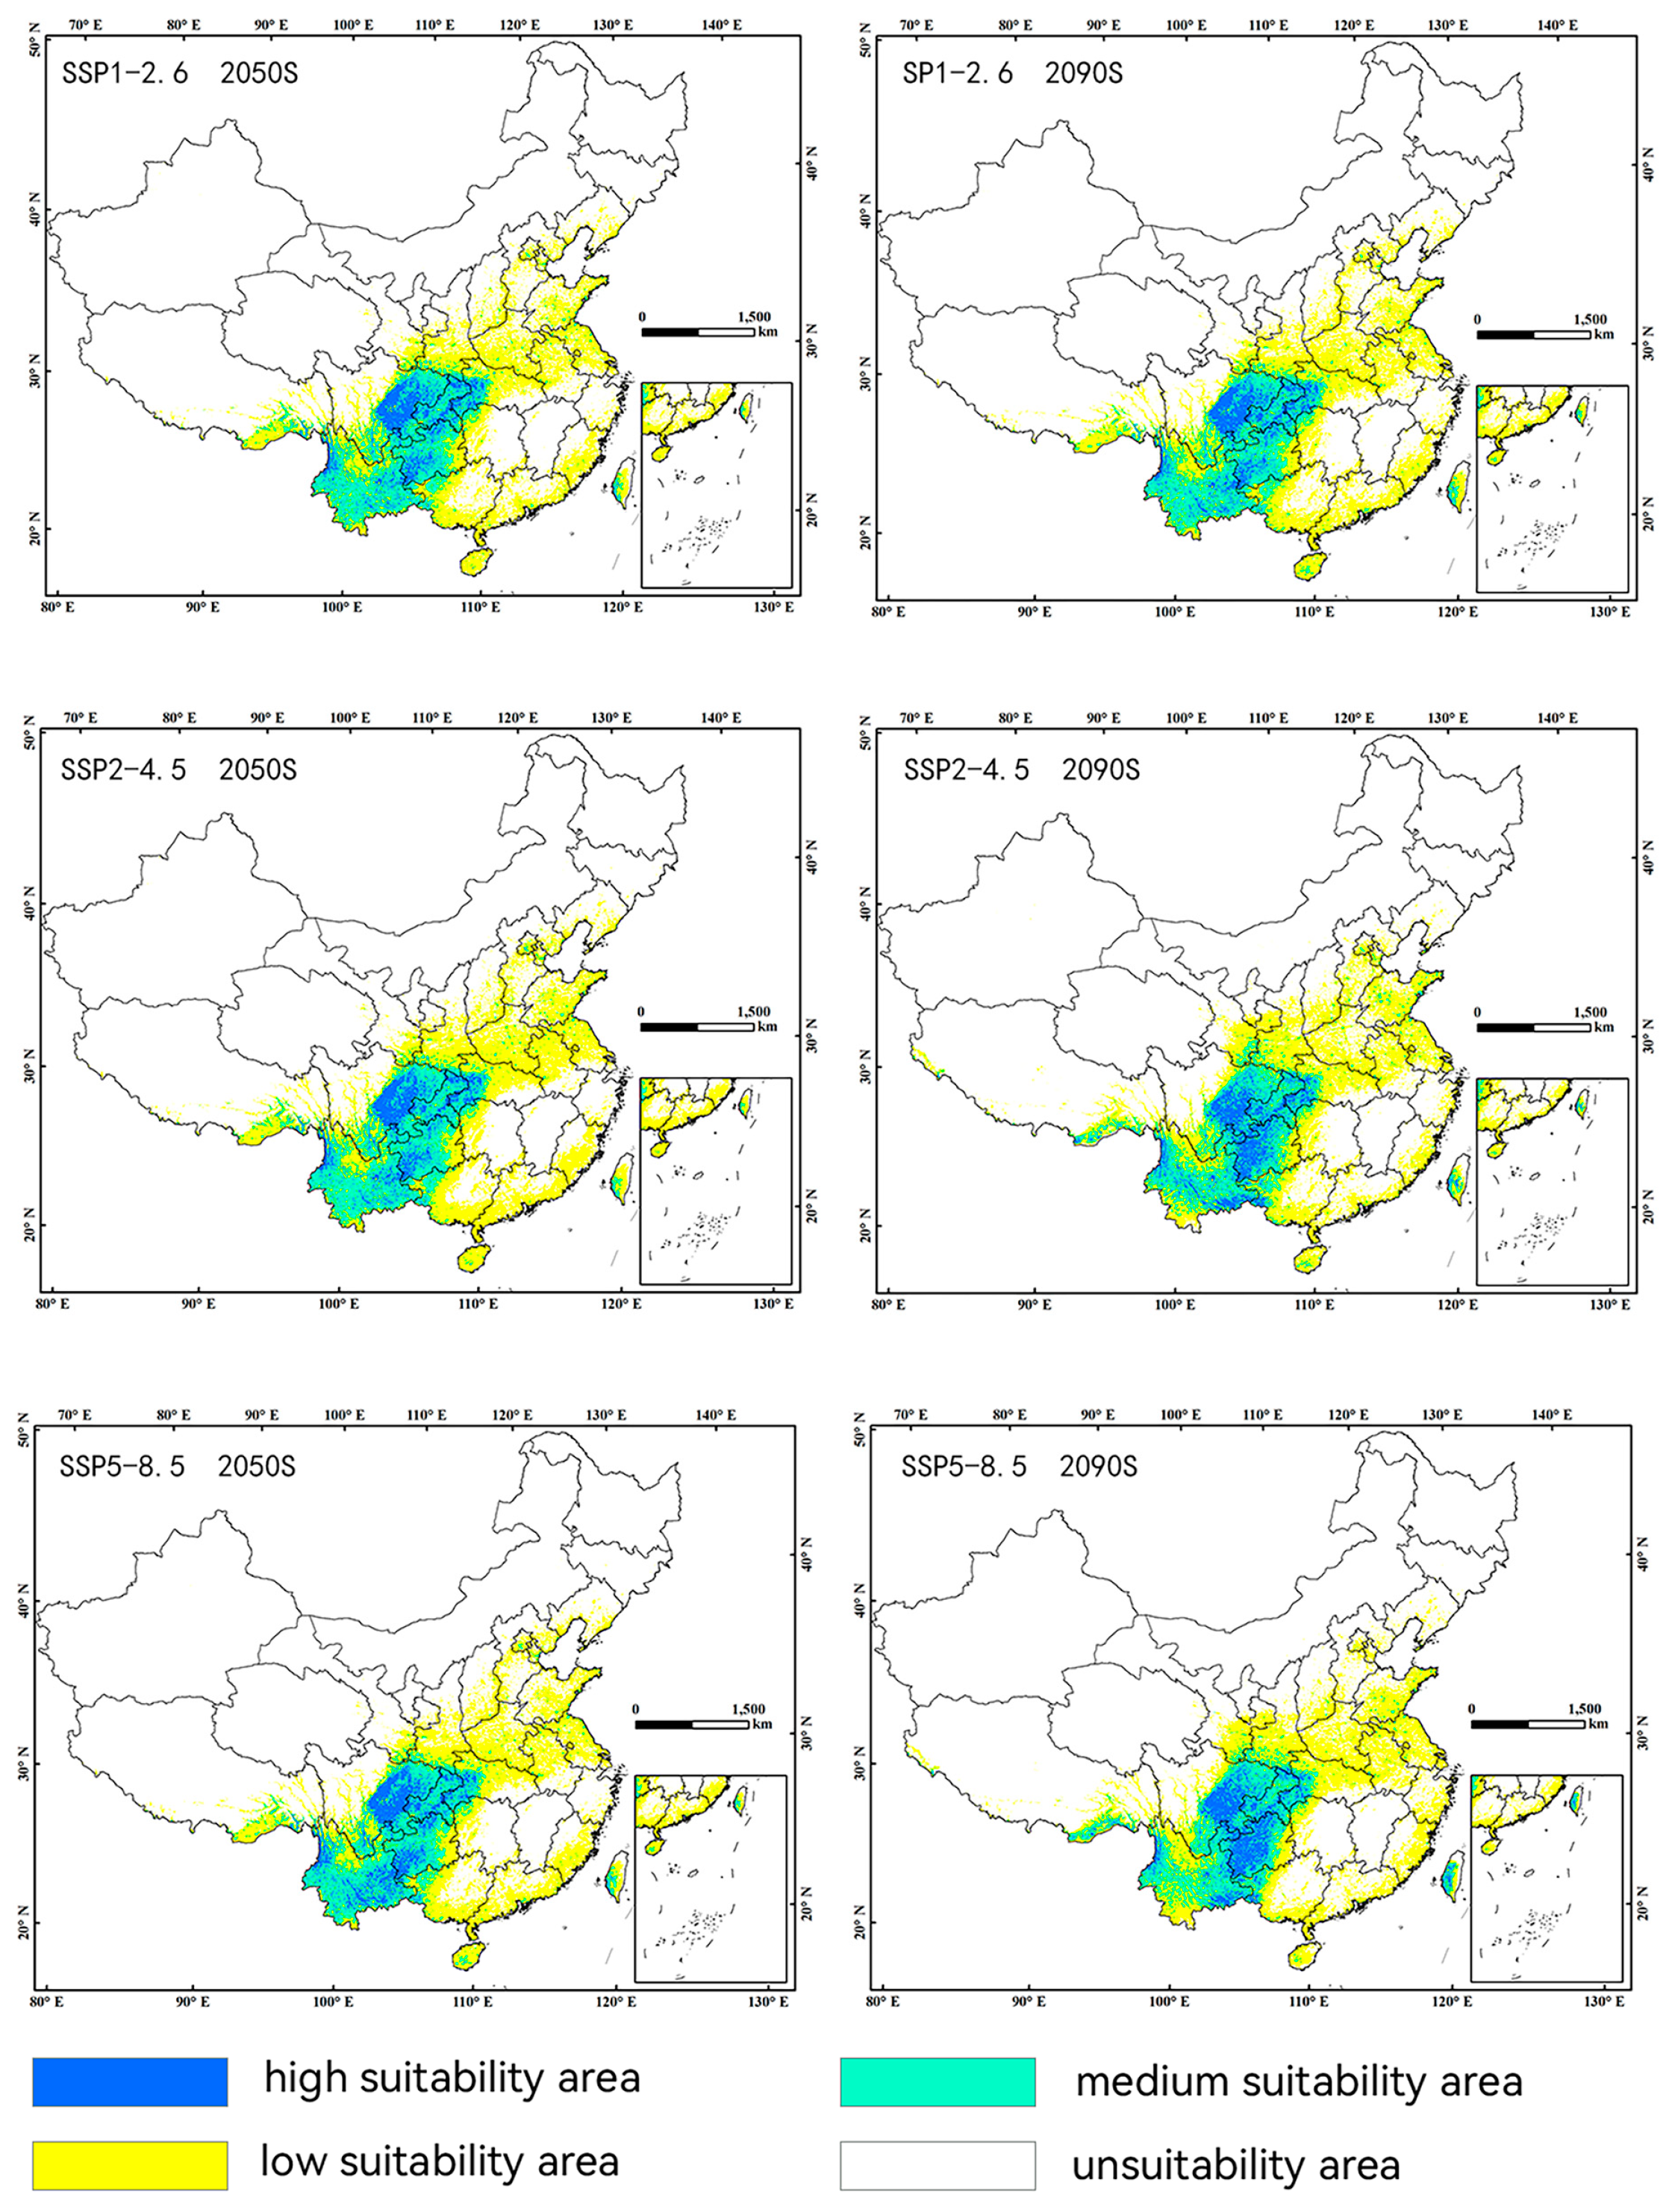
| Province | High Suitable Area (104 km2) | Medium Suitable Area (104 km2) | Low Suitable Area (104 km2) | Percentage of High Suitable Areas in Province (%) | Percentage of Suitable Areas in Province (%) |
|---|---|---|---|---|---|
| Sichuan | 9.07 | 10.40 | 7.36 | 19.93 | 58.94 |
| Yunnan | 3.55 | 22.63 | 7.73 | 10.34 | 98.88 |
| Guizhou | 2.79 | 9.32 | 3.80 | 17.47 | 99.66 |
| Chongqing | 2.25 | 4.92 | 0.56 | 29.13 | 100.00 |
| Hubei | 1.60 | 3.24 | 7.75 | 9.12 | 71.74 |
| Xinjiang | 0.48 | 1.90 | 6.64 | 0.42 | 7.90 |
| Guangxi | 0.13 | 2.43 | 10.08 | 0.62 | 60.42 |
| Shanxi | 0.10 | 1.61 | 8.93 | 0.49 | 52.22 |
| Taiwan | 0.04 | 0.45 | 1.53 | 1.27 | 64.02 |
| Hunan | 0.02 | 0.66 | 5.11 | 0.13 | 29.91 |
| Gansu | 0.02 | 0.36 | 3.66 | 0.05 | 9.74 |
| Shandong | 0.01 | 0.34 | 6.43 | 0.07 | 44.24 |
| Hainan | 0.01 | 0.11 | 2.40 | 0.19 | 92.89 |
| Jiangsu | 0.00 | 0.17 | 5.38 | 0.04 | 57.60 |
| Guangdong | 0.00 | 0.13 | 7.89 | 0.01 | 52.48 |
| Henan | 0.00 | 0.29 | 9.97 | 0.01 | 63.63 |
| Tianjin | 0.00 | 0.06 | 0.47 | 0.14 | 43.73 |
| Anhui | 0.00 | 0.13 | 5.25 | 0.00 | 40.28 |
| Beijing | 0.00 | 0.07 | 0.67 | 0.00 | 42.64 |
| Fujian | 0.00 | 0.02 | 4.60 | 0.00 | 42.75 |
| Hebei | 0.00 | 0.07 | 2.87 | 0.00 | 14.97 |
| Heilongjiang | 0.00 | 0.00 | 0.00 | 0.00 | 0.01 |
| Jilin | 0.00 | 0.00 | 0.05 | 0.00 | 0.24 |
| Jiangxi | 0.00 | 0.00 | 0.27 | 0.00 | 1.80 |
| Liaoning | 0.00 | 0.05 | 1.65 | 0.00 | 10.90 |
| Inner Mongolia | 0.00 | 0.00 | 0.02 | 0.00 | 0.02 |
| Ningxia | 0.00 | 0.00 | 0.06 | 0.00 | 1.09 |
| Qinghai | 0.00 | 0.00 | 0.13 | 0.00 | 0.18 |
| Shaanxi | 0.00 | 0.08 | 3.77 | 0.00 | 24.12 |
| Shanghai | 0.00 | 0.00 | 0.26 | 0.00 | 44.48 |
| Xizang | 0.00 | 0.00 | 0.01 | 0.00 | 0.00 |
| Zhejiang | 0.00 | 0.00 | 1.01 | 0.00 | 10.88 |
| China | 20.08 | 59.45 | 116.32 | 39.33 | 20.85 |
| Predicted Area (104 km2) | Comparison with Current Distribution (%) | ||||||
|---|---|---|---|---|---|---|---|
| Decade | Scenarios | High Suitable | Medium Suitable | Low Suitable | High Suitable | Medium Suitable | Low Suitable |
| Current | - | 20.08 | 59.45 | 116.32 | - | - | - |
| 2050s | SSP1-2.6 | 21.79 | 54.29 | 122.98 | 8.51 | −8.68 | 5.72 |
| SSP2-4.5 | 21.33 | 56.83 | 133.35 | 6.21 | −4.40 | 14.63 | |
| SSP5-8.5 | 25.21 | 53.19 | 123.66 | 25.52 | −10.53 | 6.30 | |
| 2090s | SSP1-2.6 | 22.00 | 54.08 | 127.50 | 9.53 | −9.04 | 9.60 |
| SSP2-4.5 | 24.97 | 49.94 | 128.63 | 24.34 | −15.99 | 10.58 | |
| SSP5-8.5 | 26.06 | 48.99 | 128.36 | 29.74 | −17.60 | 10.35 | |
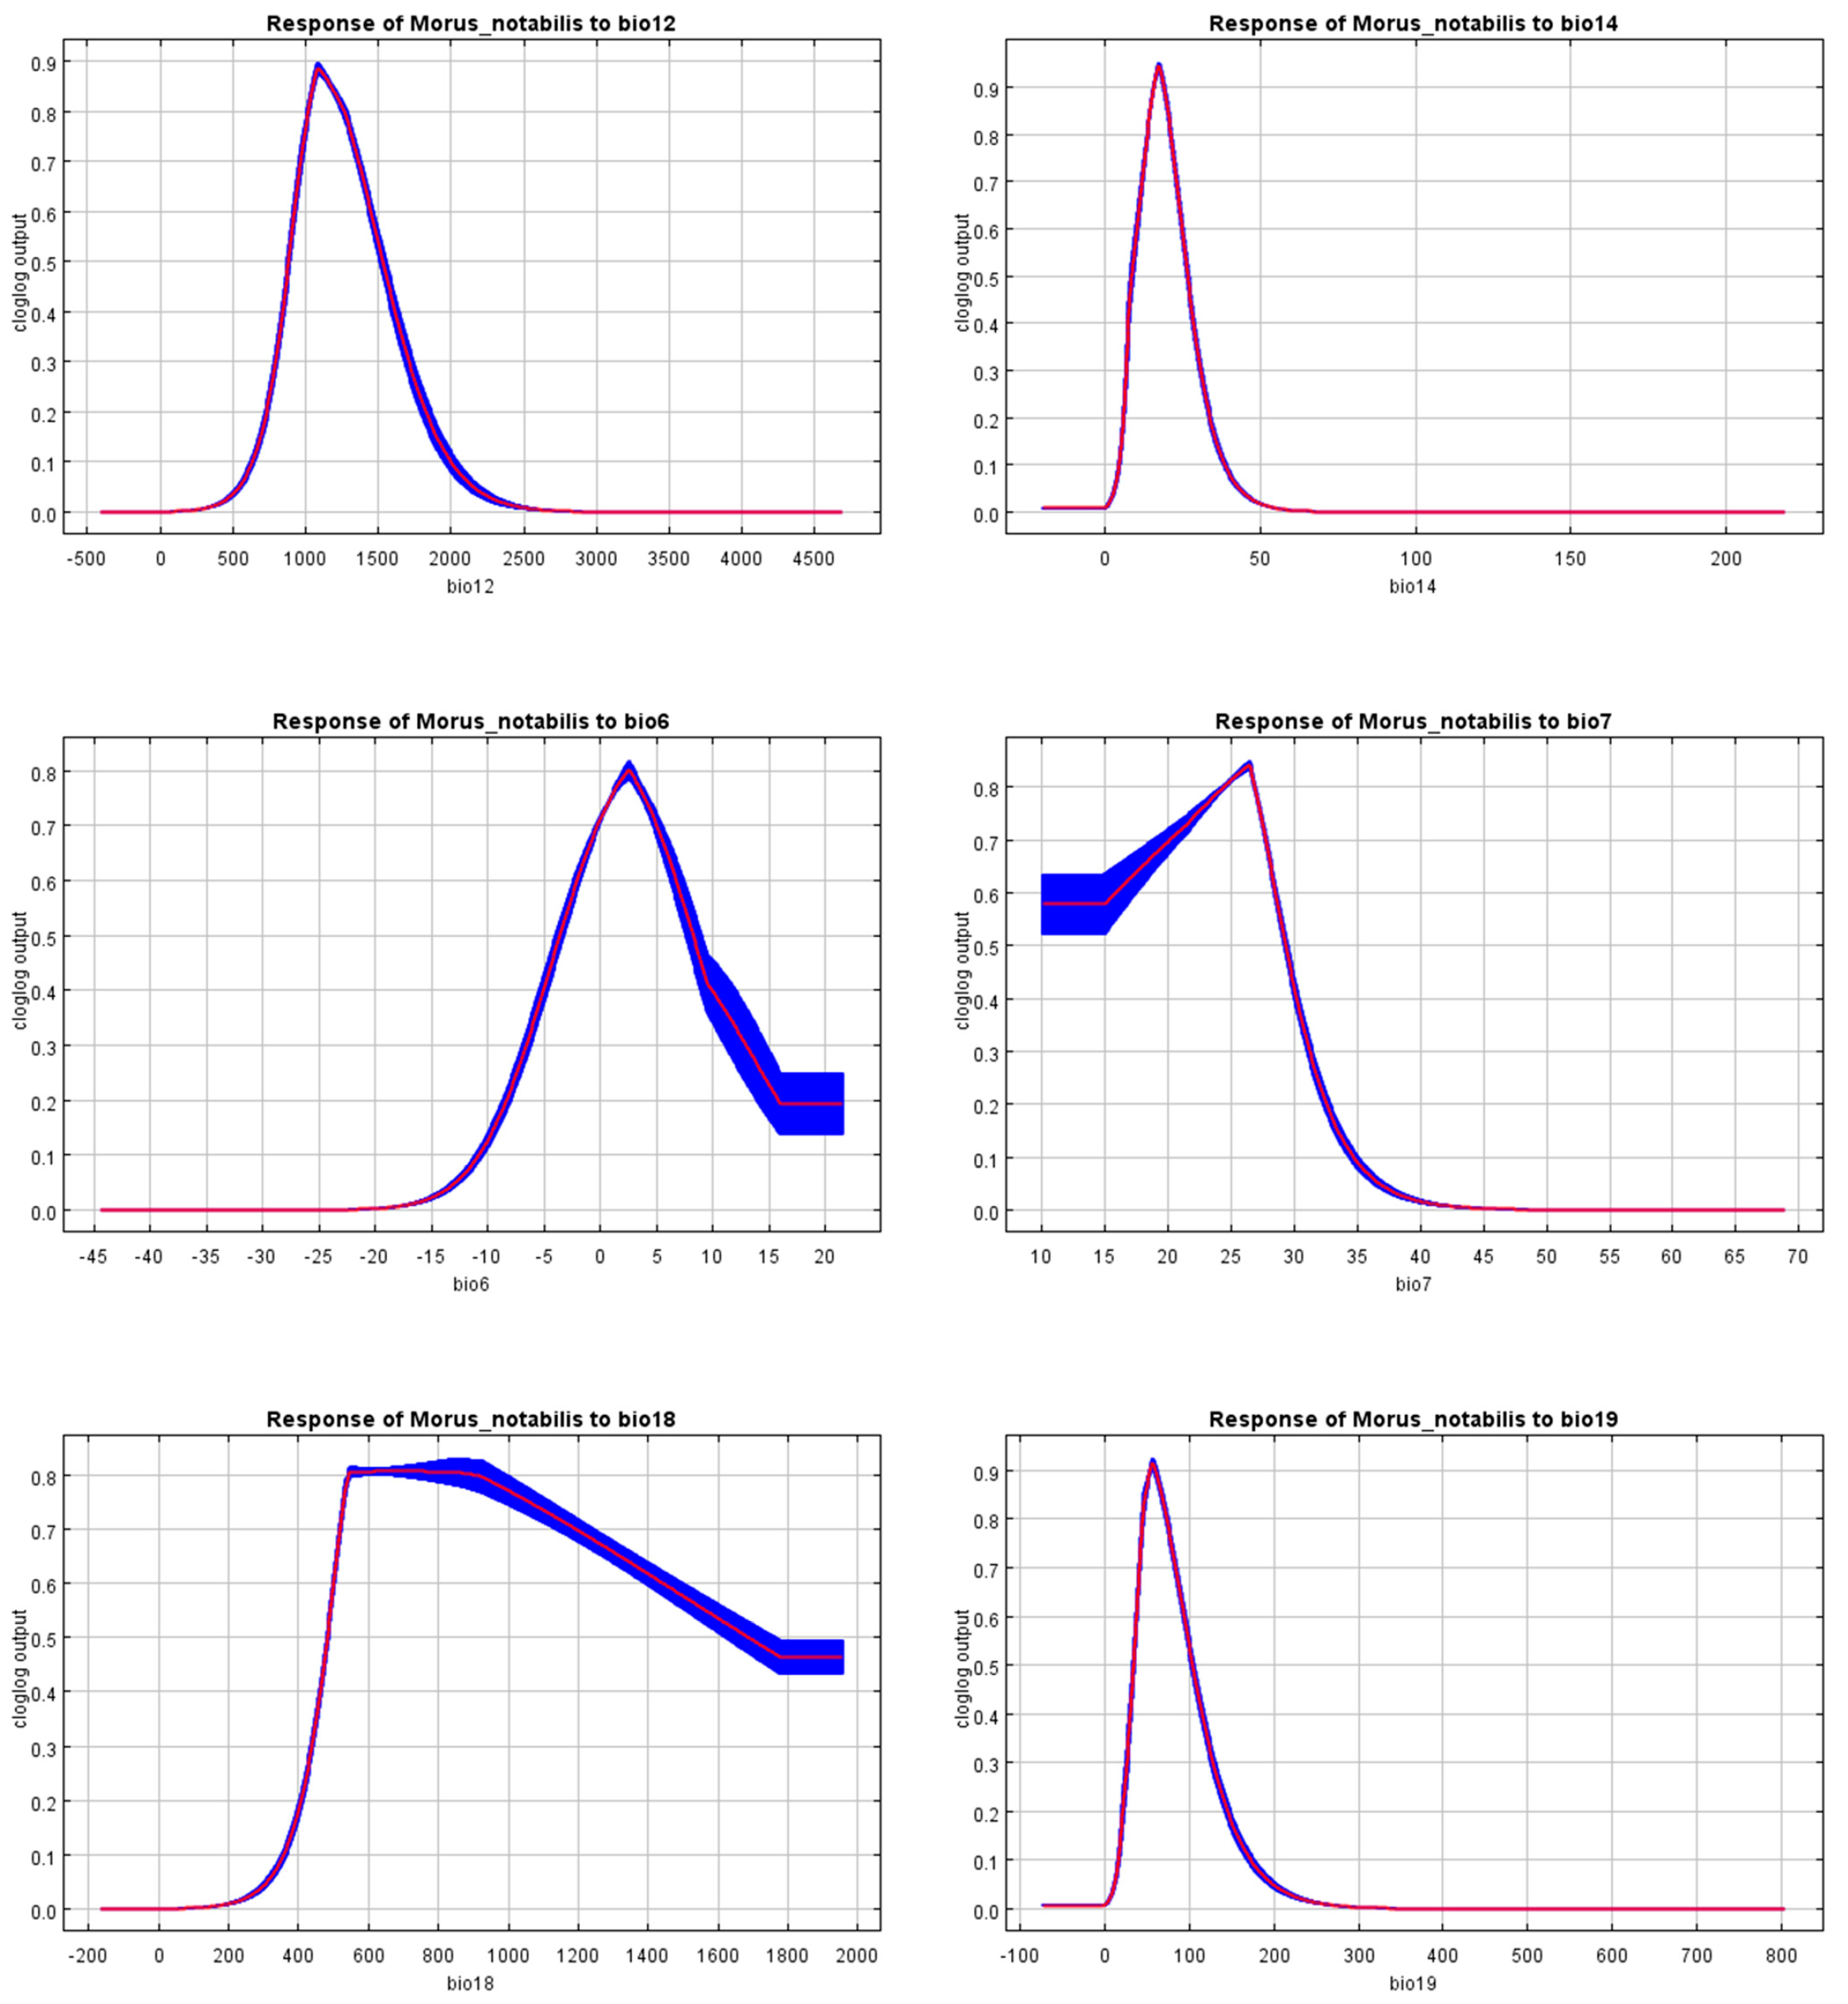
| Environmental Variables | Unit | Suitable Range | Optimum Value |
|---|---|---|---|
| Annual Precipitation (bio12) | mm | 824.15–1682.20 | 1088.98 |
| Precipitation of Driest Month (bio14) | Mm | 6.94–30.27 | 17.37 |
| Min Temperature of Coldest Month (bio6) | °C | −6.05–12.05 | 2.58 |
| Temperature Annual Range (bio5–bio6) (bio7) | °C | 10.00–31.02 | 26.50 |
| Precipitation of Warmest Quarter (bio18) | Mm | 448.09–1955 | 761.12 |
| Precipitation of Coldest Quarter (bio19) | mm | 27.53–124.09 | 56.68 |
Disclaimer/Publisher’s Note: The statements, opinions and data contained in all publications are solely those of the individual author(s) and contributor(s) and not of MDPI and/or the editor(s). MDPI and/or the editor(s) disclaim responsibility for any injury to people or property resulting from any ideas, methods, instructions or products referred to in the content. |
© 2024 by the authors. Licensee MDPI, Basel, Switzerland. This article is an open access article distributed under the terms and conditions of the Creative Commons Attribution (CC BY) license (https://creativecommons.org/licenses/by/4.0/).
Share and Cite
Gao, H.; Qian, Q.; Deng, X.; Peng, Y.; Xu, D. Predicting the Distributions of Morus notabilis C. K. Schneid under Climate Change in China. Forests 2024, 15, 352. https://doi.org/10.3390/f15020352
Gao H, Qian Q, Deng X, Peng Y, Xu D. Predicting the Distributions of Morus notabilis C. K. Schneid under Climate Change in China. Forests. 2024; 15(2):352. https://doi.org/10.3390/f15020352
Chicago/Turabian StyleGao, Hui, Qianqian Qian, Xinqi Deng, Yaqin Peng, and Danping Xu. 2024. "Predicting the Distributions of Morus notabilis C. K. Schneid under Climate Change in China" Forests 15, no. 2: 352. https://doi.org/10.3390/f15020352
APA StyleGao, H., Qian, Q., Deng, X., Peng, Y., & Xu, D. (2024). Predicting the Distributions of Morus notabilis C. K. Schneid under Climate Change in China. Forests, 15(2), 352. https://doi.org/10.3390/f15020352


