
Spatial-Temporal Evolution Characteristics and Driving Force Analysis of NDVI in Hubei Province, China, from 2000 to 2022
1
College of Resources and Environment, Yangtze University, Wuhan 430100, China
2
China Yangtze River Power Co., Ltd., Yichang 443000, China
3
Hubei Key Laboratory of Intelligent Yangtze River and Hydropower Science, Yichang 443000, China
*
Author to whom correspondence should be addressed.
Forests 2024, 15(4), 719; https://doi.org/10.3390/f15040719
Submission received: 26 February 2024
/
Revised: 12 April 2024
/
Accepted: 17 April 2024
/
Published: 19 April 2024
(This article belongs to the Topic Advances in Multi-Scale Geographic Environmental Monitoring: Theory, Methodology and Applications)
Abstract
:Exploring the characteristics of vegetation dynamics and quantitatively analyzing the potential drivers and the strength of their interactions are of great significance to regional ecological environmental protection and sustainable development. Therefore, based on the 2000–2022 MODIS NDVI dataset, supplemented by climatic, topographic, surface cover, and anthropogenic data for the same period, the Sen+Mann–Kendall trend analysis, coefficient of variation, and Hurst exponent were employed to examine the spatial and temporal characteristics and trends of NDVI in Hubei Province, and a partial correlation analysis and geographical detector were used to explore the strength of the influence of driving factors on the spatial differentiation of NDVI in vegetation and the underlying mechanisms of interaction. The results showed that (1) the mean NDVI value of vegetation in Hubei Province was 0.762 over 23 years, with an overall increasing trend and fluctuating upward at a rate of 0.01/10a (p < 0.005); geospatially, there is a pattern of “low east and high west”; the spatial change in NDVI shows a trend of “large-scale improvement in the surrounding hills and mountains and small-scale degradation in the middle plains”; it also presents the spatial fluctuation characteristics of “uniform distribution in general, an obvious difference between urban and rural areas, and a high fluctuation of rivers and reservoirs”, (2) the future trend of NDVI in 70.76% of the region in Hubei Province is likely to maintain the same trend as that of the 2000–2022 period, with 70.78% of the future development being benign and dominated by sustained improvement, and (3) a combination of partial correlation analysis and geographical detector analysis of the drivers of vegetation NDVI change shows that land cover type and soil type are the main drivers; the interactions affecting the distribution and change characteristics of NDVI vegetation all showed two-factor enhancement or nonlinear enhancement relationships. This study contributes to a better understanding of the change mechanisms in vegetation NDVI in Hubei Province, providing support for differentiated ecological protection and project implementation.
1. Introduction
Vegetation, as an important indicator of the ecological sustainability of a biosphere, plays an important role in the material cycle, energy flow, and information transfer in terrestrial ecosystems [1]. Changes in vegetation cover reflect not only changes in the ecosystem itself but also the impact of natural factors and human activities on the ecological environment [2,3]. Therefore, monitoring vegetation dynamics has also become one of the topical issues of continuing interest in regional change research. Normalized Difference Vegetation Index (NDVI) has the advantages of clear physical meaning, elimination of radiometric errors, and strong responsiveness to vegetation. It has been widely used as an indicator to characterize the vegetation cover of the ground surface in the fields of vegetation pattern change, vegetation productivity estimation, and ecological effectiveness assessment [4,5].
A large number of scholars have conducted numerous studies on the spatial and temporal changes in vegetation and their drivers in different study areas using different scales of NDVI. The characterization of spatial and temporal changes in vegetation uses a one-way linear regression analysis [6], Sen+Mann–Kendall trend analysis [7], coefficient of variation [8], and Hurst exponent [9]. Based on datasets, such as climate, topography, and human activities, partial correlation analysis [10], principal component regression [11], geographical detector [12], multiple regression residual analysis [13], and redundancy analysis variance decomposition [14] were used, exploring the driving mechanisms of vegetation change. NDVI is affected by human activities, and the urban heat island (UHI) is strongly negatively correlated with NDVI and strongly positively correlated with NDBI [15]. NDVI is utilized to study the response of vegetation and plants to environmental changes, and vegetation is affected by both natural factors and human activities, where the natural factors of climate and topography are closely related to the growth and distribution of vegetation [16]. In recent decades, the magnitude of NDVI changes in China has been decreasing from high to low latitudes [17], and temperature, precipitation, and solar radiation are the main climatic factors affecting NDVI changes [18].
Hubei Province is situated in the transitional zone from the second to the third topographical tier in China and is located in the middle reaches of the Yangtze River, which includes diverse vegetation types, such as forests, grasslands, and wetlands. The implementation of ecological projects, such as returning farmland to forests and soil and water conservation in Hubei Province, has effectively improved the ecological condition of the land, making Hubei Province a provincial area with significant vegetation recovery. At present, the research on the vegetation of Hubei Province has made some progress. Based on the analysis of summer MODIS vegetation NDVI trends in Hubei Province from 2005 to 2015, it was found that human socio-economic activities were important driving factors influencing the landscape pattern and vegetation changes in the study area, and the urbanization expansion in the study area was the main reason for the vegetation changes in Hubei Province [19]. In terms of natural influences, the correlation between the NDVI of the vegetation in Hubei Province and precipitation, elevation, and land-use type was more significant, and there was a hysteresis in the response of the vegetation growth to the precipitation [20].
Previous studies have considered elements such as climatic factors (precipitation [21] and temperature [22]) and elevation [23], or climatic factors and nighttime lighting [24], ignoring the systematic effects of soil type [25], land cover type [26,27], slope [28], aspect [29], and population density [30] on vegetation growth. It also focuses on qualitative discussions and fails to quantitatively separate the impacts of climate change, topographic conditions, land cover, and human activities on vegetation change; there have not been enough studies conducted on the sustainability and future trend of vegetation development in Hubei Province.
In view of this, this paper is based on annual maximized MODIS NDVI data for the years 2000–2022, combined with natural and anthropogenic factor datasets. Sen+Mann–Kendall trend analysis, coefficient of variation, and Hurst exponent analysis were used to investigate the spatial and temporal characteristics and trends of vegetation NDVI, and partial correlation analysis and geographical detector were used to quantitatively analyze the effects of natural and anthropogenic factors on the spatial variation in vegetation NDVI and quantitatively assess the relative roles of climate change and human activities in vegetation improvement and degradation under different scenarios in order to provide a scientific basis for the dynamic monitoring, management, and protection of vegetation in Hubei Province, which has an important application value for the development of reasonable ecological protection programs.
2. Materials and Methods
2.1. Study Area
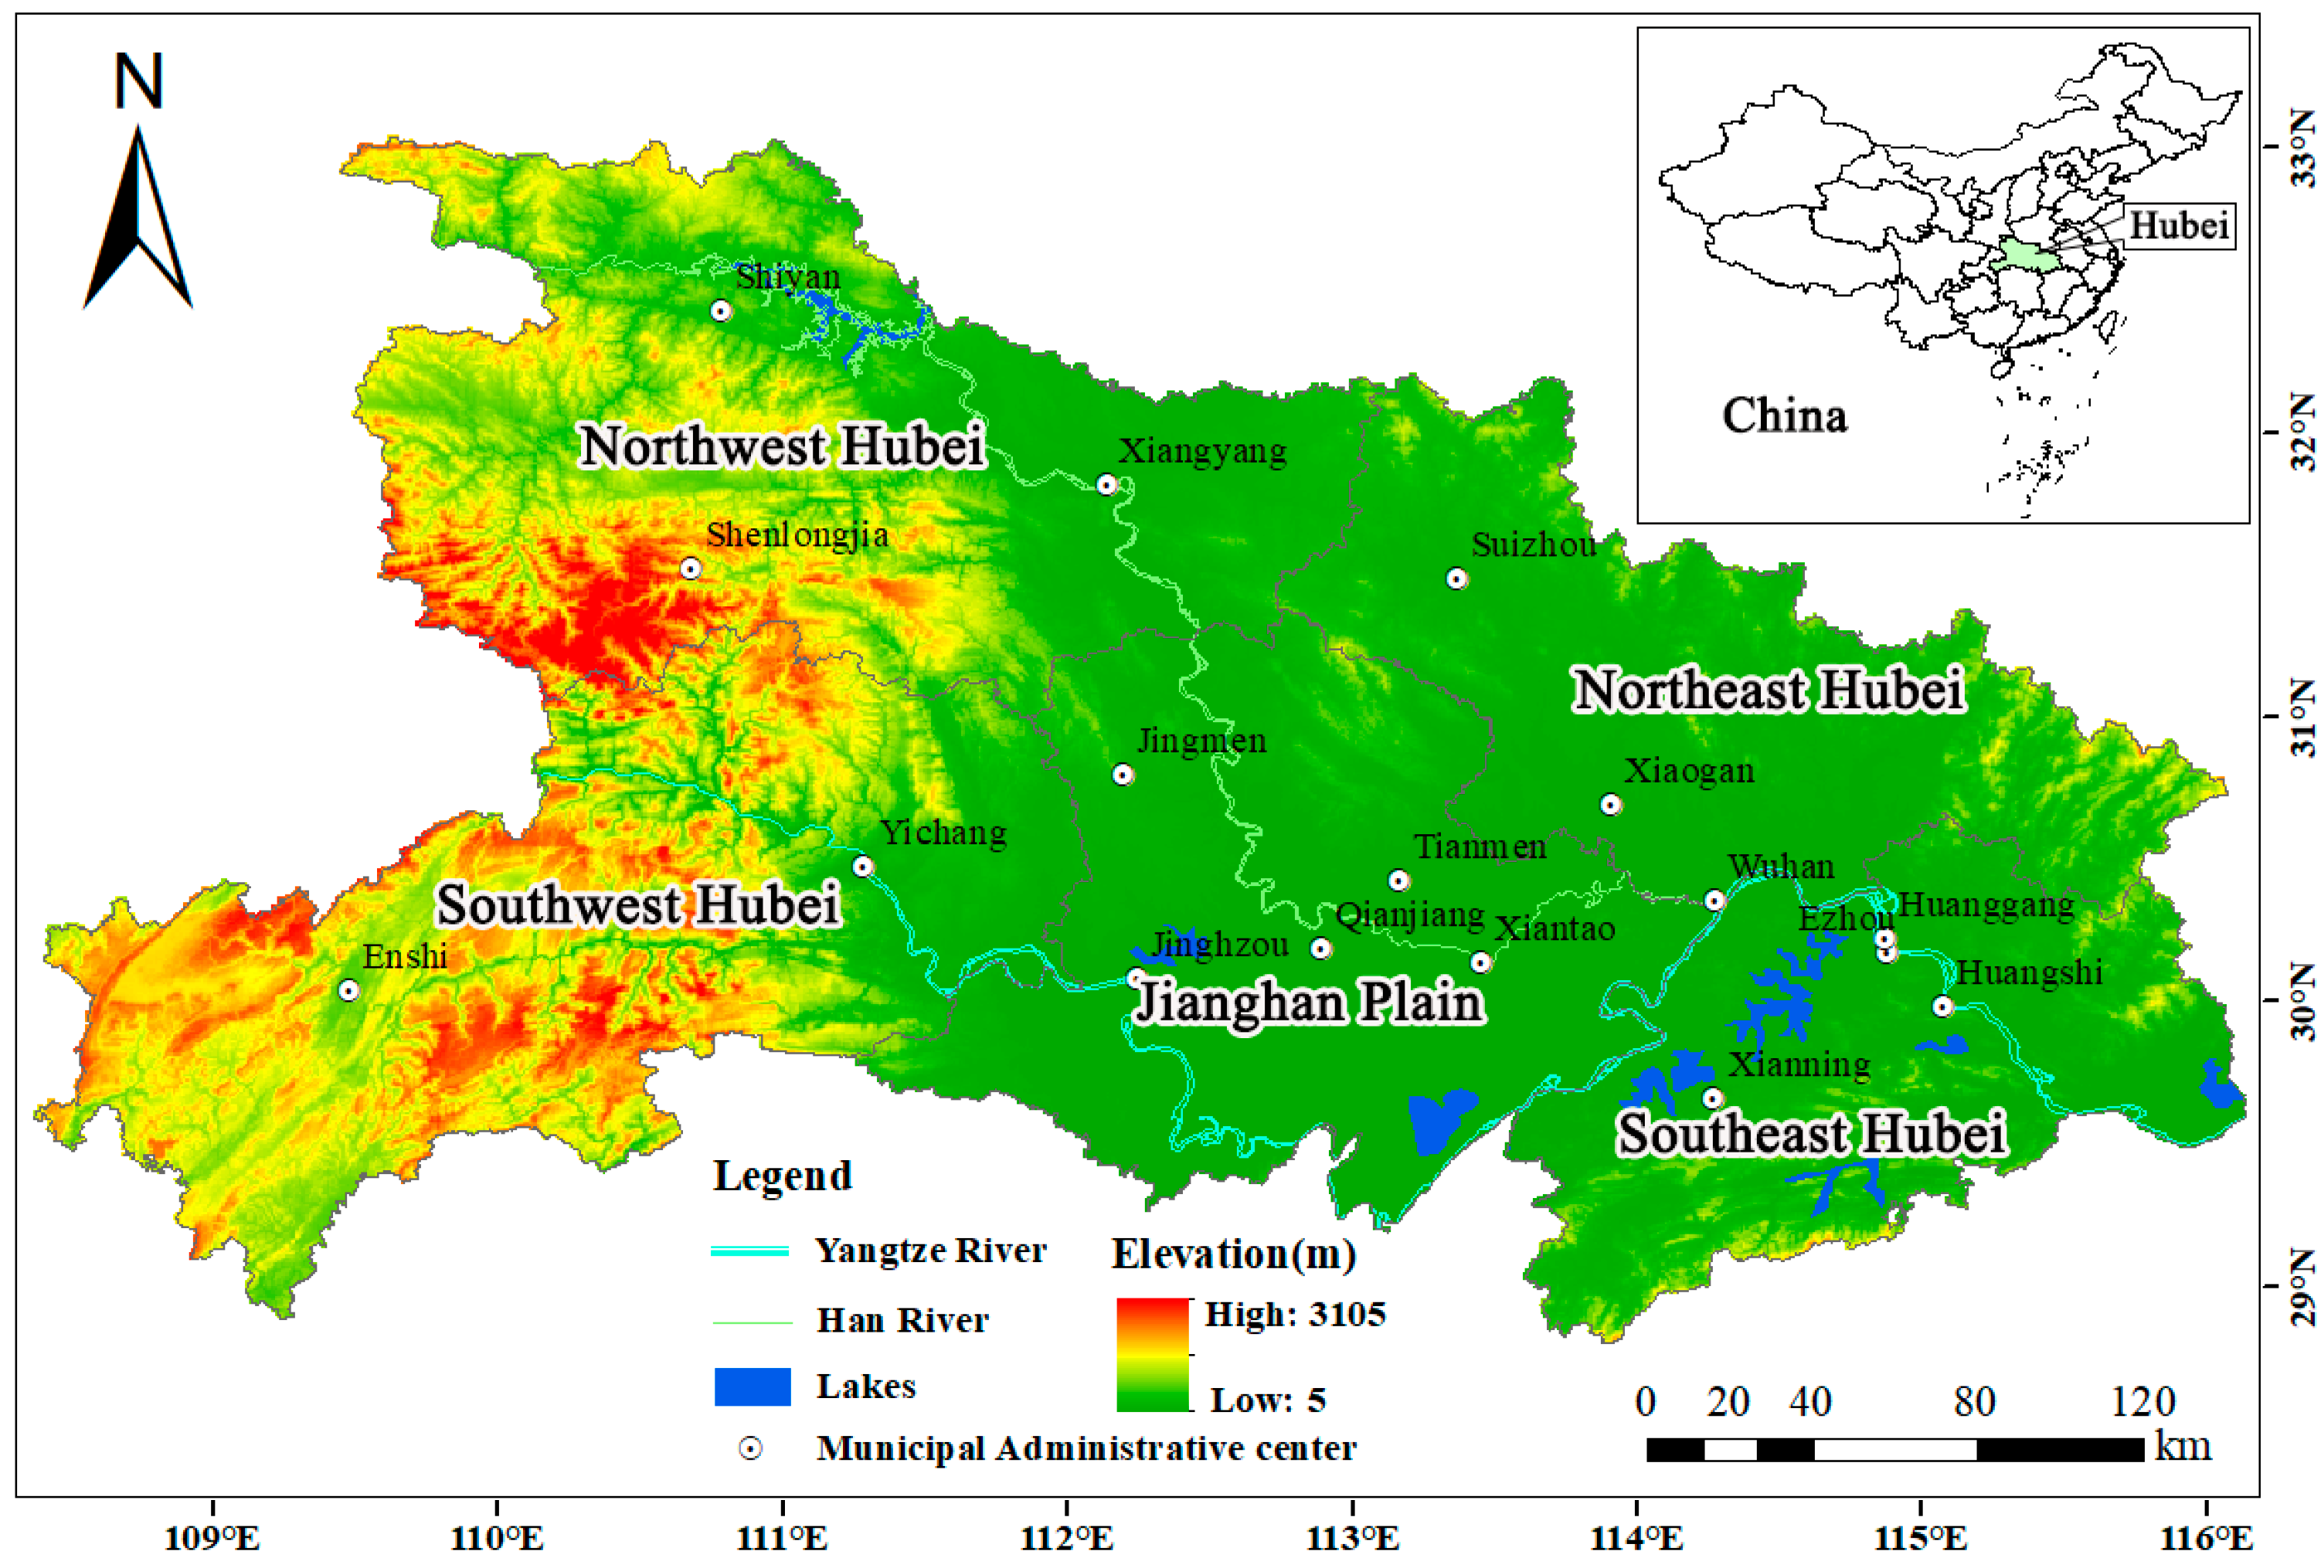
Hubei Province (29°05′–30°20′ N, 108°30′–116°20′ E, Figure 1) is located in the center of China and the core of the Yangtze River Economic Belt. The region is vast, with a land area of 185,000 km2, with mountains, hills and plains, and lakes accounting for 56%, 24%, and 20% of the total area, respectively [31]. The topography of Hubei Province varies greatly in height, with the terrain showing an incomplete basin area that is elevated on three sides, flat in the center, open to the south, and with a gap in the north [32]. Located in the north–south climate transition zone and belonging to the subtropical monsoon humid climate, there is rain and heat at the same time, it is cold in the winter and hot in the summer, and precipitation is mainly concentrated from June to July, with the average annual precipitation of 800 to 1600 mm and the average annual temperature of 15 to 22 °C [33]. The vertical distribution of natural vegetation is distinctive, rich in biological resources, characterized by the transition between the north and the south, with broad-leaved forests as the main type of vegetation, and at the same time, includes diversified vegetation types, such as coniferous forests, mixed forests, wetland forests, etc. It is in the transition zone between the east and the west of China’s flora and is one of the provinces in China that are richer in botanical resources. It has 32 national-level ecological civilization demonstration zones in China, four forest ecological stations, one bamboo forest ecological station and one wetland ecological station [34].
2.2. Data Sources
The data used in this study mainly include remote sensing data, climatic data, topographic data, surface cover data, and anthropogenic data (Table 1). The spatial rasterization of the data for each year was achieved using ArcGIS 10.8.2, with a resolution of 1 km after projection transformation, study area boundary masking, and resampling, and the projected coordinate system was the UTM projection. In modeling the geographical detector, NDVI was used as the Y variable and the 10 factors data as the X variable for detection. The NDVIs in this paper, unless otherwise noted, are annual NDVIs synthesized using the maximum value composites (MVCs) method.
2.3. Research Methods
2.3.1. Sen+Mann–Kendall Significance Tests
The Theil–Sen Median method, also known as the Sen slope estimation, is a nonparametric statistical method for trend calculation, which has become an important method for judging the characteristics of changes in long time series of vegetation, hydrology, climate, etc. data, because of its high computational efficiency and insensitivity to outliers, which is more robust than Slope analysis [40]. The formula is as follows:
where and are the data for the year i or j in the NDVI time series; median indicates the median value. is the median value of the slopes of all pairs of data, and when β > 0, it reflects an increasing trend of NDVI in this time series; on the contrary, it is a decreasing trend. The significance of the trend was tested by the Mann–Kendall method. The formula is
with:
where Z is the standardized test statistic; S is the test statistic; VAR(S) is the variance; sgn is the sign function; and are the sample time series data; and n is the number of data in the time series. The hypothesis is tested using a bilateral trend test, where the original hypothesis is rejected and the trend is considered significant when |Z| > Z1−α/2 at a given significance level α. Z1−α/2 is the value corresponding to the distribution table of the standard normal distribution function at the confidence level α. At |Z| ≥ 2.58, |Z| ≥ 1.96 indicates that the trend passes the significance test with 99% and 95% confidence levels, which are highly significant and significant, respectively, and |Z| < 1.96 indicates that the trend is not significant.
2.3.2. Stability Analysis
The coefficient of variation, also known as the standard deviation rate or unit risk, is used to reflect the degree of dispersion of the data and can be calculated as the relative degree of fluctuation in the spatial and temporal distributions of geographic elements. The larger the value obtained from the calculation indicates that the data series are more dispersed. Refer to reference [42] for the specific calculation method. Combined with the results of previous research [43], the coefficient of variation was categorized into five classes from low to high: low volatility change (Cv ≤ 0.05), relatively low volatility change (0.05 < Cv ≤ 0.10), medium volatility change (0.10 < Cv ≤ 0.15), relatively high volatility change (0.15 < Cv ≤ 0.20), and high volatility change (Cv > 0.20).
2.3.3. Future Variation Trend
The Hurst exponent is a research method based on the calculation of R/S re-scaled extreme variance analysis, proposed by the British scholar Hurst [44], which can effectively and quantitatively describe the sustainability of the time series and forecast its future evolution trend. The process of its calculation methodology is as follows.
For the time series NDVIt, t = 1, 2, 3 … n, defines its mean series:
Cumulative deviation calculation:
Polar deviation calculation:
Standard deviation calculation:
Hurst exponent calculation:
A straight line was fitted to obtain the Hurst exponent:
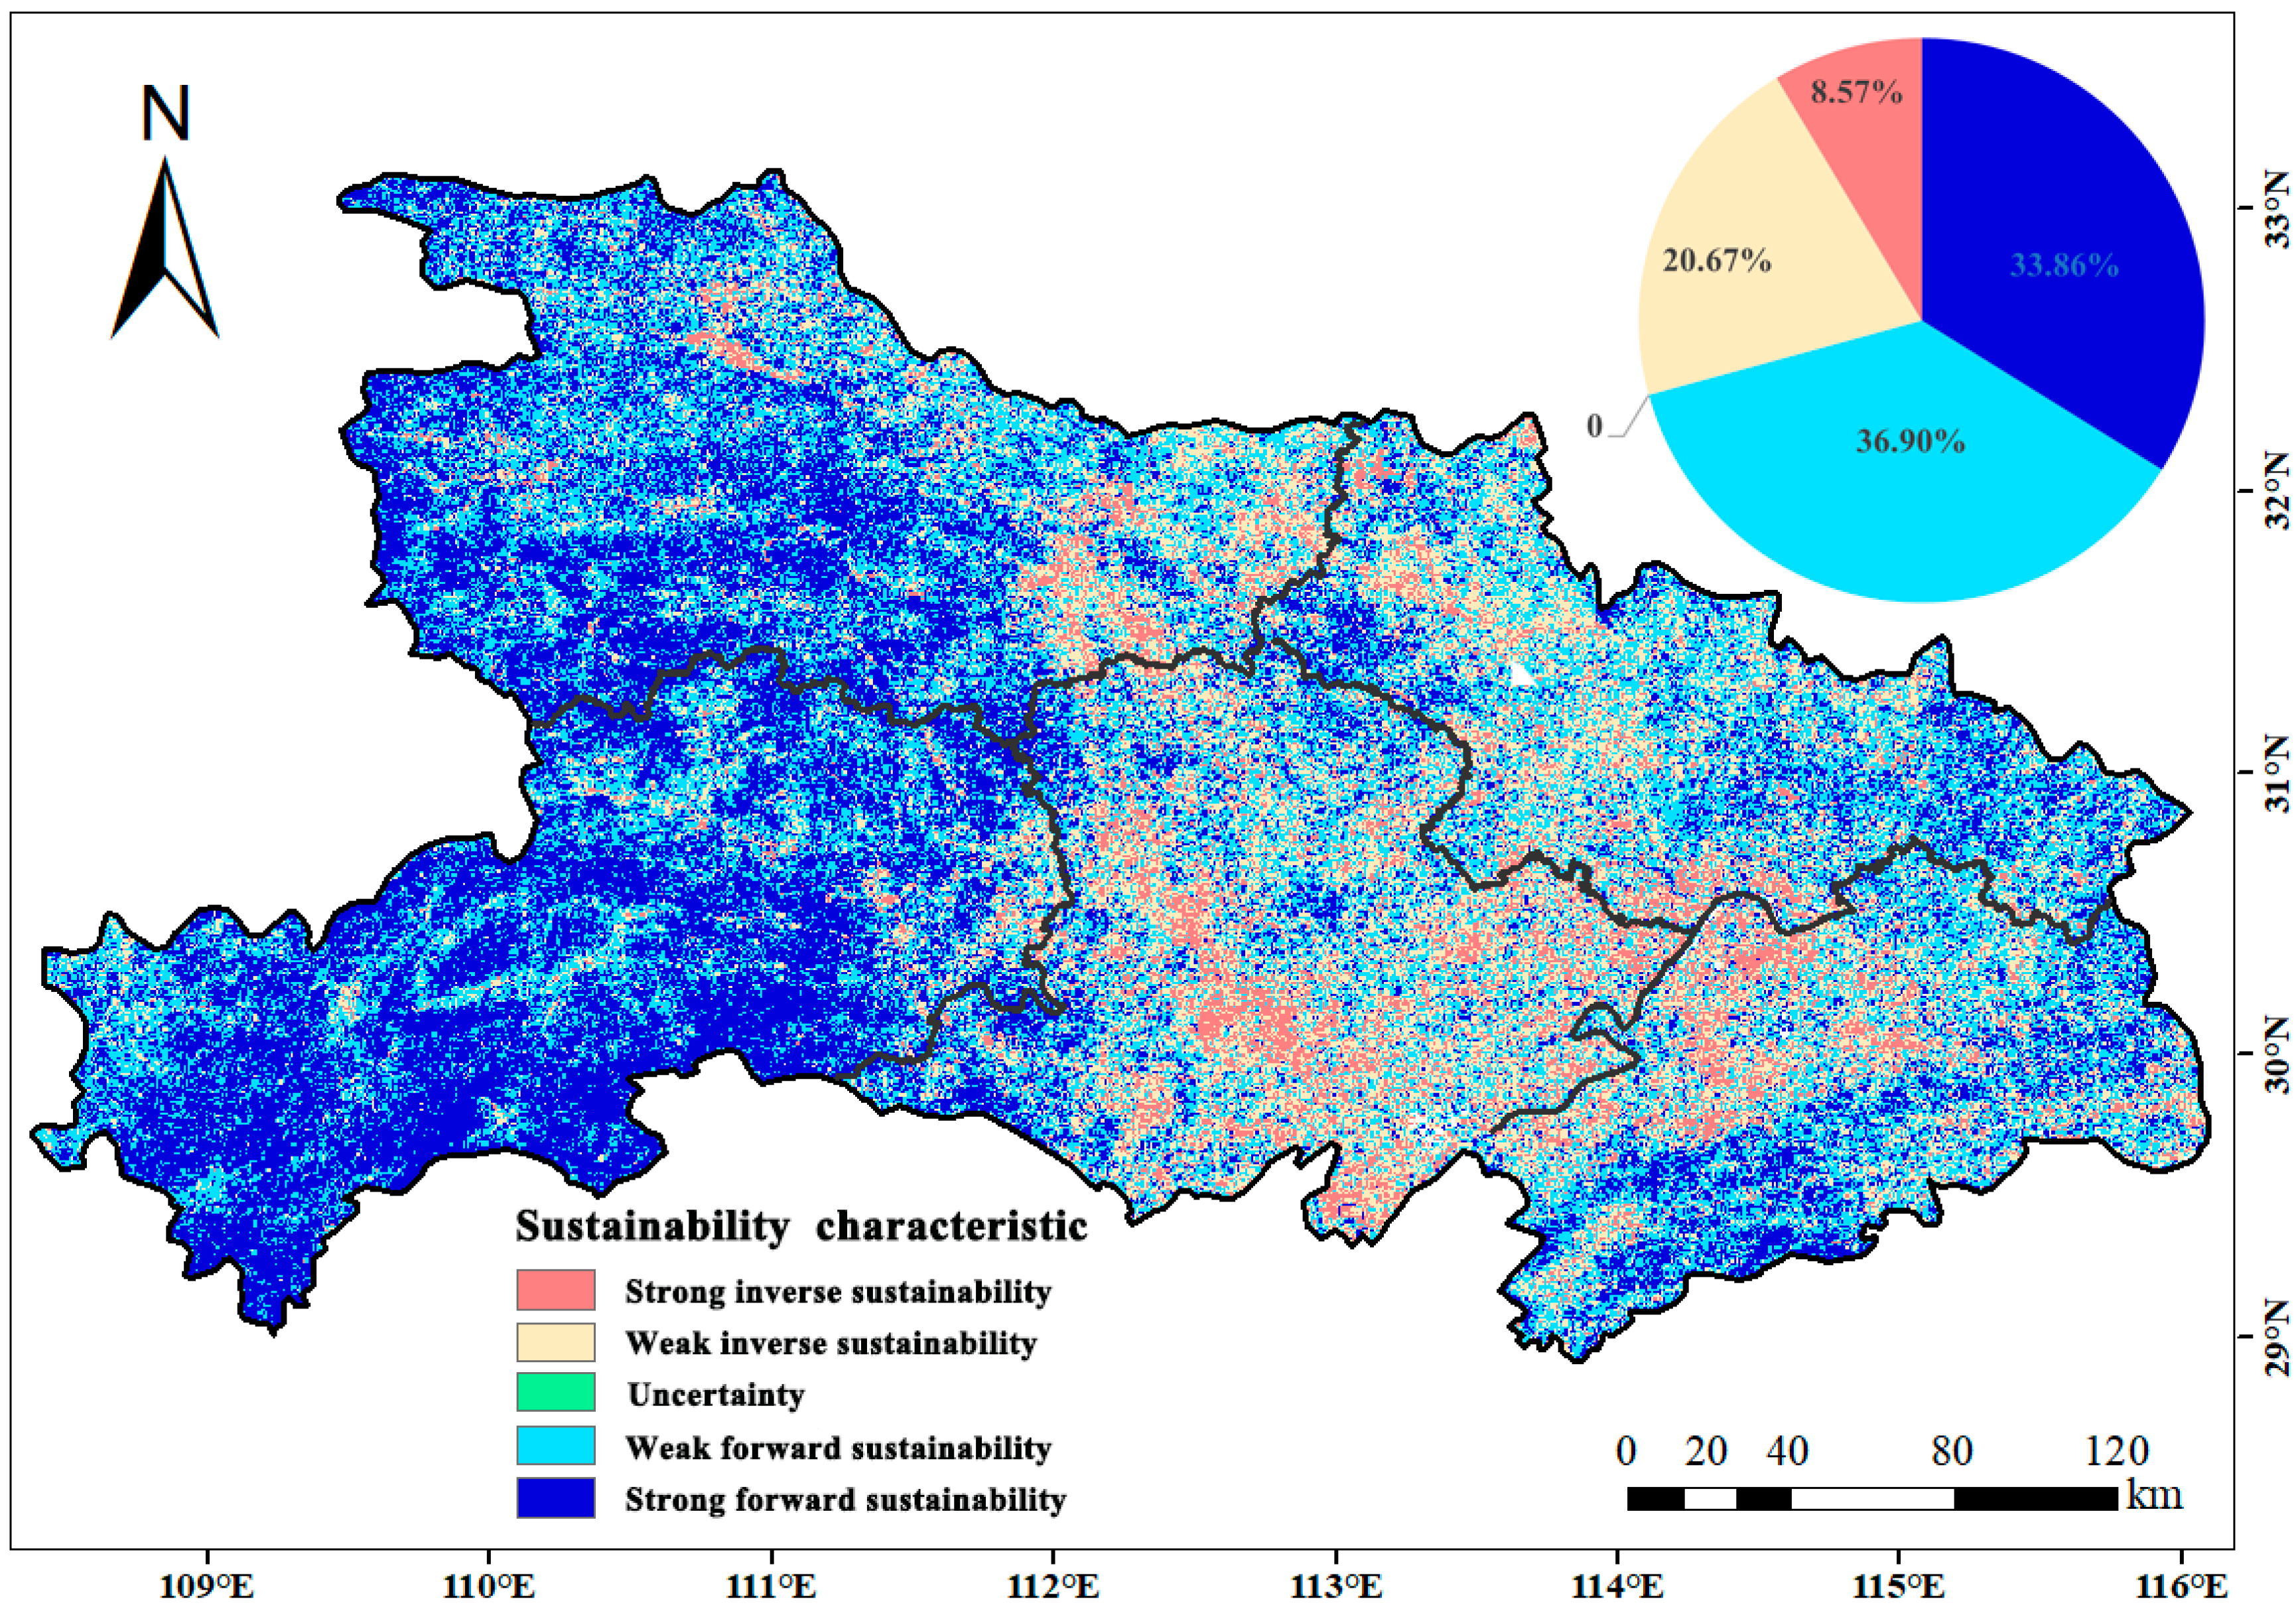
where c is the relationship constant, H is the Hurst exponent, and a is the intercept. The Hurst exponent ranges from 0 to 1. When 0 ≤ H < 0.4, it indicates that the future has strong inverse sustainability with the past. The closer H is to 0, the stronger the inverse is; when 0.4 ≤ H < 0.5, it indicates that the future has weak inverse sustainability with the past; when H = 0.5, it indicates that the time series change is random; when 0.5 < H ≤ 0.6, it indicates that the future change trend is the same as the past, weak forward sustainability; and when 0.6 < H ≤ 1, it indicates that the future trend of change is the same as the past, with strong forward sustainability, and the closer the value of H is to 1, the stronger the sustainability is [45]. Coupling and superimposing the NDVI trend results with the Hurst exponent results can be used to analyze the future trend of vegetation.
2.3.4. Partial Correlation Analysis
There are many factors influencing vegetation cover, and changes in any one of these influences may affect changes in another [5,46]. With the help of first and second-order partial correlation analyses, the correlation between a single variable and vegetation NDVI was characterized by controlling for the effects of other variables. Its second-order partial correlation analytical expression is (first-order identically):
where is the second-order partial correlation coefficient of x and y after the control variables z and λ; > 0 is positively correlated; and < 0 is negatively correlated. Second-order partial correlation analysis was used to study the degree of partial correlation of NDVI and mean annual temperature, total annual precipitation, and solar radiation, and first-order partial correlation analysis was used to study the NDVI and population density in this study. The second-order partial correlation analysis was used to study the degree of partial correlation between NDVI and population density, nighttime lighting. In addition, a t-test was used to test the significance of the partial correlation coefficients.
2.3.5. Geographical Detector Model
The geographical detector is an open-source statistical model for spatial data analysis (http://www.geodetector.cn/ accessed on 25 February 2024) that determines the similarity of spatial distributions of two variables through the lens of spatial hierarchical heterogeneity [47]. In this study, we selected the driving factors in Table 1 and analyzed the potential drivers of vegetation cover changes in Hubei Province using two modules of the geographical detector (factor detector and interaction detector). In addition, the continuous variables in the independent variables were discretized, and the continuous data were reclassified using the natural breakpoint method, which classified the land cover types into 9 categories, the soil types into 6 categories, and the rest of the continuous variables into 9 categories uniformly.
Factor Detector
The factor detector was used to test the extent to which each influencing factor explained the spatial heterogeneity of NDVI. A q-value metric was used. The calculation formula is as follows:
where q is the explanatory power of the metric factor on NDVI, with a value range of [0, 1], and larger values indicate stronger explanatory power of the factors and stronger influence on the spatial distribution of vegetation NDVI. The symbol h = 1, 2,… L is the classification or zoning of the dependent or independent variable, and N are the number of cells in stratum h and the whole region, respectively; and are the variance of NDVI in stratum h and the whole region, respectively; SSW and SST are the sum of the variance within the stratum and the total variance of the region, respectively [48].
Interaction Detector
This detector is used to identify the interaction between different factors, whether the drivers and , acting together, increase or decrease the explanatory power of vegetation NDVI or whether these drivers are independent of each other in their explanatory power of vegetation NDVI. The specific determination method is shown in Table 3.
3. Results
3.1. Spatiotemporal Variation Characteristics of the NDVI
3.1.1. Interannual Variation Characteristics of the NDVI
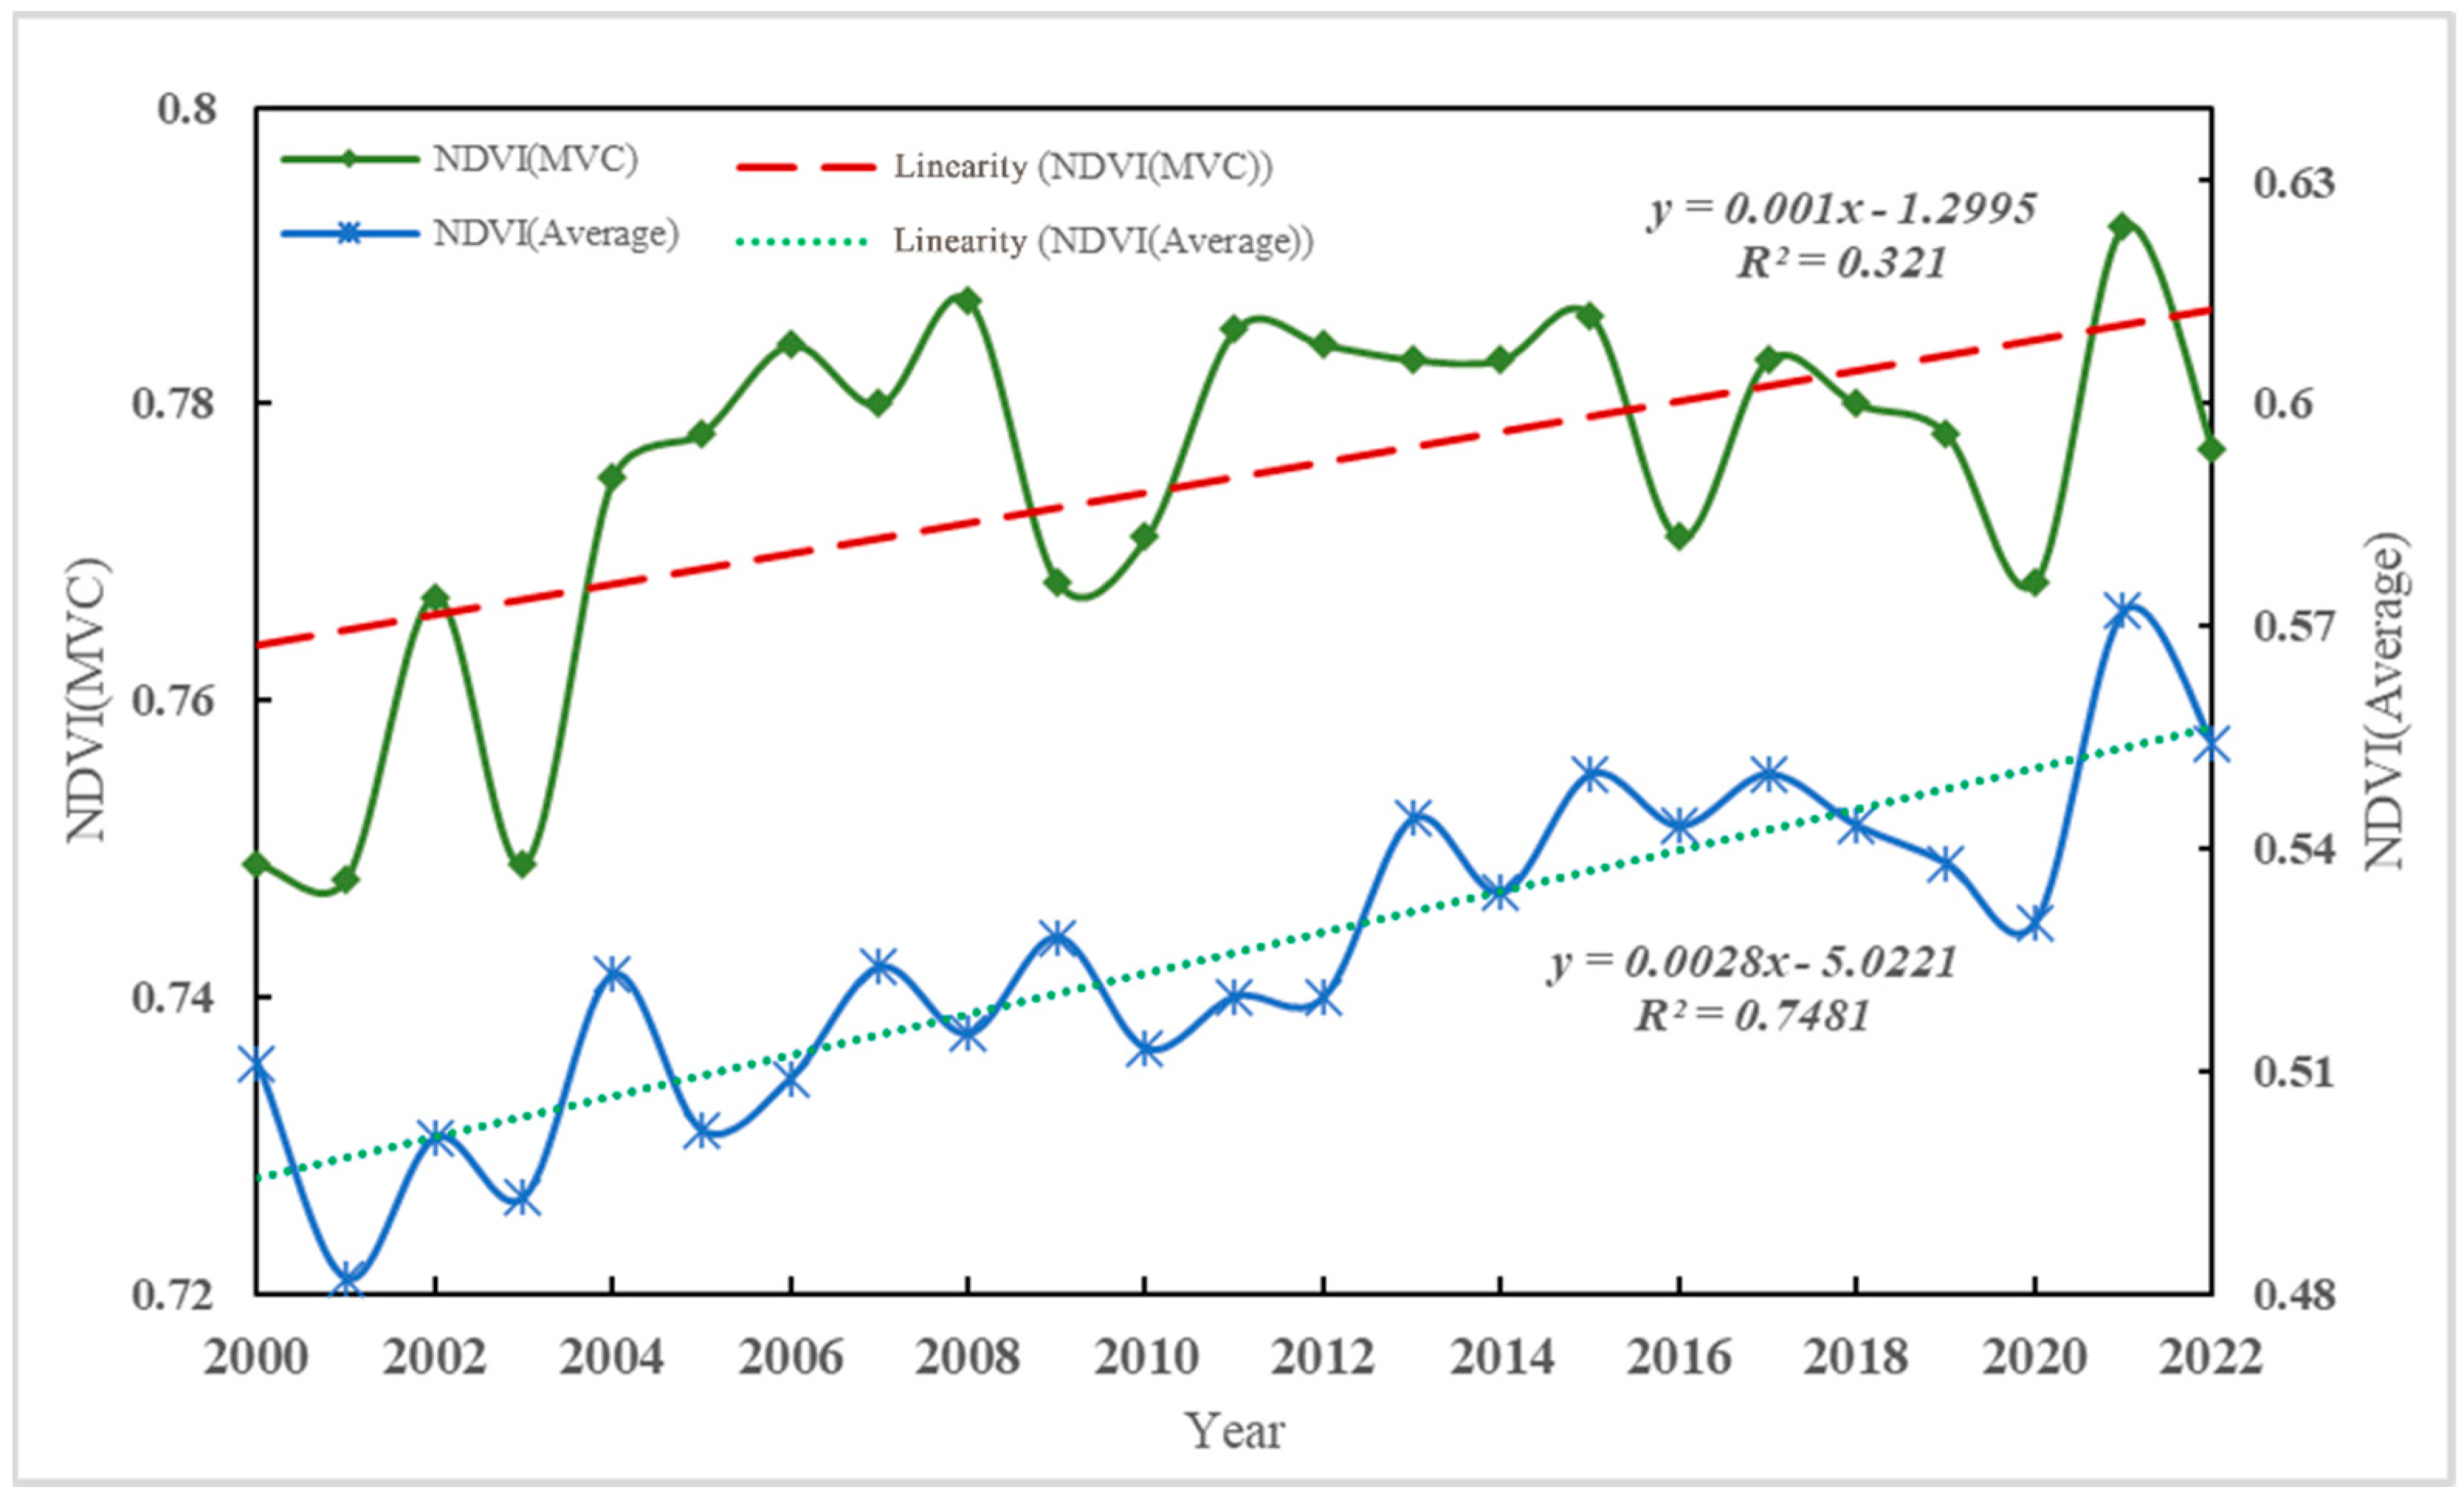
The annual NDVI (MVC) and NDVI (average) were calculated separately from 2000 to 2022 to characterize the vegetation changes in Hubei Province in the last 23 years. As can be seen in Figure 2, the annual NDVI (MVC) is 0.74 to 0.79, the annual NDVI (average) is 0.48 to 0.57, and the minimum and maximum values of the annual NDVI (MVC) and NDVI (average) occur in 2001 and 2021. The overall change in NDVI showed a fluctuating upward trend, and the annual NDVI (MVC) growth rate was 0.01/10a (p < 0.005), which was lower than the annual NDVI (average) growth rate of 0.28/10a (p < 0.001). In terms of inter-annual trends, the trends of annual NDVI (MVC) and annual NDVI (average) converge roughly.
3.1.2. Spatial Variation Characteristics of the NDVI
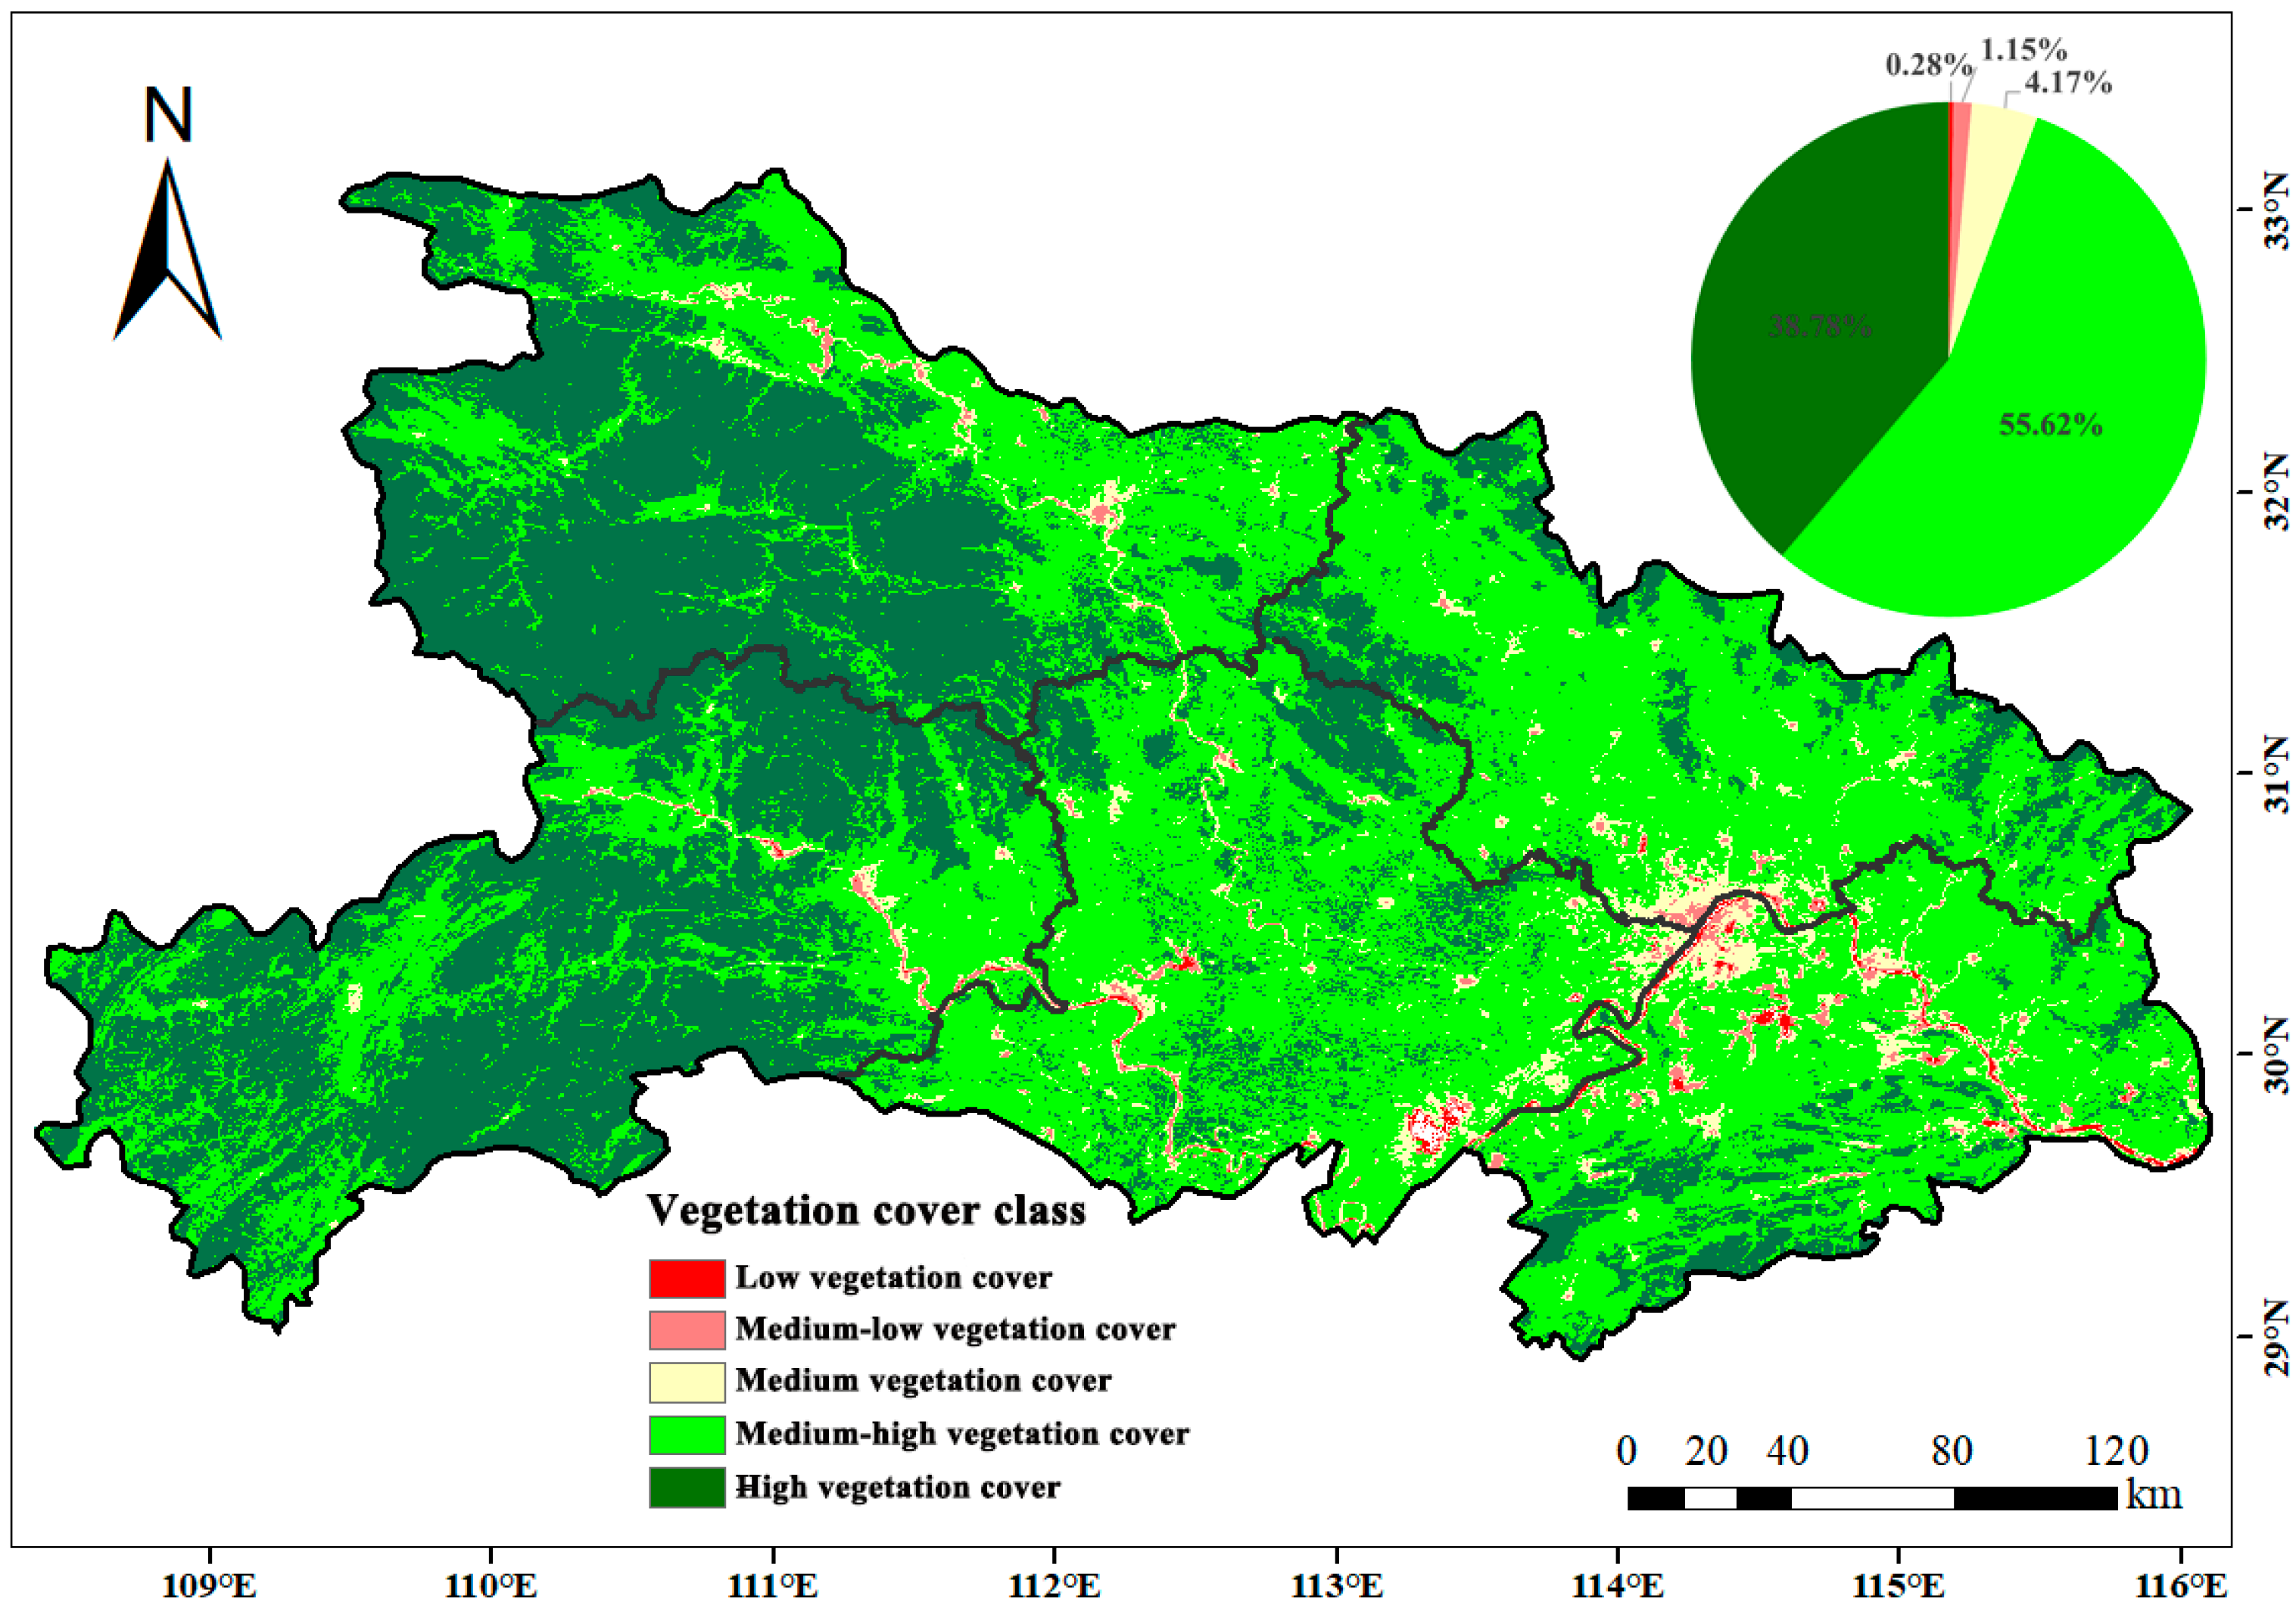
The multi-year mean NDVI values in Hubei Province from 2000 to 2022 ranged from 0.025 to 0.898, with a mean value of 0.762. Combined with the actual situation in Hubei Province, this study used the equal-interval method to classify the spatial distribution of NDVI into five types: low vegetation cover (0 < NDVI ≤ 0.2), medium-low vegetation cover (0.2 < NDVI ≤ 0.4), medium vegetation cover (0.4 < NDVI ≤ 0.6), medium-high vegetation cover (0.6 < NDVI ≤ 0.8), high vegetation cover (0.8 < NDVI ≤ 1.0). The spatial distribution of NDVI in Hubei Province shows a pattern of “low in the east and high in the west” (Figure 3). Among them, the proportion of medium-high and high vegetation-covered areas reached 94.4%, indicating that the overall vegetation-cover condition in Hubei Province is at a high level. The proportion of areas with less than medium vegetation cover is only 5.6 percent, concentrated in and around cities with a high level of urbanization and development, and consisting mainly of various types of urban built-up areas, reservoirs, lakes, and rivers.
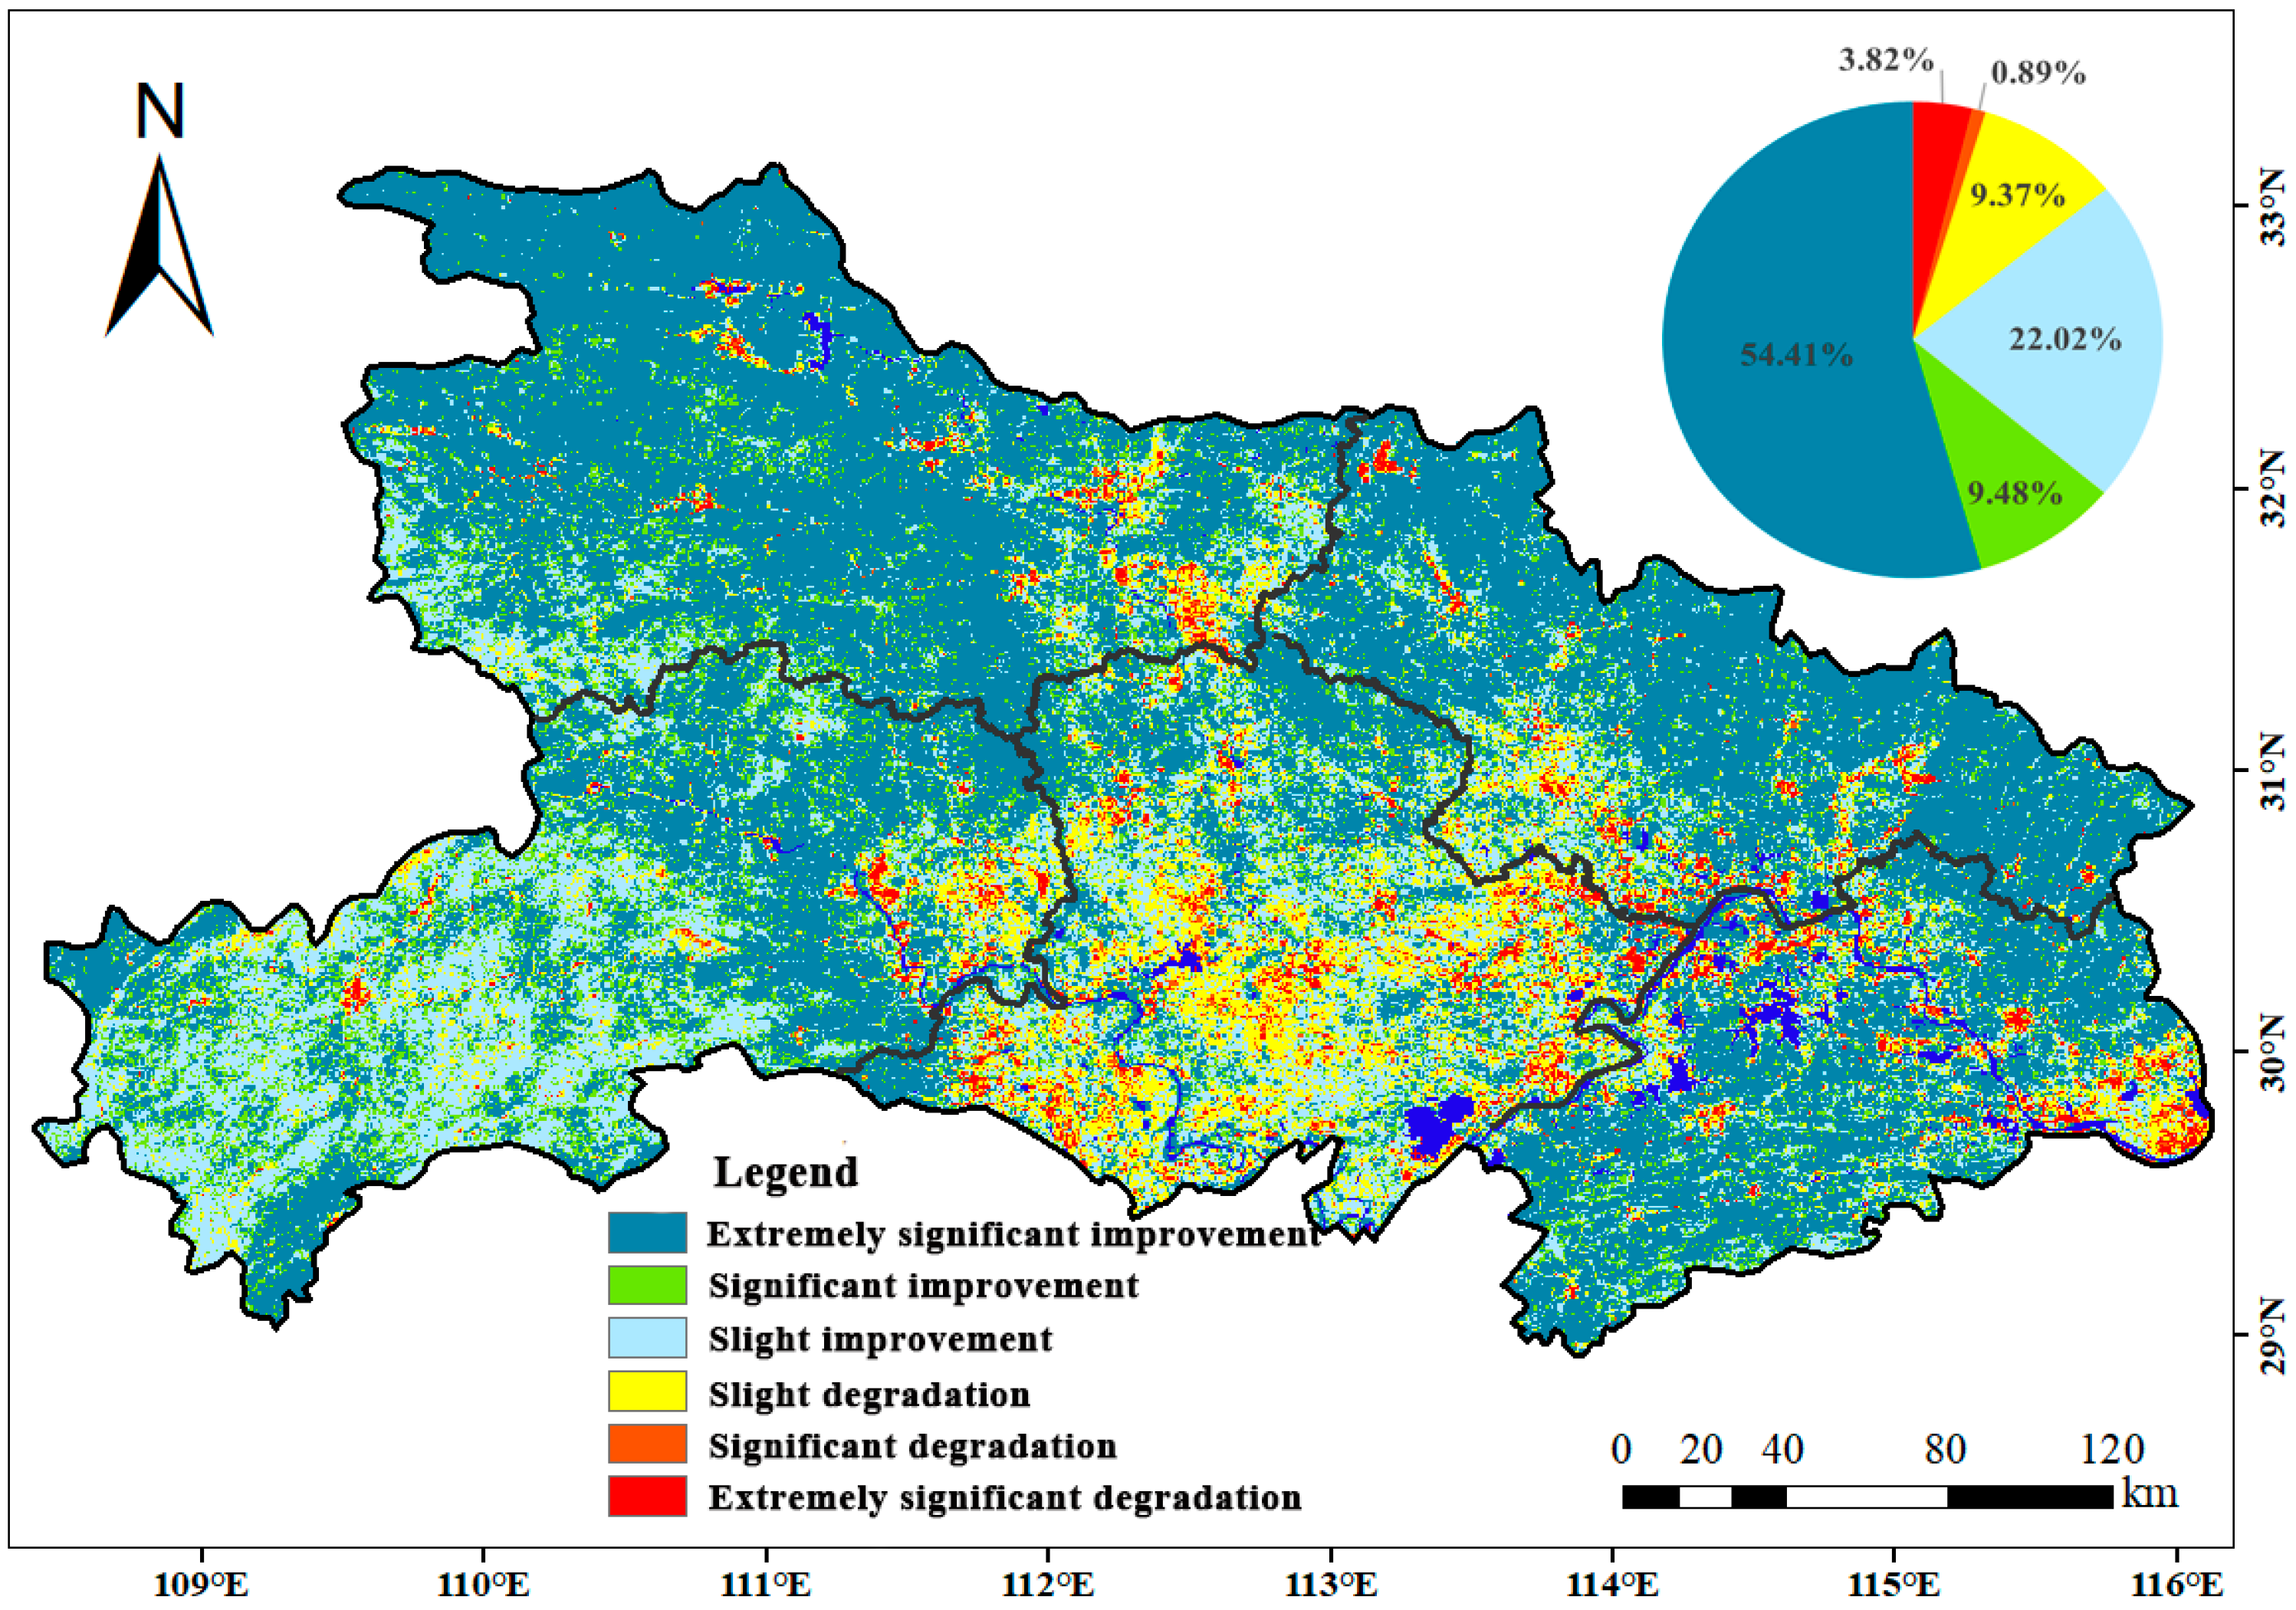
Combined with the Sen+Mann–Kendall trend analysis to obtain the spatial distribution of vegetation NDVI trends and the percentage of area occupied by trend classes (Figure 4), it is found that in the past 23 years, the NDVI of the vegetation in Hubei Province has shown a trend of continuous improvement, in general, and the NDVI of the vegetation in Hubei Province has shown a trend of continuous improvement in the past 23 years. Vegetation NDVI showed an improving trend in 85.91% of the total area of Hubei, and the significant improvement trend (p < 0.05) accounted for 63.89% of the study area, which was mainly concentrated in northwestern Hubei, southwestern Hubei, and part of northeastern Hubei and southeastern Hubei. Vegetation NDVI showed a decreasing trend that was mainly distributed in the more densely populated Jianghan Plain area, with a significant degradation trend of 4.71% of the area (p < 0.05). Generally speaking, the proportion of areas with improving vegetation cover in Hubei Province is much higher than that of degrading trend, and the state of vegetation cover is improving, which is characterized by the spatial change in “large improvement in the surrounding hills and mountains, and small degradation in the middle plains”.
3.1.3. Stability Analysis of the NDVI
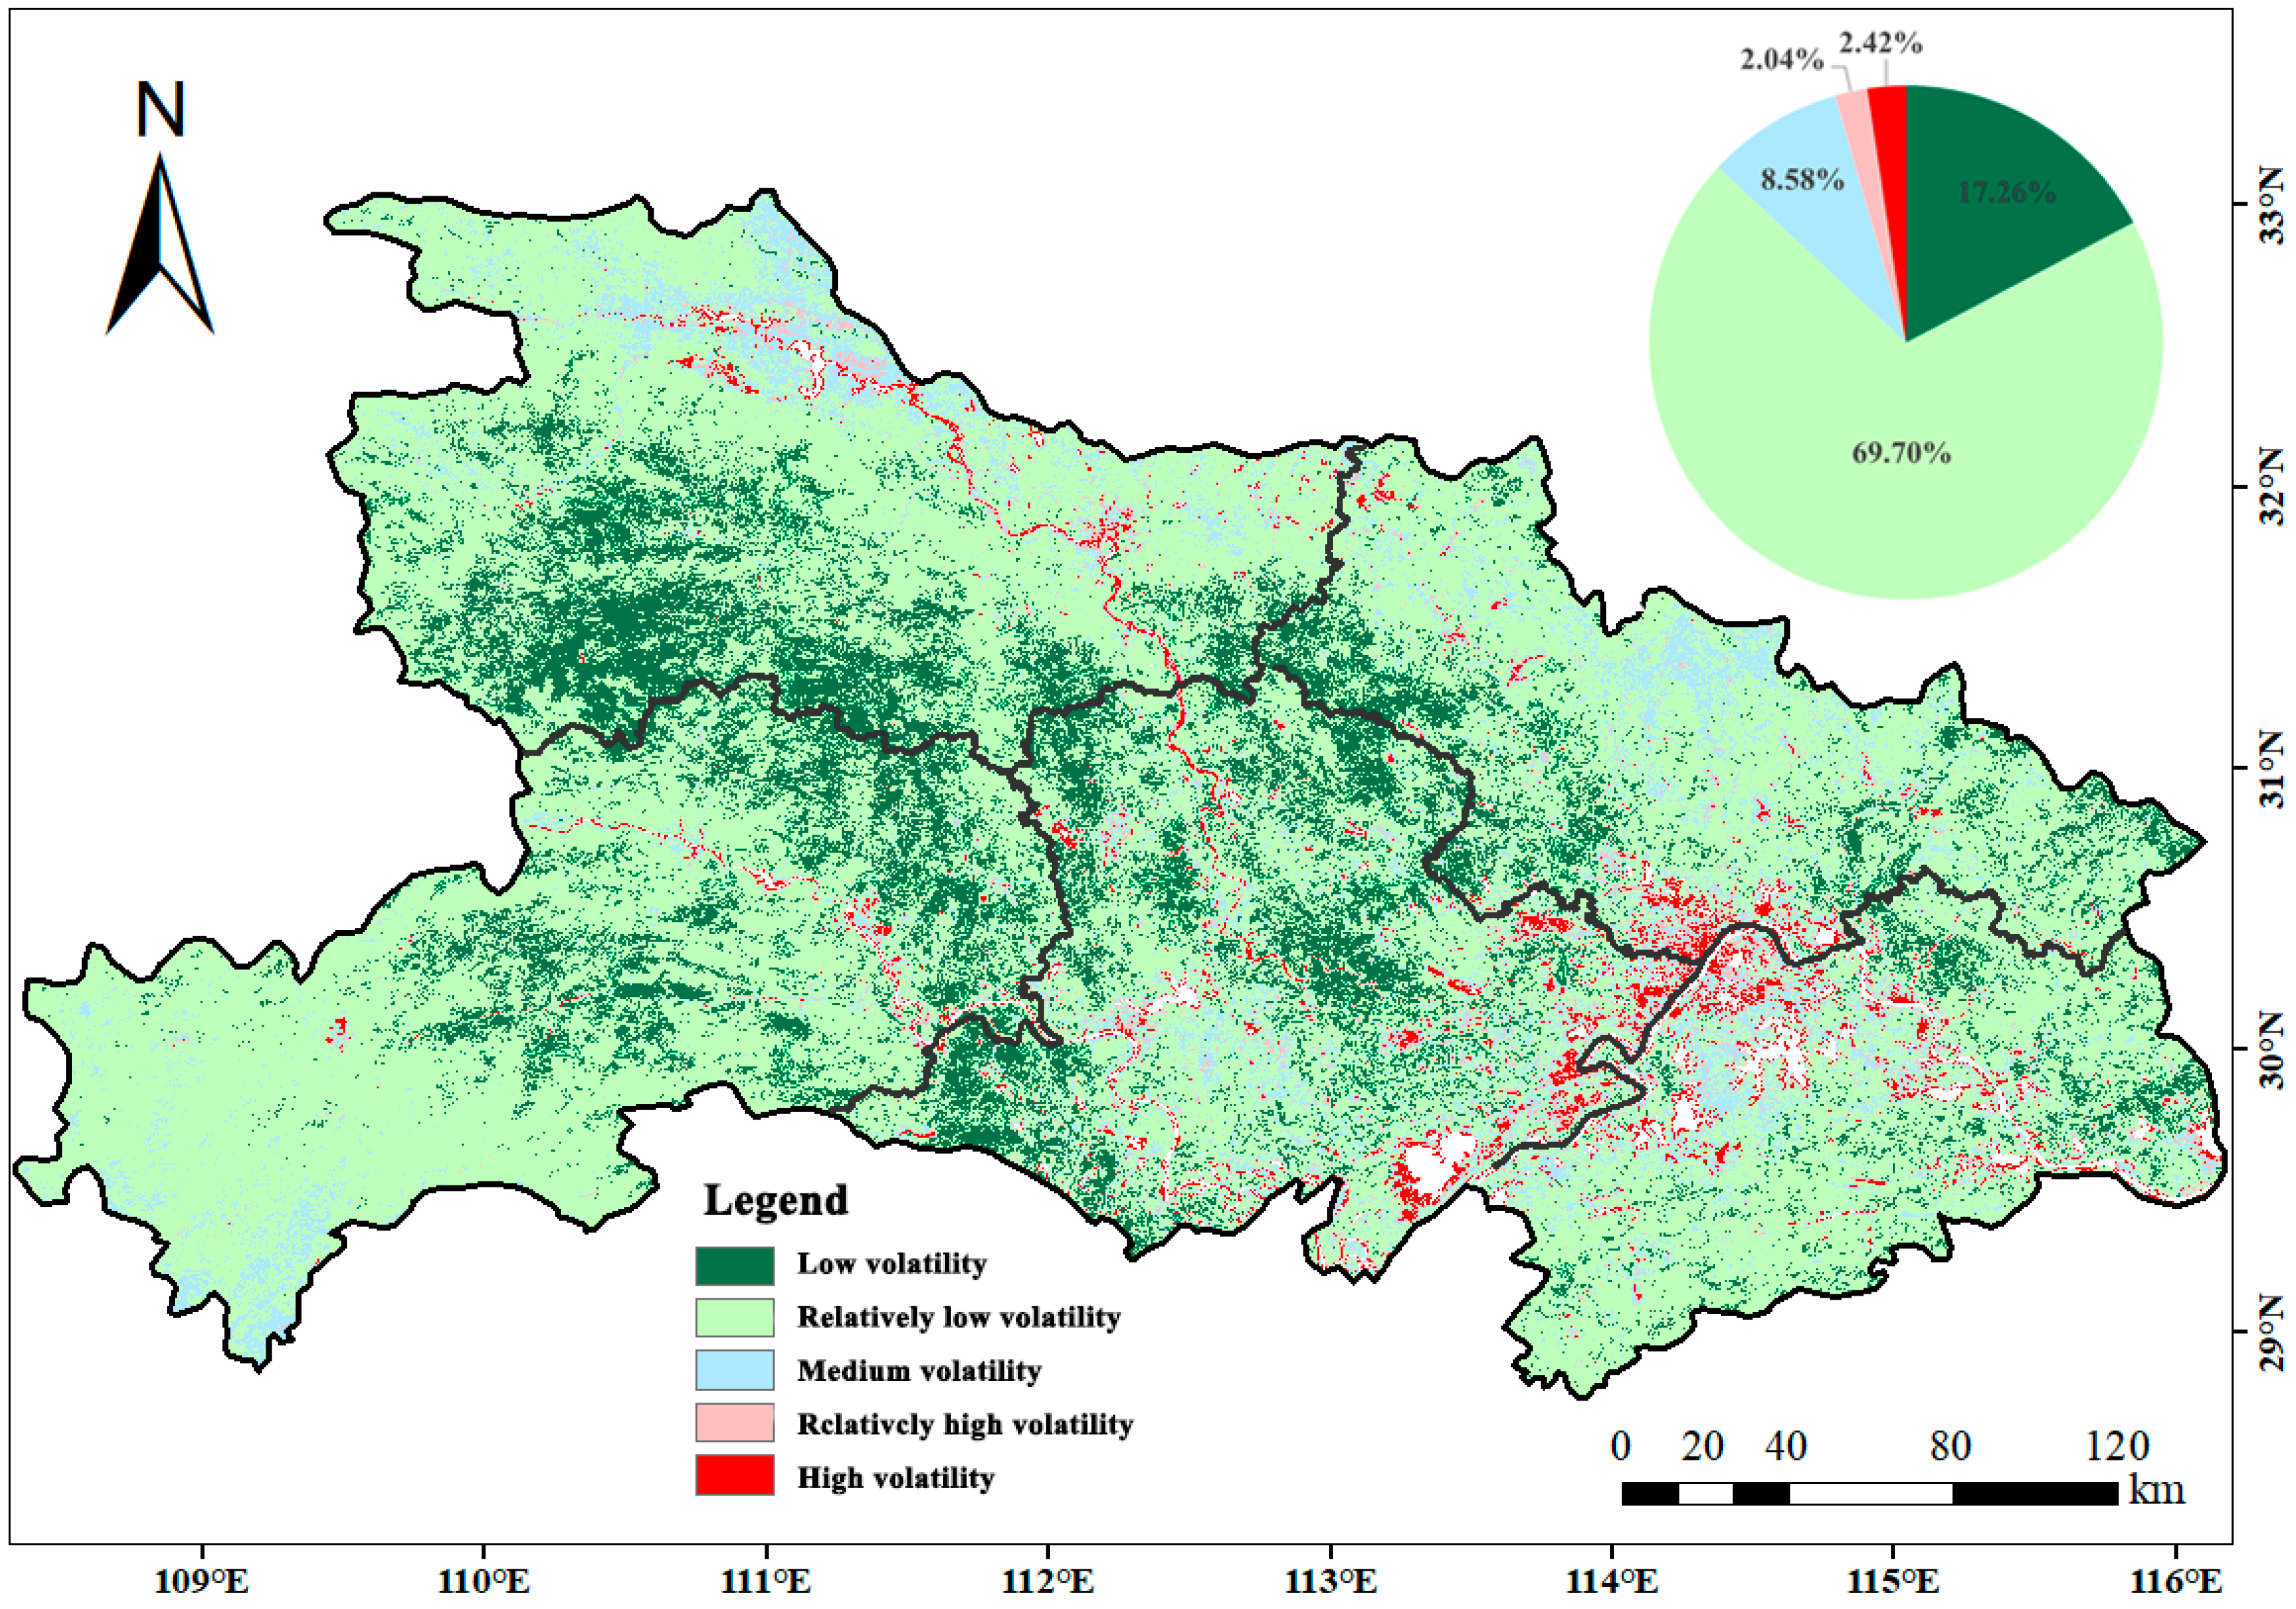
The coefficient of variation (Cv) can be used to characterize the degree of dispersion and volatility of NDVI within a time series, and it was calculated that the Cv in Hubei Province ranged from 0 to 1.39 from 2000 to 2022. During the study period, the stability of spatial changes in NDVI in the study area (Figure 5) was characterized by “uniform distribution, in general, obvious differences between urban and rural areas, and fluctuations in river and reservoir heights”. Among them, the areas with low and lower fluctuation changes are 17.26% and 69.70%, respectively, the area with medium fluctuation changes is 8.58%, and the area with high and higher fluctuation changes is only 4.46%, which is consistent with the range of the area covered by less than medium vegetation.
3.1.4. Stability Analysis of the NDVI
Spatial characterization of vegetation changes in Hubei Province over the past 23 years has been carried out, but its future development trend is unclear. Combined with the Hurst exponent to predict the future trend of NDVI change in Hubei Province, as shown in Figure 6, the overall tendency of vegetation changes towards sustainability accounted for 70.76%, indicating that the trend of NDVI change in most of the regions in the future is likely to be maintained in line with the trend of change in the period from 2000 to 2022. Among them, the strong forward sustainability trend accounted for 33.83%, which was mainly distributed to the west of Hubei. On the contrary, the overall tendency of vegetation changes to anti-sustainability accounted for 29.24%.
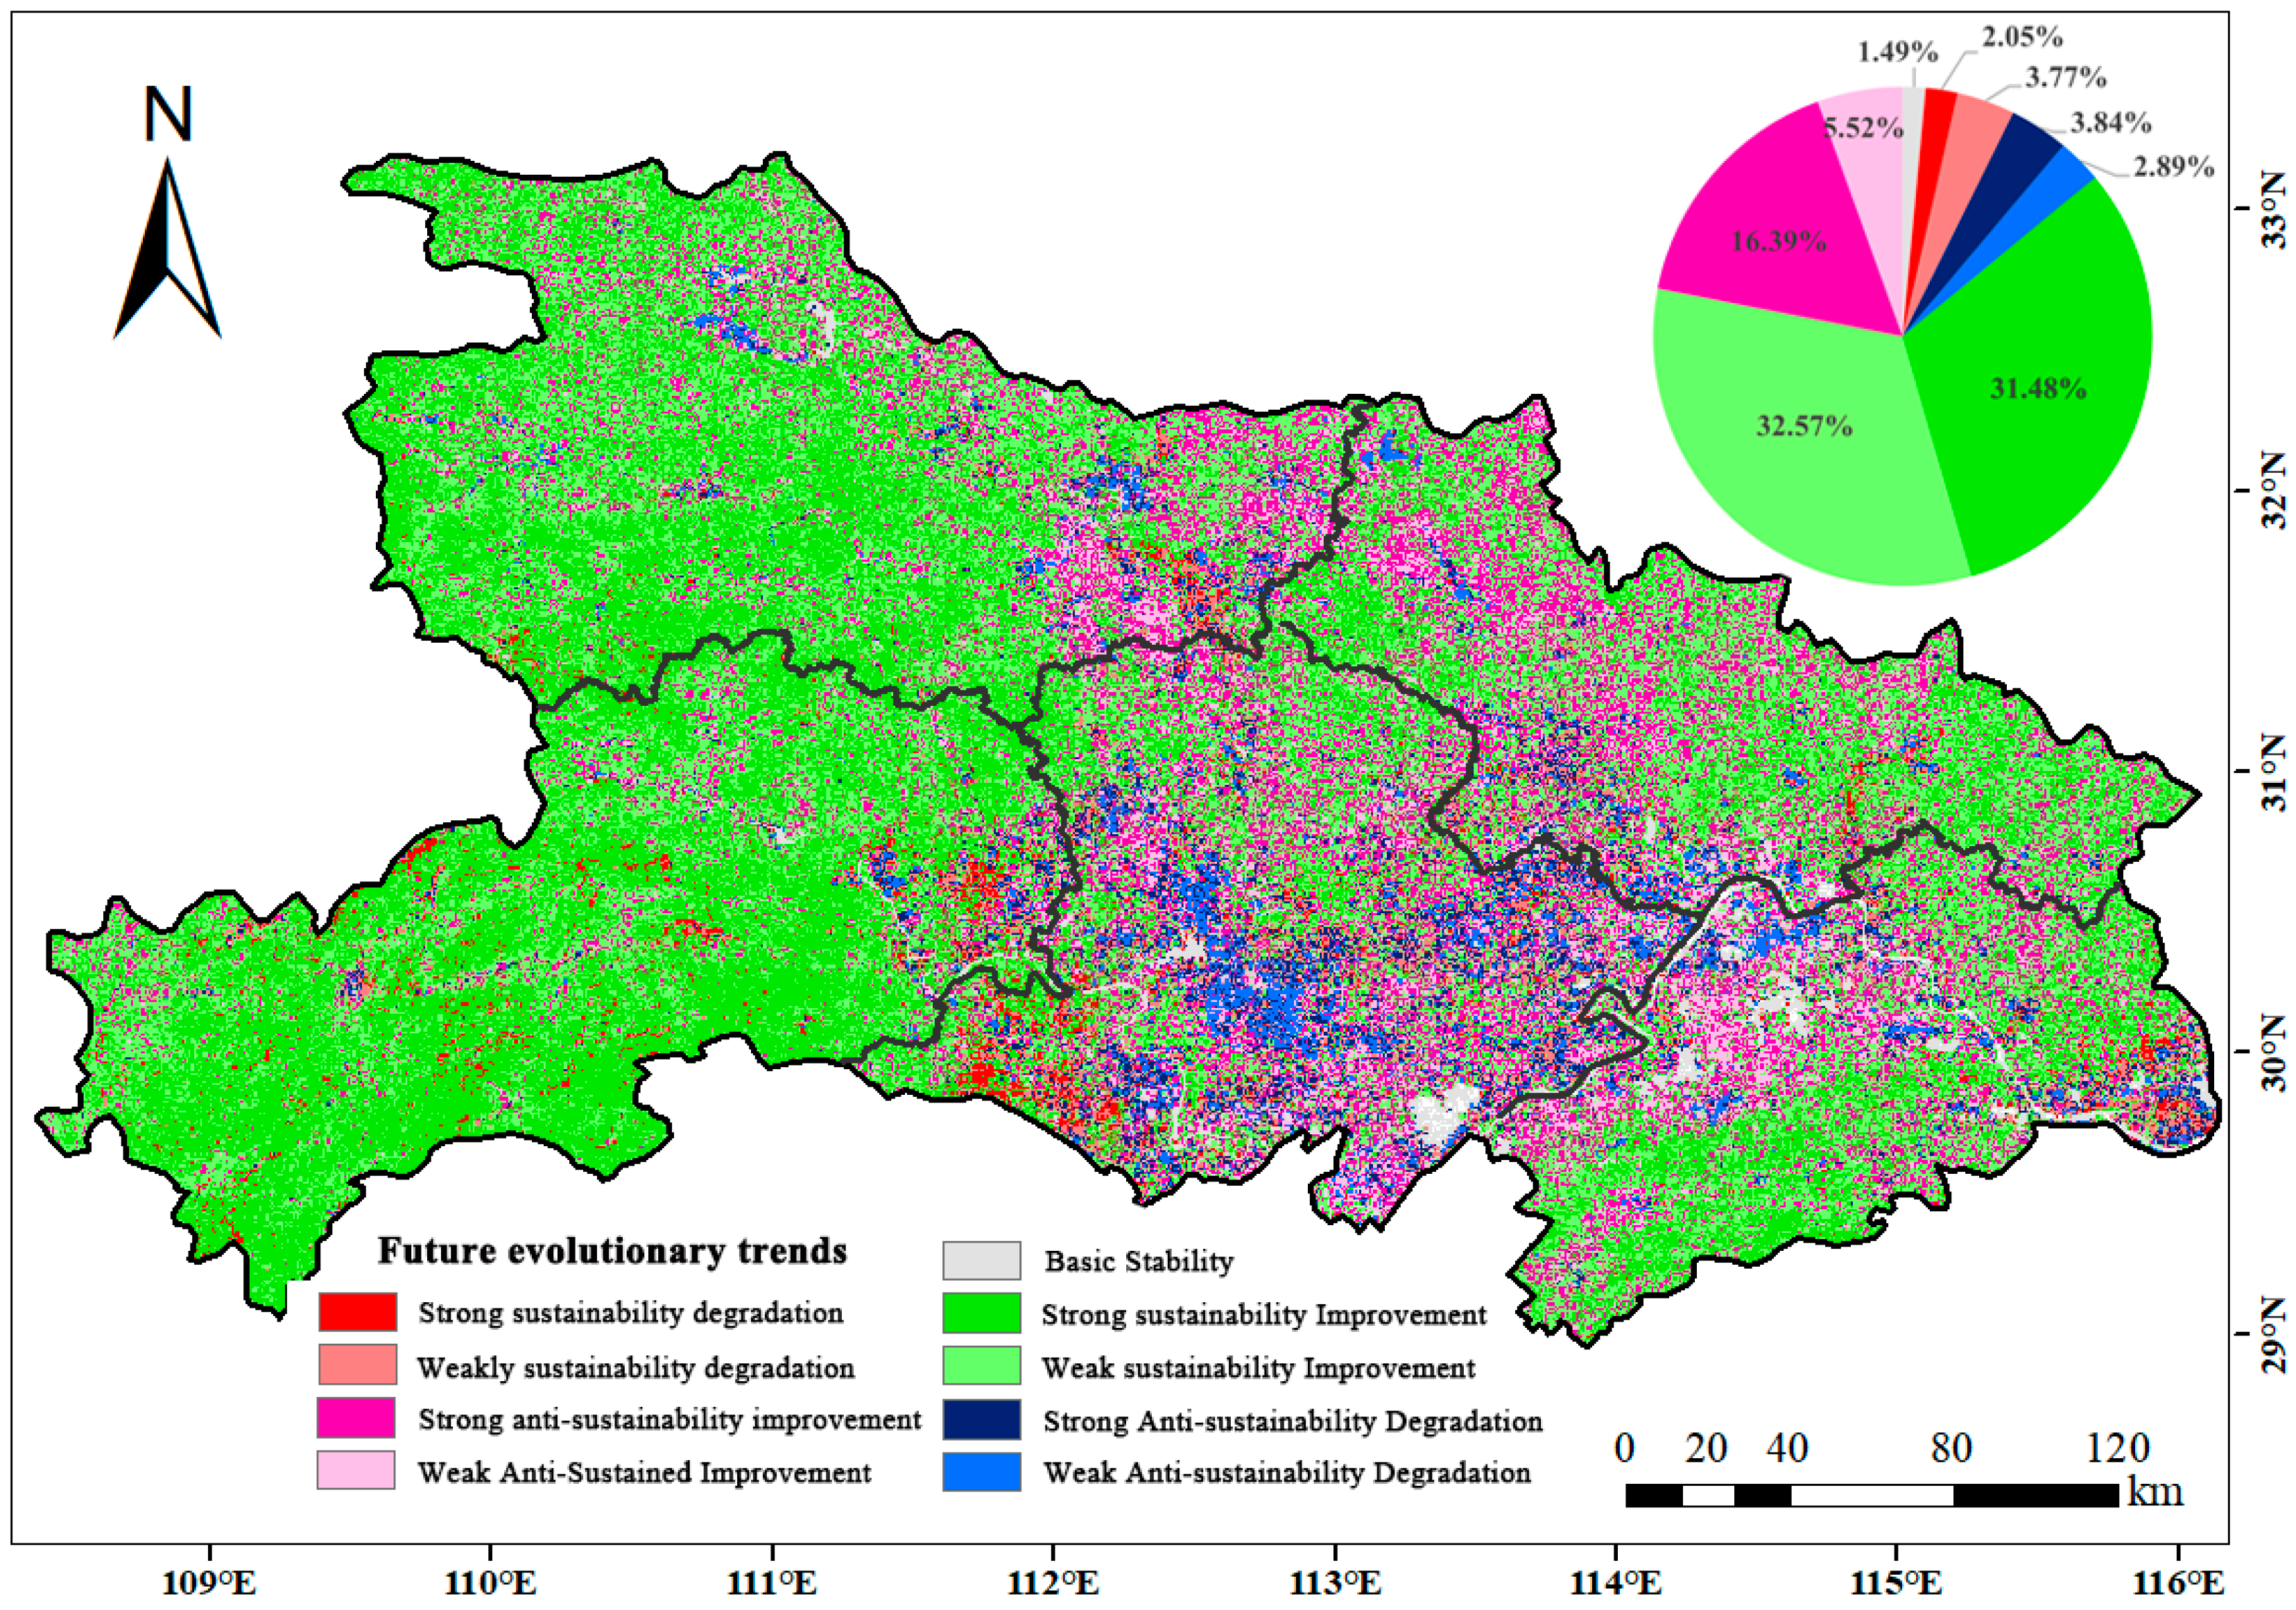
In order to further explore the characteristics of the future vegetation development trend of NDVI in Hubei Province, the spatial distribution of the Hurst exponent and the trend of NDVI were superimposed and analyzed to obtain the future trend of NDVI (Figure 7). Among them, the proportion of areas with sustainability improvement amounted to 64.05%, the proportion of areas with anti-sustainability degradation from degradation to improvement accounted for 6.73%, and the proportion of benign development in the future totaled 70.78%, indicating that the future trend of NDVI change in Hubei Province will be dominated by improvement. Sustained degradation areas account for 5.82%, anti-sustained improvement areas from improvement to degradation accounted for 21.91%, and future malignant development accounted for a total of 27.73%, which were mainly distributed in the Jianghan Plain, Wuhan Urban Agglomeration, Xiangyang-Shiyan-Suizhou Urban Agglomerations, etc. For potentially degraded areas, it is necessary to strengthen ecological environmental protection and management according to the local conditions in order to minimize the risk of vegetation degradation in the future.
3.2. NDVI Driver Analysis
3.2.1. Influence of Climatic Factors on Vegetation NDVI
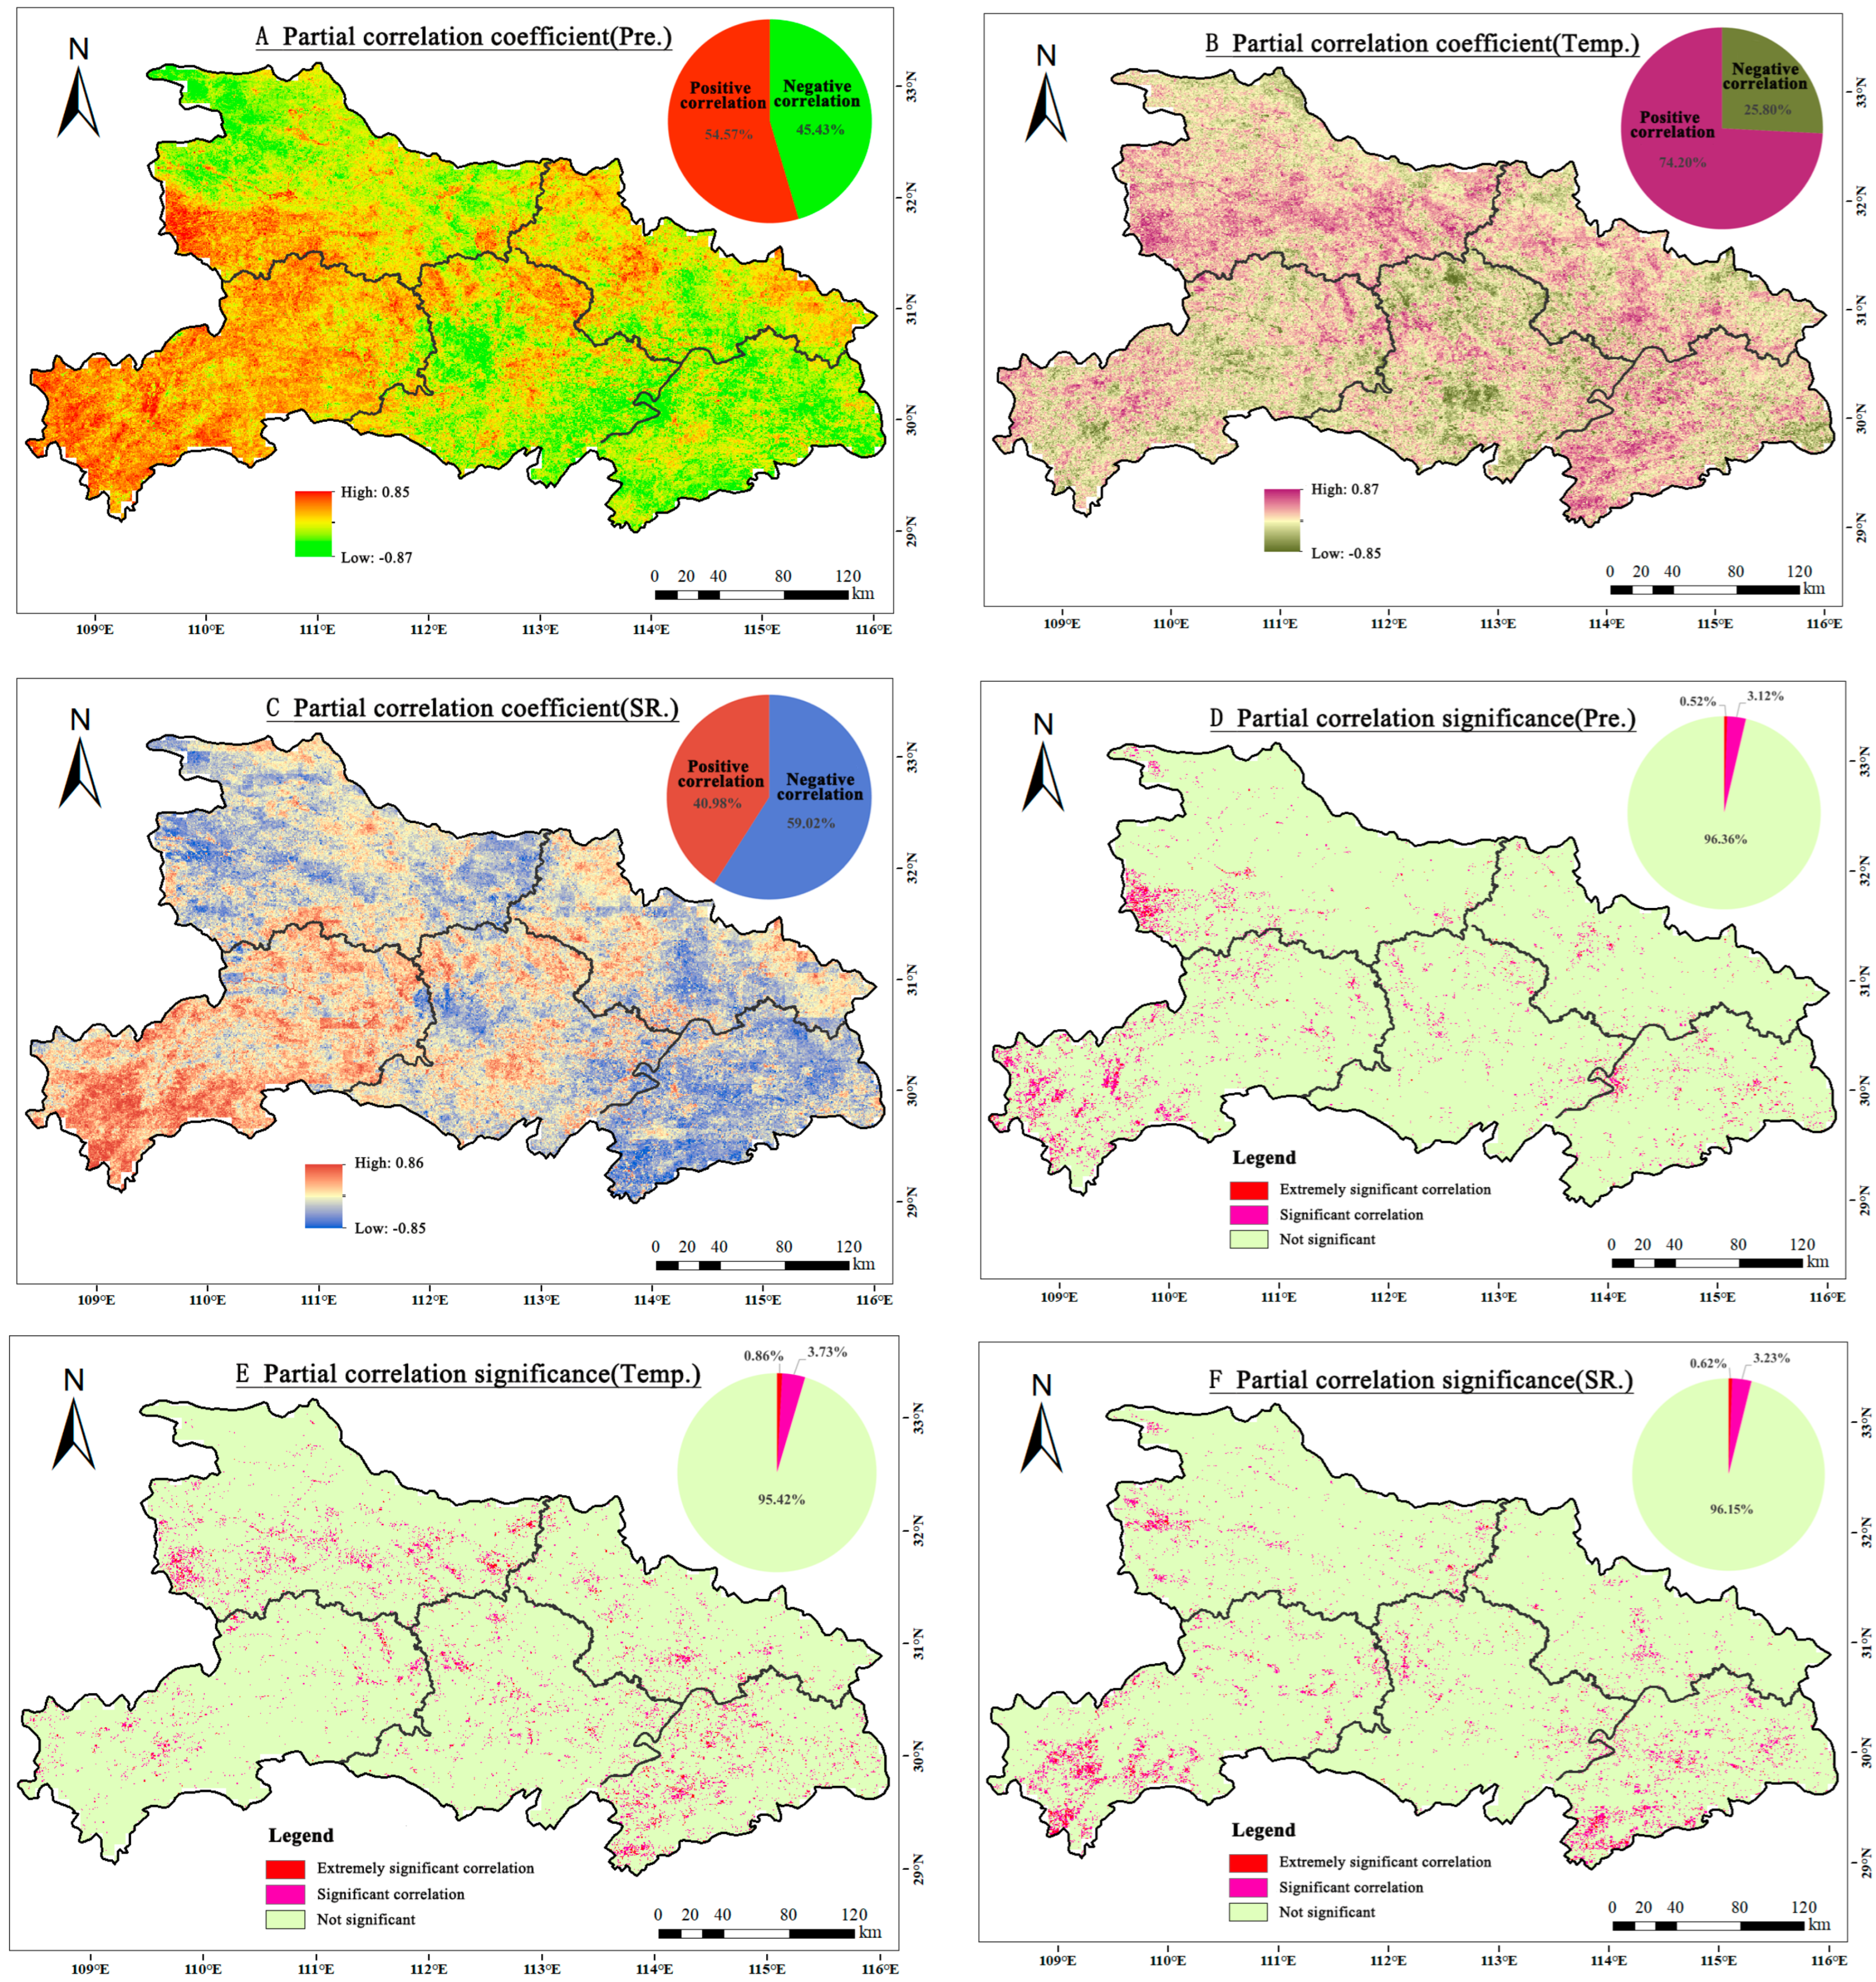
Changes in temperature and precipitation affect the ecological adaptation of vegetation and climatic phenomena, while solar radiation directly affects plant photosynthesis. From the partial correlation coefficients between climate factors and vegetation, it can be seen (Figure 8) that the mean values of the partial correlation coefficients of vegetation NDVI with precipitation, temperature, and solar radiation are 0.04, 0.14, and −0.05. The partial correlation coefficients between vegetation NDVI and precipitation ranged from −0.87 to 0.85, in which the coefficients greater than 0 indicate that precipitation had a facilitating effect on the growth of vegetation, which accounted for about 54.57% of the area of the study area and was mainly distributed in the southwest of Hubei. On the contrary, the coefficients less than zero indicated that precipitation had an inhibitory effect on the growth of vegetation, and it was mainly distributed in the Jianghan Plain, southeast Hubei, and northwest Hubei. The significance test of the partial correlation coefficient shows that 3.64% of the area passes the significance test of p < 0.05, with sporadic distribution in West Hubei and other places. The areas with a positive and negative correlation between NDVI and air temperature in the study area account for 74.2% and 25.8% of the total study area, of which the proportion of the area passing the p < 0.05 significance test was 4.59%, which was mainly distributed in northwestern and southeastern Hubei, and there were sporadic distributions in other areas.
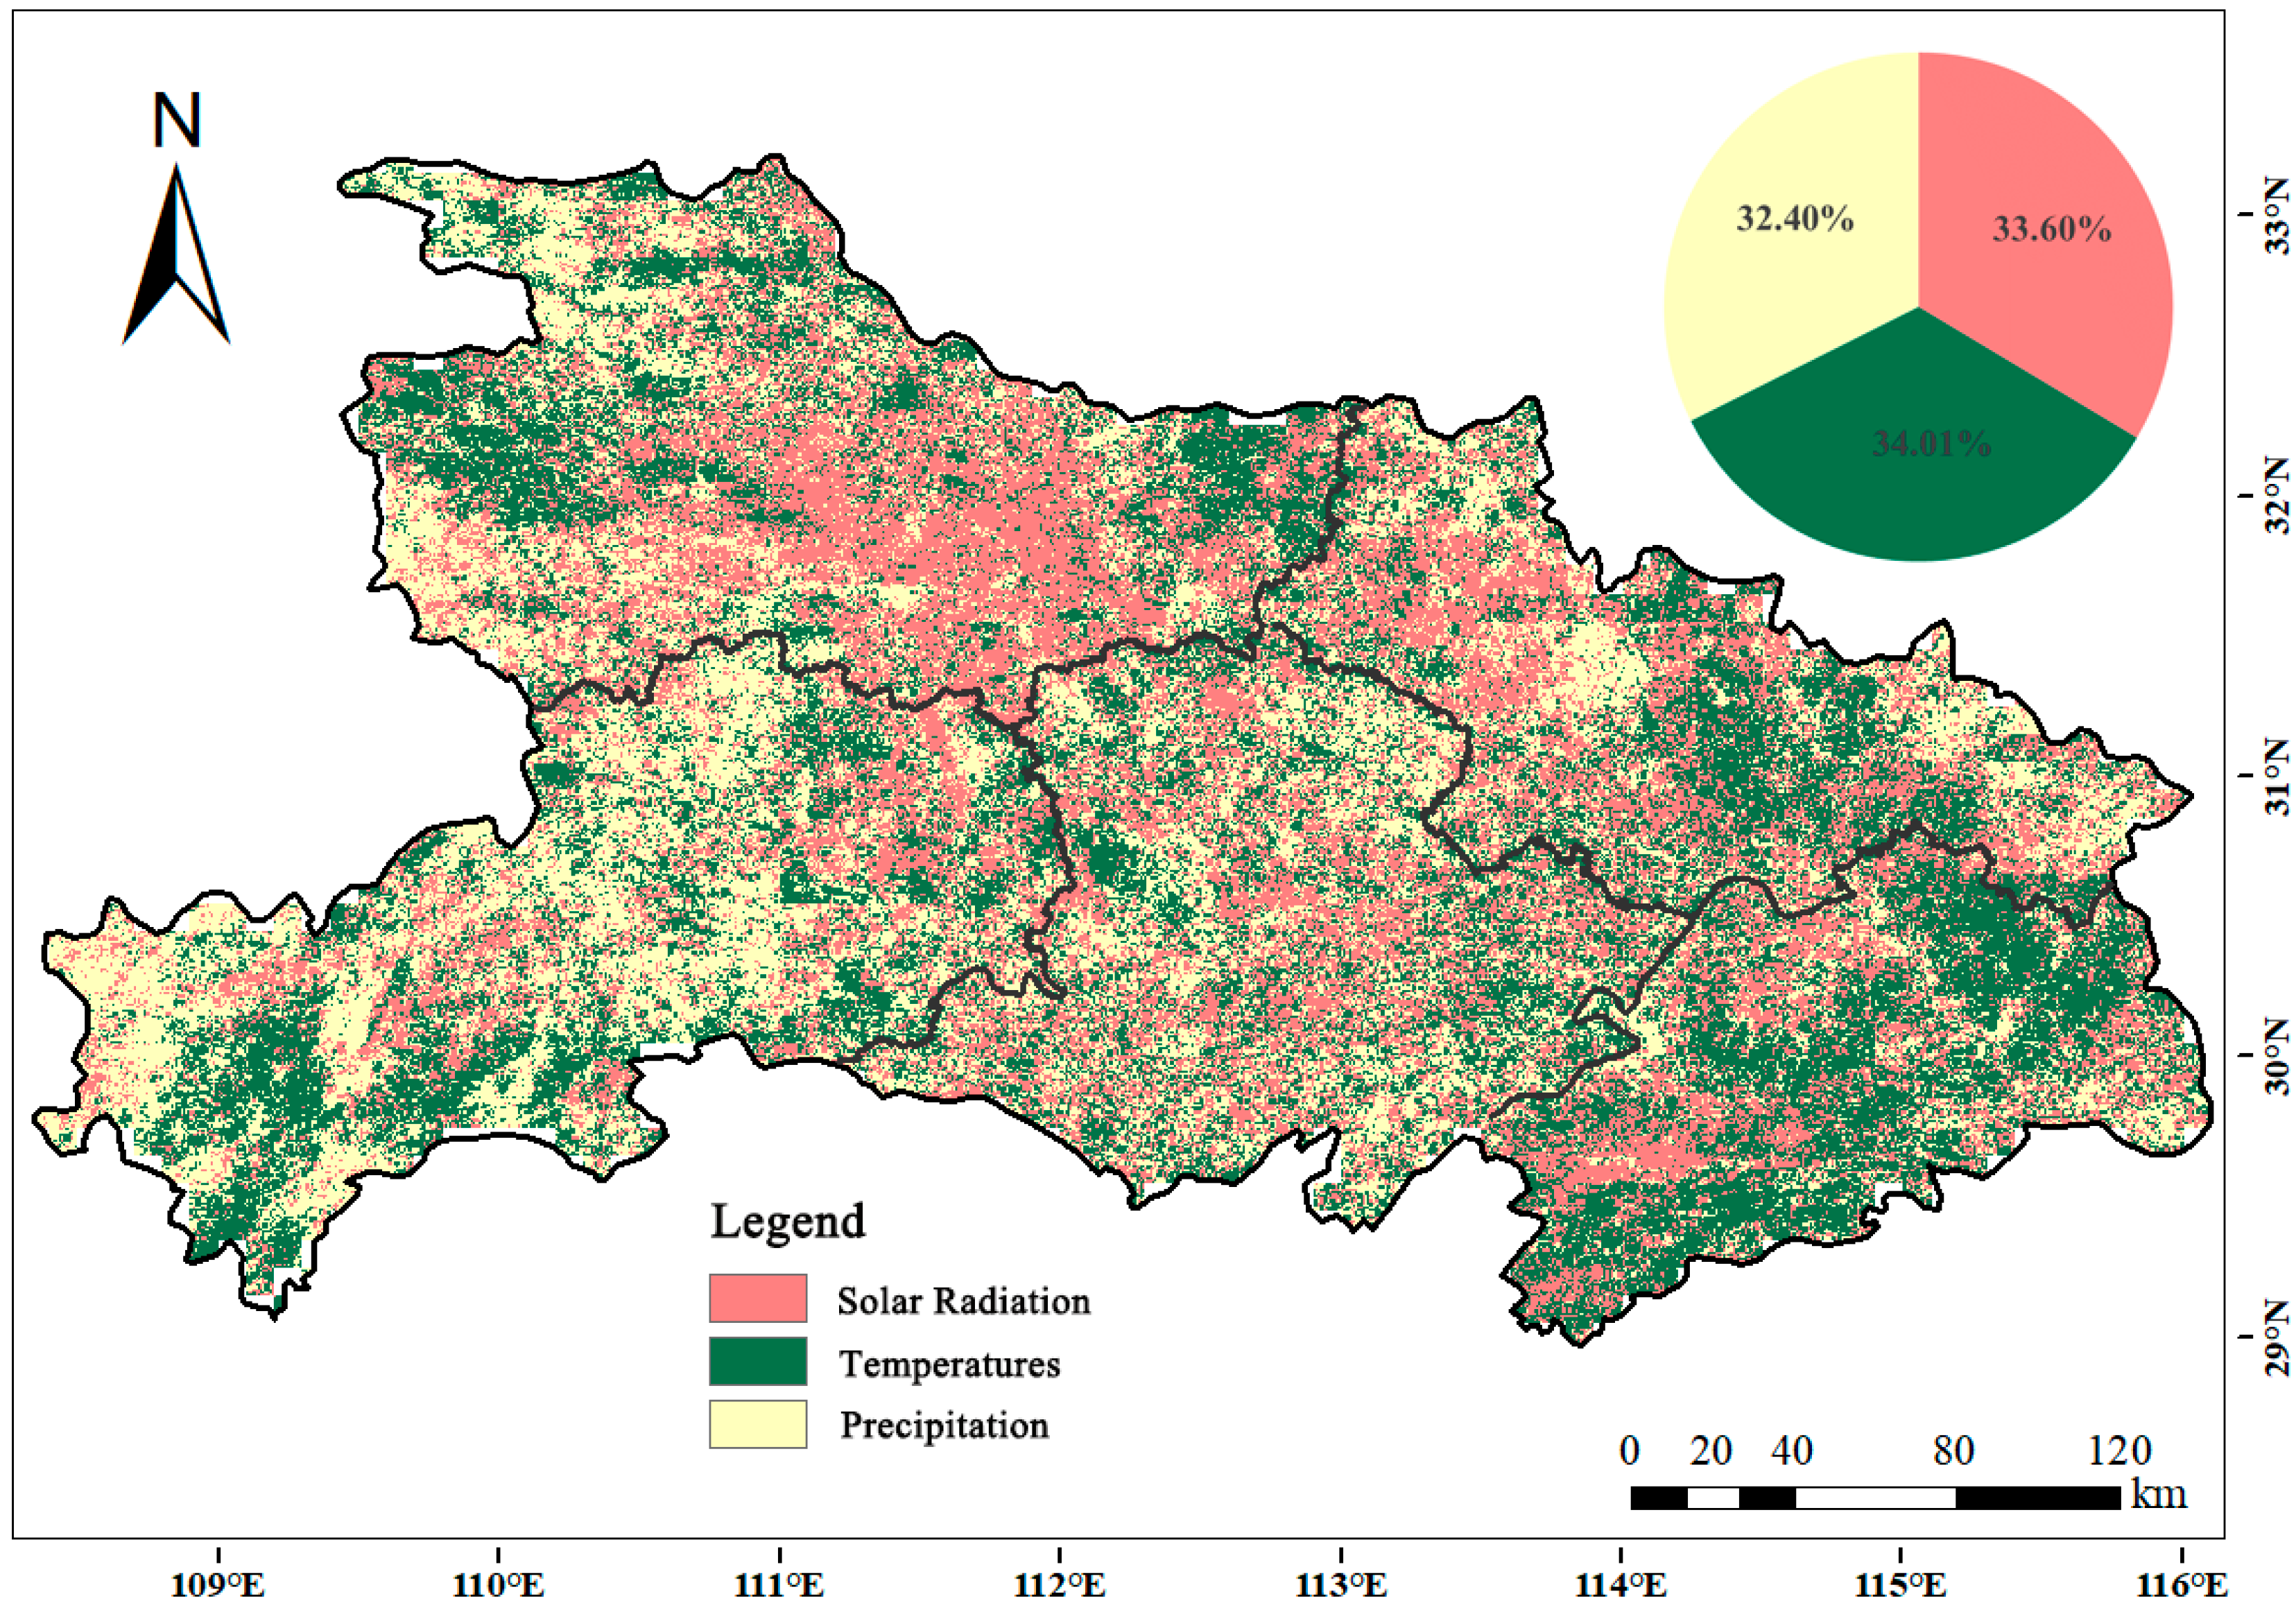
In the study area, NDVI was positively and negatively correlated with solar radiation, accounting for 40.98% and 59.02% of the total area, of which the proportion of the area that passed the significance test of p < 0.05 was 3.85%, which was mainly distributed in the south and southeast of Hubei and sporadically distributed in other areas. At the same time, the partial correlation coefficients of the climate factors were absolute-valued, and the factor with the largest absolute value within the raster image was taken as the dominant climate-driving factor affecting the regional vegetation NDVI (Figure 9), and the results showed that the proportion of the area driven by precipitation, air temperature, and solar radiation factors ranged between 32.40%, 33.60%, and 34.01%, respectively, and was evenly distributed within the study area, indicating that the contributions of the three climatic factors to drive the vegetation NDVI change were relatively even, and there was no obvious dominant factor.
3.2.2. Anthropogenic Effects on Vegetation NDVI
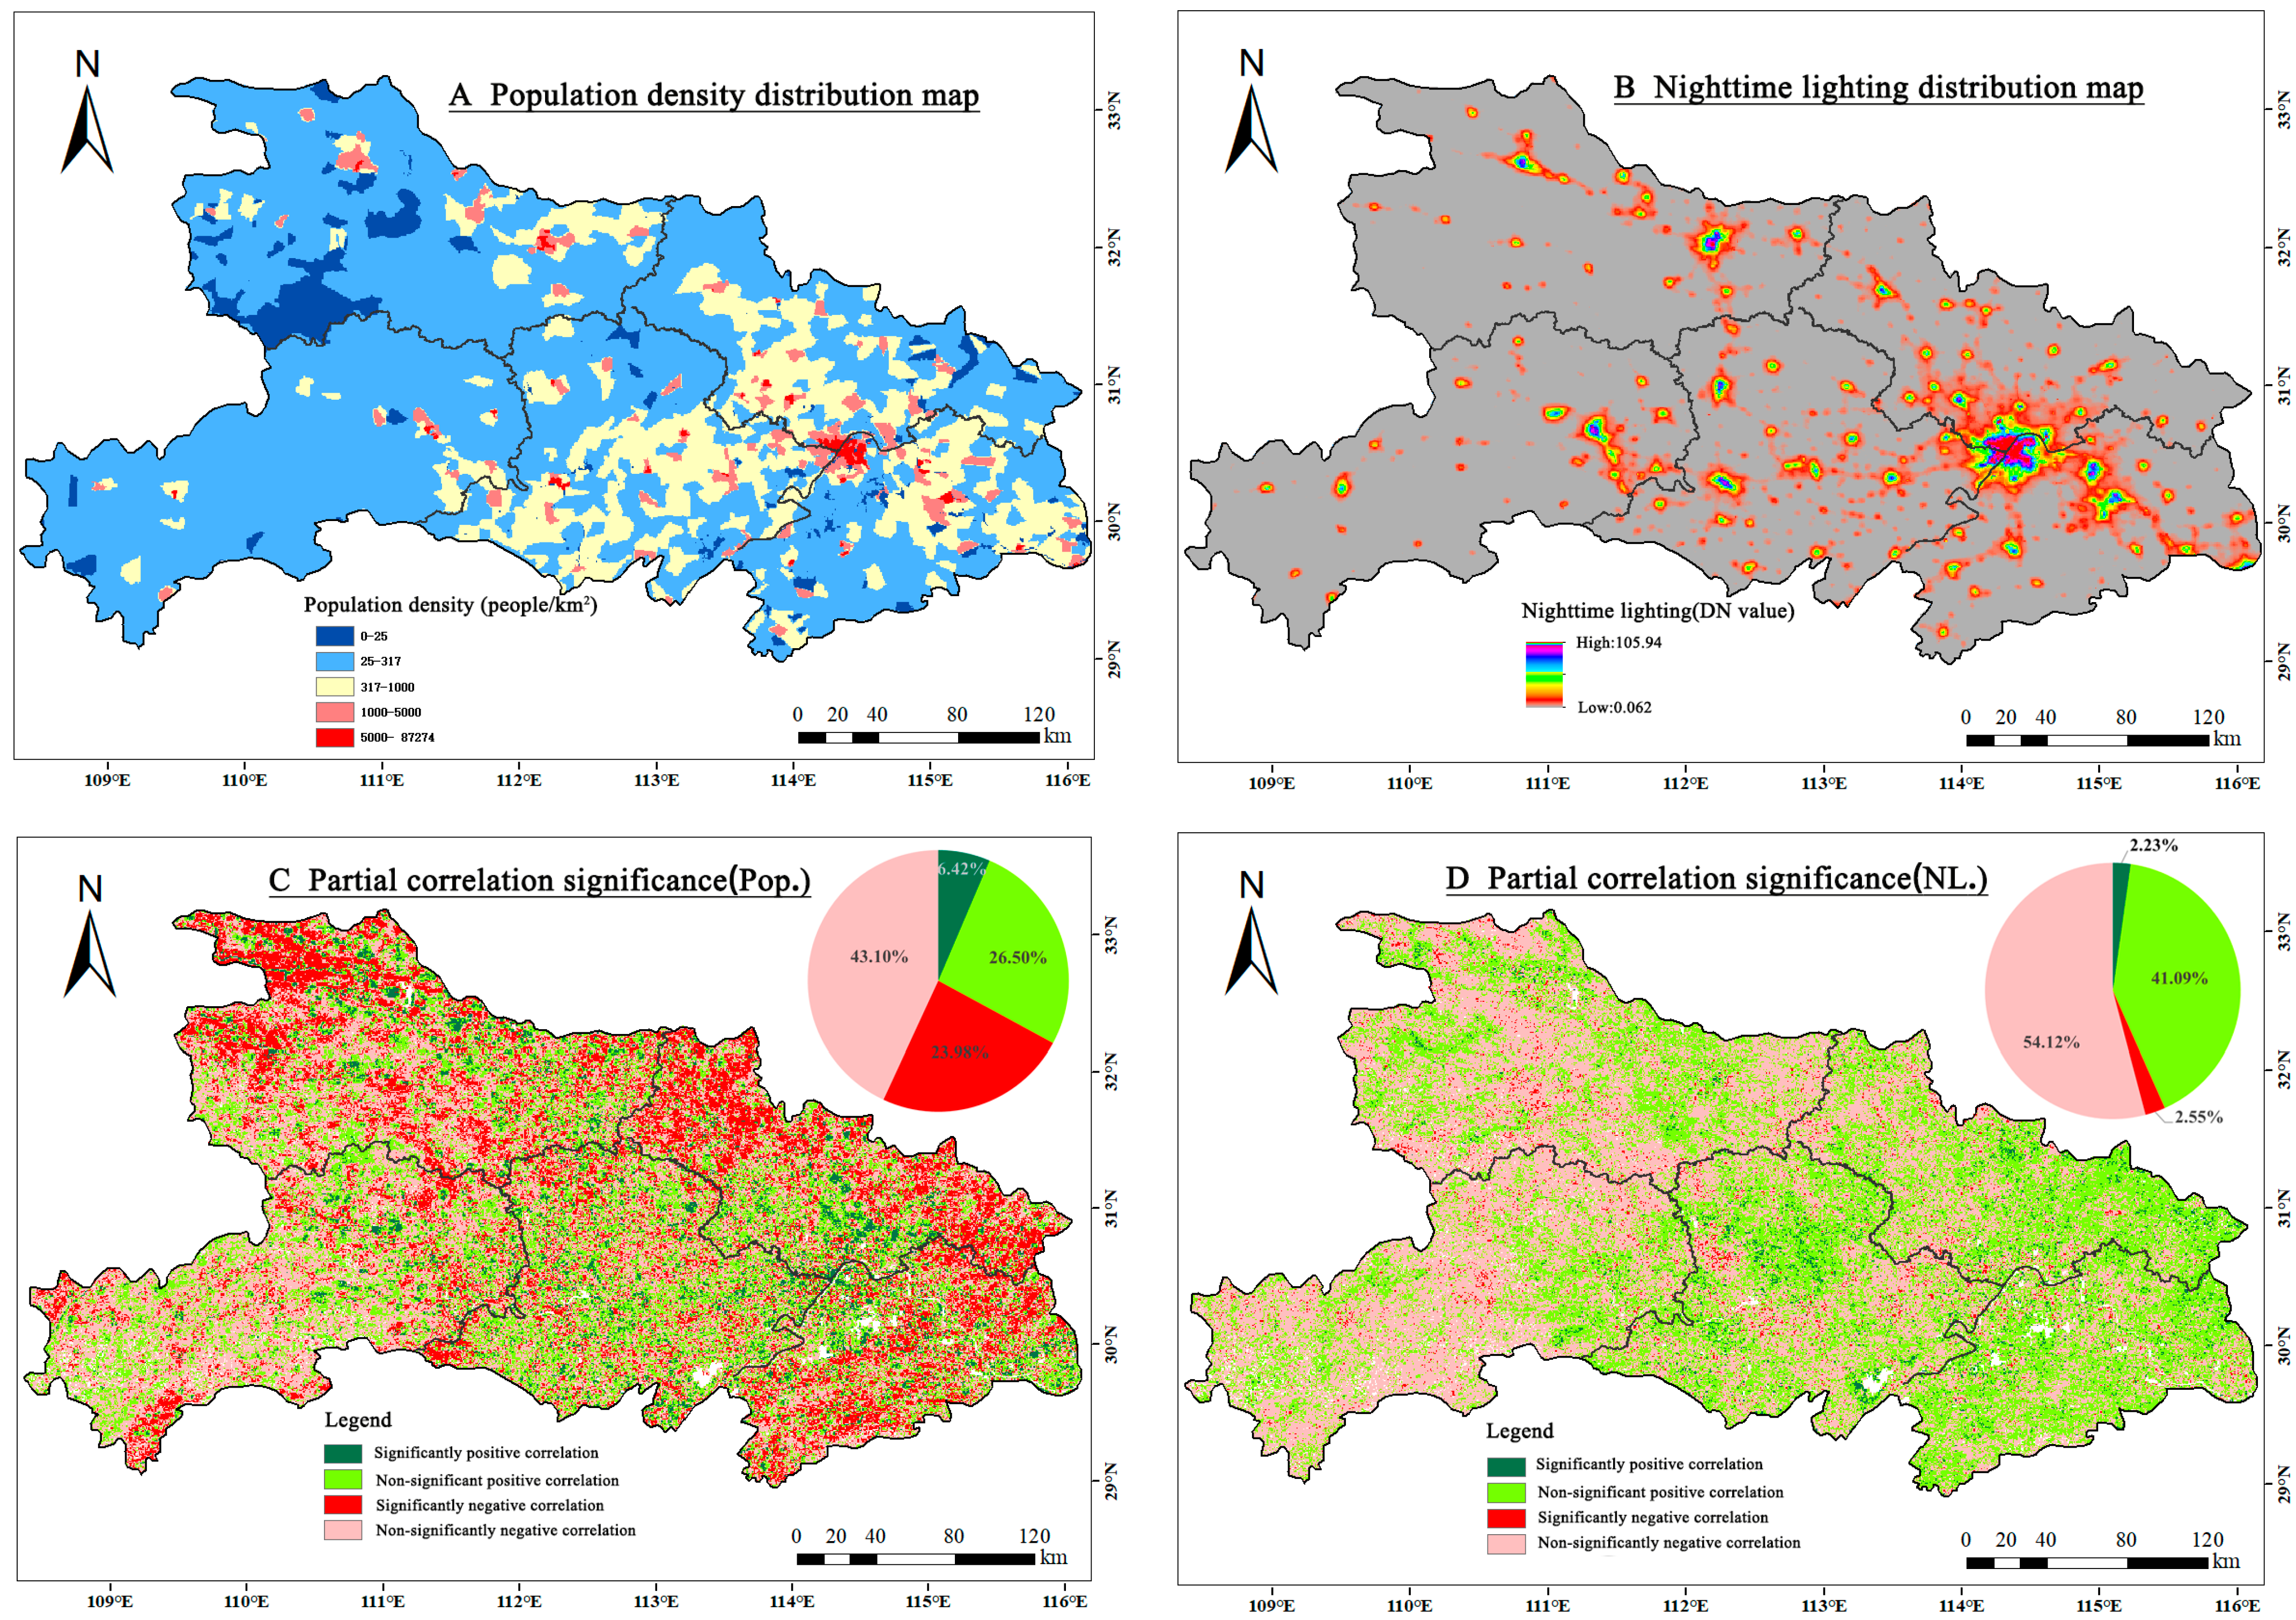
As can be seen from Figure 10, the population of Hubei Province is mainly distributed in East Hubei and the Jianghan Plain, and the areas with higher population density are mainly distributed in Wuhan City and its surroundings. The distribution of nighttime lights in Hubei Province has a high degree of overlap with the distribution of population density, which indicates that there are frequent human-related activities in the overlapping areas. NDVI was negatively correlated with population density in 73.08% of the study area, of which 23.98% were significantly negatively correlated (p < 0.05), mainly in northwest Hubei, northeast Hubei, southwest Hubei, etc. NDVI was negatively correlated with nighttime light in 56.67% of the study area, mainly in West Hubei, and the region with a significant negative correlation (p < 0.05) accounted for 2.55%. The area where NDVI is negatively correlated with both population density and nighttime lighting suggests that human activities in the region inhibit vegetation NDVI, especially population density.
Combined with the inter-annual changes of NDVI in Hubei Province (Figure 2) and the spatial distribution of its trend (Figure 4), it is concluded that the changes in NDVI in the cities within the built-up area show a gradual improvement, whereas for the urban-rural combined belt around the built-up area, the natural vegetation is degraded, indicating that the urbanization process has contributed to the decline of vegetation cover at the periphery of built-up urban areas.
3.2.3. Impact of Land Cover on Vegetation NDVI
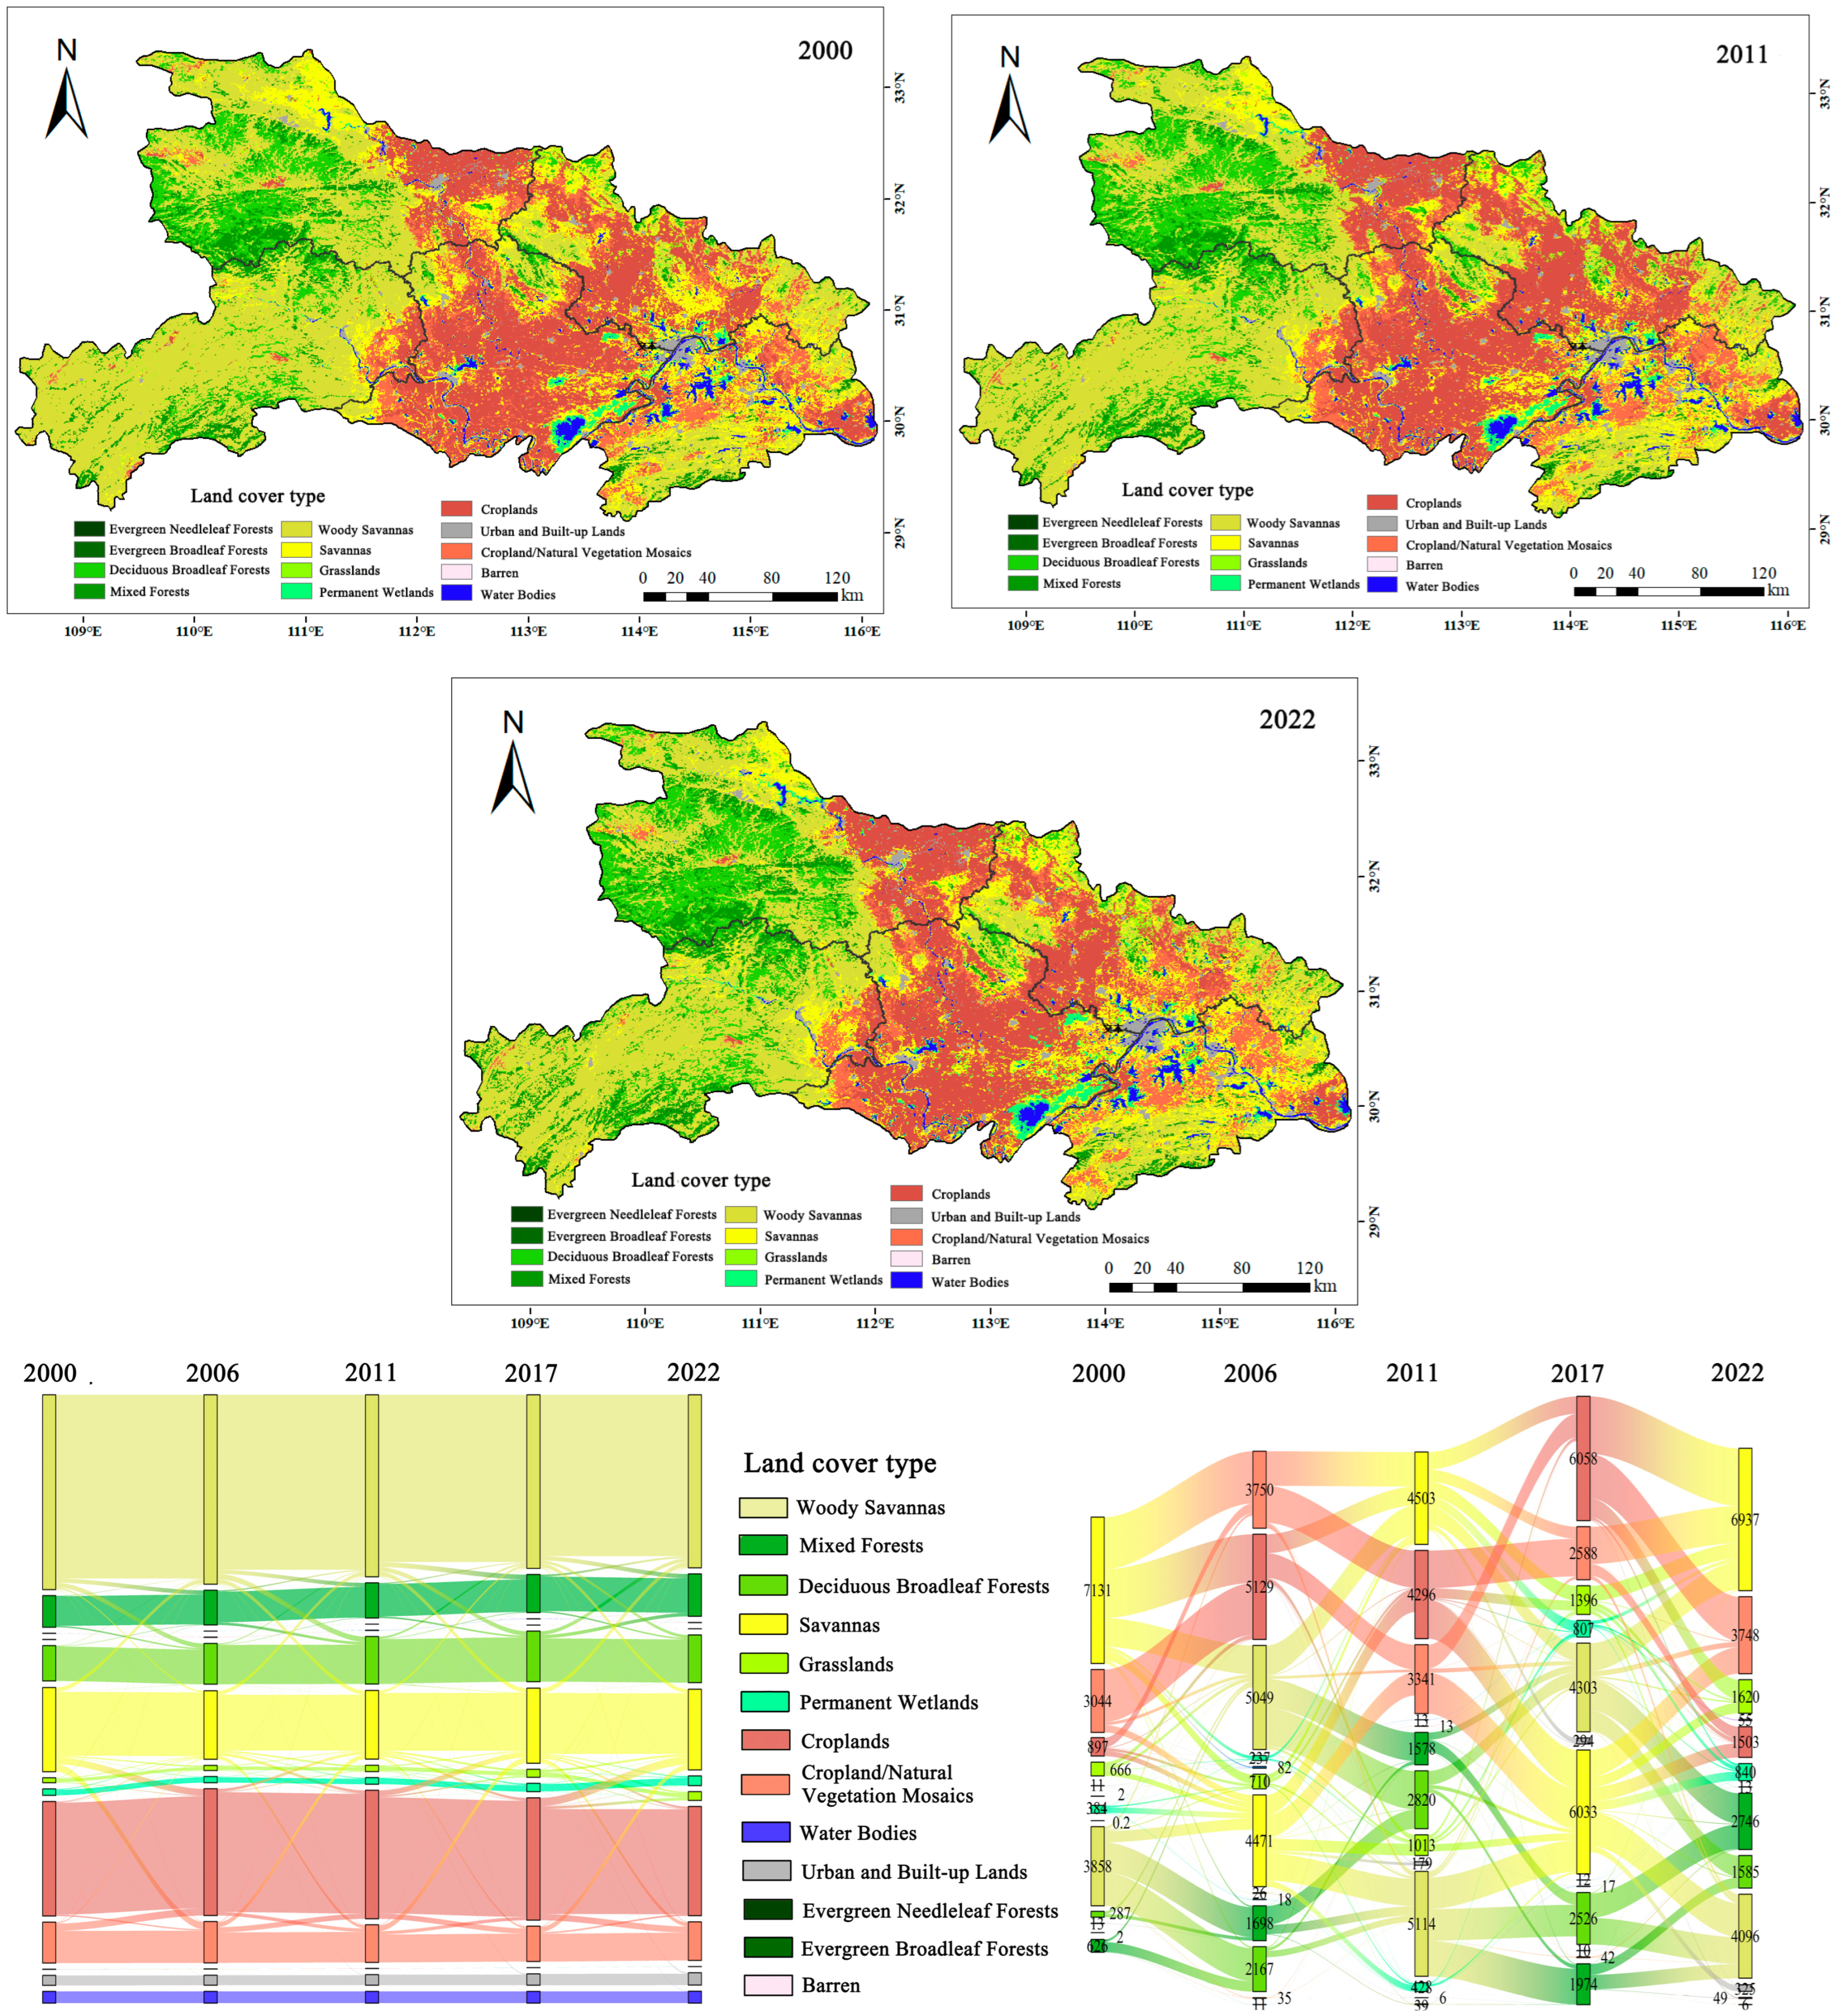
As can be seen from Figure 11, land cover in Hubei Province from 2000 to 2022 is mainly Woody Savannas, Croplands, Savannas, Cropland/Natural Vegetation Mosaics, Mixed Forests, and Deciduous Broadleaf Forests (Figure 11), accounting for 93.81% of the study area. Among them, Woody Savannas, Mixed Forests, and Deciduous Broadleaf Forests are mainly distributed in northwest and southwest Hubei, as well as some mountainous areas of Dabie and Mufu Mountains, accounting for about 48.96% of the study area; Croplands and Cropland/Natural Vegetation Mosaics are mainly distributed in the Jianghan Plain, Nanxiang Basin and some low hillock areas, such as Huanggang City, accounting for about 29.10% of the study area; In addition, Savannas are mainly found in the woodland-cropland interface area, which accounts for about 15.75% of the study area.
The analysis of land cover transfer shows that in the past 23 years, the transfer between land cover types in the four time periods in Hubei Province is generally characterized by changes in the range of changes from small to large and in the form of simple to diversified changes (Figure 11). From 2000 to 2006, Hubei Province saw the most significant increase in Croplands, with 2534 km2 and 2371 km2 transferred from Cropland/Natural Vegetation Mosaics and Savannas, respectively, and the greatest loss of Savanna, with a decrease of 7131 km2. The overall change in land cover from 2006 to 2011 was relatively smooth, with a more pronounced shift away from Woody Savannas and mainly towards Deciduous Broadleaf Forests. From 2011 to 2017, Woody Savannas in Hubei Province shrank significantly, decreasing by about 2945 km2, and the Savannas increased by 1730 km2. Land cover changed dramatically in 2017–2022, with a decrease of 4555 km2 of Croplands, mainly draining to the Savannahs and an additional area of 325 km2 of Urban and Built-up Lands.
In addition, over the past 23 years, 907 km2 of cultivated land and Woody Savannas in Hubei Province have been converted to forested land, which is mainly due to the implementation of the Returning Cultivated Land to Forestry Project in Hubei Province, which began in 2000, resulting in an increase in the area of vegetation. The addition of 880 km2 to the Urban and Built-up Lands indicates that Hubei Province has experienced rapid urbanization during the study period, but the urbanization process also constrains the vegetation NDVI, resulting in a reduction in vegetation cover.
3.2.4. Geographical Detection of Factors Influencing the NDVI
- (1)
- Factor detection
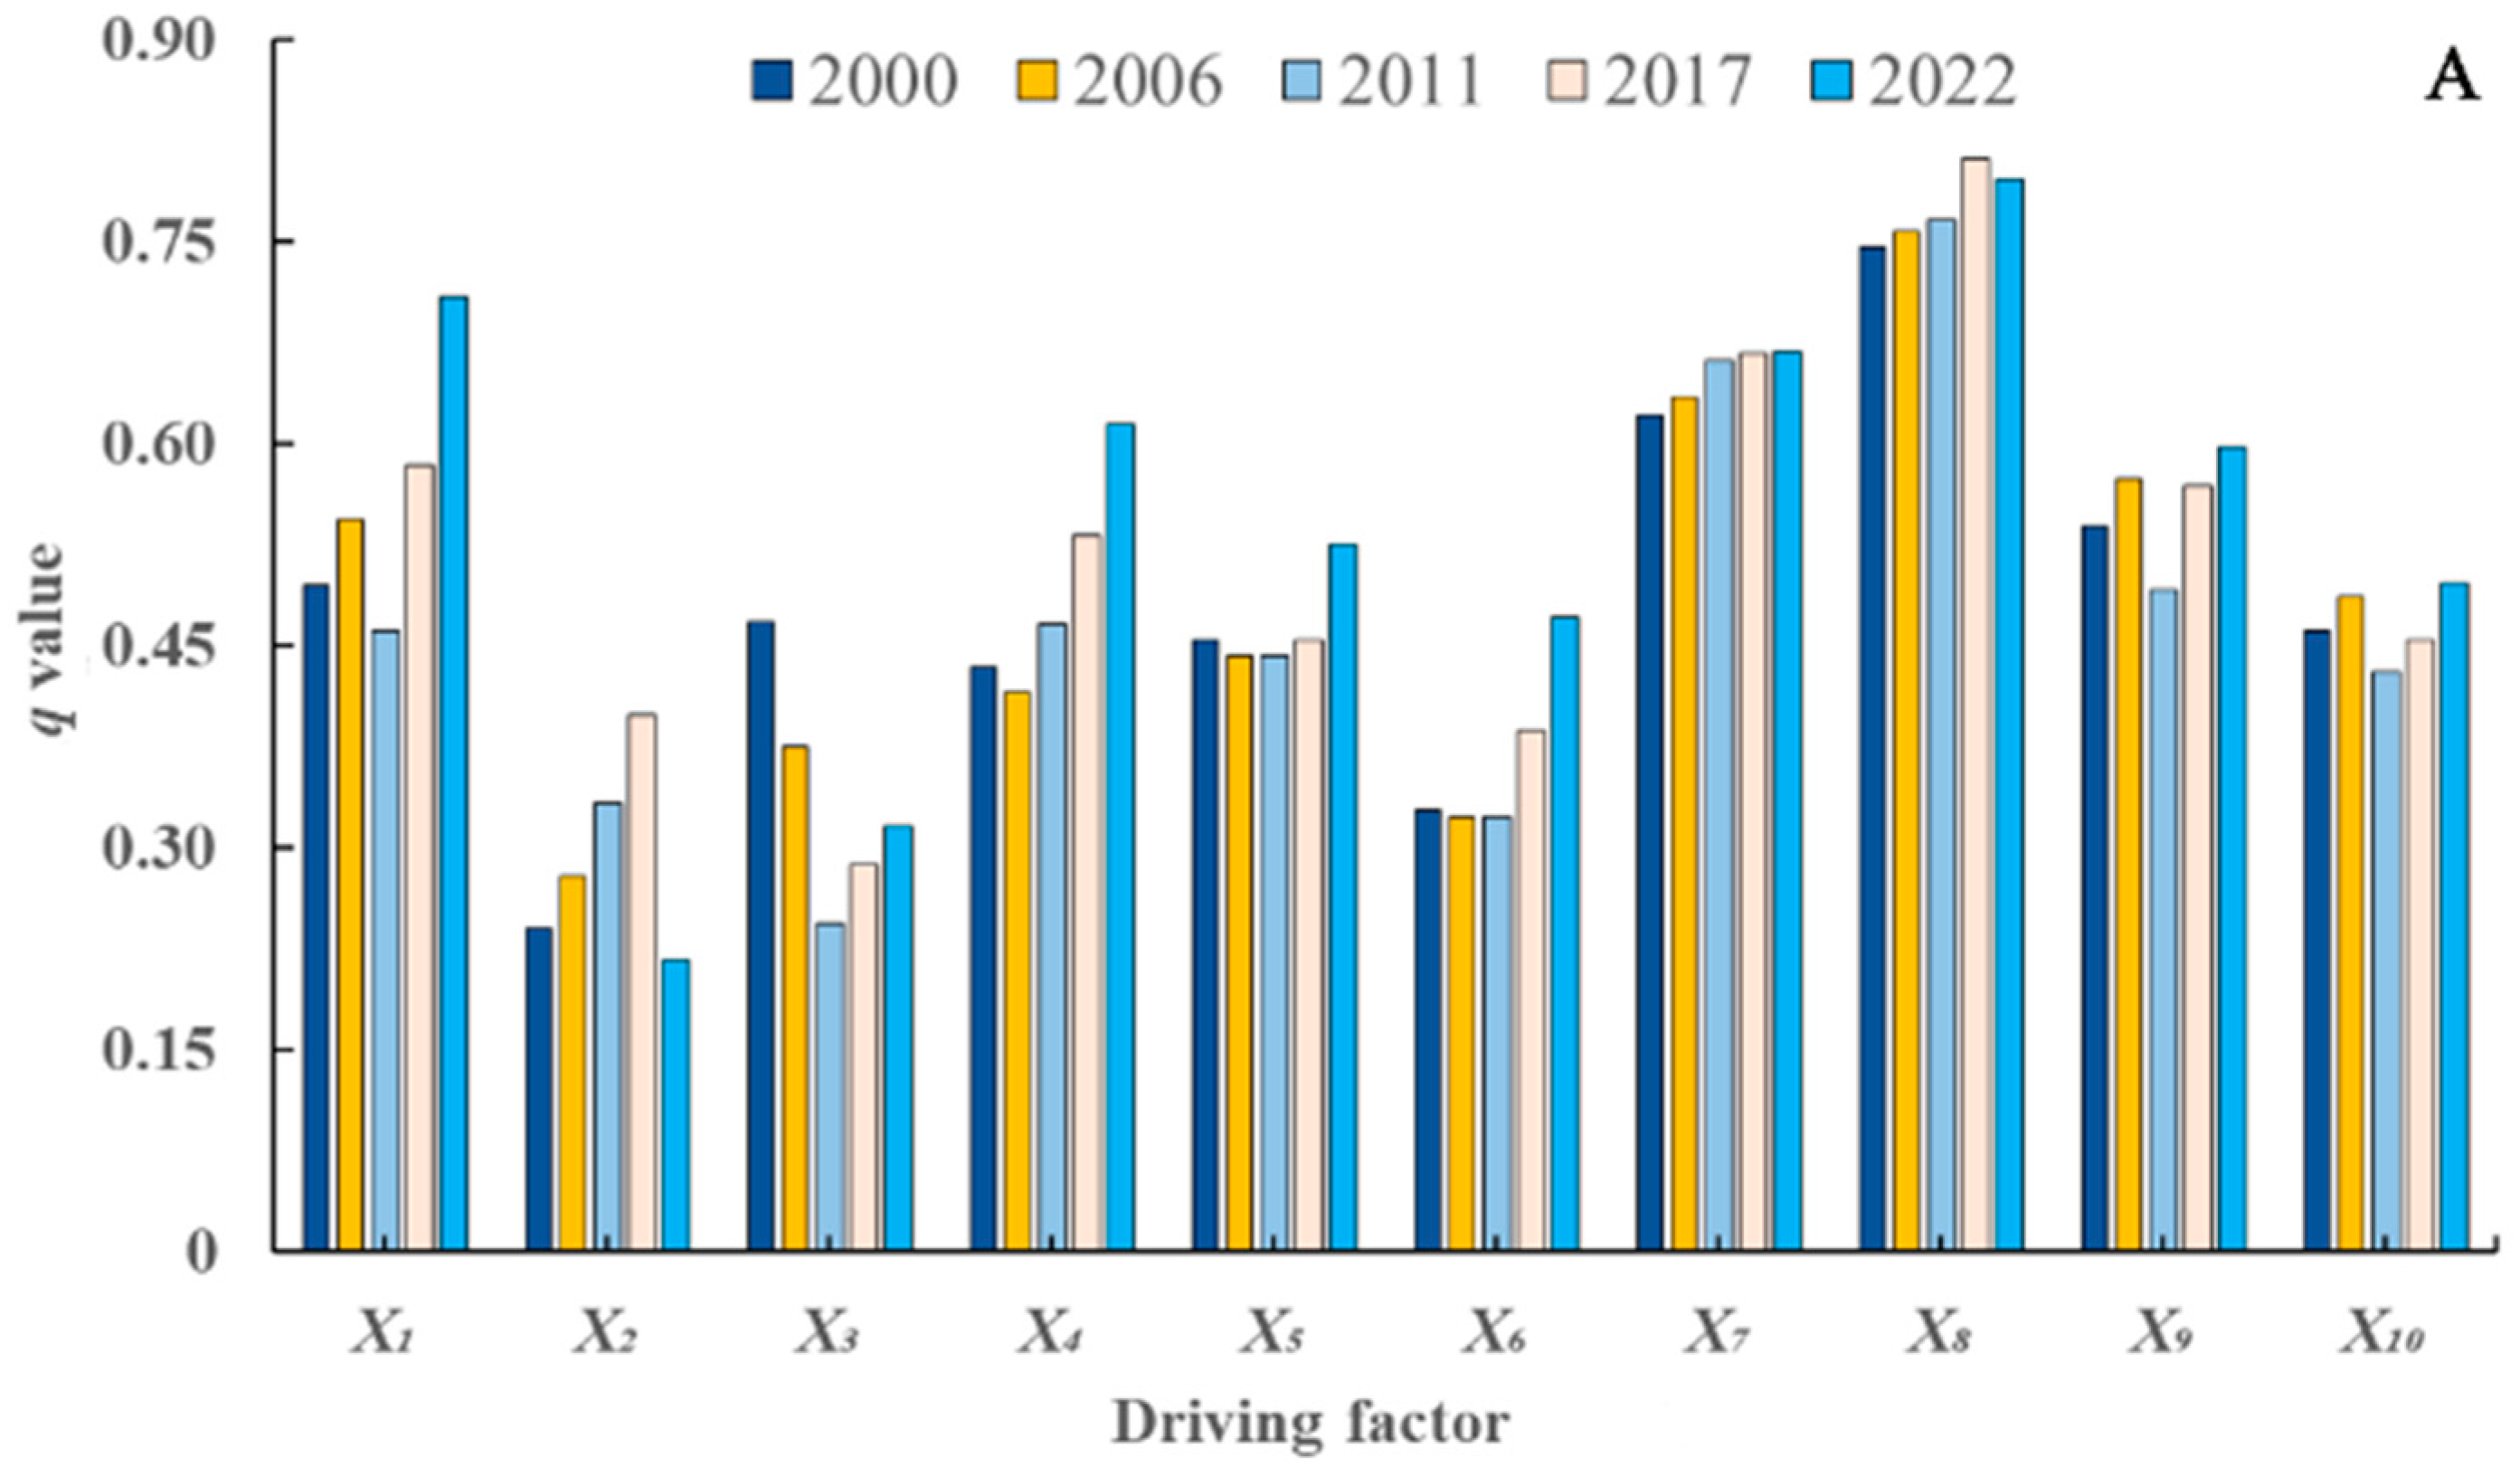
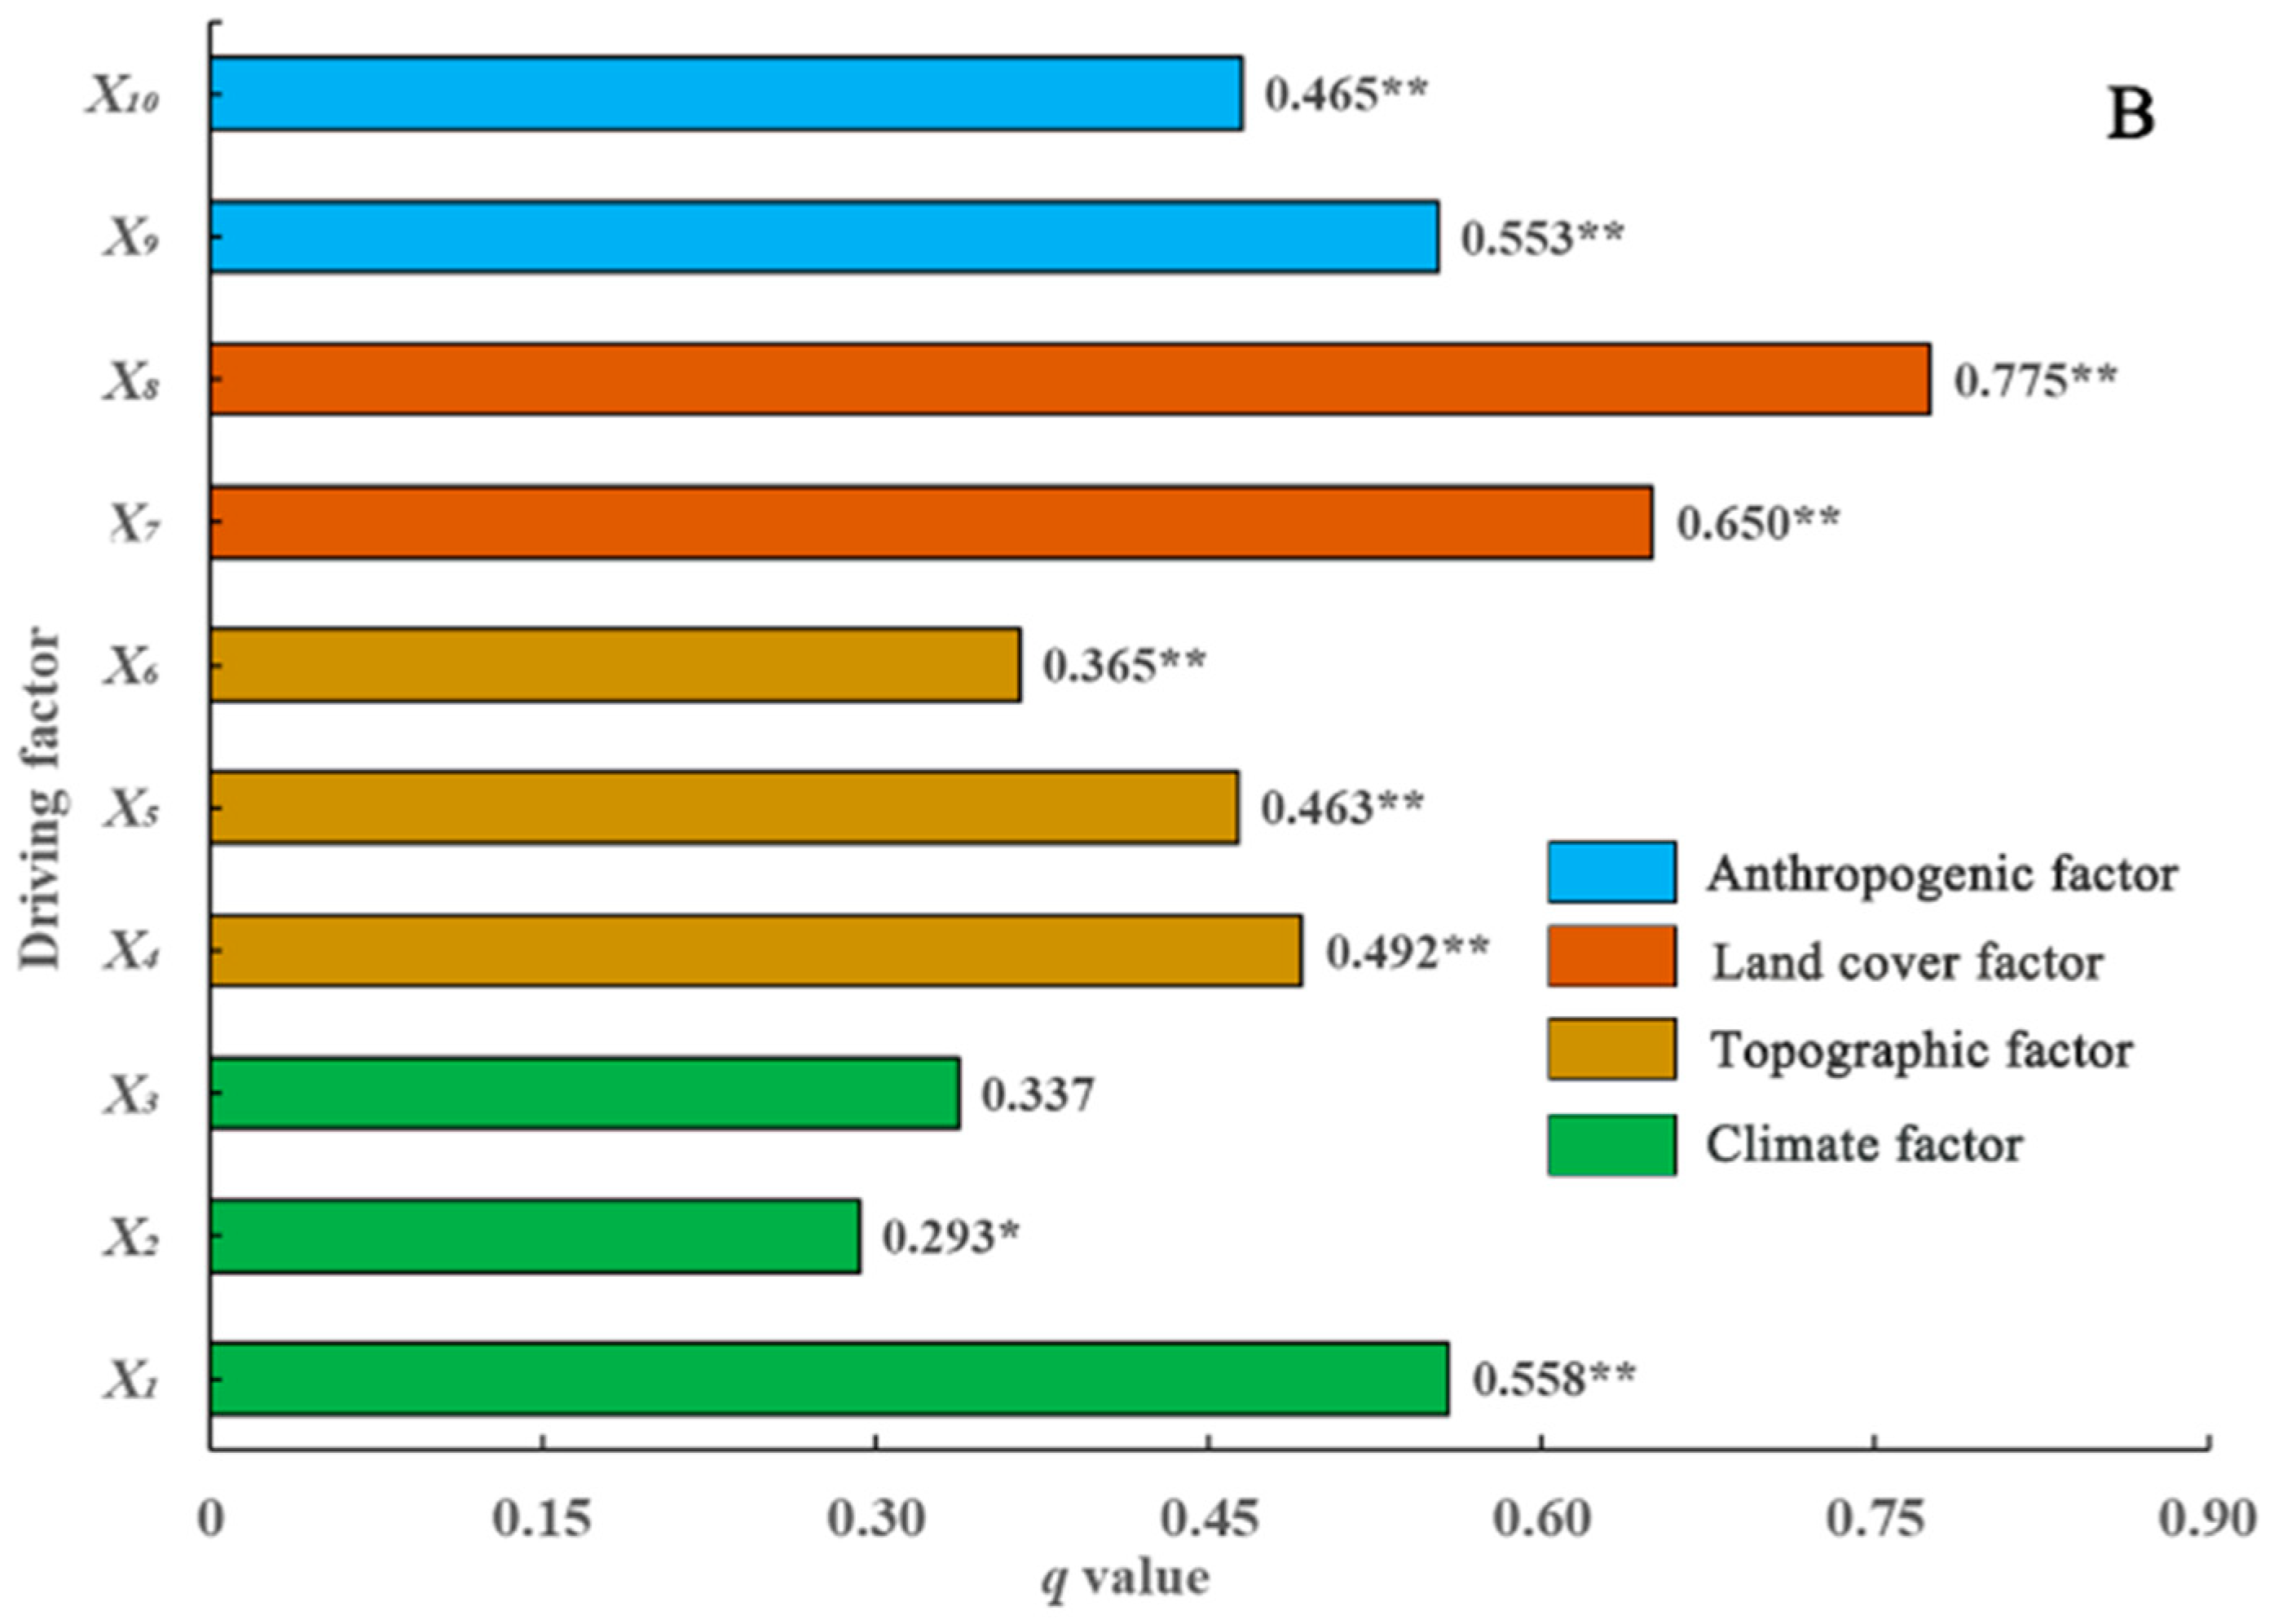
The factor detector results (q-value) revealed the magnitude of the explanatory power of each factor on the spatial differentiation of vegetation NDVI in Hubei Province. As can be seen from Figure 12, the ranking of factors influencing the distribution and change in vegetation cover in Hubei Province are as follows: land cover factor > anthropogenic factor > topographic factor > climatic factor. The explanatory power of the two driving factors, land cover type (X8) and soil type (X7), on the spatial distribution of vegetation cover, was over 60%, and the explanatory power of the land cover type (X8) factor was over 70%. Different land cover types can significantly affect the effectiveness of soil moisture, and the soil is the growth substrate for plants, which has a significant impact on the growth of vegetation and the efficiency of rainwater reuse. The average annual temperature (X1) and population density (X9) are secondary driving factors, with an explanatory power of more than 50%, and the temperature has an impact on the dissolution of nutrients in the soil and the uptake of the plant root system, and the fluctuating increase in the explanatory power of the average annual temperature from 2000 to 2022, with the explanatory power of the average annual temperature increasing to 70.7% in 2022, which indicates that the NDVI of the vegetation in Hubei Province by the temperature. The influence of temperature on the NDVI of vegetation in Hubei Province gradually increased, and land use changes caused by human activities, such as urban expansion, agricultural expansion, and deforestation, negatively affected the distribution of vegetation. Those with 30% to 50% explanatory power include elevation (X4), nighttime light (X10), and a total of five factors, slope (X5), slope direction (X6), solar radiation (X3), and precipitation (X2), have the least explanatory power for vegetation cover characterized by NDVI among the 10 drivers.
- (2)
- Interaction detection
The interaction detection mainly assesses the influence of the interaction of different driving factors on the spatial distribution pattern of vegetation NDVI in Hubei Province.
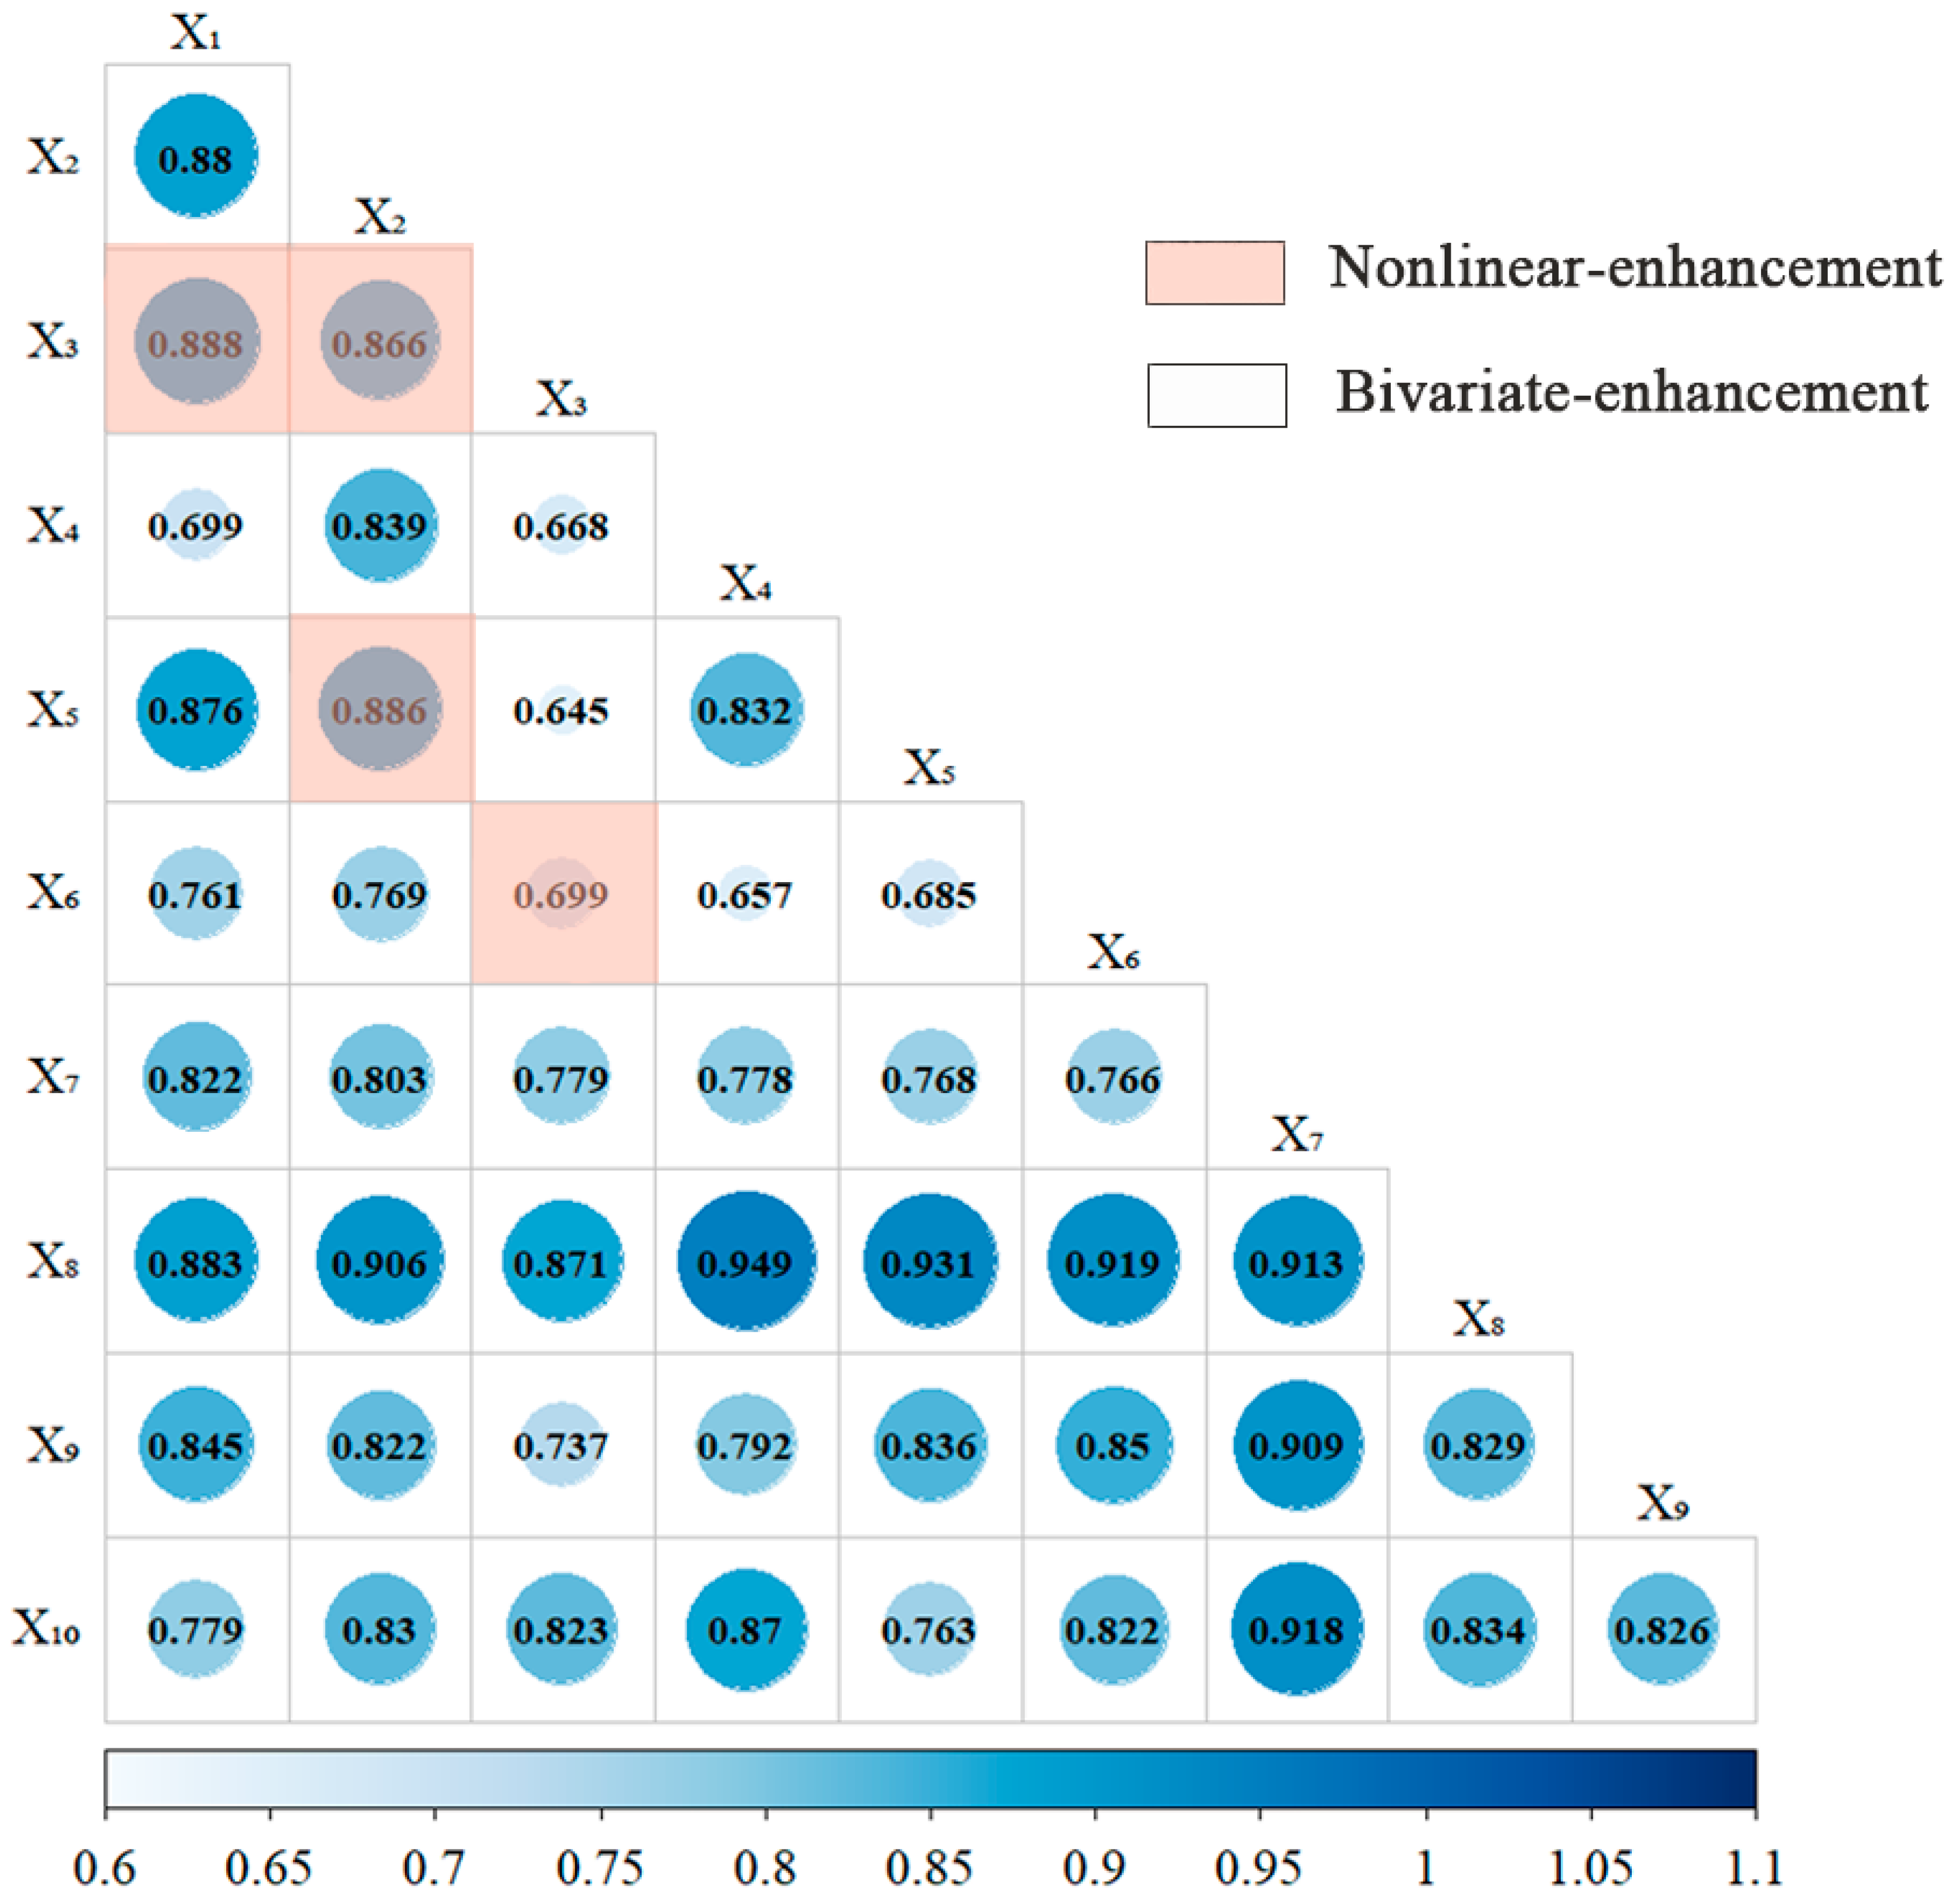
Figure 13 shows that there are only two types of interactions between the factors: bivariate enhancement and nonlinear enhancement. Most of the factor interactions showed bivariate enhancement effects, of which the nonlinear enhancements were temperature ∩ solar radiation, precipitation ∩ solar radiation, slope direction ∩ solar radiation, and precipitation ∩ slope, all of which were climatic and topographic factor interactions, suggesting a synergistic enhancement effect of the natural factors on the vegetation NDVI.
In addition, the interaction between land cover type and other factors was the most significant, with the largest q of 0.95 for the interaction with elevation, which further indicated that land cover type was the main factor influencing vegetation NDVI, and the q of 0.91 and 0.92 for the interactions of population density and nighttime lighting associated with human activities, which indicated that human activities had an important influence in interpreting the NDVI; a smaller interaction was that of solar radiation and slope.
4. Discussion
4.1. Spatiotemporal Variation Characteristics in the NDVI in Hubei Province
Hubei Province is situated in the transitional zone from the second to the third topographical tier in China, characterized by significant elevation differences. The variation in vegetation cover within the study area is influenced by a combination of natural and human factors. Temporally, the mean value of vegetation NDVI was 0.762 from 2000 to 2022 and fluctuated upward at a rate of 0.01/10a, and the vegetation NDVI showed an increasing trend, which was consistent with the results of [19,20]. In 2003, 2009, 2016, 2020, and 2022, there was a significant decline in vegetation cover. This is due to extreme droughts in 2003 and 2016, rain, snow, and ice storms in 2008, the worst flooding since 1998 in 2020, and the recovery of the New Crown epidemic in 2022 with the orderly movement of people and an increase in human activities leading to a decline in vegetation cover. Vegetation cover recovery is most significant in 2021, which is largely due to a dramatic reduction in anthropogenic as a result of closure measures during the early stages of the COVID-19 pandemic. From a spatial perspective, the state of vegetation cover in Hubei Province is mainly improving and the future evolution trend is mainly continuous improvement, which indicates that the vegetation cover in Hubei Province has not been significantly degraded during the past rapid economic development, which may be related to the climatic conditions of the middle and lower reaches of the Yangtze River in which Hubei Province is situated, and the future evolution trend is mainly continuous improvement, which indicates that Hubei Province has a certain degree of continuity in the protection of the natural environment. This may be related to the climatic conditions of the middle and lower reaches of the Yangtze River in Hubei Province. In addition, in the hilly and mountainous areas of Hubei Province, the improvement in vegetation cover is relatively large and forest degradation is low. On the contrary, small-scale degradation occurs in the plains in the middle of the area. This is closely related to the topography of the study area, where the vegetation cover of the Jianghan Plain shows a degradation trend due to the high population density and the increasing number of man-made buildings, which further suggests that high human activities can cause low NDVI and vegetation degradation.
During the period 2000–2022, the higher and more volatile areas of NDVI in Hubei Province are mainly distributed along rivers and reservoirs, in cities, and in built-up areas, which are mainly affected by human activities; the low and relatively low volatile areas are mainly distributed in higher elevation hills and mountains, which are less disturbed by human beings, with suitable water and heat conditions, and with vegetation types dominated by forested land, which have a strong resistance to soil and water runoff. The region is less disturbed by human beings and has suitable water and heat conditions [49].
At present, the percentage of areas with significant degradation trends in Hubei Province is 4.71%, but according to the results of the analysis of future development trends, there are still 27.73% of the areas with vegetation that may have the potential risk of deterioration of sustained degradation or change from improvement to degradation in the future. The region is mainly located in the Jianghan Plain, the Wuhan urban agglomeration, Xiangyang-Shiyan-Suizhou Urban Agglomerations, etc. For the potentially deteriorating areas, ecological environmental protection and management need to be strengthened in accordance with the local conditions in order to reduce the risk of vegetation degradation in the future. This is crucial to the sustainable and green development of Hubei Province.
4.2. Drivers of Spatial Variability in Vegetation NDVI
In this study, we analyzed the relationship between vegetation NDVI and climate, topography, surface, and anthropogenic factors in Hubei Province, and the results showed that surface factors were the main drivers of the spatial differentiation of vegetation cover in Hubei Province, for which the explanatory power of the land cover type and the soil type on the spatial distribution of the cover of the vegetation was 76% and 65%, respectively, which was in line with the results of the studies by [50,51]. In the last 23 years, 907 km2 of cultivated land and Woody Savannas in Hubei Province have been converted to forested land, which is mainly due to the implementation of the Returning Cultivated Land to Forestry Project in Hubei Province, which started in 2000, resulting in an increase in the area of vegetation. At the same time, rapid urbanization during the study period resulted in a significant reduction in vegetation cover in the urban and peripheral areas of the study area, with an additional area of 880 km2 in the Urban and Built-up Lands.
The influence of temperature on vegetation NDVI in Hubei Province, among the climate factors, fluctuated and increased, and the explanatory power of annual mean temperature increased to 70.7% in 2022, while the explanatory power of precipitation was the smallest, and at the level of inter-annual variability, the annual mean temperature had a closer relationship with the NDVI in Hubei Province, which was in line with the findings of [52], who concluded that the influence of temperature was greater than the effect of precipitation on vegetation in the Yangtze River Basin. Among the human-related activities, the explanatory power of population density and nighttime light index was 55% and 47%, and they were mainly negatively correlated with NDVI, with 23.98% of the regional NDVI significantly negatively correlated with population density (p < 0.05), indicating that vegetation cover tended to decrease in regions with higher population density, which was in line with the conclusion of the study conducted by [53]. In addition, the interaction of each factor showed enhanced explanatory power without any weakening or independent phenomenon [54], and the bivariate-enhancement effect accounted for 80% of the total, of which the nonlinear enhancement was all due to the interaction of climatic and topographic factors, which indicated that there was a synergistic enhancement effect of the natural factors on the NDVI of the vegetation.
In addition, the use of fairly standardized pixel-by-pixel statistics and p-value-based hypotheses in the spatial analyses in this paper has some limitations and needs to be combined with other analyses to reach final conclusions, such as the use of geostatistical methods to investigate forest ecosystems.
5. Conclusions
- (1)
- During the period over 23 years, the average value of NDVI of vegetation in Hubei Province was 0.762. The overall change in NDVI showed a fluctuating upward trend, and the growth rate was 0.01/10a (p < 0.005); the spatial distribution of NDVI showed a pattern of “low in the east and high in the west”, and the vegetation cover condition of Hubei Province was at a relatively high level, in general. The spatial change in NDVI is characterized by “large improvement in the surrounding hills and mountains and small degradation in the middle plains”; the stability of the spatial change in NDVI is characterized by “uniform distribution in general, with obvious differences between urban and rural areas and fluctuation of the river reservoirs and reservoir heights”.
- (2)
- In terms of trend prediction, 70.76% of the regions in Hubei Province are likely to maintain the same NDVI trend as that of the 2000–2022 period in the future, and the future evolution of NDVI tends to be mostly benign, accounting for 70.78% of the total; however, 27.73% of the regions may still have the potential deterioration of sustained degradation or change from improvement to degradation of vegetation cover in the future.
- (3)
- The results of partial correlation analysis showed that at the level of interannual variation, NDVI was positively correlated with precipitation and air temperature and negatively correlated with solar radiation, population density, and nighttime lighting in most of the study areas in Hubei Province, for which 23.98% of the areas had a significant negative correlation between NDVI and population density (p < 0.05) and, furthermore, among the climatic factors.
- (4)
- The results of the factor detector showed that the influencing factors of vegetation distribution and change in Hubei Province were ranked as follows: land cover factor > human activities > topographic factor > climatic factor, and land cover type and soil type were the main drivers; mean annual air temperature and population density were the secondary drivers, and the influence of air temperature on the NDVI of the vegetation in Hubei Province increased gradually, and the precipitation had the smallest explanatory power of the NDVI characterization of the vegetation cover.
- (5)
- The results of interaction detection showed that, at full scale, the interactions affecting the distribution and change characteristics of NDVI vegetation all showed two-factor enhancement or nonlinear enhancement relationships, which were significantly enhanced compared with the single-factor effects, and most of the factor interactions showed two-factor enhancement effects, and the nonlinear enhancements were all climate and topographic factor interactions. The strongest interaction explanatory power was between land cover type and elevation.
Author Contributions
Conceptualization, P.C. and H.P.; methodology, P.C.; software, P.C.; data curation, Y.X. and W.H.; writing—original draft preparation, P.C.; writing—review and editing, H.P. and W.H.; visualization, P.C. and H.Y.; supervision, H.Y.; project administration, H.Y. All authors have read and agreed to the published version of the manuscript.
Funding
This work was funded by the Youth Fund of the National Natural Science Foundation of China (No. 41902257) and the Smart Yangtze River and Hydropower Science Key Laboratory of Hubei Province Open Research Fund project (ZH2002000113).
Data Availability Statement
All data, models, or code generated or used during the study are available from the author by request ([email protected]).
Acknowledgments
The authors would like to thank the data support provided by various data source websites in the article. I would like to thank Huaming Yao and Hongzhong Pan for their guidance on the paper, and support of these projects for the paper.
Conflicts of Interest
Author Huaming Yao was employed by the company China Yangtze River Power Co., Ltd. The remaining authors declare that the research was conducted in the absence of any commercial or financial relationships that could be construed as a potential conflict of interest.
References
- Li, X.; Xin, Z.; Yang, J.; Liu, J. The spatiotemporal changes and influencing factors of vegetation NDVI in the Hehuang Valley of Qinghai Province from 2000 to 2020. J. Soil Water Conserv. 2023, 13, 79–90. [Google Scholar]
- Lai, J.-L.; Qi, S.; Cui, R.-R.; Liao, R.-E.; Tang, Y.; Li, P. Analysis of Vegetation Change and Influencing Factors in Southwest Alpine Canyon Area. Huan Jing Ke Xue = Huanjing Kexue 2023, 44, 6833–6846. [Google Scholar] [PubMed]
- Zhu, L.; Sun, S.; Li, Y.; Liu, X.; Hu, K. Effects of Climate Change and Anthropogenic Activity on the Vegetation Greening in the Liaohe River Basin of Northeastern China. Ecol. Indic. 2023, 148, 110105. [Google Scholar] [CrossRef]
- Yang, J.; Wan, Z.; Borjigin, S.; Zhang, D.; Yan, Y.; Chen, Y.; Gu, R.; Gao, Q. Changing Trends of NDVI and Their Responses to Climatic Variation in Different Types of Grassland in Inner Mongolia from 1982 to 2011. Sustainability 2019, 11, 3256. [Google Scholar] [CrossRef]
- Liu, D.; Pan, P.; Fu, J.; OUYANG, X. Spatiotemporal variation and driving factor of vegetation coverage in southern Jiangxi Province, China from 2000 to 2020. Chin. J. Appl. Ecol. 2023, 34, 2919–2928. [Google Scholar]
- Wang, J.; Wang, K.; Zhang, M.; Zhang, C. Impacts of Climate Change and Human Activities on Vegetation Cover in Hilly Southern China. Ecol. Eng. 2015, 81, 451–461. [Google Scholar] [CrossRef]
- Liu, S.; Li, W.; Qiao, W.; Wang, Q.; Hu, Y.; Wang, Z. Effect of Natural Conditions and Mining Activities on Vegetation Variations in Arid and Semiarid Mining Regions. Ecol. Indic. 2019, 103, 331–345. [Google Scholar] [CrossRef]
- Gao, S.; Dong, G.; Jiang, X.; Nie, T.; Guo, X. Analysis of Factors Influencing Spatiotemporal Differentiation of the NDVI in the Upper and Middle Reaches of the Yellow River from 2000 to 2020. Front. Environ. Sci. 2023, 10, 1072430. [Google Scholar] [CrossRef]
- Shi, S.; Li, W.; Lin, X.; Zhai, Y.; Ding, Y. Spatiotemporal Variations of Vegetation NDVl and Influencing Factors in Heilonjiang Province. Res. Soil Water Conserv. 2023, 30, 294–305. [Google Scholar]
- Zhang, L.; Cong, Z.; Zhang, D.; Li, Q. Response of Vegetation Dynamics to Climatic Variables across a Precipitation Gradient in the Northeast China Transect. Hydrol. Sci. J. 2017, 62, 1517–1531. [Google Scholar] [CrossRef]
- Jia, X.; You, G.; McKenzie, S.; Zou, C.; Gao, J.; Wang, A. Inter-Annual Variations of Vegetation Dynamics to Climate Change in Ordos, Inner Mongolia, China. PLoS ONE 2022, 17, e0264263. [Google Scholar] [CrossRef]
- Zhang, Y.; Zhang, L.; Wang, J.; Dong, G.; Wei, Y. Quantitative Analysis of NDVI Driving Factors Based on the Geographical Detector Model in the Chengdu-Chongqing Region, China. Ecol. Indic. 2023, 155, 110978. [Google Scholar] [CrossRef]
- Liang, Z.; Sun, R.; Duan, Q. Spatiotemporal variation of NDVI in the Yellow River water conservation zone and its driving factors. Prog. Geogr. 2023, 42, 1717–1732. [Google Scholar] [CrossRef]
- Pan, J.; Ren, Z.; Xu, S.; Li, P.; Zhang, X.; Xu, Y.; Ren, Z. Variation Characteristics of NDVl of Different Vegetation Types in Ningxia, China and Their Responses to Climate. J. Earth Sci. Environ. 2023, 45, 819–832. [Google Scholar]
- Cetin, M.; Ozenen Kavlak, M.; Senyel Kurkcuoglu, M.A.; Bilge Ozturk, G.; Cabuk, S.N.; Cabuk, A. Determination of land surface temperature and urban heat island effects with remote sensing capabilities: The case of Kayseri, Türkiye. Nat. Hazards 2024, 120, 5509–5536. [Google Scholar] [CrossRef]
- Pettorelli, N.; Vik, J.O.; Mysterud, A.; Gaillard, J.-M.; Tucker, C.; Stenseth, N.C. Using the Satellite-Derived Normalized Difference Vegetation Index (NDVI) to Assess Ecological Responses to Environmental Change. Trends Ecol. Evol. 2005, 20, 503–510. [Google Scholar] [CrossRef]
- Sun, H.; Wang, C.; Niu, Z. Analysis of the Vegetation Cover Change and the Relationship between NDVI and Environmental Factors by Using NOAA Time Series Data. J. Remote Sens. Beijing 1998, 2, 210–216. [Google Scholar]
- Ma, M.; Wang, J.; Wang, X. Advance in the Inter-Annual Variability of Vegetation and Its Relation to Climate Based on Remote Sensing. J. Remote Sens. Beijing 2006, 10, 421. [Google Scholar]
- Yuan, M.; Zhou, L.; Lin, A.; Zhu, H. Analyzing dynamic vegetation change and response to climatic factors in Hubei Province, China. Acta Ecol. Sin. 2016, 36, 5315–5323. [Google Scholar]
- Zhao, W.; Li, J.; Chu, L.; Wang, T.; Li, Z.; Cai, C. Analysis of spatial and temporal variations in vegetation index and its driving force in Hubei Province in the last 10 years. Acta Ecol. Sin. 2019, 39, 7722–7736. [Google Scholar]
- Dastigerdi, M.; Nadi, M.; Sarjaz, M.R.; Kiapasha, K. Trend analysis of MODIS NDVI time series and its relationship to temperature and precipitation in Northeastern of Iran. Env. Monit Assess 2024, 196, 346. [Google Scholar] [CrossRef]
- Degerli, B.; Çetin, M. Evaluation from rural to urban scale for the effect of NDVI-NDBI indices on land surface temperature, in Samsun, Türkiye. Turk. J. Agric. Food Sci. Technol. 2022, 10, 2446–2452. [Google Scholar] [CrossRef]
- Chen, T.; Xia, J.; Zou, L.; Hong, S. Quantifying the Influences of Natural Factors and Human Activities on NDVI Changes in the Hanjiang River Basin, China. Remote Sens. 2020, 12, 3780. [Google Scholar] [CrossRef]
- Zhong, H.; Wang, H. Temporal and spatial variation of normalized vegetation index in Hubei Province from 2007 to 2016. J. Cent. China Norm. Univ. (Nat. Sci.) 2018, 52, 582–588. [Google Scholar]
- Whetton, R.; Zhao, Y.; Shaddad, S.; Mouazen, A.M. Nonlinear parametric modelling to study how soil properties affect crop yields and NDVI. Comput. Electron. Agric. 2017, 138, 127–136. [Google Scholar] [CrossRef]
- Cetin, M. The effect of urban planning on urban formations determining bioclimatic comfort area’s effect using satellitia imagines on air quality: A case study of Bursa city. Air Qual. Atmos. Health 2019, 12, 1237–1249. [Google Scholar] [CrossRef]
- Degerli, B.; Çetin, M. Using the remote sensing method to simulate the land change in the year 2030. Turk. J. Agric. Food Sci. Technol. 2022, 10, 2453–2466. [Google Scholar] [CrossRef]
- Guerrero FJ, D.T.; Hinojosa-Corona, A.; Kretzschmar, T.G. A comparative study of NDVI values between north-and south-facing slopes in a semiarid mountainous region. IEEE J. Sel. Top. Appl. Earth Obs. Remote Sens. 2016, 9, 5350–5356. [Google Scholar] [CrossRef]
- Fan, J.; Fan, Y.; Cheng, J.; Wu, H.; Yan, Y.; Zheng, K.; Shi, M.; Yang, Q. The Spatio-Temporal Evolution Characteristics of the Vegetation NDVI in the Northern Slope of the Tianshan Mountains at Different Spatial Scales. Sustainability 2023, 15, 6642. [Google Scholar] [CrossRef]
- Chen, S.; Zhu, Z.; Liu, X.; Yang, L. Variation in Vegetation and Its Driving Force in the Pearl River Delta Region of China. Int. J. Environ. Res. Public Health 2022, 19, 10343. [Google Scholar] [CrossRef]
- Li, Q.; Zhou, Y.; Wang, L.; Zuo, Q.; Yi, S.; Liu, J.; Su, X.; Xu, T.; Jiang, Y. The Link between Landscape Characteristics and Soil Losses Rates over a Range of Spatiotemporal Scales: Hubei Province, China. Int. J. Environ. Res. Public Health 2021, 18, 11044. [Google Scholar] [CrossRef] [PubMed]
- Chen, J.; Song, X.; Zang, L.; Mao, F.; Yin, J.; Zhang, Y. Spatio-temporal association mining of intercity PM2. 5 pollution: Hubei Province in China as an example. Environ. Sci. Pollut. Res. 2023, 30, 7256–7269. [Google Scholar] [CrossRef] [PubMed]
- Zhang, Y.; Guo, L.; Chen, Y.; Shi, T.; Luo, M.; Ju, Q.; Zhang, H.; Wang, S. Prediction of Soil Organic Carbon Based on Landsat 8 Monthly NDVI Data for the Jianghan Plain in Hubei Province, China. Remote Sens. 2019, 11, 1683. [Google Scholar] [CrossRef]
- Guo, H.; Wang, B.; Niu, X. A Plan for a Forest Ecosystem Observation Research Network, Based on GIS. Hubei Prov. Acta Ecol. Sin. China 2015, 35, 6829–6837. [Google Scholar]
- Peng, S. 1-Km Monthly Precipitation Dataset for China (1901–2022); National Tibetan Plateau Data Center: Beijing, China, 2020. [Google Scholar]
- Peng, S. 1-Km Monthly Mean Temperature Dataset for China (1901–2022); National Tibetan Plateau Data Center: Beijing, China, 2019. [Google Scholar]
- Wang, K. Homogeneous Grid Dataset of Chinaese Land Surface Observation (Surface Solar Radiation, Surface Wind Speed, Relative Humidity and Land Surface Evapotranspiration); National Tibetan Plateau Data Center: Beijing, China, 2022. [Google Scholar]
- Yang, J.; Huang, X. The 30 m Annual Land Cover Datasets and Its Dynamics in China from 1985 to 2022. 2023. Available online: https://zenodo.org/records/8176941 (accessed on 25 February 2024).
- Chen, Z.; Yu, B.; Yang, C.; Zhou, Y.; Yao, S.; Qian, X.; Wang, C.; Wu, B.; Wu, J. An Extended Time Series (2000–2018) of Global NPP-VIIRS-like Nighttime Light Data from a Cross-Sensor Calibration. Earth Syst. Sci. Data 2021, 13, 889–906. [Google Scholar] [CrossRef]
- Sen, P.K. Estimates of the Regression Coefficient Based on Kendall’s Tau. J. Am. Stat. Assoc. 1968, 63, 1379–1389. [Google Scholar] [CrossRef]
- Lie, Q.; Hu, Z.; Wang, J.; Zhang, Y.; Wu, G. Spatiotemporal Dynamics of NDVI in China from 1985 to 2015: Ecosystem Variation, Regional Differences, and Response to Climatic Factors. Acta Ecol. Sin. 2023, 43, 6378–6391. [Google Scholar]
- Alavi, N.; King, D. Evaluating the Relationships of Inter-Annual Farmland Vegetation Dynamics with Biodiversity Using Multi-Spatial and Multi-Temporal Remote Sensing Data. Remote Sens. 2020, 12, 1479. [Google Scholar] [CrossRef]
- Jiang, W.; Yuan, L.; Wang, W.; Cao, R.; Zhang, Y.; Shen, W. Spatio-Temporal Analysis of Vegetation Variation in the Yellow River Basin. Ecol. Indic. 2015, 51, 117–126. [Google Scholar] [CrossRef]
- Rivas-Tabares, D.A.; Saa-Requejo, A.; Martín-Sotoca, J.J.; Tarquis, A.M. Multiscaling NDVI Series Analysis of Rainfed Cereal in Central Spain. Remote Sens. 2021, 13, 568. [Google Scholar] [CrossRef]
- Duo, A.; Zhao, W.; Gong, Z.; Zhang, M.; Fan, Y. Temporal analysis of climate change and its relationship with vegetation cover on the north China plain from 1981 to 2013. Acta Ecol. Sin. 2016, 37, 576–592. [Google Scholar]
- Wang, F.; Ma, Y.; Darvishzadeh, R.; Han, C. Annual and Seasonal Trends of Vegetation Responses and Feedback to Temperature on the Tibetan Plateau since the 1980s. Remote Sens. 2023, 15, 2475. [Google Scholar] [CrossRef]
- Jinfeng, W.; Chengdong, X. Geodetector: Principle and Prospective. Acta Geogr. Sin. 2017, 72, 116–134. [Google Scholar]
- Wang, J.-F.; Zhang, T.-L.; Fu, B.-J. A Measure of Spatial Stratified Heterogeneity. Ecol. Indic. 2016, 67, 250–256. [Google Scholar] [CrossRef]
- Fan, J.; Xu, Y.; Ge, H.; Yang, W. Vegetation Growth Variation in Relation to Topography in Horqin Sandy Land. Ecol. Indic. 2020, 113, 106215. [Google Scholar] [CrossRef]
- Feng, X.; Zeng, Z.; Jing, M.; Gao, K.; Xiao, Y. Influence of driving factors under different vegetation indices of NDVI and EVI in Guangdong-Hong Kong-Macao Greater Bay Area. J. Huazhong Agric. Univ. 2023, 42, 116–124. [Google Scholar]
- Chen, X.; Zhao, X.; Zhang, J.; Wang, R.; Lu, J. Variation of NDVI spatio-temporal characteristics and its driving factors based on geodetector model in Horqin Sandy Land, China. Chin. J. Plant Ecol. 2023, 47, 1082–1093. [Google Scholar] [CrossRef]
- Qu, S.; Wang, L.; Lin, A.; Yu, D.; Yuan, M.; Li, C. Distinguishing the Impacts of Climate Change and Anthropogenic Factors on Vegetation Dynamics in the Yangtze River Basin, China. Ecol. Indic. 2020, 108, 105724. [Google Scholar] [CrossRef]
- Seto, K.C.; Fragkias, M. Quantifying Spatiotemporal Patterns of Urban Land-Use Change in Four Cities of China with Time Series Landscape Metrics. Landsc. Ecol. 2005, 20, 871–888. [Google Scholar] [CrossRef]
- Tang, J.; Xu, M.; Mo, Y.; Wu, W.; Zhang, J.; Li, Z.; Bao, Y. Spatial and temporal variation in normal difference vegetation index of vegetation in Liaoning Province from the perspective of ecogeographic zoning. Chin. J. Appl. Ecol. 2023, 34, 3271–3278. [Google Scholar]
Figure 1.
Overview of the study area.

Figure 2.
Interannual changes of NDVI in Hubei Province from 2000 to 2022.

Figure 3.
Spatial distribution of NDVI in Hubei Province from 2000 to 2022.

Figure 4.
The spatiotemporal variation trend in NDVI in Hubei Province from 2000 to 2022.

Figure 5.
Spatial fluctuation characteristics of NDVI in Hubei Province from 2000 to 2022.

Figure 6.
Persistence characteristics of NDVI in Hubei Province from 2000 to 2022.

Figure 7.
Future evolutionary trends of NDVI in Hubei Province.

Figure 8.
Spatial distribution of partial correlation coefficient (A–C) and partial correlation significance (D–F) between NDVI and climate factors in Hubei Province from 2000 to 2022.
Figure 8.
Spatial distribution of partial correlation coefficient (A–C) and partial correlation significance (D–F) between NDVI and climate factors in Hubei Province from 2000 to 2022.

Figure 9.
Spatial distribution of dominant climate factors of NDVI change in Hubei Province from 2000 to 2022.
Figure 9.
Spatial distribution of dominant climate factors of NDVI change in Hubei Province from 2000 to 2022.

Figure 10.
Population Density and night Light Index Distribution and partial correlation between NDVI and them in Hubei Province from 2000 to 2022.
Figure 10.
Population Density and night Light Index Distribution and partial correlation between NDVI and them in Hubei Province from 2000 to 2022.

Figure 11.
The spationtemporal variation in NDVI in different land cover from 2000 to 2022.

Figure 12.
Influence of driving factors (q value) for Normalized Difference Vegetation Index (NDVI) in Hubei Province. ((A) q value in 2000, 2006, 2011, 2017and 2022. (B) Mean value of q during 2000–2022. X1–X10, driving factors name, see Table 3. * p < 0.05; ** p < 0.01).
Figure 12.
Influence of driving factors (q value) for Normalized Difference Vegetation Index (NDVI) in Hubei Province. ((A) q value in 2000, 2006, 2011, 2017and 2022. (B) Mean value of q during 2000–2022. X1–X10, driving factors name, see Table 3. * p < 0.05; ** p < 0.01).


Figure 13.
Interaction of driving factors in Hubei Province. (X1–X10, driving factors’ name, see Table 3. Circle size denotes the magnitude of the interaction, numbers in circle indicates q value of driving factors interaction).
Figure 13.
Interaction of driving factors in Hubei Province. (X1–X10, driving factors’ name, see Table 3. Circle size denotes the magnitude of the interaction, numbers in circle indicates q value of driving factors interaction).


Table 1.
Data source and data preprocessing.
| Data Type | Code | Data Content | Year | Resolution | Data Source | Product |
|---|---|---|---|---|---|---|
| Remote sensing data | Y | MODIS NDVI | 2000–2022 | 1 km | NASA website (https://ladsweb.modaps.eosdis.nasa.gov/search/ accessed on 25 February 2024) | MOD13Q |
| Climate data | X1 | Total annual precipitation | 2000–2022 | 1 km | National Tibetan Plateau Science Data Center (https://data.tpdc.ac.cn accessed on 25 February 2024) | Peng, S. [35] |
| X2 | Annual mean temperature | 2000–2022 | 1 km | National Tibetan Plateau Science Data Center (https://data.tpdc.ac.cn accessed on 25 February 2024) | Peng, S. [36] | |
| X3 | Solar radiation | 2000–2022 | 1 km | National Tibetan Plateau Science Data Center (https://data.tpdc.ac.cn accessed on 25 February 2024) | Wang, K. [37] | |
| Topographic data | X4 | elevation | 2022 | 1 km | NASA website (https://ladsweb.modaps.eosdis.nasa.gov/search/ accessed on 25 February 2024) | SRTM 30 m DEM |
| X5 | Slope | 2022 | 1 km | Derived from elevation data | / | |
| X6 | Aspect | 2022 | 1 km | Derived from elevation data | / | |
| Land cover data | X7 | Soil type | 2022 | 1 km | Usda website (https://www.usda.gov/ accessed on 25 February 2024) | OpenLandMap |
| X8 | Land cover type | 2000–2022 | 1 km | Zenodo (https://www.zenodo.org/ accessed on 25 February 2024) | Jie Yang, & Xin Huang [38] | |
| Anthropogenic data | X9 | Population density | 2000–2020 | 1 km | The Word Pop (https://hub.worldpop.org/ accessed on 25 February 2024) | WorldPop Global Project Population Data |
| 2021–2022 | 1 km | Hubei statistical yearbook (https://tjj.hubei.gov.cn/tjsj/ accessed on 25 February 2024) | Provincial statistical yearbook | |||
| X10 | nighttime light | 2000–2022 | 1 km | National Earth System Science Data Center (http://www.geodata.cn/ accessed on 25 February 2024) | Chen Zuoqi et al. [39] |
Table 2.
Grading of Change Trends.
| NDVI Trend Characteristics | ||
|---|---|---|
| > 0 | 2.58≤ | Extremely significant improvement |
| 1.96≤ | Significant improvement | |
| <1.96 | non-significant improvement | |
| 0 < | <1.96 | non-significant degradation |
| 1.96≤ | Significant degradation | |
| 2.58≤ | Extremely significant degradation |
Table 3.
Type of independent variable interaction.
| Interaction Types | Interaction Criteria |
|---|---|
| Bivariate-enhancement | |
| Nonlinear-enhancement | |
| Univariate-weakening | |
| Nonlinear-weakening | |
| Independent |
Disclaimer/Publisher’s Note: The statements, opinions and data contained in all publications are solely those of the individual author(s) and contributor(s) and not of MDPI and/or the editor(s). MDPI and/or the editor(s) disclaim responsibility for any injury to people or property resulting from any ideas, methods, instructions or products referred to in the content. |
© 2024 by the authors. Licensee MDPI, Basel, Switzerland. This article is an open access article distributed under the terms and conditions of the Creative Commons Attribution (CC BY) license (https://creativecommons.org/licenses/by/4.0/).
Share and Cite
MDPI and ACS Style
Chen, P.; Pan, H.; Xu, Y.; He, W.; Yao, H. Spatial-Temporal Evolution Characteristics and Driving Force Analysis of NDVI in Hubei Province, China, from 2000 to 2022. Forests 2024, 15, 719. https://doi.org/10.3390/f15040719
AMA Style
Chen P, Pan H, Xu Y, He W, Yao H. Spatial-Temporal Evolution Characteristics and Driving Force Analysis of NDVI in Hubei Province, China, from 2000 to 2022. Forests. 2024; 15(4):719. https://doi.org/10.3390/f15040719
Chicago/Turabian StyleChen, Peng, Hongzhong Pan, Yaohui Xu, Wenxiang He, and Huaming Yao. 2024. "Spatial-Temporal Evolution Characteristics and Driving Force Analysis of NDVI in Hubei Province, China, from 2000 to 2022" Forests 15, no. 4: 719. https://doi.org/10.3390/f15040719
Note that from the first issue of 2016, this journal uses article numbers instead of page numbers. See further details here.