
Predicting Fine Dead Fuel Load of Forest Floors Based on Image Euler Numbers

1
School of Biology Sciences, Guizhou Education University, Gaoxin St. 115, Guiyang 550018, China
2
Key Laboratory of Ecology and Management on Forest Fire in Universities of Guizhou Province, Guizhou Education University, Gaoxin St. 115, Guiyang 550018, China
*
Author to whom correspondence should be addressed.
Forests 2024, 15(4), 726; https://doi.org/10.3390/f15040726
Submission received: 12 February 2024
/
Revised: 11 April 2024
/
Accepted: 16 April 2024
/
Published: 21 April 2024
(This article belongs to the Special Issue Forest Fire Regimes and Forest Fuels: Characterization and Modelling in a Climate Change Scenario)
Abstract
:The fine dead fuel load on forest floors is the most critical classification feature in fuel description systems, affecting several parameters in the manifestation of wildland fires. An accurate determination of this fine dead fuel load contributes substantially to effective wildland fire prevention, monitoring, and suppression. This study investigated the viability of incorporating image Euler numbers into predictive models of fine dead fuel load via the taking photos method. Pinus massoniana needles and Quercus fabri broad leaves—typical fuel types in karst areas—served as the research subjects. Accurate field data were collected in the Tianhe Mountain forests, China, while artificial fine dead fuelbeds of differing loads were constructed in the laboratory. Images of the artificial fuelbeds were captured and uniformly digitized according to various conversion thresholds. Thereafter, the Euler numbers were extracted, their relationship with fuel load was analyzed, and this relationship was applied to generate three load-prediction models based on stepwise regression, nonlinear fitting, and random forest algorithms. The Euler number had a significant relationship with both P. massoniana and Q. fabri fuel loads. At low conversion thresholds, the Euler number was negatively correlated with fuel load, whereas a positive correlation was recorded when this threshold exceeded a certain value. The random forest model showed the best prediction performance, with mean relative errors of 9.35% and 14.54% for P. massoniana and Q. fabri, respectively. The nonlinear fitting model displayed the next best performance, while the stepwise regression model exhibited the largest error, which was significantly different from that of the random forest model. This study is the first to propose the use of image features to predict the fine fuel load on a surface. The results are more objective, accurate, and time-saving than current fuel load estimates, benefiting fuel load research and the scientific management of wildland fires.
1. Introduction
Fine dead surface fuels are generally considered to be the most important fuel class in wildland fires. They are surface fuels with a diameter of less than 6 mm that are flammable, can spread fast, have a high combustion efficiency, and possess a large surface-area-to-volume ratio [1,2]. Aside from serving as the material basis for surface fires, they also have a marked impact on the formation of canopy fires [3,4]. The fine dead fuel load is an important characteristic of surface fuels—calculated as the absolute dry mass per unit area—and has a significant impact on the occurrence and behavior of wildland fires [5]. Almost all wildland fire management systems worldwide require this load value as an input, making it the most important classification feature in fuel descriptions [6]. Load is also important for other land management issues, such as quantifying carbon emissions and carbon neutrality [7] and calculating net productivity [8,9]. The spatial heterogeneity of fine dead fuel load on the surface along with the complexity of the climate and terrain are the main reasons behind the unpredictability of wildland fires and the difficulty in extinguishing them. Apart from moisture content, these are also the most important surface fuel characteristic values in wildland fire prediction [10,11,12]. Therefore, an accurate determination of the load value of fine dead fuel on the surface is of great significance in wildland fire management, ecology, and environmental fields.
Current methods for calculating the surface fine dead fuel load mainly comprise the full harvest, stand characteristic factor, remote sensing estimation, and photo series methods. Among them, the harvest method is the most accurate, but it consumes a lot of manpower and material resources [13,14,15]. Via the stand characteristic factor method, a correlation is established between the surface fine dead fuel load and the stand characteristic factor, and then the load is estimated based on the stand factor. This method is widely used, but due to the spatial heterogeneity of the load, its extrapolation ability is weak [16,17,18]. Although remote sensing estimation can determine large-scale fuel loads, this technique also relies on the relationship between forest characteristics and fuel loads; in addition, it is limited by cloud cover and tree canopy coverage, resulting in low accuracy [19,20,21,22]. The photo series method utilizes a series of photos depicting known fuel loads as the basis of comparison for identifying a fuel load in a photo of field conditions, with the most similar photo in the series providing the fuel load estimate [6,23]. However, this method is mainly used to investigate fuel loads in large forests (i.e., containing surface fuels with a diameter greater than 6 mm), which yields large errors in estimates of the amount of fine dead fuel on the forest floors [6]. Therefore, the development of a fast, economical, and accurate load estimation method with extrapolation capabilities is important for advancing science-based wildland fire management.
The main reason why the photo series method is not suitable for estimating the load of fine dead fuels on the ground is that the structure of fine fuels is much more complex than that of wooden fuels in the field; essentially, this limitation renders the method subjective, impeding the establishment of a comparative photo database that can be accessed by investigators. The principle underlying this technique involves a matching of visual features of the determined fuel load in the field with the corresponding features in photos of known fuel loads [24,25]. If the relationship between specific image features of different loads can be obtained, load can thereafter be estimated by extracting further image features from captured photos of fine fuels in the field. A rapid, economical, objective, and high-precision acquisition of surface-fine dead fuel loads is of great significance in related research.
The Euler number of an image characteristic is a key parameter in digital topology, representing the total number of objects in the image minus the number of holes in these objects [26]. Due to its strong robustness when images undergo changes such as stretching, shrinking, or rotating, it is widely used as an extremely useful image feature in the field of computer vision [27]. To a certain extent, it can characterize the number of leaves and certain topological relationships in the image. When extracting the Euler number, it is necessary to first perform binarization on the image, which benefits further image processing by reducing the amount of available data and facilitating the highlighting of contours [28]. Then, the Euler numbers are extracted using software (MATLAB R2023b). This study assessed the use of the Euler number as a research indicator to address the following three questions: (1) Is the Euler number of an image characteristic related to the surface fine fuel load value? (2) Can we estimate the amount of fine dead fuel on a surface based on the Euler number of corresponding image features? (3) What is the most suitable load prediction model based on the Euler number? Practical and feasible ideas and methods are provided for obtaining the load of fine dead fuels on a surface, which is of great significance for the establishment of scientific wildland fire management protocols and serve as a reference for related research.
Guizhou Province in China is one of the most typical, complex, and diverse karst areas worldwide, with a forest coverage rate of 62% [29]. The diligent execution of wildland fire prevention is necessary to maintain a healthy ecological environment. The shape of fine dead fuels on forest floors and bed structure varies significantly [30]. To ensure objectivity and comprehensiveness in this study, we selected surface fine dead fuels from common coniferous forests (P. massoniana) and broad-leaved forests (Q. fabri) in Guizhou as study areas. Fine dead fuel beds with different surface loads were constructed indoors, and fixed shooting methods were used to capture photos for the extraction of Euler numbers from image features.
2. Material and Methods
2.1. Study Area
All field research was conducted along the Tianhe Mountain in Fenggang County, Zunyi City, Guizhou Province, China (107°31′20″–107°56′42″ E, 27°32′13″–28°1′14″ N). The area has a humid subtropical monsoon climate with four distinct seasons, an average annual temperature of 15.2 °C, and an average annual rainfall of 1116.1 mm. Forest resources are abundant and include trees such as P. massoniana, Q. fabri, Phyllostachys heterocycla, and Cryptomeria fortunei; shrubs such as Serissa japonica Thunb., Lindera fragrans Oliv., and Camellia japonica L.; and herbs like Ophiopogon bodinieri and Carex rigescens. The sketch map of the study area is shown in Figure 1.
2.2. Standardization and Sample Collection
The study first needs to investigate the basic situation of the fuel bed in the field and conduct experiments on constructing the bed indoors after collecting fuels in the field. It was conducted in representative P. massoniana and Q. fabri forests on Tianhe Mountain during the fire prevention period in February 2023, with three standard plots of 20 m × 20 m set up in each forest type. The forest stand characteristics measured included the diameter at breast height, tree height, canopy density, slope, and aspect of each standard plot. Twenty sampling points of 30 cm × 30 cm were randomly selected within each plot to measure the depth and load values of the coniferous bed layer of P. massoniana and broad-leaved bed layer of Q. fabri. The depth of the fuelbed is measured on both sides of the sampling points using a steel ruler, and the average is the depth of the sampling points. The surface fuels in the sampling points are obtained using the total harvest method, dried, and recorded as the loading of the sampling points. Basic information as collected on the standardized plots and fuel beds is presented in Table 1. Structurally intact leaves were collected in the field and transported to the laboratory to construct a fuel bed.
2.3. Laboratory Experiment
2.3.1. Construction of Fuel Beds with Different Loads
The depth of the fuel bed in the field does indeed vary and is not stable. However, the main purpose of this study is to analyze the applicability of using the image Euler number to estimate loading, and different depths will affect the analysis results. Therefore, this study only sets one bed depth (selecting the most representative depth: the average depth of the fuel bed in the study area). From our field measurements, the average depth of the coniferous P. massoniana and broad-leaved Q. fabri bed layers were calculated to be 3.2 cm and 4.0 cm, respectively. To better explore the relationship between fine dead fuel load and the Euler number, and with reference to the load range data acquired in the field (Table 1), loading increments of 0.5 t/ha were investigated. The experimental load range was selected to be slightly higher than that of the actual field values, at 3–20.5 t/ha for both forest types. We constructed 30 × 30 cm fuel beds in the laboratory using the structurally intact leaves that were collected in the field, ensuring a depth of 3.2 cm for coniferous and 4.0 cm for broad-leaved beds. The fuel was dried until its mass remained constant. Based on an area conversion, the coniferous and broadleaf masses corresponding to different load gradients within 0.09 m2 (30 × 30 cm) were calculated. These respective fuel quantities were randomly sprinkled onto the artificial bed layer from an elevated position; and three replicates were constructed for each experimental load along the gradient.
2.3.2. Image Capture
To ensure the objectivity of photography, eliminate the influence of photography parameters on the results, and ensure consistent photography conditions, the same smartphone was used to capture images. All photos were taken at a height of 0.8 m, directly above the center of a fuel bed, with three images being recorded for each loading. We obtained 108 images of P. massoniana and Q. fabri fuel beds, respectively.
2.3.3. Image Processing and Feature Extraction
We used Photoshop 2020 to crop all photos and adjusted them to a uniform 2300 × 2300 dpi resolution. Images were stored in JPEG format for the best storage effect. Resulting fuel bed images representing different fine dead fuel loads are displayed in Figure 2.
Prior to extracting the Euler number, all images were binarized, which benefits further image processing by reducing the amount of available data and facilitating the highlighting of contours [28]. First, a grayscale intensity threshold is selected; any pixel value exceeding this threshold in the source image was replaced with white, while those under the threshold were set to black, thereby converting a color image into a two-color black and white image. This step was conducted using the ‘im2bw’ function in MATLAB R2023b platform (MathWorks, Natick, MA, USA). The threshold range of the function was set at 0–1 to reflect potential pixel values of up to 256, with 0 representing a pixel value of zero, 1 representing a pixel value of 256, and a threshold of 0.5 corresponding to a pixel value of 128. To analyze the impact of Euler numbers obtained from different thresholds on the results, this study used a range of thresholds from 0.05 to 0.95, with increments of 0.05. Selecting different thresholds for each image to binarize and extract Euler numbers, as there are 19 threshold gradients, each image has 19 Euler numbers. Euler numbers were obtained from images binarized at different conversion thresholds via the ‘bweuler’ function in MATLAB R2023b. To better demonstrate the effect of binarization, Figure 3 shows binary images of the P. massoniana coniferous and Q. fabri broad-leaved fuel beds with a fixed load of 9 t/ha (example of a partial threshold).
2.4. Data Processing
2.4.1. Statistical Analysis
The Euler numbers extracted from images of coniferous and broad-leaved beds under different load levels were expressed as mean, median, minimum, and maximum values.
2.4.2. Correlation Analysis
Pearson correlation analysis was used to obtain the correlation coefficients between the bed load of the two fuel materials and the Euler number at different thresholds. A correlation coefficient heatmap was constructed with these data.
2.4.3. A Prediction Model for Fine Fuel Bed Loads Based on Euler Numbers
Establishment of the Model
We employed stepwise regression, nonlinear fitting, and the widely used random forest model in deep learning to establish our prediction models.
- Stepwise regression (FL1). Using the load of the fine dead fuel bed on the surface as the dependent variable and the Euler number (at all thresholds) as the independent variable, a forward stepwise regression method was conducted to establish a load prediction model.
- Nonlinear fitting (FL2). The Euler number obtained at the image conversion threshold producing the maximum correlation coefficient was selected as the dependent variable. Owing to the large absolute values of the Euler numbers, the model parameters were too large and complex for nonlinear fitting. Therefore, the logarithm of the absolute value of the Euler number was used. A scatter plot was drawn with the load of surface fine dead fuel along the vertical axis and the logarithm of the Euler number along the horizontal axis. The variation in bed load according to the Euler number was analyzed, selecting an appropriate model form (with R2 maximum as the selection criterion), and least squares fitting parameters were selected to obtain a nonlinear fitting model based on the Euler number.
- Random forest algorithm (FL3). The random forest machine learning algorithm was used to establish a prediction model. Two important parameters are required for this technique: the number of decision trees (ntree) and the number of random features (mtry) [31]. MATLAB R2023b was used to establish the relationship between the number of decision trees and errors, determine the range of decision trees, determine the most suitable decision tree value by measuring the prediction performance of different decision tree numbers, and ultimately obtain the final random forest prediction model.
Verification of Prediction Model for the Surface Dead Fuel Load
To evaluate predictive performance, the corrected coefficient of determination, mean absolute error (MAE), mean relative error (MRE), and root-mean-square error (RMSE) for each of the three models were calculated for the two types of fine dead fuel beds, as shown in Equations (1)–(3), respectively.
where represents the predicted value, represents the measured value, n and represents the amount of data in the test set.
A 1:1 graph was drawn with measured load values along the horizontal axis and the predicted values of the three models along the vertical axis. The interval in which the predicted load value had a larger error was analyzed.
Using the MRE of the three methods as dependent variable, the t-test was selected for analyzing whether significant differences existed between the results of the three methods. The prediction model with the lowest MRE was selected for use.
3. Results
3.1. Basic Statistics
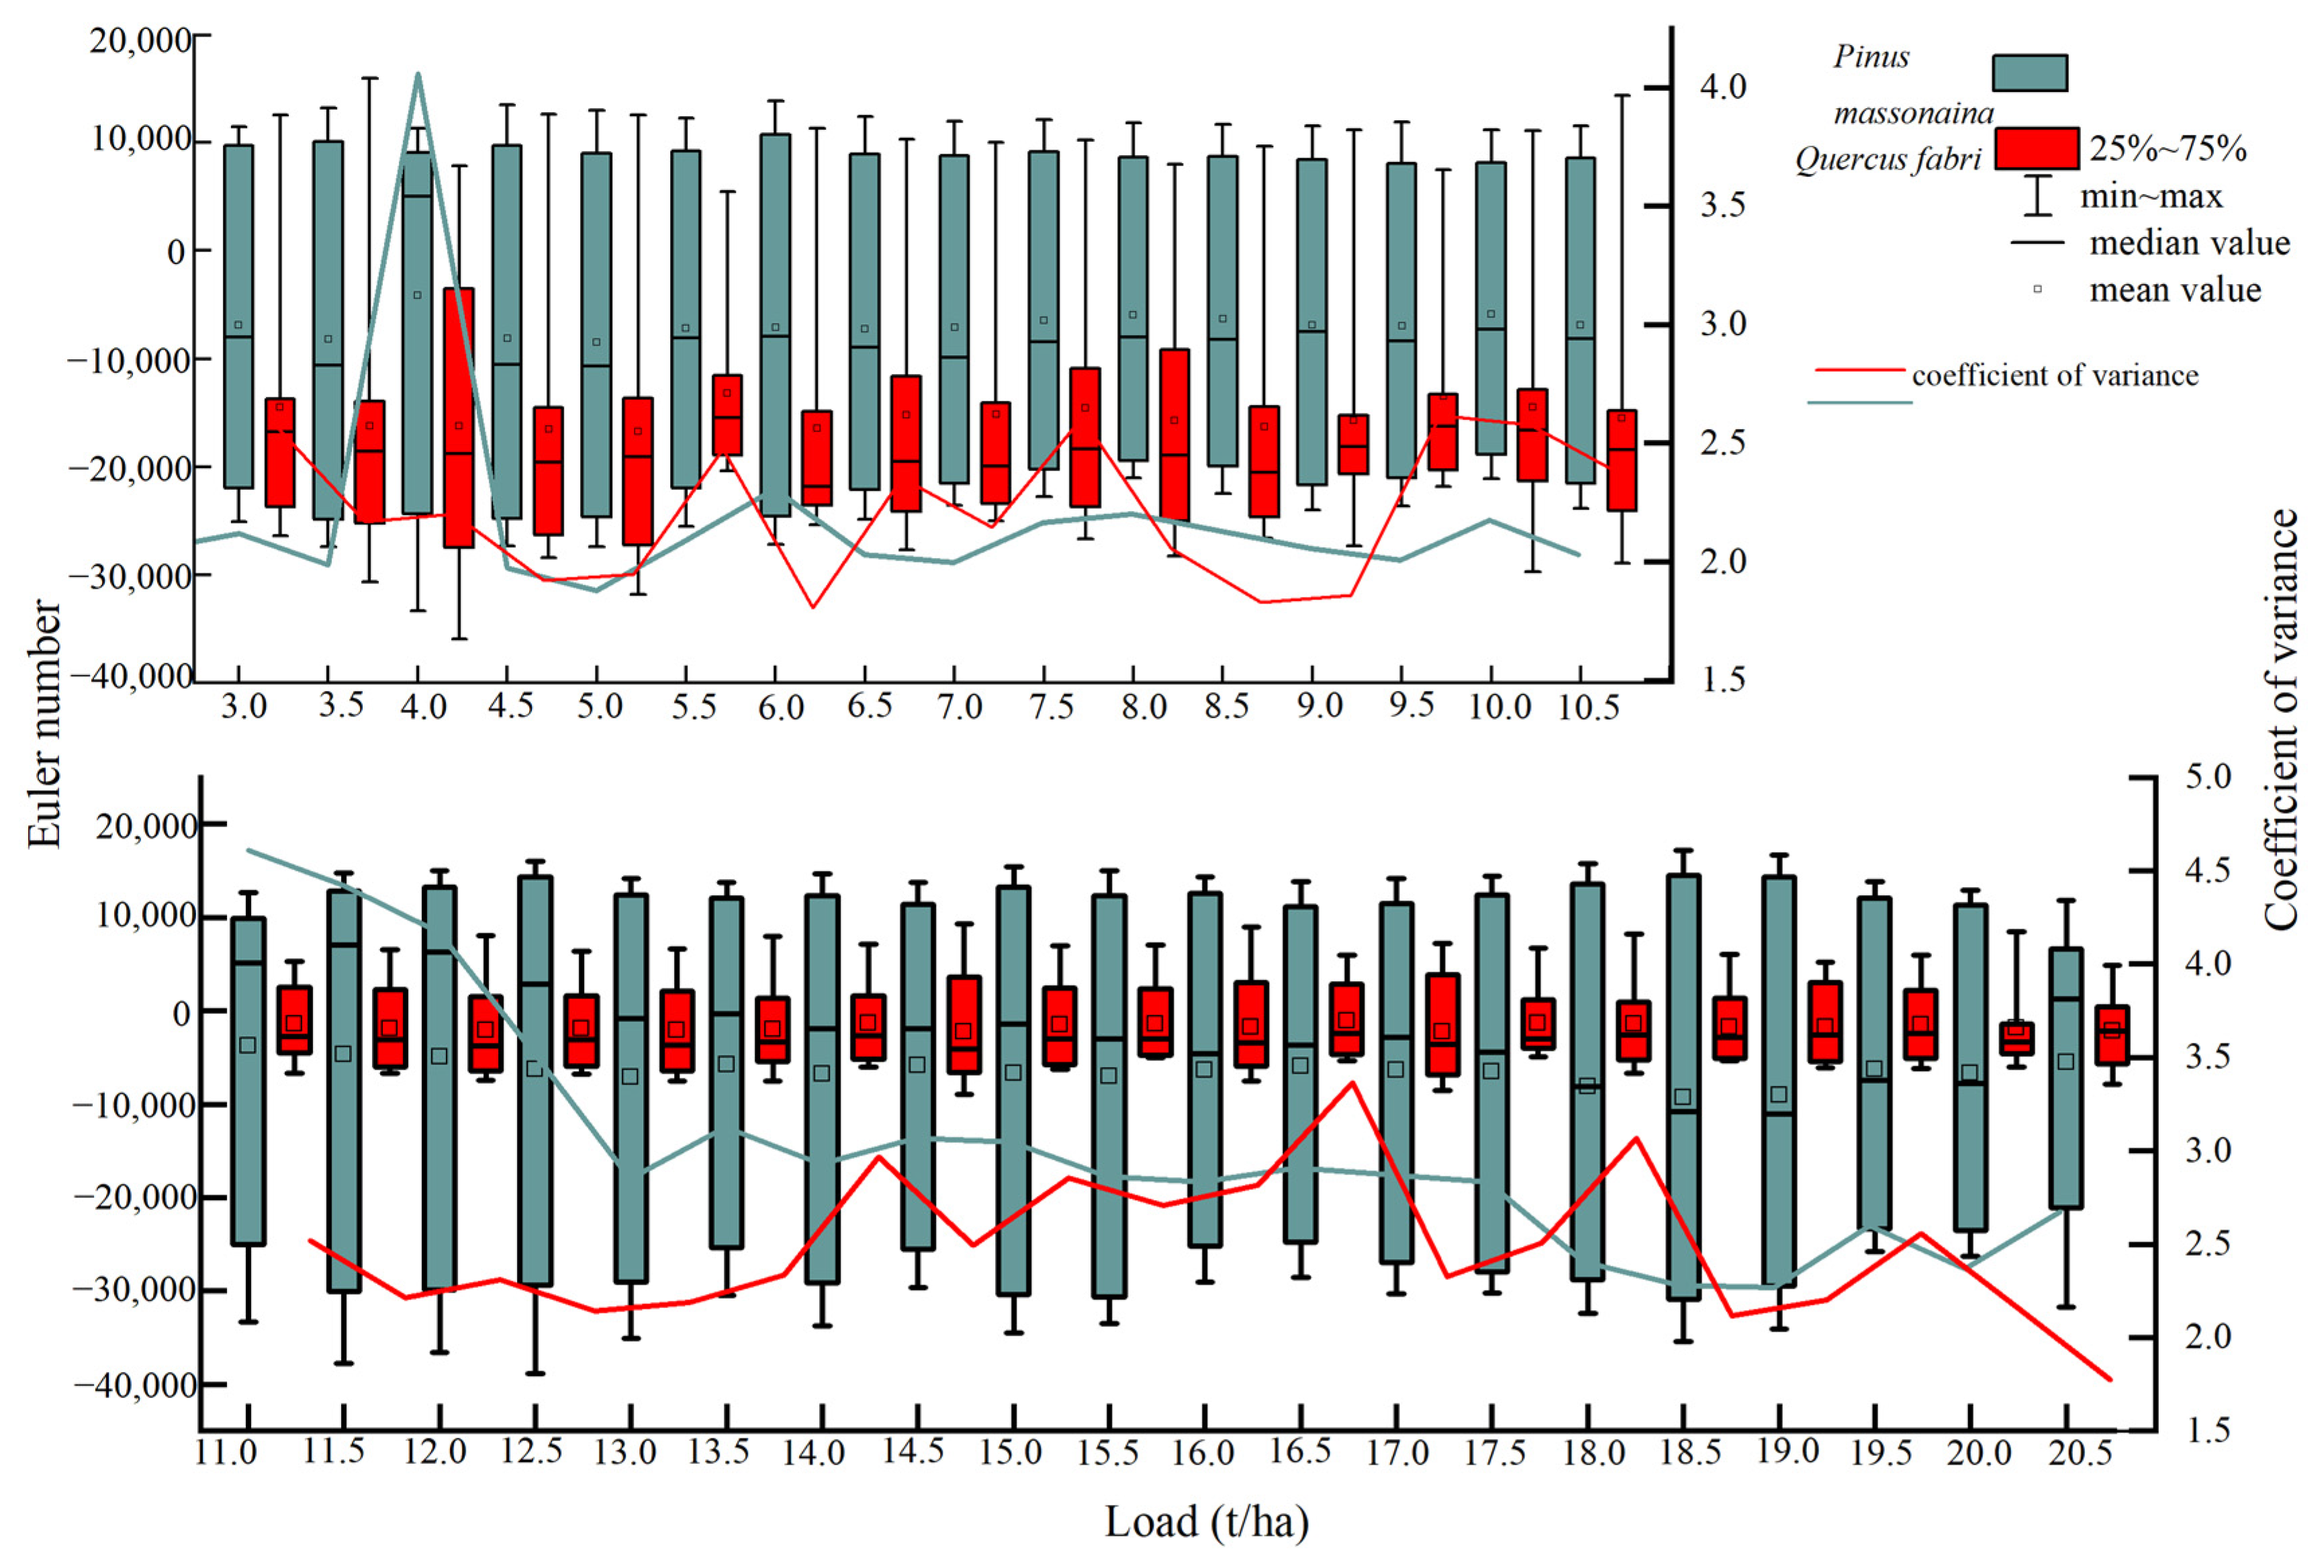
Euler numbers obtained from images of the two types of fine dead fuel beds at different loads are presented in Figure 4. The lowest Euler number values for images of P. massoniana and Q. fabri fine dead fuel beds were −38,892.67 and −9118.33, respectively. For P. massoniana, a conversion threshold of 0.9 and a fine dead fuel load of 18.5 t/ha produced the highest Euler number. In comparison, for Q. fabri, a conversion threshold of 0.85 and fine dead fuel load of 14.5 t/ha produced the highest Euler number (9165). From the perspective of the coefficient of variation, the variation in the amplitude of the Euler number in P. massoniana fuelbeds with the same load but different thresholds was slightly higher than that in Q. fabri.
3.2. Correlation Analysis
At a conversion threshold of 0.05–0.30, the Euler numbers of images were significantly (p < 0.05) and negatively correlated with the fine dead fuel load of P. massoniana. In contrast, when using image thresholds of 0.55–0.80, the Euler number and load were significantly and positively correlated, whereas they were not correlated at all remaining thresholds. In the case of Q. fabri fine dead fuel images, a threshold range of 0.60–0.70 produced no significant correlation between the Euler number and the fuel load. However, when the threshold was below 0.60, a significant negative correlation was recorded between the Euler number and load, whereas a threshold of 0.75–0.85 produced a significant positive correlation between these two variables. Except in a few cases, the Euler numbers extracted from images obtained at different thresholds (for the same fuelbed type) were mostly correlated with one another (Figure 5).
3.3. Prediction Models
3.3.1. Model Results
Our results for predictive models created via (1) stepwise regression, (2) nonlinear fitting, and (3) random forest algorithms are presented here.
- Stepwise regression (FL1). For the P. massoniana needle fuelbed, Euler numbers were entered into the regression equation for image thresholds of 0.05, 0.10, 0.70, 0.90, and 0.95. The corrected R2 value was 0.637, and the MAE and MRE were 2.39 t/ha and 28.85%, respectively. For the broad-leaved bed of Q. fabri, Euler numbers were entered into the equation for image thresholds of 0.25, 0.5, 0.75, 0.8, 0.85, and 0.9. Here, the corrected R2 value was 0.654, and the MAE and MRE were 2.22 t/ha and 26.89%, respectively (Table 2).
- 2.
- Nonlinear fitting method (FL2). According to the correlation analysis results, the Euler number with the highest correlation coefficient was associated with image thresholds of 0.7 and 0.05 for P. massoniana and Q. fabri fuelbeds, respectively, for use as predictive factors in the nonlinear fitting model. When the load was 11 t/ha, it exhibited different trends with respect to the logarithm of the Euler number for the two fuel types. For P. massoniana fine dead fuels, as the load increased, the load first exhibited a quadratic function in relation to the logarithm of the Euler number, but thereafter showed a linear downward trend. In contrast, for Q. fabri fine dead fuels, the load first followed a cubic function trend in relation to the logarithm of the Euler number, but at loads ≥11 t/ha, an increasing quadratic function trend was observed (Figure 6).
A segmented function was established for the load variation range observed in the two fine dead fuel types. Table 3 presents the results of the non-linear regression model. For P. massoniana, the R2 values of the two models were 0.504 and 0.485, respectively, with an MRE of only 14.65%. In the case of Q. fabri, the R2 values of the two-stage model were 0.251 and 0.274, respectively, with an MAE of 1.69 t/ha and an MRE of 18.09%.
- 3.
- Random forest method (FL3). Figure 7 shows the number of decision trees and the error distribution of our random forest model. Errors tended to stabilize when the number of decision trees reached 400. According to the left panel in Figure 7, both P. massoniana and Q. fabri exhibited the best predictive performance at a decision tree value of 1000 and with the minimum number of leaves set at 1.
When applying the aforementioned parameters, the R2 value of the prediction model for P. massoniana fine dead fuel load was 0.948, with an MAE and MRE of 0.717 t/ha and 9.35%, respectively; the RMSE was only 1.191 t/ha. For Q. fabri, the model-corrected coefficient of determination was 0.910, the MAE was 1.14 t/ha, the MRE was 14.54%, and the RMSE was 1.56 t/ha.
3.3.2. Model Comparisons
In Figure 8, three 1:1 graphs of the three models are shown. In the case of both P. massoniana and Q. fabri fine dead fuels, the random forest model exhibited the best predictive performance, with the fitting line being closest to the 1:1 line. For FL1, predicted values were higher at low fuel loads, and the predictive value decreased as the measured load increased. The predicted values for FL2 and FL3 were generally low.
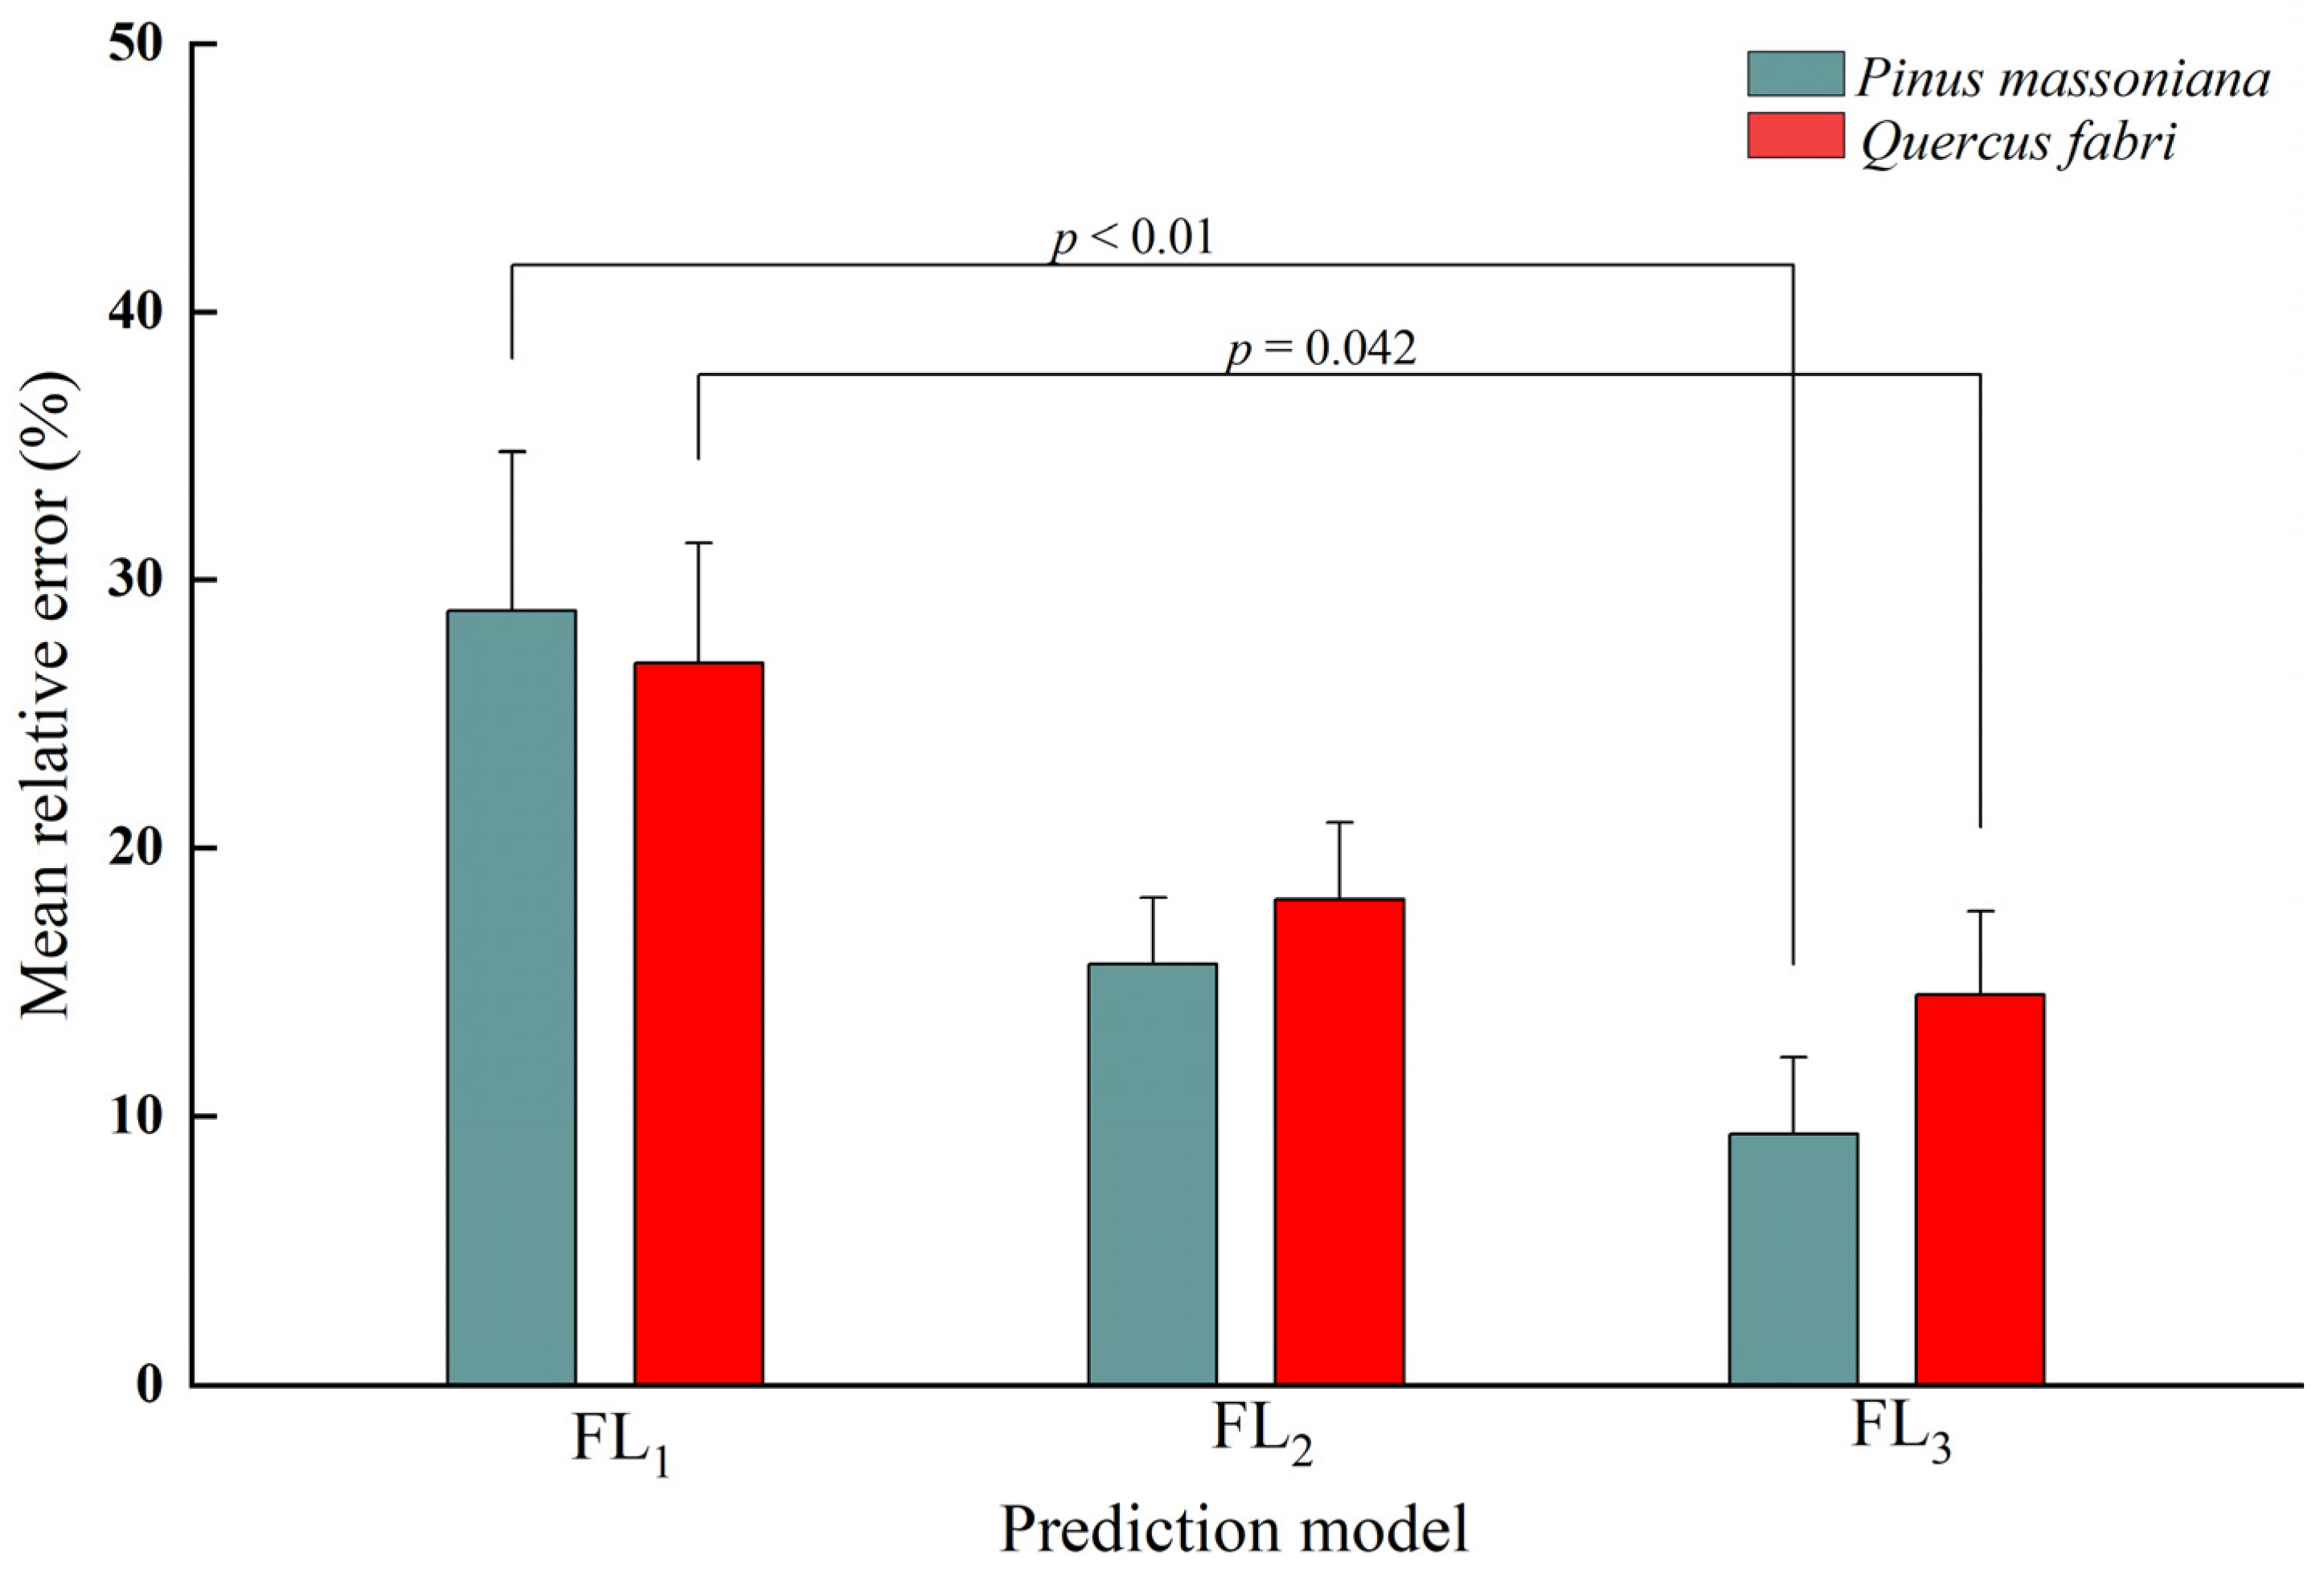
In our differential analysis, and for both coniferous and broad-leaved fine dead fuels, the MRE of the FL3 model was significantly lower than that of the FL1 model, and there was no significant difference between the predictive value of the FL3 and the FL2 models (Figure 9).
4. Discussion
As one of the main features of an image, the Euler number has strong robustness by not changing with the flipping, transformation, or stretching of the image. This value is widely used in counting and establishing relationships between image features. For example, Kang and Yao used Euler numbers for assessments of grain quantity, through which the counting time could be reduced from 102 ms to 5.9 ms [32], and Yao et al. applied image Euler numbers to analyze the particle size of paper fillers [27]. Such studies confirm the feasibility of using Euler numbers to measure the quantities of substances in captured images, justifying our application of this variable as an image feature to analyze its relationship with the fine dead fuel load. Calculations that extract image Euler numbers include algorithms based on graph segments or tetragonal lattices as well as graph theory. This study focused on the relationship between the Euler number and fine dead fuel load, which only required the simplest method, namely, using the Euler number definition to calculate and obtain the number.
The load of P. massoniana and Q. fabri fine dead surface fuel was significantly correlated with the Euler number as calculated at different thresholds. As the image threshold increased, the relationship between fuel load and Euler number shifted from a negative to a positive correlation. This change is mainly due to the difference in the performance of Euler numbers at different thresholds, with the Euler number representing the difference between the number of connected components (leaf fuel) in the image and the number of holes between these components. At a low threshold, an increase in the bed load results in an increasing number of fuel pixel values that are higher than the threshold, which increases the white regions and decreases the black regions of the binarized image to produce an increase in the number of holes available for discrimination [33]. Under these conditions, the Euler number shows a downward trend and a corresponding negative correlation with the image feature being measured. In contrast, when the threshold exceeds a certain value, the pixel value of most of the fuels in the bed is lower than the threshold value; in this instance, the binary image shows an increase in black area, the number of connected component identifiers increases, and the number of holes (shown as white) decreases, resulting in an increase in the Euler number and a positive correlation with the measured feature. We recorded a significant correlation between the load of fine dead fuels and the image Euler number, which confirmed that the Euler number is a feasible parameter to use for load prediction.
For both P. massoniana and Q. fabri, the load prediction model created via random forest algorithms provided the best predictive effect via Euler numbers, with a mean relative error of <15% that meets the accuracy requirements of a model [34]. Nonlinear fitting adopts a stepwise fitting method. Although the prediction efficiency of our model created with this technique produced the second-best performance, the error of the stepwise regression model was the largest, and the prediction model was more complex, which prevents its practical application. The threshold corresponding to the Euler number chosen by the model is different, mainly due to the different shapes and structures of fine dead fuel on different surfaces. In comparison, Wang et al. used environmental factors as independent variables in selected regression models to establish a prediction model for the surface fine dead fuel load of Yunnan pines, obtaining an error of 18% [35]. Liu et al. similarly established a prediction model for the surface dead fuel load of six typical stands, but they only achieved an MRE value of 19.625% for the six stands [36]. When the photo series method was previously used to estimate the fine dead fuel load on a forest floor, the estimated values of different observers varied significantly, up to 2.5–3.5 times [37]. Gosper et al. found that the relationship between visual assessment and measurement of loading is difficult to maintain in practice, based on their research on a typical fuel load in the European Mediterranean [38]. In our study, although the error introduced by stepwise regression was large, the errors of the random forest and nonlinear models based on the image Euler number was not particularly lower than that of traditional methods, indicating a good application potential.
Both random forest and nonlinear fitting methods based on the Euler number produced a better prediction performance for P. massoniana leaf fuel than for that of Q. fabri, which can mainly be ascribed to the fuel characteristics. Compared to the broad leaves of Q. fabri, the needles of P. massoniana are cylindrical and have less morphological variation. As the fuel load increases, the fuelbed structure becomes more uniform [39], making it easier to establish a correlation between the Euler number and load. Therefore, our predictive model displayed a good predictive effect. Stepwise regression purely offers a statistical analysis; therefore, we could not demonstrate whether our model created with this method showed a better predictive performance for P. massoniana than for Q. fabri. It can also be predicted that it is feasible to estimate the load value of a fuel type with a more uniform structure, such as a branch, 10 h, or 100 h fuel. It should be noted that this study was conducted within the range of 3–20.5 t/ha of loading. When the fuel load is too high or the shape of fuel is too large, the overlap of fuel monomers may increase, which may affect the prediction effect.
Forest fuelbed load is one of the most important features in fuel description systems and significantly affects wildland fire occurrence, evolution, and carbon emissions, among other factors. In this study, we analyzed the relationship between the fine dead fuel load—as created by a coniferous and broadleaf tree species on forest floors—and the Euler number of fine dead fuel images. The feasibility of using the image Euler number as a predictive value for the fuel load was verified. However, our study has certain limitations. Our model still needs to be verified for other fuel types, such as bamboo leaves or mixed fuels. In addition, the effects of the photography mode, aperture setting, exposure, image processing, and other image characteristics on load prediction were not assessed. Therefore, future research on forest fuel loads based on image characteristics is still required to explore these influencing factors. A fast, accurate, time-saving, and objective load estimation method would greatly benefit wildland fire management strategies by reducing the occurrence of wildland fires and improving firefighting efficiency. Moreover, some image features may also be used for the determination of other features of fuel, such as depth, size, etc., which can be further studied in the future.
5. Conclusions
The surface fine dead fuelbeds of typical southern stands of P. massoniana and Q. fabri were photographed at different fuel loads. The Euler number was extracted from these images using different digitization thresholds, and the relationship between the image characteristics and fuel load was analyzed. The fine dead fuel loads of both fuel types were significantly correlated with the Euler number at certain thresholds; although, the correlation between the two fuel types showed different trends at different digitization thresholds.
Based on the Euler number, three predictive models of fine dead fuelbed load were developed using both a coniferous and a broadleaf tree species. The predictive performance of the random forest model was the most accurate, followed by that of the nonlinear fitting model, with that of the stepwise regression model being the least accurate. The MREs of the two segments of the random forest prediction model were 9.35% and 14.54%, respectively, which were significantly lower than those obtained via stepwise regression and met the requirement of practical application.
We developed a new predictive model of forest floor fine dead fuel load by verifying the correlation between the Euler number of a fuelbed image and the actual fuel load. Compared to traditional load measurement techniques, our predictive model is faster, more precise, more objective, and universal, opening up new avenues for fuel load research based on imagery. It also provides support for fire risk investigations and basic data acquisition in wildland fire management protocols, improving the scientific approach to wildland fire management with the aim of reducing the damage caused by wildland fires.
Author Contributions
Y.Z. conceived and designed the experiments, analyzed the data, prepared figures and tables, authored and reviewed drafts of the paper, and approved the final draft. L.T. performed the experiments, prepared figures and tables, and approved the final draft. All authors have read and agreed to the published version of the manuscript.
Funding
This research was jointly supported by China National Natural Science Foundation (Grant no.: 32201563), Guizhou Provincial Science and Technology Projects (Grant no.: Qianke Support [2022] General 249), and the intelligent forest fire innovation team of higher education institutions in Guizhou Province (Grant no.: QJJ[2023]075).
Data Availability Statement
Not applicable.
Acknowledgments
We extend our gratitude toward Jiahong Liu and Xiong Yan for their support in indoor work and anonymous reviewers for their valuable comments on the manuscript.
Conflicts of Interest
The authors declare no conflict of interest.
References
- Alonso-Rego, C.; Arellano-Pérez, S.; Cabo, C.; Ordoñez, C.; Álvarez-González, J.G.; Díaz-Varela, R.A.; Ruiz-González, A.D. Estimating Fuel Loads and Structural Characteristics of Shrub Communities by Using Terrestrial Laser Scanning. Remote. Sens. 2020, 12, 3704. [Google Scholar] [CrossRef]
- Batcheler, M.; Smith, M.M.; Swanson, M.E.; Ostrom, M.; Carpenter-Boggs, L. Assessing silvopasture management as a strategy to reduce fuel loads and mitigate wildfire risk. Sci. Rep. 2024, 14, 5954. [Google Scholar] [CrossRef] [PubMed]
- Bonham, C.D. Measurements for Terrestrial Vegetation; John Wiley & Sons: New York, NY, USA, 1989; 338p. [Google Scholar]
- Catchpole, W.R.; Wheeler, C.J. Estimating plant biomass: A review of techniques. Aust. J. Ecol. 1992, 17, 121–131. [Google Scholar] [CrossRef]
- Chavez-Duran, A.A.; García, M.; Olvera-Vargas, M.; Aguado, I.; Figueroa-Rangel, B.L.; Trucíos-Caciano, R.; Rubio-Camacho, E.A. Forest Canopy Fuel Loads Mapping Using Unmanned Aerial Vehicle High-Resolution Red, Green, Blue and Multispectral Imagery. Forests 2024, 15, 225. [Google Scholar] [CrossRef]
- Clarke, H.; Pitman, A.J.; Kala, J.; Carouge, C.; Haverd, V.; Evans, J.P. An investigation of future fuel load and fire weather in Australia. Clim. Chang. 2016, 139, 591–605. [Google Scholar] [CrossRef]
- Deeming, J.E.; Burgan, R.E.; Cohen, J.D. The National Fire-Danger Rating System—1978; Gen. Tech. Rep. INT-GTR-39; U.S. Department of Agriculture, Forest Service, Intermountain Forest and Range Experiment Station: Ogden, UT, USA, 1977; 63p.
- de Groot, W.J.; Landry, R.; Kurz, W.A.; Anderson, K.R.; Englefield, P.; Fraser, R.H.; Hall, R.J.; Banfield, E.; Raymond, D.A.; Decker, V.; et al. Estimating direct carbon emissions from Canadian wildland fires. Int. J. Wildland Fire 2007, 16, 593–606. [Google Scholar] [CrossRef]
- Finney, M.A. FARSITE: Fire Area Simulator-Model Development and Evaluation; Res. Pap. RMRS-RP-4; U.S. Department of Agriculture, Forest Service, Rocky Mountain Research Station: Ogden, UT, USA, 2004; 47p.
- Fujimoto, A.; Haga, C.; Matsui, T.; Machimura, T.; Hayashi, K.; Sugita, S.; Takagi, H. An End to End Process Development for UAV-SfM Based Forest Monitoring: Individual Tree Detection, Species Classification and Carbon Dynamics Simulation. Forests 2019, 10, 680. [Google Scholar] [CrossRef]
- Gosper, C.R.; Yates, C.J.; Prober, S.M.; Wiehl, G. Application and validation of visual fuel hazard assessments in dry Mediterranean-climate woodlands. Int. J. Wildland Fire 2014, 23, 385–393. [Google Scholar] [CrossRef]
- Gould, J.S.; McCaw, W.L.; Cheney, N.P. Quantifying fine fuel dynamics and structure in dry eucalypt forest (Eucalyptus marginata) in Western Australia for fire management. For. Ecol. Manag. 2011, 262, 531–546. [Google Scholar] [CrossRef]
- He, R.; Lu, H.; Jin, Z.Z.; Qin, Y.; Yang, H.; Liu, Z.; Yang, G.; Xu, J.; Gong, X.; Zhao, Q. Construction of forest fire prediction model and driving factors analysis based on random forests algorithm in Southwest China. Acta Ecol. Sin. 2023, 43, 9356–9370. [Google Scholar] [CrossRef]
- Jin, S.; Chen, P. Modelling drying processes of fuelbeds of Scots pine needles with initial moisture content above the fibre saturation point by two-phase models. Int. J. Wildland Fire 2012, 21, 418–427. [Google Scholar] [CrossRef]
- Kang, S.Y.; Yao, B. Target counting method of grain particle images based on Euler numbers. Hubei Agric. Sci. 2023, 62, 197–201. [Google Scholar] [CrossRef]
- Keane, R.E. Describing wildland surface fuel loading for fire management: A review of approaches, methods and systems. Int. J. Wildland Fire 2013, 22, 51–62. [Google Scholar] [CrossRef]
- Keane, R.E.; Burgan, R.; van Wagtendonk, J. Mapping wildland fuels for fire management across multiple scales: Integrating remote sensing, GIS, and biophysical modeling. Int. J. Wildland Fire 2001, 10, 301–309. [Google Scholar] [CrossRef]
- Kucuk, O.; Saglam, B.; Bilgili, E. Canopy Fuel Characteristics and Fuel Load in Young Black Pine Trees. Biotechnol. Biotechnol. Equip. 2007, 21, 235–240. [Google Scholar] [CrossRef]
- Liang, Y.; Li, J.M.; Zhao, F.J.; Zhang, Y.; Kong, T.; Nurgul, M. Surface fuel loads of Tianshan spruce forests in the central Tianshan Mountains and the impact factors. Sci. Silvae Sin. 2017, 53, 153–160. [Google Scholar] [CrossRef]
- Liu, X.; Huang, Y.; Ding, B.; Wu, Y.; Zhang, Y.W.; Li, J.F.; Zhang, Y.L. Influencing factors of surface fine dead fuel loading in typical forest stands of Dalou Mountain. J. Cent. South Univ. For. Technol. 2023, 43, 9–16. [Google Scholar] [CrossRef]
- Lydersen, J.M.; Collins, B.M.; Knapp, E.E.; Roller, G.B.; Stephens, S. Relating fuel loads to overstorey structure and composition in a fire-excluded Sierra Nevada mixed conifer forest. Int. J. Wildland Fire 2015, 24, 484–494. [Google Scholar] [CrossRef]
- Mallinis, G.; Mitsopoulos, I.D.; Dimitrakopoulos, A.P.; Gitas, I.Z.; Karteris, M. Local-Scale Fuel-Type Mapping and Fire Behavior Prediction by Employing High-Resolution Satellite Imagery. IEEE J. Sel. Top. Appl. Earth Obs. Remote. Sens. 2008, 1, 230–239. [Google Scholar] [CrossRef]
- Mueller-Dombois, D.; Ellenberg, H. Aims and Methods of Vegetation Ecology; John Wiley & Sons: New York, NY, USA, 1974. [Google Scholar]
- Neary, D.G.; Klopatek, C.C.; DeBano, L.F.; Ffolliott, P.F. Fire effects on belowground sustainability: A review and synthesis. For. Ecol. Manag. 1999, 122, 51–71. [Google Scholar] [CrossRef]
- Ottmar, R.D.; Hardy, C.C. Stereo Photo Series for Quantifying Forest Residues in Coastal Oregon Forests: Second-Growth Douglas-Fir—Western Hemlock Type, Western Hemlock—Sitka Spruce Type, and Red Alder Type; Gen. Tech. Rep. PNW-GTR-231; U.S. Department of Agriculture, Forest Service, Pacific Northwest Research Station: Portland, OR, USA, 1989.
- Qiu, C.; Han, X.Z.; Chen, X.; Lu, X.; Yan, J.; Feng, Y.; Gan, J.; Zou, W.; Liu, G. Effects of organic amendment depths on black soil pore structure using CT scanning technology. Trans. Chin. Soc. Agric. Eng. 2021, 37, 98–107. [Google Scholar] [CrossRef]
- Rothermel, R.C. A Mathematical Model for Predicting Fire Spread in Wildland Fuels; Res. Pap. INT-115; U.S. Department of Agriculture, Forest Service, Intermountain Forest and Range Experiment Station: Ogden, UT, USA, 1972.
- Schaaf, M.D.; Sandberg, D.V.; Schreuder, M.D.; Riccardi, C.L. A conceptual framework for ranking crown fire potential in wildland fuelbeds. Can. J. For. Res. 2007, 37, 2464–2478. [Google Scholar] [CrossRef]
- Shan, H.; Zhang, S.Q.; Zhao, Y.; Cao, Y.G.; Xu, S.Z.; Liu, X. Study on the relationship of clay Euler number with physical and mechanical indexes based on independent component analysis. J. China Three Gorges Univ. Nat. Sci. 2023, 45, 50–55. [Google Scholar] [CrossRef]
- Sheng, M.Y.; Xiong, K.N.; Cui, G.Y.; Liu, Y. Plant diversity and soil physical-chemical properties in karst rocky desertification ecosystem of Guizhou, China. Acta Ecol. Sin. 2015, 35, 434–448. [Google Scholar]
- Sun, P.; Zhang, Y.; Sun, L.; Hu, H.; Guo, F.; Wang, G.; Zhang, H. Influence of Fuel Moisture Content, Packing Ratio and Wind Velocity on the Ignition Probability of Fuel Beds Composed of Mongolian Oak Leaves via Cigarette Butts. Forests 2018, 9, 507. [Google Scholar] [CrossRef]
- Wang, Y.W.; Suo, A.L.; Gao, Y.; Wang, B.; Chen, F.; Liu, X. Surface fuel load and influencing factors of Pinus yunnanensis forest in Xichang City, Sichuan Province of Southwestern China. J. Beijing For. Univ. 2023, 45, 100–108. [Google Scholar]
- Watson, P.J.; Penman, S.H.; Bradstock, R.A. A comparison of bushfire fuel hazard assessors and assessment methods in dry sclerophyll forest near Sydney, Australia. Int. J. Wildland Fire 2012, 21, 755–763. [Google Scholar] [CrossRef]
- Yao, B.; He, H.; Kang, S.; Chao, Y.; He, L. A Review for the Euler Number Computing Problem. Electronics 2023, 12, 4406. [Google Scholar] [CrossRef]
- Yao, B.; He, L.; Kang, S.; Zhao, X.; Chao, Y. A new run-based algorithm for Euler number computing. Pattern Anal. Appl. 2017, 20, 49–58. [Google Scholar] [CrossRef]
- Zhang, C.; Tian, H.; Wang, Y.; Zeng, T.; Liu, Y. Predicting response of fuel load to future changes in climate and atmospheric composition in the Southern United States. For. Ecol. Manag. 2010, 260, 556–564. [Google Scholar] [CrossRef]
- Zhang, Y.L. Modeling the drying process of Masson pine needle fuel beds under different packing ratios based on two-phase models in the laboratory. PeerJ 2022, 10, e14484. [Google Scholar] [CrossRef] [PubMed]
- Zhang, Z.; Zong, S.Q.; Yan, X.Q.; Zhang, H.; Huang, H.; Zhai, Y.; Fu, L. Effects of stand and terrain factors on forest surface fuel load in the core area of Chongli Winter Olympic Games. Sci. Silvae Sin. 2022, 58, 59–66. [Google Scholar] [CrossRef]
- Zhou, J.Q.; Liu, X.D.; Zhang, S.Y. Study on the distribution of surface combustibles in Larix gmelinii plantation. For. Fire Prev. 2019, 2019, 19–23. [Google Scholar]
Figure 1.
Sketch map of the study area.
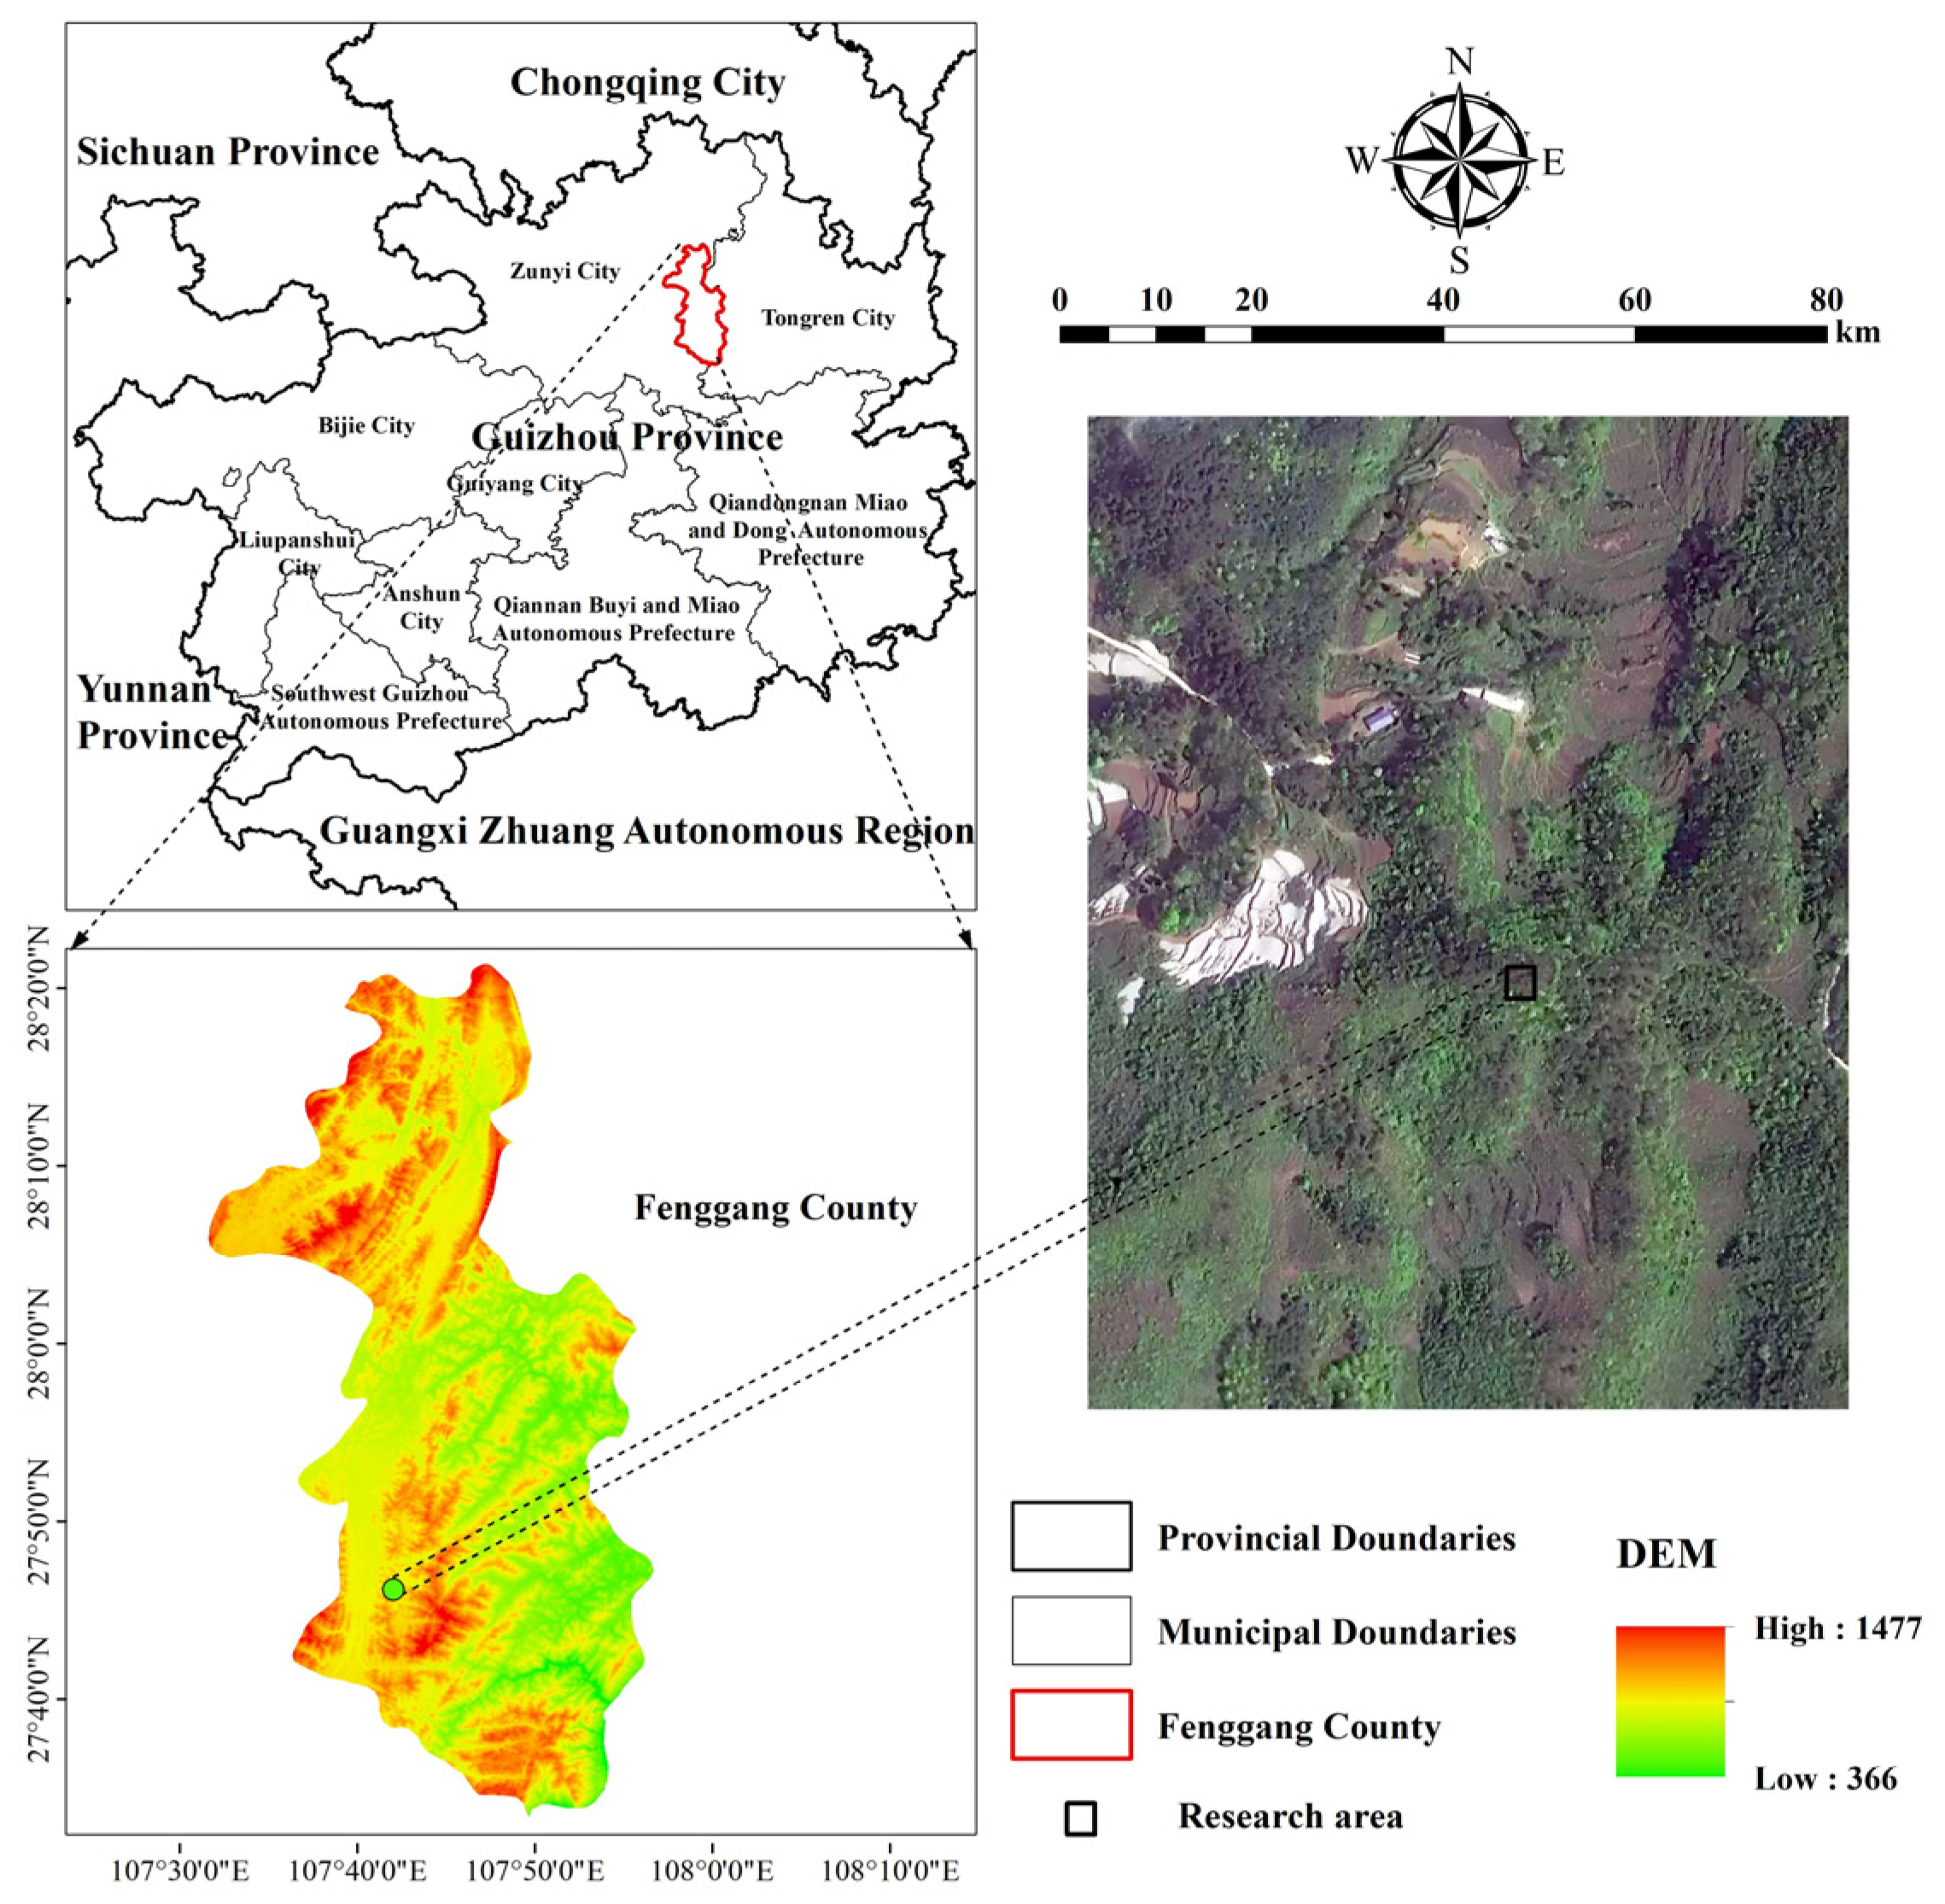
Figure 2.
Captured color images of artificially created fuel beds with different fine dead fuel loads of coniferous P. massoniana and broad-leaved Q. fabri material.
Figure 2.
Captured color images of artificially created fuel beds with different fine dead fuel loads of coniferous P. massoniana and broad-leaved Q. fabri material.
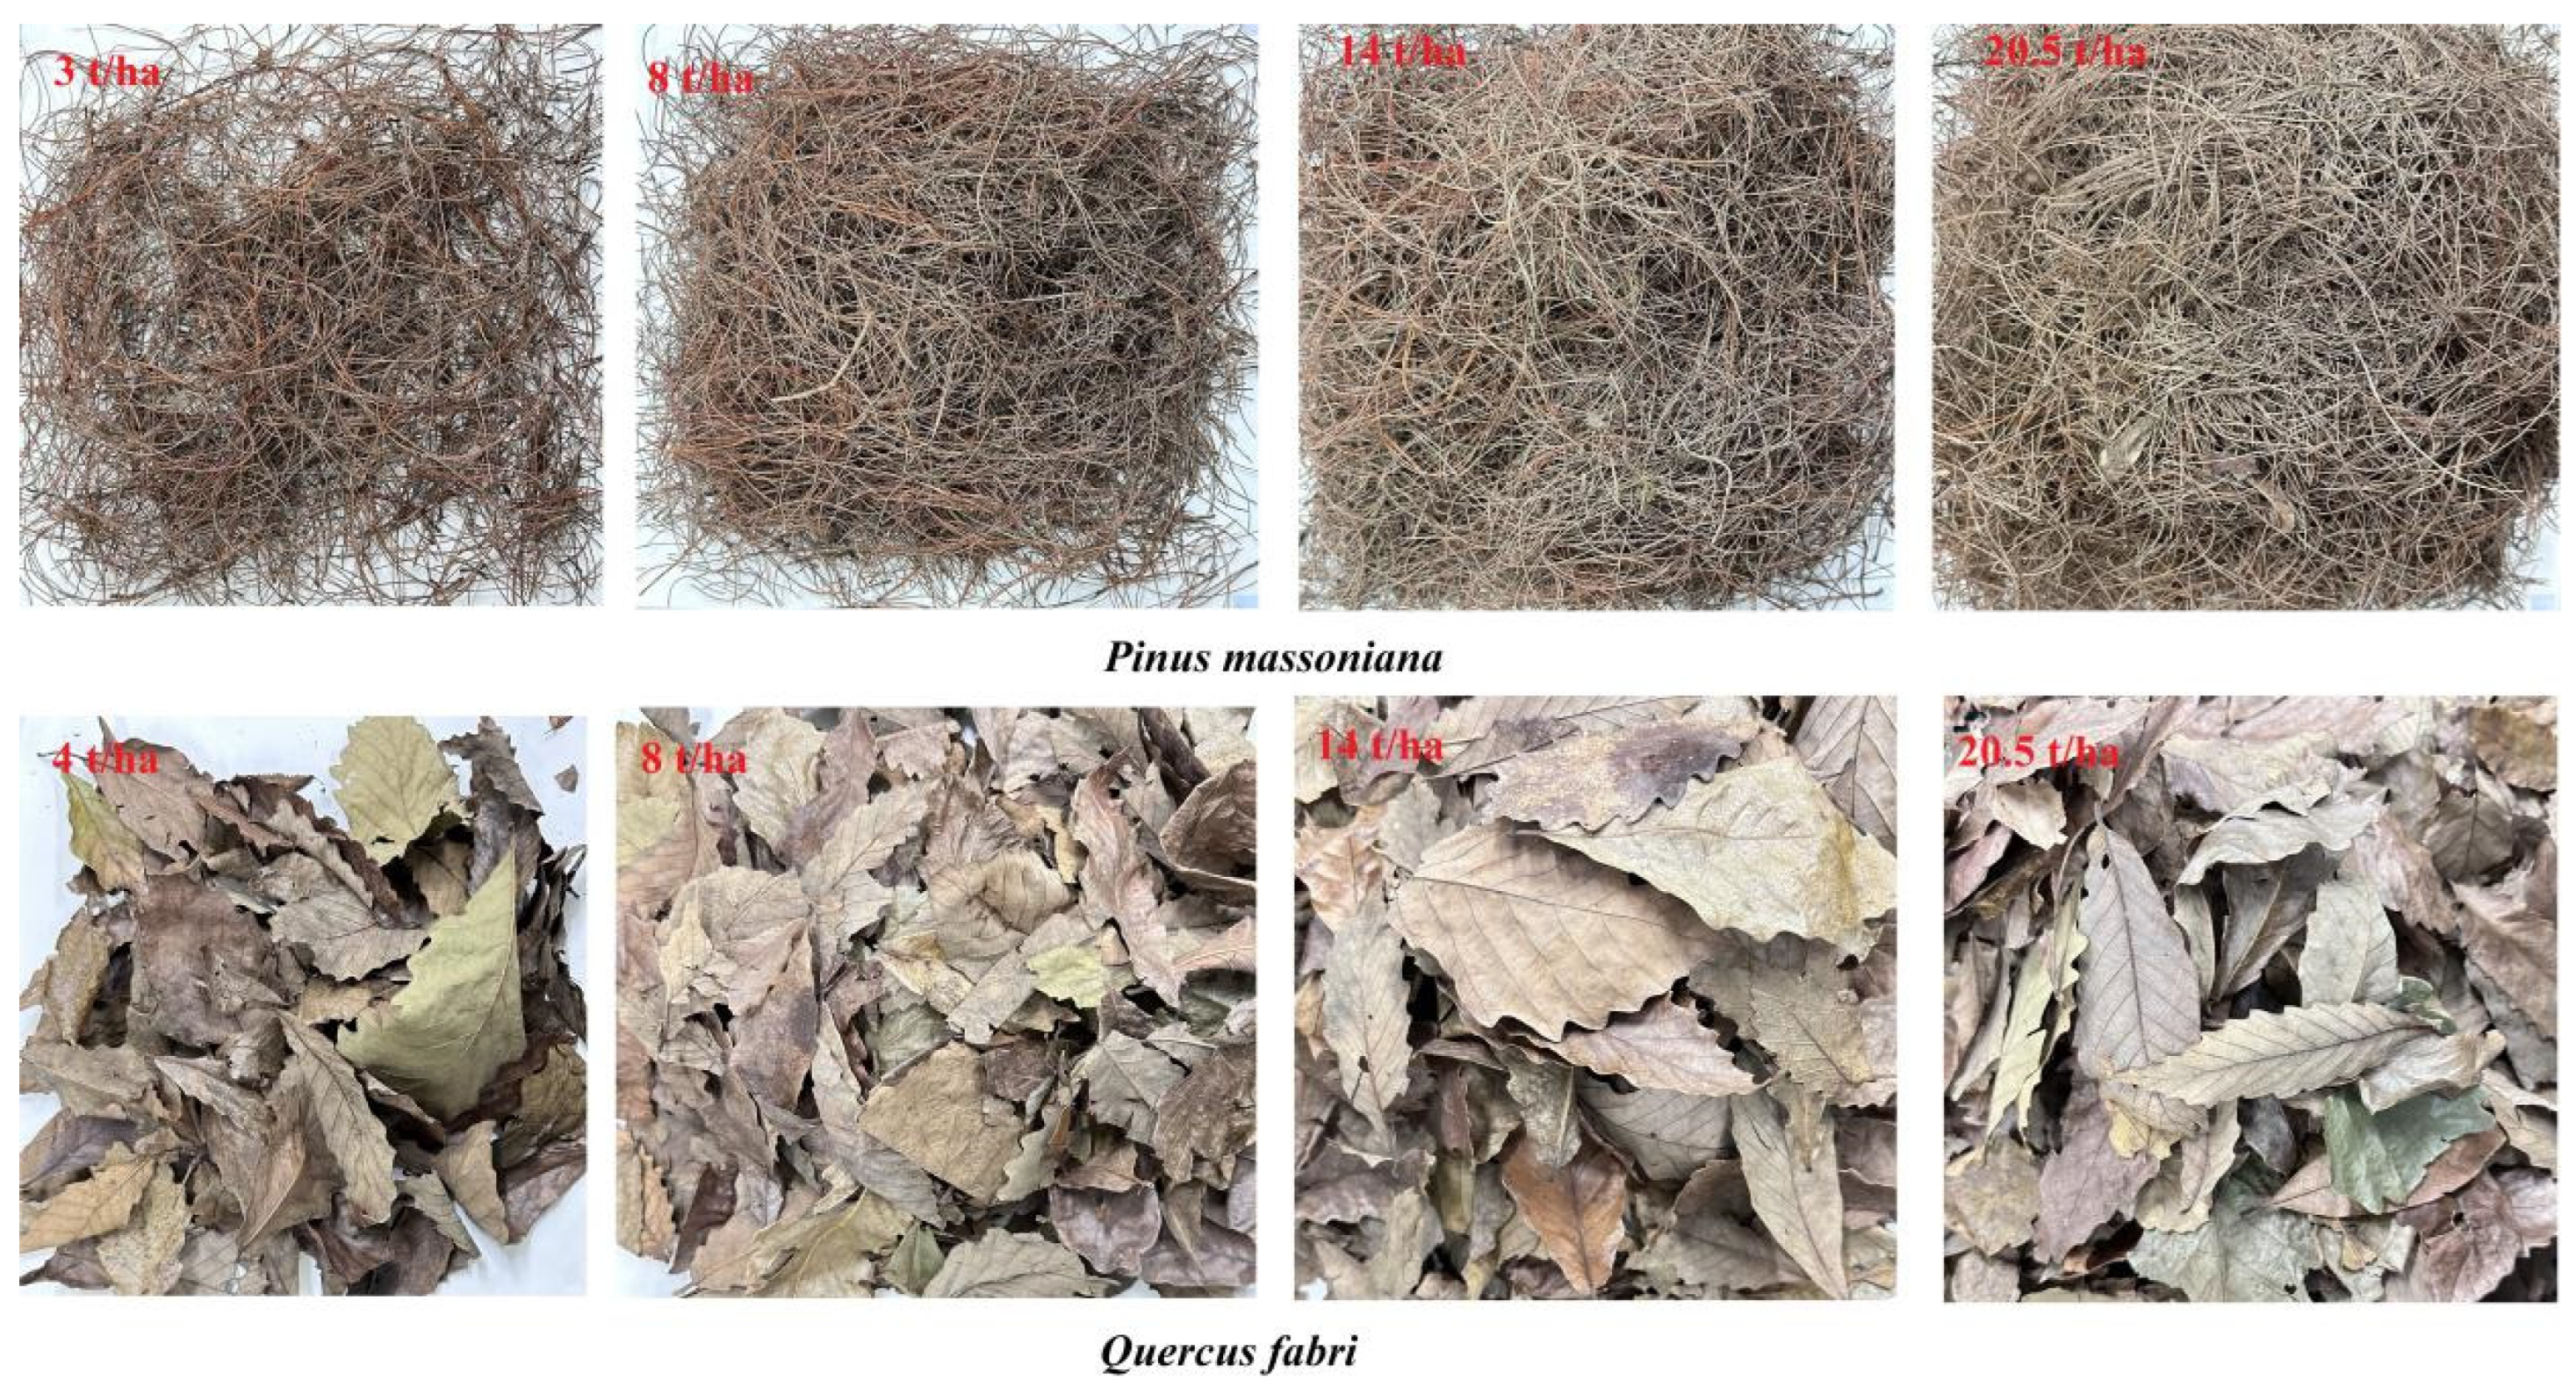
Figure 3.
Black and white images of the same P. massoniana and Q. fabri fuel beds as obtained via their binarization at different conversion thresholds.
Figure 3.
Black and white images of the same P. massoniana and Q. fabri fuel beds as obtained via their binarization at different conversion thresholds.

Figure 4.
Variation in Euler numbers as obtained from P. massoniana and Q. fabri fine dead fuelbed images depicting different fuel loads.
Figure 4.
Variation in Euler numbers as obtained from P. massoniana and Q. fabri fine dead fuelbed images depicting different fuel loads.

Figure 5.
Heatmap of the correlation between fine dead fuel load and corresponding image Euler numbers for P. massoniana and Q. fabri fuelbeds. Note: The elliptical represents the correlation between the load and Euler number under different thresholds, with blue indicating a negative correlation and red indicating a positive correlation. The darker the color, the stronger the correlation. The value in the cells represents the correlation coefficient.
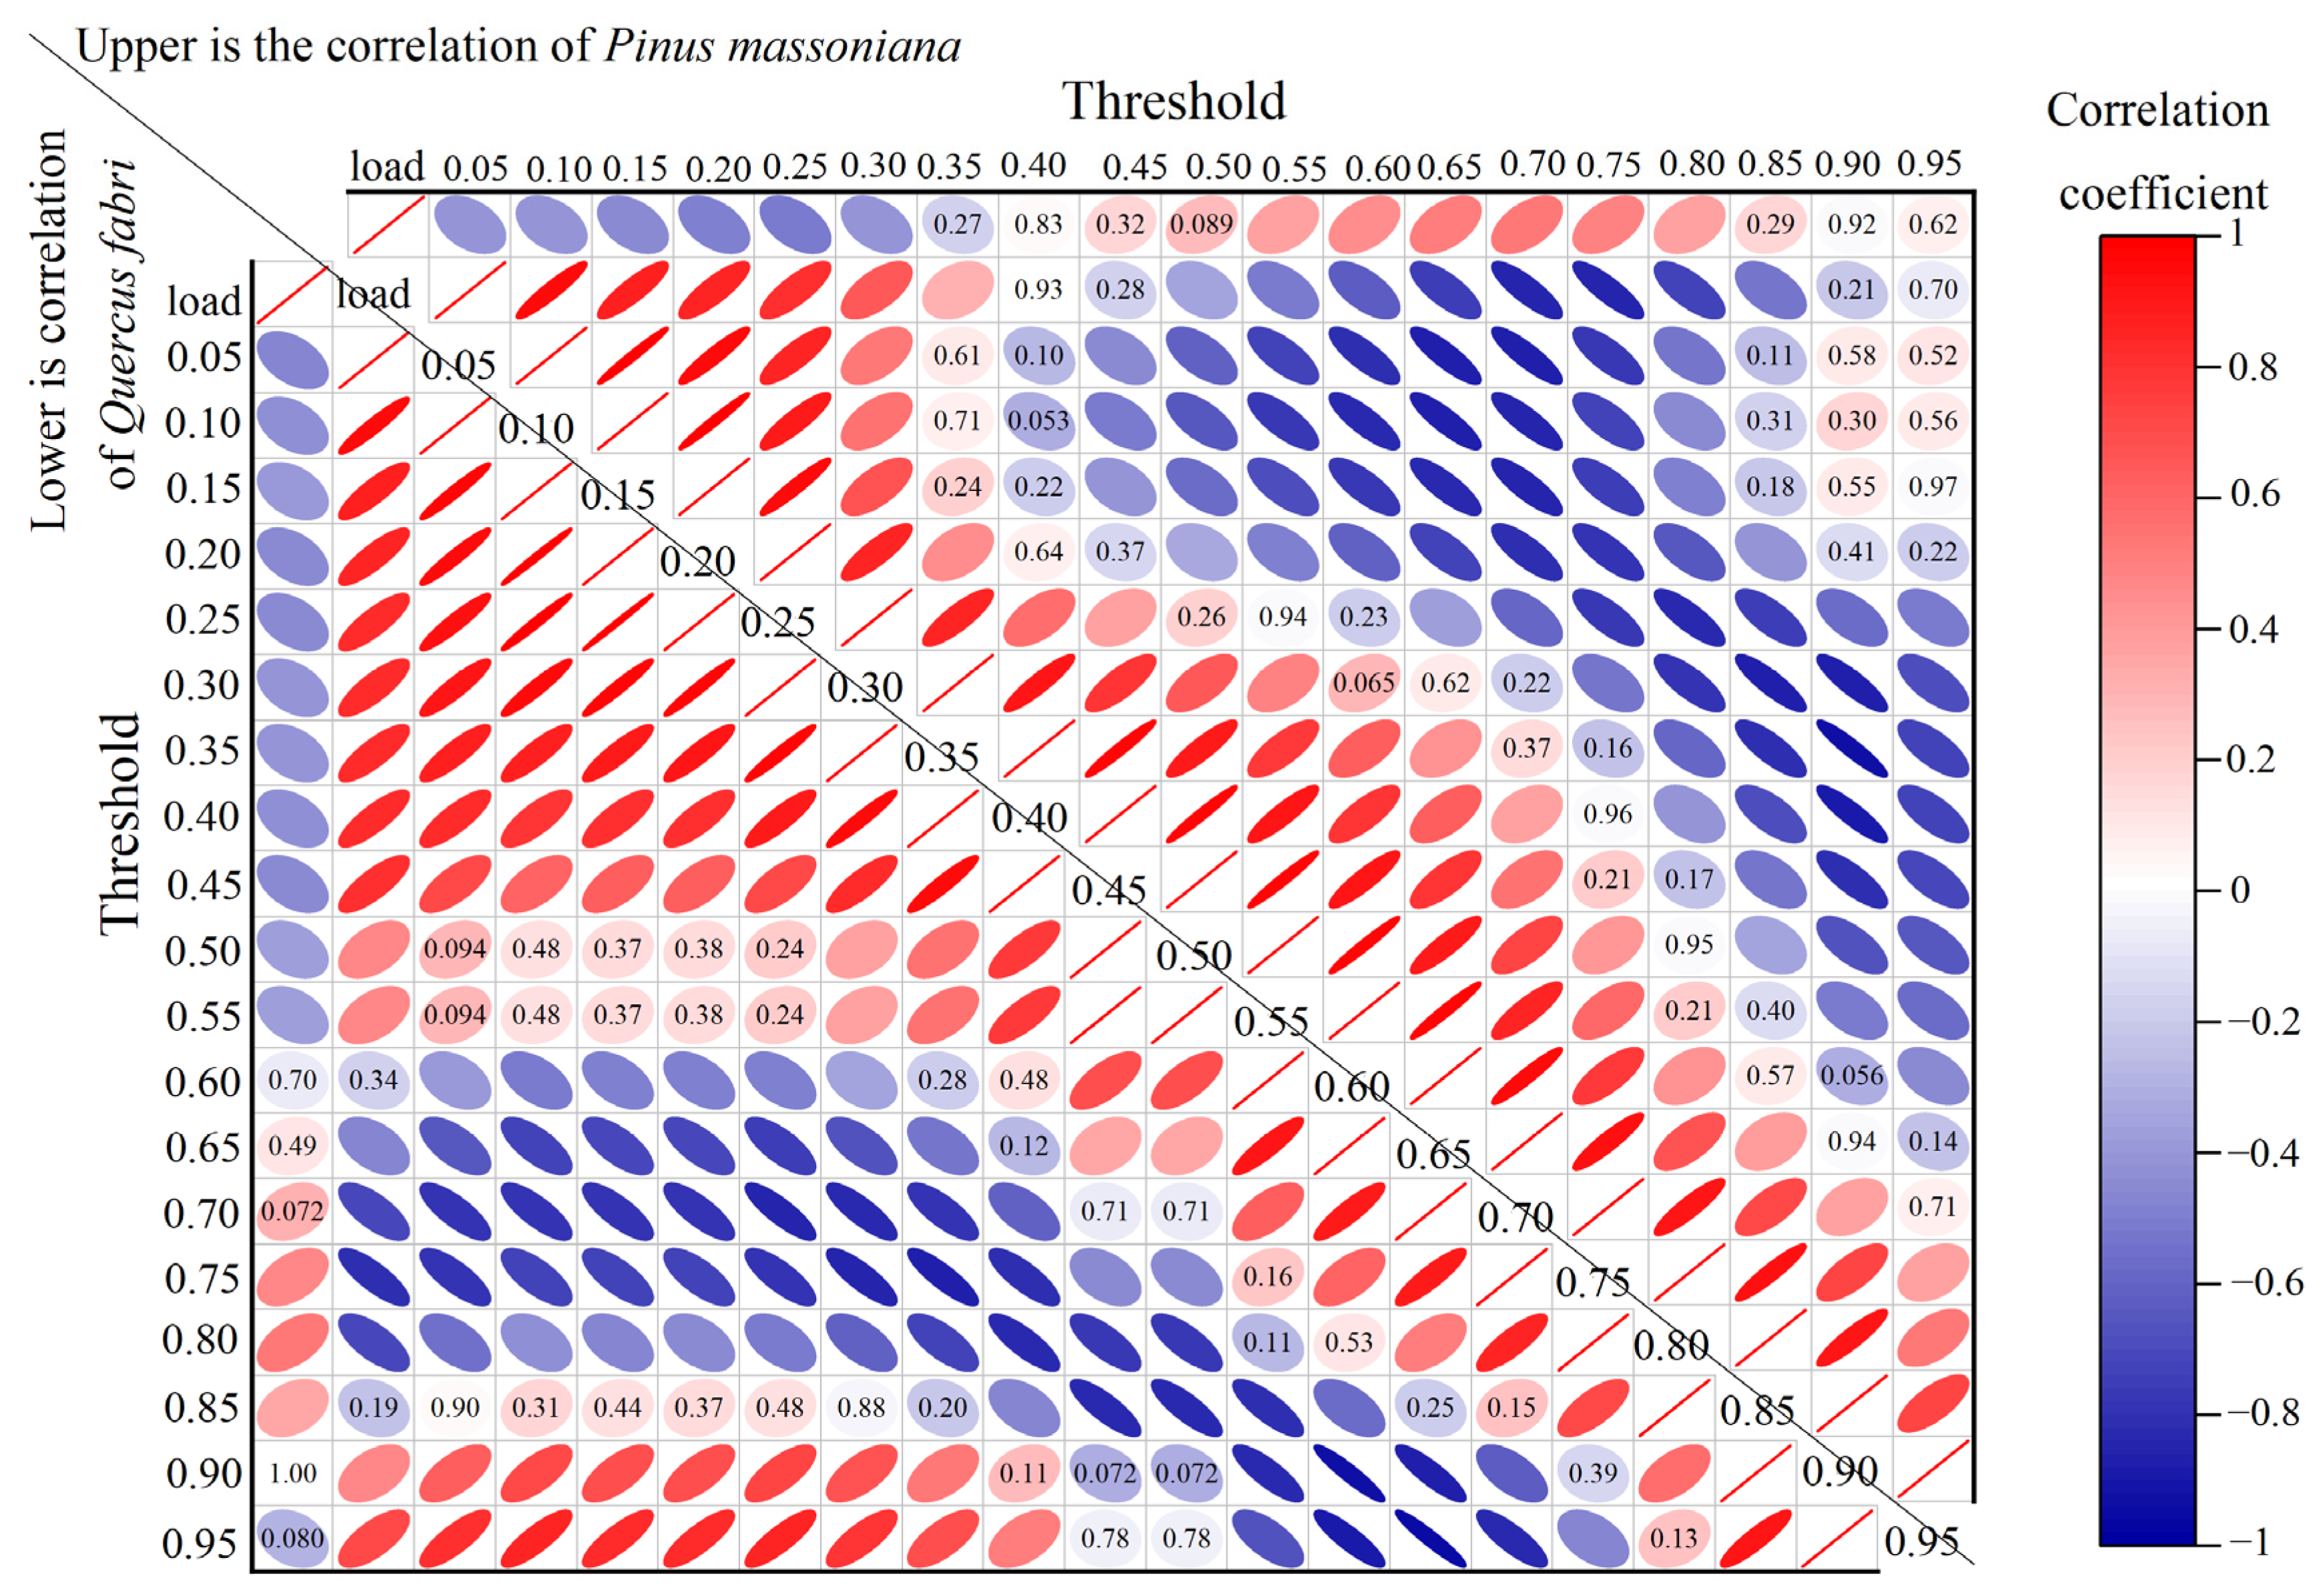
Figure 6.
The variation of fine dead fuel load of P. massoniana and Q. fabri fuelbeds with the logarithmic value of Euler numbers extracted from images.
Figure 6.
The variation of fine dead fuel load of P. massoniana and Q. fabri fuelbeds with the logarithmic value of Euler numbers extracted from images.
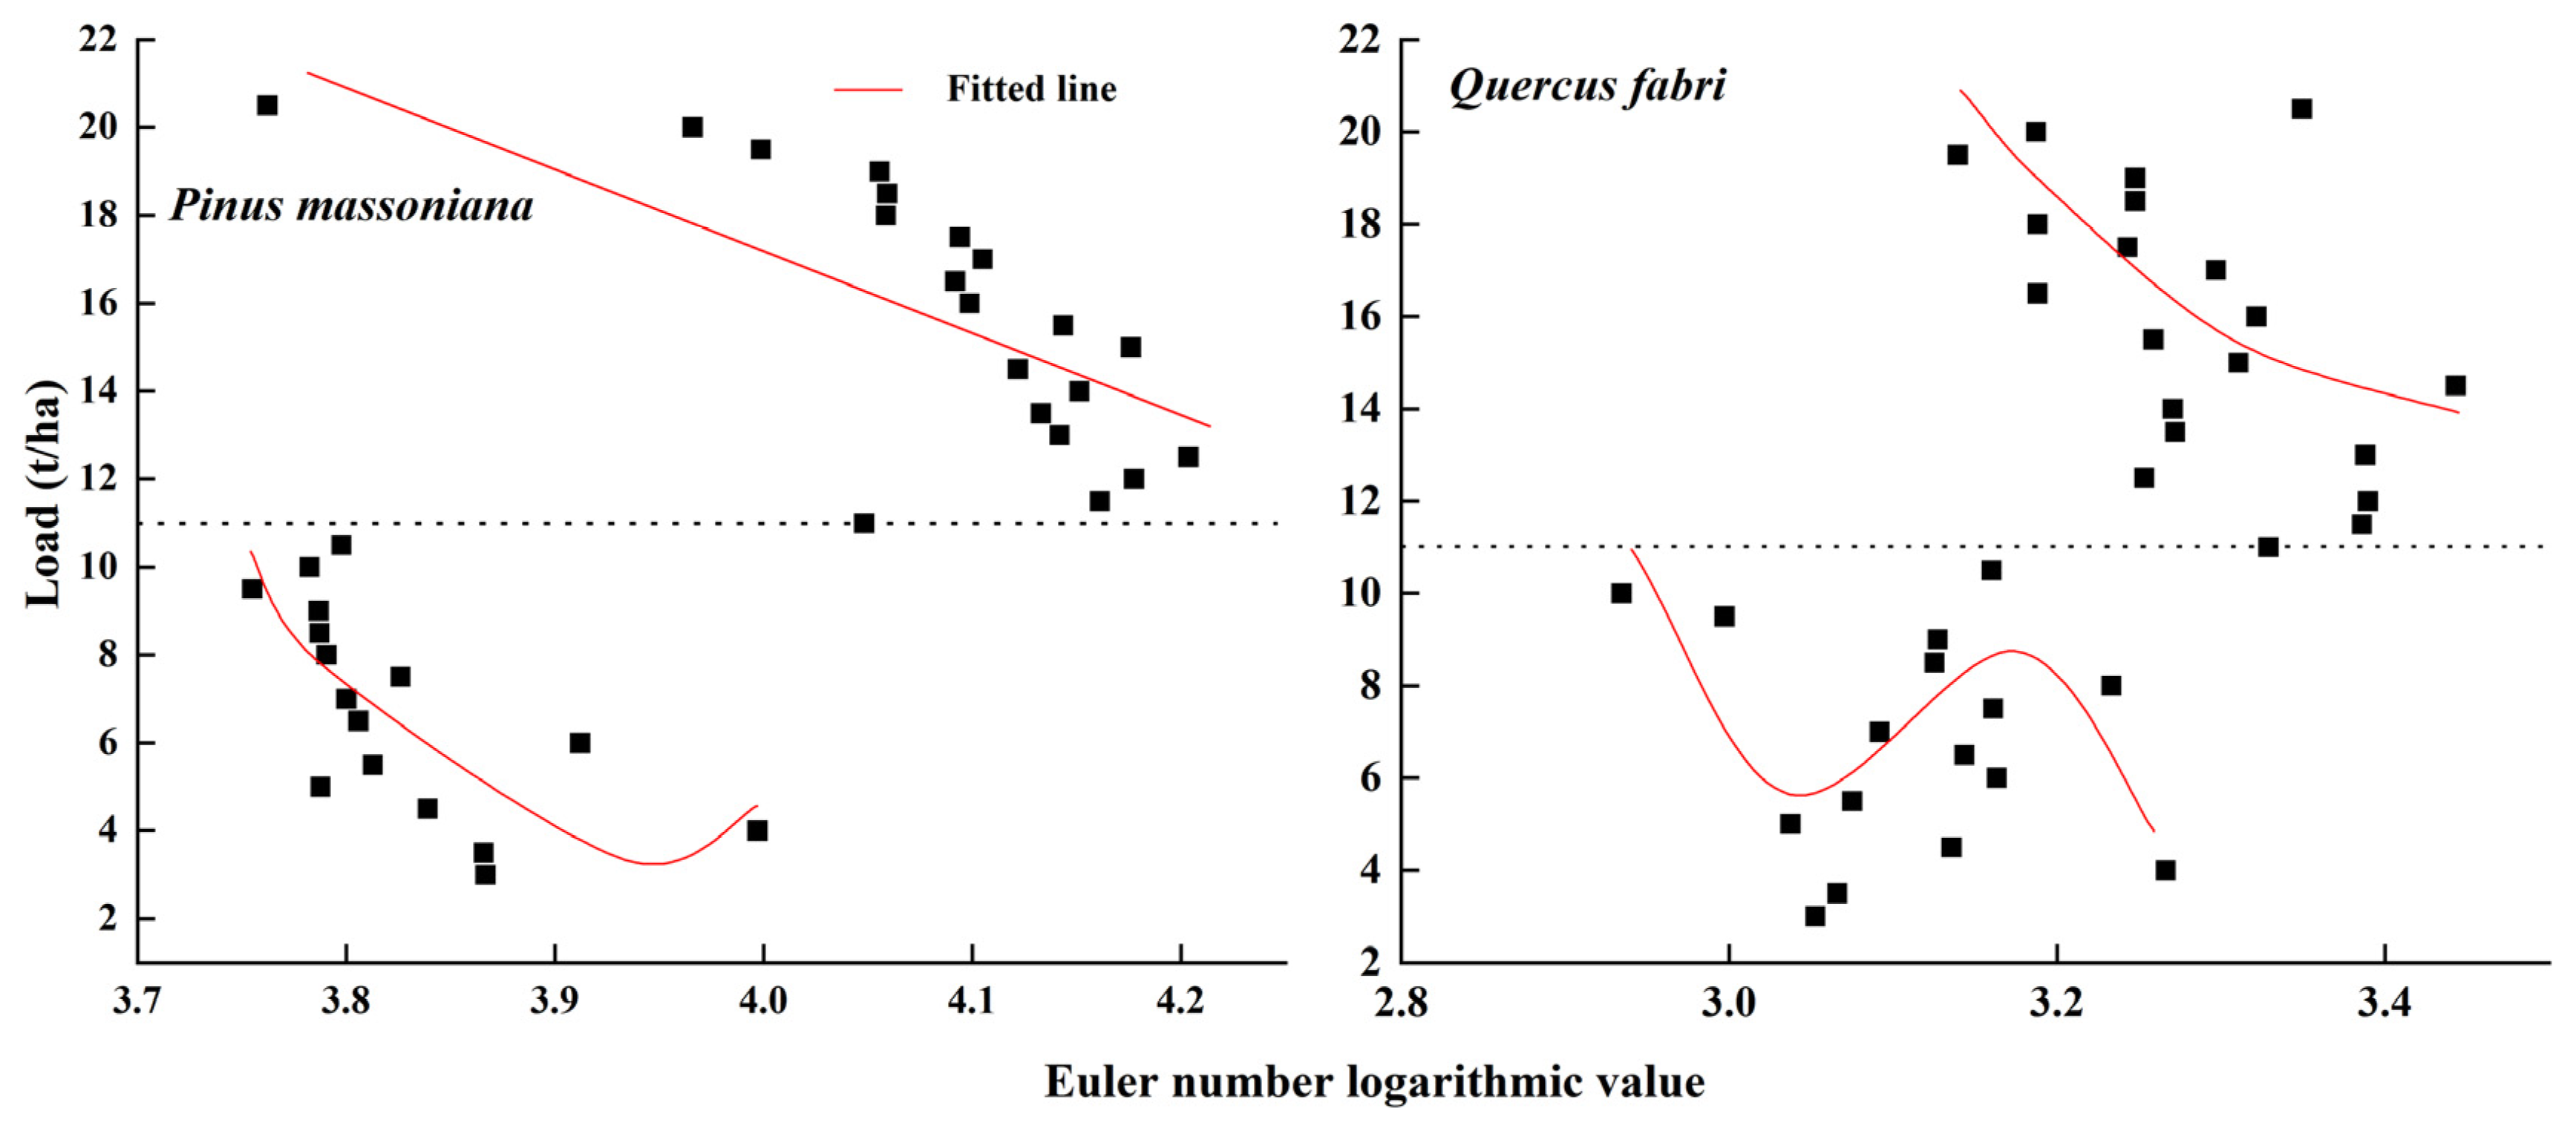
Figure 7.
Determination of random forest parameters to use in the modeling of Euler numbers as predictive values for the fine dead fuel load in P. massoniana and Q. fabri.
Figure 7.
Determination of random forest parameters to use in the modeling of Euler numbers as predictive values for the fine dead fuel load in P. massoniana and Q. fabri.

Figure 8.
A comparison of predictive models created via stepwise regression (FL1), nonlinear fitting (FL2), and random forest algorithms (F3) that use Euler numbers extracted from digitized images to predict the fine dead fuel load in P. massoniana and Q. fabri fuelbeds. Fitted lines of each model are superimposed over a dashed line, representing the deviation from the 1:1 line.

Figure 9.
Analysis of the relative differences between model errors for predictive models created via stepwise regression (FL1), nonlinear fitting (FL2), and random forest algorithms (FL3).
Figure 9.
Analysis of the relative differences between model errors for predictive models created via stepwise regression (FL1), nonlinear fitting (FL2), and random forest algorithms (FL3).

Table 1.
The basic information relating to forest stand characteristics as collected from standardized plots.
Table 1.
The basic information relating to forest stand characteristics as collected from standardized plots.
| Forest Type | Standard Plot Number | Mean DBH (cm) | Mean Tree Height (m) | Slope (°) | Aspect | Slope Position | Range of Load (t/ha) | Range of Depth (cm) |
|---|---|---|---|---|---|---|---|---|
| P. massoniana | 1 | 16.3 | 18.2 | 10.6 | South | Down | 3.6–10.8 | 3.1–4.8 |
| 2 | 12.8 | 13.9 | 9.7 | South | Mid | 2.9–6.7 | 2.6–5.4 | |
| 3 | 16.6 | 19.4 | 8.1 | Southwest | Down | 3.5–16.4 | 3.6–7.9 | |
| Q. fabri | 1 | 9.6 | 10.3 | 34.3 | Southwest | Down | 4.3–11.6 | 3.0–5.0 |
| 2 | 8.7 | 10.1 | 19.7 | West | Mid | 3.7–9.7 | 2.3–4.8 | |
| 3 | 11.2 | 11.7 | 22.3 | Southwest | Mid | 5.1–16.5 | 2.8–6.6 |
Table 2.
Multiple stepwise regression prediction model of Euler numbers.
| Fuel Type | Model | R2 | MAE (t/ha) | MRE (%) | RMSE (t/ha) |
|---|---|---|---|---|---|
| P. massoniana | FL1 = −3.44 − 0.001867E0.05 + 0.002474E0.10 + 0.002736E0.70 − 0.002153E0.90 + 0.003684E0.95 | 0.637 | 2.39 | 28.85 | 2.89 |
| Q. fabri | FL1 = −0.79 − 0.00507E0.25 − 0.00806E0.3 + 0.00309E0.4 + 0.00180E0.75 + 0.00237E0.80 − 0.005E0.85 + 0.006677E0.9 − 0.00177E0.95 | 0.654 | 2.22 | 26.89 | 2.68 |
Table 3.
Multiple stepwise regression prediction model of logarithmic Euler number values.
| Fuel Type | Load (t/ha) | Model | R2 | MAE (t/ha) | MRE (%) | RMSE (t/ha) |
|---|---|---|---|---|---|---|
| P. massoniana | 3.0–10.5 | FL2 = 3154.12 − 1601.11 × log(E0.7) + 203.43 × log(E0.7)^2 | 0.504 | 1.48 | 14.65 | 1.82 |
| 11.0–20.5 | FL2 = 104.28 − 21.66 × log(E0.7) | 0.485 | ||||
| Q. fabri | 3.0–10.5 | FL2 = 49,747.73 − 48,005.91 × log(E0.05) + 15,434.91 × log(E0.05)^2 − 1653.27 × log(E0.05)^3 | 0.251 | 1.69 | 18.09 | 2.10 |
| 11–20.5 | FL2 = 692.22 − 390.01 × log(E0.05) + 56.01 × log(E0.05)^2 | 0.274 |
Disclaimer/Publisher’s Note: The statements, opinions and data contained in all publications are solely those of the individual author(s) and contributor(s) and not of MDPI and/or the editor(s). MDPI and/or the editor(s) disclaim responsibility for any injury to people or property resulting from any ideas, methods, instructions or products referred to in the content. |
© 2024 by the authors. Licensee MDPI, Basel, Switzerland. This article is an open access article distributed under the terms and conditions of the Creative Commons Attribution (CC BY) license (https://creativecommons.org/licenses/by/4.0/).
Share and Cite
MDPI and ACS Style
Zhang, Y.; Tian, L. Predicting Fine Dead Fuel Load of Forest Floors Based on Image Euler Numbers. Forests 2024, 15, 726. https://doi.org/10.3390/f15040726
AMA Style
Zhang Y, Tian L. Predicting Fine Dead Fuel Load of Forest Floors Based on Image Euler Numbers. Forests. 2024; 15(4):726. https://doi.org/10.3390/f15040726
Chicago/Turabian StyleZhang, Yunlin, and Lingling Tian. 2024. "Predicting Fine Dead Fuel Load of Forest Floors Based on Image Euler Numbers" Forests 15, no. 4: 726. https://doi.org/10.3390/f15040726
Note that from the first issue of 2016, this journal uses article numbers instead of page numbers. See further details here.