
The Nitrogen Cycle of a Cool-Temperate Deciduous Broad-Leaved Forest
by
 , , , and
Ruoming Cao
1, 
Siyu Chen
2,
Shinpei Yoshitake
3,
Takeo Onishi
4,
Yasuo Iimura
5 and
Toshiyuki Ohtsuka
6,* 1
School of Ecology and Environment, Northwestern Polytechnical University, Xi’an 710129, China
2
School of Environment and Life Science, Nanning Normal University, No. 175 Mingxiu East Road, Nanning 530001, China
3
Faculty of Education and Integrated Arts and Sciences, Waseda University, 2-2 Wakamatsucho, Shinjuku, Tokyo 162-0056, Japan
4
Faculty of Applied Biological Sciences, Gifu University, 1-1 Yanagido, Gifu 501-1193, Japan
5
School of Environmental Science, The University of Shiga Prefecture, 2500 Hassaka, Hikone 522-8533, Japan
6
River Basin Research Center, Gifu University, 1-1 Yanagido, Gifu 501-1193, Japan
*
Author to whom correspondence should be addressed.
Forests 2024, 15(4), 725; https://doi.org/10.3390/f15040725
Submission received: 26 March 2024
/
Revised: 17 April 2024
/
Accepted: 19 April 2024
/
Published: 21 April 2024
(This article belongs to the Section Forest Ecophysiology and Biology)
Abstract
:The nitrogen (N) cycle, a major biogeochemical cycle in forest ecosystems, notably affects ecosystem multifunctionality. However, the magnitude and role of organic N and the snow season remain uncertain in this cycle. We assessed the N flux and pool data of a temperate deciduous broad-leaved forest to clarify N cycle processes. The results showed that the most important component of the N pool was the soil N pool. The N demand of the site amounted to 139.4 kg N ha−1 year−1 and was divided into tree production (83.8%) and bamboo production (16.2%). We clarified that retranslocation (37.4%), mineralization at a soil depth of 0–5 cm (15.3%), litter leachate (4.6%), throughfall (2.3%), and canopy uptake (0.5%) provided 60.1% of the N demand. In terms of soil at 0–5 cm in depth, the net mineralization rate during the snow season contributed to 30% of the annual mineralization. We concluded that the study site was not N-saturated as a result of a positive N input–output flux budget. More than half of the total N was accounted for by dissolved organic N flowing through several pathways, indicating that organic N plays a vital role in the cycle. The mineralization rate in the soil layer during the snow season is an important link in the N cycle.
1. Introduction
Nitrogen (N) is an essential yet limited element for plant growth. The biogeochemical N cycle is one of the Earth’s main element cycles. Forests cover a third of the Earth’s land surface and provide multiple services (e.g., maintenance of biodiversity, purification of air and water, and conservation of an equable climate [1]). Over the past century, N depositions in forest ecosystems have gradually increased with excessive anthropogenic activity, accompanied by both beneficial (e.g., increased tree carbon storage) and negative effects (e.g., acceleration of soil acidification) [2,3]. Excess N input can also cause elevated N drainage/output through stream water [4], which may lead to the N saturation of forests [5]. It is important to understand the overall processes of the forest N cycle and clarify the mechanisms of external and internal relational variations in forest ecosystems to use natural sources of N more efficiently or to consider how to add nitrogenous fertilizers more effectively [6].
The annual N budget was first estimated for a northern deciduous hardwood forest ecosystem at Hubbard Brook to understand the natural mechanisms of the N cycle [6]. Similar studies related to the N cycle have been conducted, mainly in coniferous forest ecosystems, since the 1970s [7,8,9,10,11]. In addition, the N biogeochemical research has been ongoing for 30 years at another North American temperate forest site (Fernow Experimental Forest) [12,13,14,15,16,17,18,19,20,21]. They have reported that soil N pools comprise a major proportion of the total N pools. The quantitative schemes of N input, N output, and several internal N fluxes have been clarified. However, the contribution proportions of different N supply pathways (e.g., N input and mineralization) to N demand are not yet fully understood for various forest types, especially during the snow season. Moreover, studies have demonstrated that organic N addition affects the N cycle by stimulating gross N transformation in temperate forest soil [22]. Organic N accounts for a certain proportion of forest N cycles [23], but its role and magnitude have often been overlooked in previous studies [24]. Therefore, it is of interest to elucidate a quantitative scheme of N flux and pools that include organic N and to identify their respective contributions to the N supply during the growing season and the snow season. In recent years, considerable emphasis has been placed on N deposition input, N addition experiments, the soil N cycle, canopy exchange, and the interactions between N deposition, plants, and the pedosphere [25,26,27,28].
The Takayama forest site (TKY) is a temperate deciduous broad-leaved forest in the AsiaFlux network that was established in 1993 and has continued to record carbon (C) cycle data [29,30,31,32,33], meteorology data (global solar radiation, long-wave radiation, air temperature, humidity, wind characteristics), leaf traits, and so on (http://asiaflux.net/index.php?page_id=112, accessed on 14 January 2024). Studying the N cycle can assist in the analysis of the interaction between the C and N cycles in the TKY forest site. In addition, the roles of N deposition as a N input pathway and N denitrification as a N output pathway were clarified by previous studies [34,35]. N deposition was found to be 11.1 kg N ha−1 year−1, with a significant contribution (78%) from dissolved organic N (DON) shown on the study plot. This level was lower than that found in other studies [34]. The authors found that snow flux had a relatively high contribution (almost half of the N deposition) in the study plot. Therefore, we assessed and integrated N flux and pool data at the TKY permanent site to clarify the N cycle. We hypothesized that (1) the TKY site is not N-saturated; (2) the contribution of the N supply in the snow season is comparable to that in the growing season; and (3) organic N may make a major contribution to the N cycle at the TKY site.
2. Materials and Methods
2.1. Study Site
The TKY forest site is a cool-temperate deciduous broad-leaved forest, located on the mid-slope of Mt. Norikura in the Takayama Forest Research Station, which is part of the River Basin Research Center, Gifu University, central Japan (36°08′ N, 137°25′ E, 1420 m a.s.l.). A permanent plot of 1 ha (100 m × 100 m) was set up for field measurements in 1998 (Figure 1). The TKY forest site (60–70 years old) is dominated by Quercus crispula (26.9% of the total basal area), Betula ermanii (24.6%), and B. platyphylla var. japonica (14.6%) [30]. The forest floor is covered (approx. 40 stems m−2) by dense dwarf bamboo grass (Sasa senanensis) that is 1–1.5 m in height [36]. The soil was classified as an andisol with Japanese volcanic ash [31]. The climate is seasonally cool-temperate, with a mean annual air temperature of 7.2 °C and a mean annual precipitation of 2207 mm (average 32% contribution from snowfall) during the period from 2010 to 2023 (data were obtained from the meteorological station at the Takayama Field Station). Seasons were divided into the growing season (May–November) and the snow season (December–April).
2.2. Pools
2.2.1. Biomass Pools
The permanent plot (100 m × 100 m) was divided into four subplots (50 m × 50 m). The diameter at breast height (DBH) of all of the trees in these four subplots was measured with steel tapes in October 2016. The biomasses of all tree stems, branches, and coarse roots were calculated using DBH–weight allometric equations [30]. The amount of annual leaf fall was regarded as the tree foliage biomass because almost all trees were deciduous species (97.2% of the total basal area [30]). Litterfall was collected using fourteen litter traps (1 m2 area each) once per month during the growing season from 2008 to 2016. Traps were randomly set up on the forest floor in the permanent plot. Litterfall during the snow season was collected immediately after snowmelt (March or April). Aboveground biomass of understory dwarf bamboo (foliage and culms) was estimated by collecting aboveground parts of bamboo from the 100 cm × 100 cm quadrats (n = 3) in August 2017. The biomass of tree fine roots and the belowground biomass of understory bamboo (fine roots and rhizomes) were estimated by Yashiro and others (2012) [37]. Samples were collected from soils in a 100 cm × 200 cm quadrat with a depth of 50 cm (n = 3) in May 2000.
Dry biomass was converted to N pools using the N concentration (%) of live tree parts (foliage n = 39, stems n = 32, branches n = 37, and fine roots n = 9) and live bamboo parts (foliage, culms, fine roots, and rhizomes; n = 3, respectively) determined by a CN analyzer (SUMIGRAPH NC-22F, Shimadzu Corp., Kyoto, Japan) after drying at 70–80 °C to a constant weight. The N concentration of coarse tree roots was assumed to be equal to that of tree stems.
2.2.2. Necromass Pools
The necromass of coarse woody debris (CWD) was divided into three decay classes (I, II, III) in autumn 2001 [29,33]. Dry necromass was converted to N pools using the N concentration (%) of CWD samples (n = 4 for each decay class, respectively) with a CN analyzer (SUMIGRAPH NC-22F, Shimadzu Corp., Kyoto, Japan) after drying at 70 °C to a constant weight.
2.2.3. Soil Pools
To determine the total N in soil fractions, soil samples were collected using 5 cm diameter soil corers beneath the litter layer at soil depths ranging from 0 to 75 cm (0–5 cm, 5–10 cm, 10–15 cm, 15–20 cm, 25–30 cm, 40–45 cm, and 70–75 cm; n = 3, respectively) in June 2005. These soil samples were oven-dried at 105 °C to a constant weight. The dry weight of the soil was converted to the soil N pool using the soil N concentration multiplied by bulk density and depth. The soil N concentration was also determined using the CN analyzer. The extractable pools of soil inorganic N were determined from soil samples collected using 100 mL soil corers as initial value samples before resin core incubation to measure the net N mineralization and nitrification rate, as described in Section 2.3.2.
2.3. Fluxes
2.3.1. N Input
Bulk deposition (BD) (n = 3) was estimated near the study plot from May 2015 to April 2018. During the growing season, BD was collected using plastic bottles (20 L) equipped with funnels. During the snow season, BD was collected using a 100 mL soil corer from the snow surface to the soil surface. The details of the sampling method and data have been described by Cao et al. (2019) [34].
2.3.2. Internal N Flux
Throughfall (TF) and stemflow (SF) were collected from May 2015 to April 2018 [34]. During the growing season (May–November), the samples were collected on the south-facing slope, north-facing slope, and valley bottom (n = 3, respectively) at the permanent site once per month. During the snow season, we assumed that TF was the same as BD and that no SF occurred.
Litter leachate (LL) was collected using zero-tension lysimeters (collection area: 144 cm2) once per month from May 2015 to April 2018 during the growing season. Lysimeters were set up underneath the litter layer on the south-facing slope, north-facing slope, and valley bottom (n = 3, respectively). Snowmelt samples (n = 6) were collected using square plastic containers (volume: 12 L) in April 2018. The containers had been randomly set up beneath the litter layer in December 2017. The N concentrations of LL were measured colorimetrically with a nutrient auto-analyzer (QuAAtro 2-HR, BL TEC Co., Ltd., Tokyo, Japan). DON concentrations were calculated using the differences between the concentrations of total dissolved N (TDN) and dissolved inorganic N (DIN). The N fluxes of LL were calculated with the following equation:
where F refers to the LL fluxes of dissolved N in one sampling period (kg N ha−1 period−1), h refers to the average water flux corresponding to one sampling period (mm period−1), C refers to the volume-weighted mean (VWM) concentration of dissolved N during one sampling period (mg N L−1), and 100 is the unit conversion factor. The annual LL fluxes of dissolved N (kg N ha−1 year−1) were calculated using the sum of the monthly dissolved N fluxes during the growing season and the snow season.
F = hC/100,
The net N transformation rate in the soil layer (0–5 cm) was determined using the resin core method, which was incubated in situ using a PVC core. Field measurements were carried out from May 2013 to April 2014. Each resin core comprised a 10 g upper resin bag, a 100 mL soil core tube, and a 10 g bottom resin bag. The soil core tube was sandwiched between the upper and bottom resin bags using plastic tape. The cores were randomly placed in 10 m × 10 m subplots (100 points in total) for in situ incubation in May 2013 and November 2013, and collected in November 2013 and April 2014. Soil samples were collected using 100 mL soil corers as initial value samples before each resin core incubation. After incubation and collection, 3 g of soil samples taken from the initial samples and soil core tubes was extracted using 30 mL of 2 M KCl. The bottom resin bag samples were extracted using 90 mL of 2 M KCl. All extraction samples were shaken at about 200 rpm on a shaker for 1 h and filtered through quantitative ashless filter papers. The dissolved inorganic N concentrations of the filtered extraction samples were measured colorimetrically using a nutrient auto-analyzer (QuAAtro 2-HR, BL TEC Co., Ltd., Tokyo, Japan). The soil net mineralization and net nitrification rates were defined as the difference in mineral N (NH4+ + NO3−) or nitrate (NO3−) between the end and the beginning of the incubation period divided by the length of the incubation period and collection area, respectively [38].
The total N requirements for plant biomass production were estimated based on our measurements of new foliage production and stand increments. The N requirements of foliage were calculated by multiplying new foliage biomass by fresh foliage N concentrations taken from 2008 to 2016. The N requirements of stems and coarse roots were calculated by multiplying the biomass increments of each part observed from 1999 to 2009 [39] by the corresponding N concentrations. The N requirements of fine roots were equal to the biomass increments of fine roots in 2000 [40] multiplied by the N concentrations. The increase in bamboo dry weight was calculated based on the net primary production (NPP) of understory bamboo [36]. The N requirements of bamboo (foliage, culm, and belowground) were calculated by multiplying the dry weight increase by the N concentration of live bamboo.
The annual N retranslocation of tree foliage was estimated by multiplying the difference in N concentrations between live and fallen leaves by the annual leaf biomass measured from 2008 to 2016. The annual N resorption of bamboo foliage was calculated in 2017 using the same equation as for tree foliage. The fallen bamboo foliage was collected from the 100 cm × 100 cm quadrats in October 2017 (n = 9). The N concentrations of fallen trees and bamboo leaves were determined by the CN analyzer after drying at 70 °C to a constant weight.
2.3.3. N Output
In order to measure the discharge from the permanent plot, a right-angle triangular weir was built (Figure 1). The basin area was 5.56 ha. A water level logger (HOBO-U20, Onset Computer Corporation) was installed at the downstream end of the basin to record water level data. The recording intervals were 10 min. The data utilized for our analysis were taken from 1 December 2018 to 30 November 2019. The water samples were collected by auto-samplers set up in the weir. The discharge was calculated from the water level as follows [41]:
where Q refers to the discharge (m3 interval−1), K refers to the discharge coefficient, and H refers to the overflow depth (m). Q (m3 interval−1) was converted to mm interval−1 by dividing it by the catchment area (55,600 m2) and multiplying it by a unit conversion factor of 1000. The annual discharge Q (mm year−1) was calculated with the sum of Q (mm interval−1) corresponding to each interval time.
Q = KH1.547,
The discharge coefficient (K) was calculated using the following formula [41]:
where W refers to the weir’s height (m) and B refers to the weir’s width (m).
The N concentrations of water samples were measured colorimetrically using the nutrient auto-analyzer (QuAAtro 2-HR, BL TEC Co., Ltd., Tokyo, Japan). The N leaching (kg N ha−1 year−1) was calculated by the annual discharge Q (mm year−1) multiplied by the mean N concentration (mg L−1) and then divided by 100 as a conversion factor.
The N denitrification rate was simulated using the Vegetation Integrative Simulator for Trace gases (VISIT), a terrestrial ecosystem model [35].
3. Results
The N pools in the soil comprised a large portion (94.2%) of the total N pools in the study site (Table 1). The remaining N storage was distributed between trees (distribution percentage: 4.8%), understory bamboo (0.8%), and CWD (0.2%). The N concentrations in tree foliage (2.4%) were higher than those in the other parts of the trees. Stems had low N concentrations (0.1%) but high N storage (154.1 kg N ha−1) as a result of their large masses. About 90% of the total N in trees was allocated to their aboveground parts. The N concentrations of understory bamboo foliage (2.1%) were similar to the N concentration patterns of trees, which were higher than those in the other parts of the bamboo. In contrast to the N pool distributions of the trees, the N pools in bamboo were evenly distributed between foliage (distribution percentage: 29.6%), culms (26.1%), and fine roots (32.4%), but rhizomes (11.9%) made a low contribution to bamboo N pools.
The N deposition amounted to 11.1 kg N ha−1 year−1, characterized by high DON deposition (71.2%) [34]. Similar to N deposition, N leaching was 2.4 kg N ha−1 year−1, characterized by high DON output (75.0%) (Table 2). Balancing N input (11.1 kg N ha−1 year−1) and N output (2.4 kg N ha−1 year−1) revealed that 8.7 kg of N ha−1 year−1 remained in the forest ecosystem, about 78% of which was accreted. In total, 70.0% of the N budget was sourced from the DON budget (6.1 kg N ha−1 year−1).
The total N requirement of the stand amounted to 139.4 kg N ha−1 year−1, consisting of tree production (83.8%) and bamboo production (16.2%) (Table 3). The foliage and fine root production of trees demanded a large portion (81.3%) of N for growth in the stand, although the N pools of tree foliage and fine roots were relatively small compared to the other parts. The annual N retranslocation of tree and bamboo foliage amounted to 52.0 kg N ha−1 year−1, which accounted for around 37.4% of the N requirements. Net canopy uptake (net TF = TF–BD, NO3 + NO2–N) and TF were 0.7 kg N ha−1 year−1 and 3.2 kg N ha−1 year−1, which supplied 0.5% and 2.3% of the N requirements, respectively. The LL in the litter layer and the 0–5 cm mineral soil supplied 19.9% of the N requirements of the study site. The LL contribution during the snow season accounted for 7.8% of the total LL contributions. The results showed that the net mineralization rate fluctuated significantly between the 100 subplots. The average annual net mineralization rate in the mineral soil (0–5 cm depth) during the growing season was 14.9 kg N ha−1 period−1, ranging between 0.2 and 75.3 kg N ha−1 period−1. During the snow season, it amounted to 6.4 kg N ha−1 period−1, ranging between 0.1 and 27.9 kg N ha−1 period−1, which accounted for 30.0% of the N supply from the mineral soil at a depth of 0–5 cm. Overall, retranslocation, canopy uptake, throughfall, and mineralization (litter layer and 0–5 cm mineral soil) accounted for 60.1% of the N demand. The contributions of these processes can be ranked as follows: retranslocation > mineralization in soil layer > LL in litter layer > TF > canopy uptake. The remaining 39.9% of N sources were not accounted for.
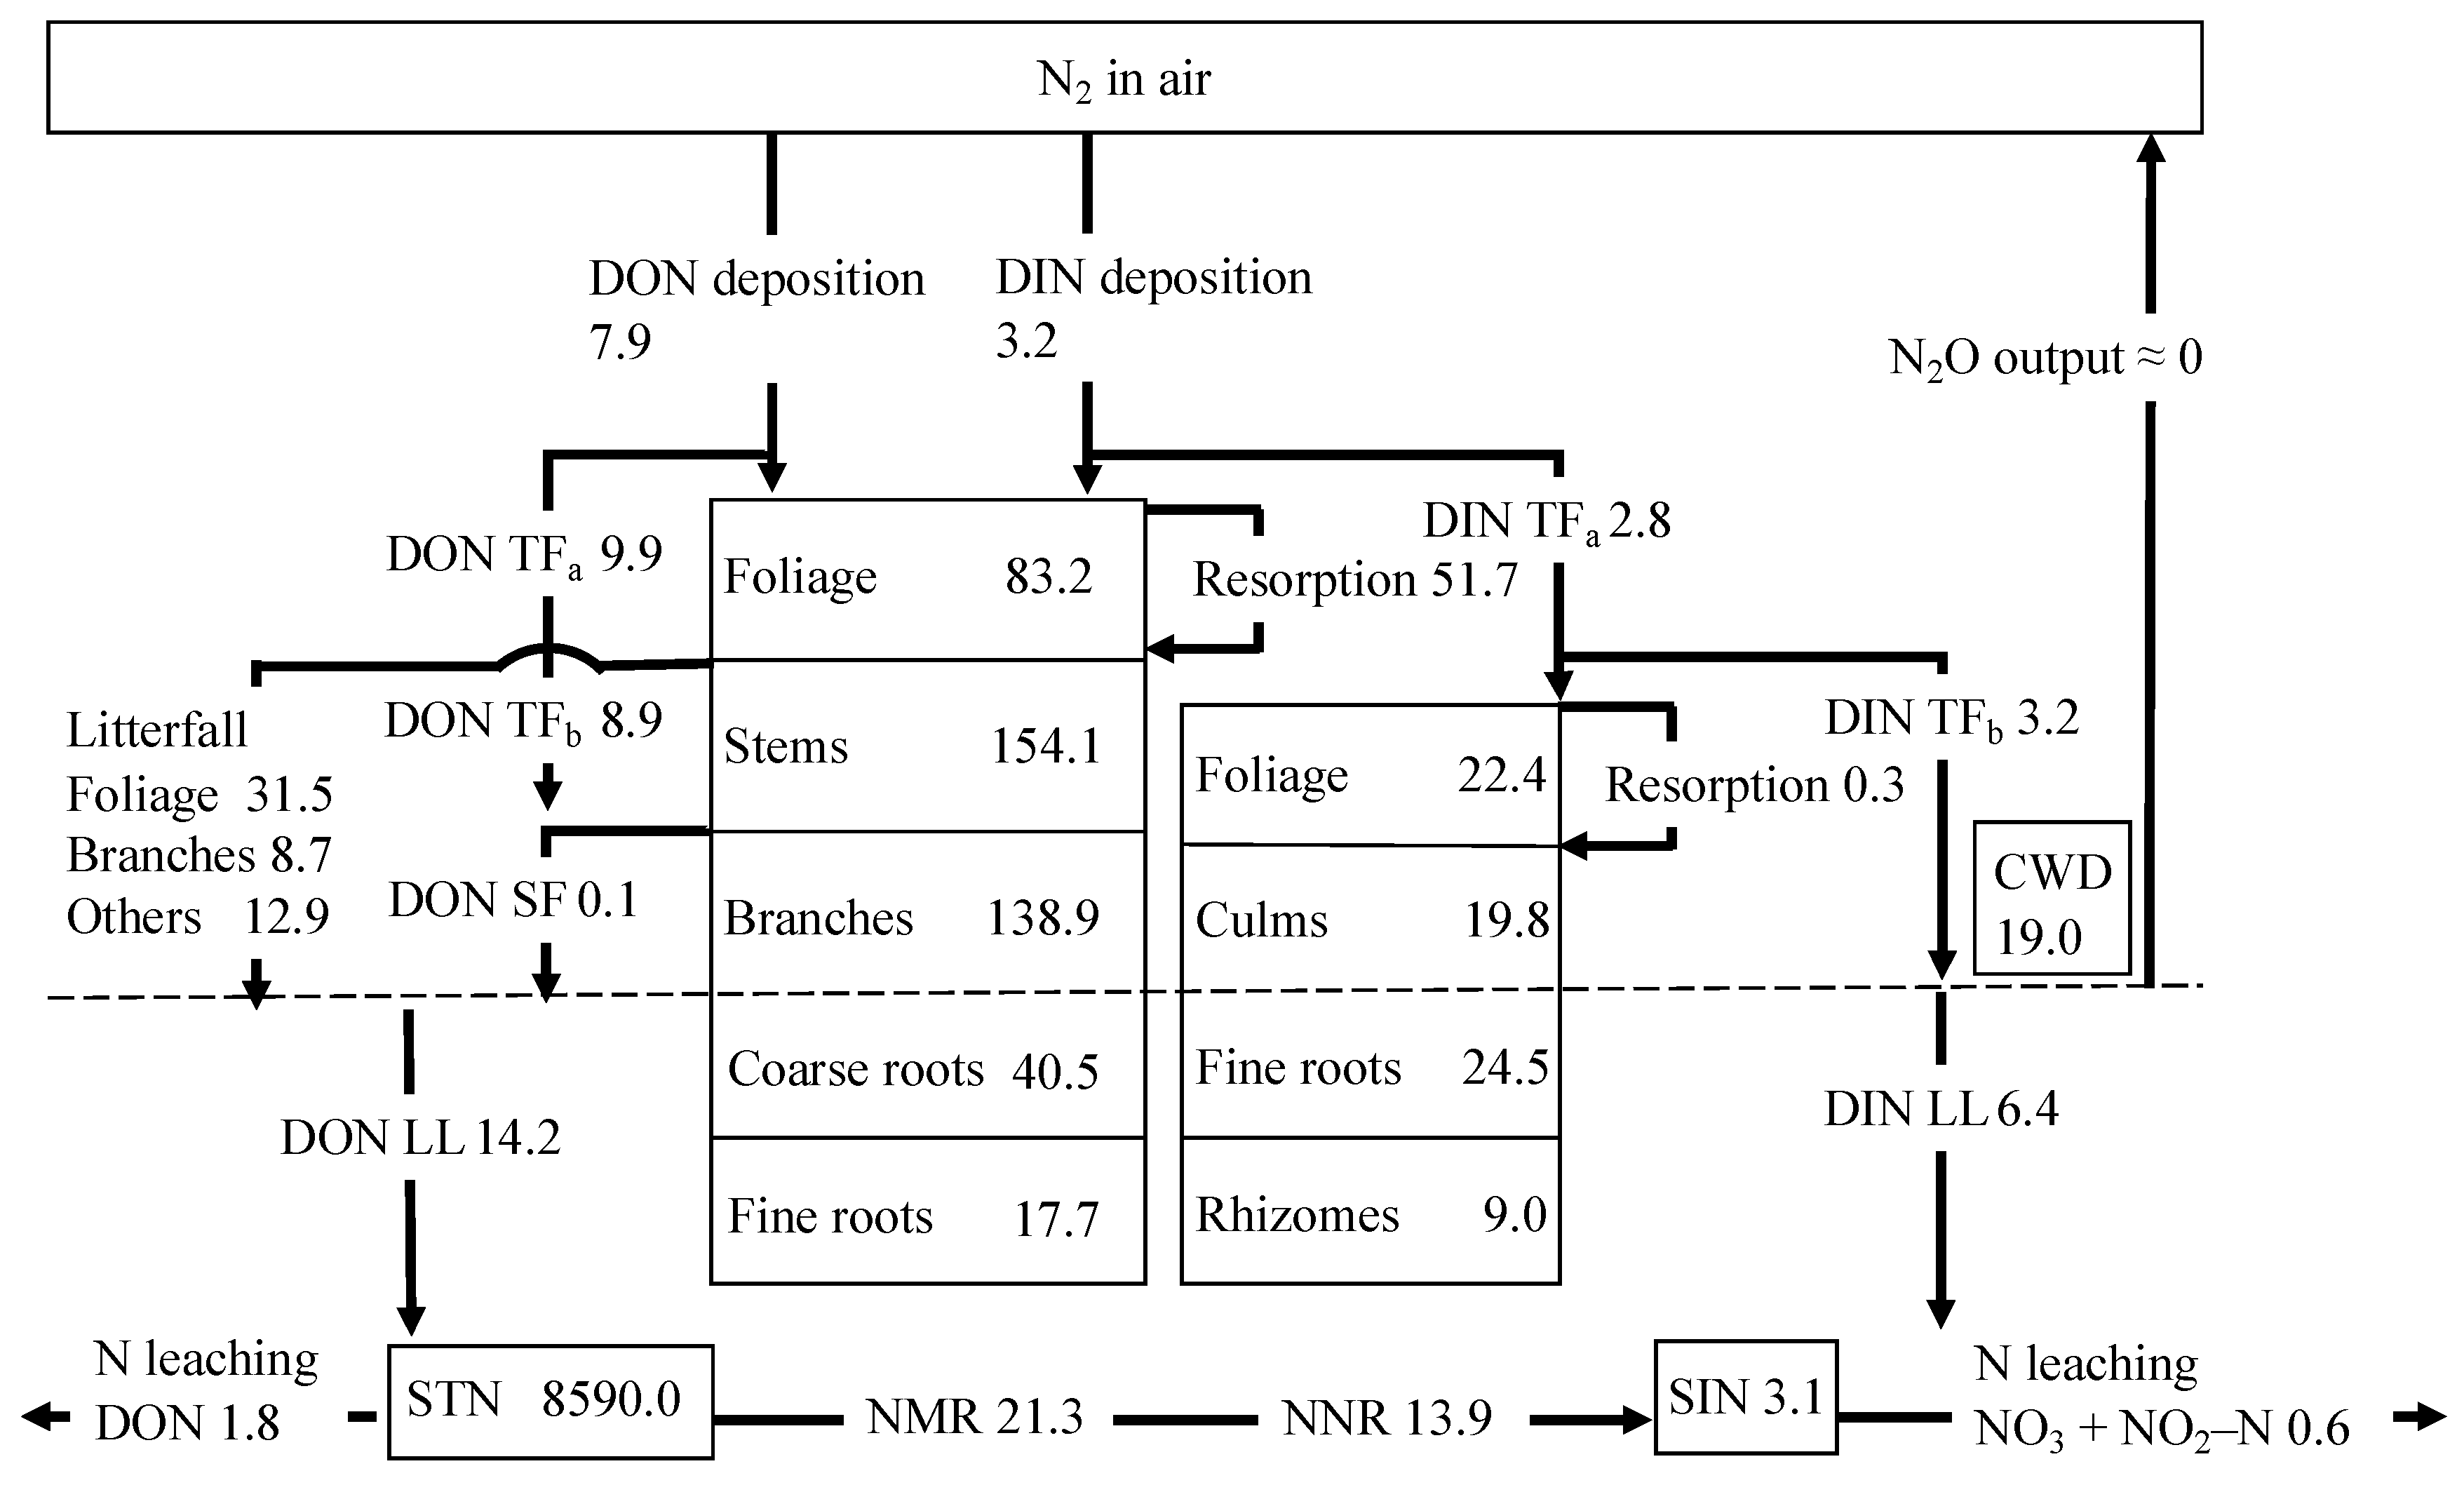
Figure 2 shows the integrated N cycle with N fluxes and pools in the TKY site, characterized by high organic N flow but relatively low DIN flow. DON fluxes in LL (14.2 kg N ha−1 year−1) and total N in litterfall (53.1 kg N ha−1 year−1) were input into the soil layer, but only 1.8 kg N ha−1 year−1 of DON was output from the site. DIN fluxes in LL (6.4 kg N ha−1 year−1) were input into the soil layer, and 0.6 kg N ha−1 year−1 of DIN was output from the site, indicating that 5.8 kg N ha−1 year−1 of DIN was retained in the study site’s internal N cycle.
4. Discussion
4.1. Distribution Patterns of N Pools
Most of the N in the TKY site was found in the soil (94.2%), which is similar to the results of studies in the ecosystem of a spruce forest site [8] and Hubbard Brook Experimental Forest [6]. In addition, the N pool distribution patterns of plants at the study site were characterized by higher distribution in the aboveground parts of trees, as also found by the Hubbard Brook Experimental Forest ecosystem study [6]. The understory dwarf bamboo differed from the tree layer; the ratio of the aboveground part to the underground part was close to 1. Microbial biomass was not estimated in this study. A quantitative scheme of the N cycle in a mature Norway spruce stand showed that microbial biomass occupied a very small fraction (0.5%) of total N pools [8], so we considered that neglecting to measure it in this study would not affect the overall allocation patterns of N pools.
4.2. Characteristics of N Fluxes
N inputs with high DON contributions (78%) in the study site were divided into TF (77.8% DON) and SF (87.5% DON) [34] and then combined with litterfall to form LL (68.9% DON). As a form of N output, N leaching also contained a large portion of DON (75.0%), which was the opposite of the DON fraction (2.5%) found in the Northern Hardwood Forest Ecosystem [6] but consistent with that in a boreal pine forest (92.3%) [24]. This study found that large DON contributions were made by BD, TF, SF, LL, and leaching throughout the N cycle at the TKY site, suggesting the importance of DON in the area. A possible cause is the extremely high DON deposition (7.9 kg N ha−1 year−1), which provides the initial source of organic N. Recent studies have shown that DON can stimulate phytoplankton growth, producing nearly 10 times more chlorophyll-A than DIN [42]. In addition, many studies have attempted to identify effective ways to remove DON due to its harmful effects on drinking water [43]; therefore, DON cannot be ignored in forest ecosystems because of its pollutant status. More research is urgently needed to confirm and discuss the composition of the N cycle in forest ecosystems.
An ecosystem where N losses approximate or exceed N inputs can be considered N-saturated [5,9]. The N input–output balance remaining in the ecosystem of the study site was estimated at 8.7 kg N ha−1 year−1. In temperate forest ecosystems, the deposition thresholds for N saturation were estimated to be 5–46 kg N ha−1 year−1, 5–30 kg N ha−1 year−1, and 8–15 kg N ha−1 year−1 based on soil, tree, and stream water indicators, respectively [44]. N deposition in the study site was 11.1 kg N ha−1 year−1, which was less than the upper limits of these ranges. These results indicate that the study site was not saturated.
The N sources of the study site included retranslocation, TF, canopy exchange, and mineralization in litter and the soil layer. Retranslocation accounted for one-third of the N supply, consistent with the result at Hubbard Brook [6]. During the snow season, the contributions of TF and LL were relatively small, whereas the contribution of mineralization in the soil layer was relatively large, indicating that soil microbes are still active during the snow season and can promote the soil layer mineralization rate. The results showed that the sources of 39.9% of N were not found. A possible source of N may be N mineralization in deeper soil layers (>5 cm). Iimura et al. (2019) [45] found that the net mineralization rate in soil at a depth of 5–10 cm amounted to 23 kg N ha−1 period−1 during the growing season in the TKY site, supplying 16.5% of the N demand. In addition, topographic heterogeneity of N flux mineralization (in the 0–5 cm soil layer) was found, with large fluctuations between 100 subplots (0.1–75.3 kg N ha−1 period−1), which may cause an imbalance between N supply and requirement in the study plot. Different geographical locations have various microenvironmental climates, such as water conditions. Studies have shown that water shortages can affect N uptake and biomass production [46]. Moreover, canopy uptake in this study was simply measured using net TF. Future studies can further identify N fate and canopy uptake using isotopic tracing or canopy budget models.
4.3. Uncertainties
This study can provide a comprehensive understanding of the forest N cycle, but there are some inadequacies. One limitation is the inconsistency in sampling time, which could lead to inaccurate data integration. For example, our sampling period of tree fine root biomass, N pools in soil, the necromass of CWD, and the N requirements of the stems, coarse roots, and fine roots of trees and bamboo was relatively long. Previous studies have found that fine root biomass increases with stand development and then decreases or tends to remain stable [47,48,49,50]. The TKY forest site is 60–70 years old and remains in good condition, implying that the fine root biomass remains in a stable state. We also considered that the soil N pool was stable due to reduced N leaching and N2O output. Elevation, human impact, and forest structure are the most important factors in CWD accumulation [51,52]. We assumed that no extreme temporal change in CWD occurred in the study plot [53] because it is sheltered from human interference. It was reported that the interval annual variations in NPP were minimal in the study site [39]. Therefore, the effects of inconsistent sampling times were negligible in this study.
5. Conclusions
This study demonstrates a relatively complete data integration of the N cycle of a deciduous broad-leaved forest site in the AsiaFlux network. We concluded that the TKY site was not N-saturated as a result of a positive N input–output flux budget. The N supplied from mineralization at the litter layer and 0–5 cm deep soil during the snow season contributed to 5% of the N demand at the study site. In terms of 0–5 cm deep soil, the net mineralization rate during the snow season was 30% of the annual mineralization. The results showed that soil mineralization was an important component of the N supply. Moreover, DON accounted for more than half of the N supply in several N flux pathways, especially N input (71.2%) and output (75.0%). This indicates that DON flux might be more worthy of study than DIN under the current changing global conditions, particularly decreased N deposition. Therefore, DON flux should be considered in the specific N cycle processes of forest ecosystems, for example, through simulating N addition in control experiments. Future studies should focus on clarifying N pools and flux processes from further forest ecosystems and elevation gradient plots to better elucidate the N flux mechanisms (e.g., N mineralization) that may be affected by geography.
Author Contributions
Conceptualization, R.C. and T.O. (Toshiyuki Ohtsuka); methodology, S.Y., T.O. (Takeo Onishi), and Y.I.; formal analysis, R.C.; investigation, R.C., S.C., and S.Y.; resources, T.O. (Toshiyuki Ohtsuka); writing—original draft preparation, R.C.; writing—review and editing, S.Y., Y.I., and T.O. (Toshiyuki Ohtsuka); supervision, T.O. (Toshiyuki Ohtsuka). All authors have read and agreed to the published version of the manuscript.
Funding
This research was supported by the Environment Research and Technology Development Fund (JPMEERF20221C07) of the Environmental Restoration and Conservation Agency provided by the Ministry of the Environment of Japan.
Data Availability Statement
The data presented in this study are available on request from the corresponding author ([email protected]).
Acknowledgments
We are grateful to the members of the Takayama Forest Research Station, which is part of the River Basin Research Center at Gifu University, for their kind cooperation in the field survey.
Conflicts of Interest
The authors declare no conflicts of interest.
References
- Jones, L.; Provins, A.; Holland, M.; Mills, G.; Hayes, F.; Emmett, B.; Hall, J.; Sheppard, L.; Smith, R.; Sutton, M.; et al. A Review and Application of the Evidence for Nitrogen Impacts on Ecosystem Services. Ecosyst. Serv. 2014, 7, 76–88. [Google Scholar] [CrossRef]
- Thomas, R.Q.; Canham, C.D.; Weathers, K.C.; Goodale, C.L. Increased Tree Carbon Storage in Response to Nitrogen Deposition in the US. Nat. Geosci. 2010, 3, 13–17. [Google Scholar] [CrossRef]
- Kristensen, H.L.; Gundersen, P.; Callesen, I.; Reinds, G.J. Throughfall Nitrogen Deposition Has Different Impacts on Soil Solution Nitrate Concentration in European Coniferous and Deciduous Forests. Ecosystems 2004, 7, 180–192. [Google Scholar] [CrossRef]
- Ohrui, K.; Mitchell, M.J. Nitrogen Saturation In Japanese Forested Watersheds. For. Ecol. Manag. 1997, 7, 391–401. [Google Scholar] [CrossRef]
- Aber, J.; McDowell, W.; Nadelhoffer, K.; Magill, A.; Berntson, G.; Kamakea, M.; McNulty, S.; Currie, W.; Rustad, L.; Fernandez, I. Nitrogen Saturation in Temperate Forest Ecosystems. Bioscience 1998, 48, 921–934. [Google Scholar] [CrossRef]
- Bormann, F.H.; Likens, G.E.; Melillo, J.M. Nitrogen Budget for an Aggrading Northern Hardwood Forest Ecosystem. Science 1977, 196, 981–983. [Google Scholar] [CrossRef] [PubMed]
- Jordan, C.; Caskey, W.; Escalante, G.; Herrera, R.; Montagnini, F.; Todd, R.; Uhl, C. The Nitrogen Cycle in a “Terra Firme” Rainforest on Oxisol in the Amazon Territory of Venezuela. Plant Soil 1982, 67, 325–332. [Google Scholar] [CrossRef]
- Kreutzer, K.; Butterbach-Bahl, K.; Rennenberg, H.; Papen, H. The Complete Nitrogen Cycle of an N-Saturated Spruce Forest Ecosystem. Plant Biol. 2009, 11, 643–649. [Google Scholar] [CrossRef] [PubMed]
- Gundersen, P. Nitrogen Deposition and the Forest Nitrogen Cycle: Role of Denitrification. For. Ecol. Manag. 1991, 44, 15–28. [Google Scholar] [CrossRef]
- Friedland, A.J.; Miller, E.K.; Battles, J.J.; Thorne, J.F. Nitrogen Deposition, Distribution and Cycling in a Subalpine Spruce-Fir Forest in the Adirondacks, New York, USA. Biogeochemistry 1991, 14, 31–55. [Google Scholar] [CrossRef]
- Fahey, T.J.; Yavitt, J.B.; Pearson, J.A.; Knight, D.H. The Nitrogen Cycle in Lodgepole Pine Forests, Southeastern Wyoming. Biogeochemistry 1985, 1, 257–275. [Google Scholar] [CrossRef]
- Storm, A.; Adams, M.B.; Schuler, J. Long-Term Projection of Species-Specific Responses to Chronic Additions of Nitrogen, Sulfur, and Lime. Forests 2021, 12, 1069. [Google Scholar] [CrossRef]
- Smith, L.J.; Stephan, K. Nitrogen Fertilization, Stand Age, and Overstory Tree Species Impact the Herbaceous Layer in a Central Appalachian Hardwood Forest. Forests 2021, 12, 829. [Google Scholar] [CrossRef]
- Kemner, J.E.; Adams, M.B.; McDonald, L.M.; Peterjohn, W.T.; Kelly, C.N. Fertilization and Tree Species Influence on Stable Aggregates in Forest Soil. Forests 2021, 12, 39. [Google Scholar] [CrossRef]
- Guillén, L.A.; Adams, M.B.; Elliot, E.; Hubbart, J.; Kelly, C.; McNeil, B.; Peterjohn, W.; Zegre, N. The Fernow Experimental Forest, West Virginia, USA: Insights, Datasets, and Opportunities. Hydrol. Process. 2021, 35, e14106. [Google Scholar] [CrossRef]
- Gilliam, F.S. Response of Temperate Forest Ecosystems under Decreased Nitrogen Deposition: Research Challenges and Opportunities. Forests 2021, 12, 509. [Google Scholar] [CrossRef]
- Eastman, B.A.; Adams, M.B.; Brzostek, E.R.; Burnham, M.B.; Carrara, J.E.; Kelly, C.; McNeil, B.E.; Walter, C.A.; Peterjohn, W.T. Altered Plant Carbon Partitioning Enhanced Forest Ecosystem Carbon Storage after 25 Years of Nitrogen Additions. New Phytol. 2021, 230, 1435–1448. [Google Scholar] [CrossRef] [PubMed]
- Burnham, M.B.; Christ, M.J.; Adams, M.B.; Peterjohn, W.T. Assessing the Linkages between Tree Species Composition and Stream Water Nitrate in a Reference Watershed in Central Appalachia. Forests 2021, 12, 1116. [Google Scholar] [CrossRef]
- Eisenhut, S.E.; Holásková, I.; Stephan, K. Role of Tree Species, the Herb Layer and Watershed Characteristics in Nitrate Assimilation in a Central Appalachian Hardwood Forest. Nitrogen 2022, 3, 333–352. [Google Scholar] [CrossRef]
- Eastman, B.A.; Adams, M.B.; Peterjohn, W.T. The Path Less Taken: Long-Term N Additions Slow Leaf Litter Decomposition and Favor the Physical Transfer Pathway of Soil Organic Matter Formation. Soil Biol. Biochem. 2022, 166, 108567. [Google Scholar] [CrossRef]
- Moore, J.A.M.; Anthony, M.A.; Pec, G.J.; Trocha, L.K.; Trzebny, A.; Geyer, K.M.; van Diepen, L.T.A.; Frey, S.D. Fungal Community Structure and Function Shifts with Atmospheric Nitrogen Deposition. Glob. Chang. Biol. 2021, 27, 1349–1364. [Google Scholar] [CrossRef] [PubMed]
- Lu, M.; Cheng, S.; Fang, H.; Xu, M.; Yang, Y.; Li, Y.; Zhang, J.; Müller, C. Organic Nitrogen Addition Causes Decoupling of Microbial Nitrogen Cycles by Stimulating Gross Nitrogen Transformation in a Temperate Forest Soil. Geoderma 2021, 385, 114886. [Google Scholar] [CrossRef]
- Song, L.; Kuang, F.; Skiba, U.; Zhu, B.; Liu, X.; Levy, P.; Dore, A.; Fowler, D. Bulk Deposition of Organic and Inorganic Nitrogen in Southwest China from 2008 to 2013. Environ. Pollut. 2017, 227, 157–166. [Google Scholar] [CrossRef] [PubMed]
- Korhonen, J.F.J.; Pihlatie, M.; Pumpanen, J.; Aaltonen, H.; Hari, P.; Levula, J.; Kieloaho, A.J.; Nikinmaa, E.; Vesala, T.; Ilvesniemi, H. Nitrogen Balance of a Boreal Scots Pine Forest. Biogeosciences 2013, 10, 1083–1095. [Google Scholar] [CrossRef]
- Shi, L.; Zhang, H.; Liu, T.; Zhang, W.; Shao, Y.; Ha, D.; Li, Y.; Zhang, C.; Cai, X.; Rao, X.; et al. Consistent Effects of Canopy vs. Understory Nitrogen Addition on the Soil Exchangeable Cations and Microbial Community in Two Contrasting Forests. Sci. Total Environ. 2016, 553, 349–357. [Google Scholar] [CrossRef] [PubMed]
- Liu, N.; Liu, F.; Sun, Z.; Wang, Z.; Yang, L. Nitrogen Addition Changes the Canopy Biological Characteristics of Dominant Tree Species in an Evergreen Broad-Leaved Forest. Sci. Total Environ. 2023, 902, 165914. [Google Scholar] [CrossRef] [PubMed]
- Cao, M.; Zheng, X.; Cui, L.; Wu, F.; Gao, H.; Jiang, J. Soil Bacterial Communities Are More Sensitive to Short-Term Nitrogen Deposition than Fungal Communities in Subtropical Chinese Fir Forests. For. Ecol. Manag. 2023, 549, 121490. [Google Scholar] [CrossRef]
- Yuan, J.; Peng, M.; Tang, G.; Wang, Y. Effects of Simulated Nitrogen Deposition on Soil Respiration: Evidence from a Three-Year Field Study of the Abies georgei (Orr) Forest in the Jiaozi Snow Mountains National Nature Reserve, Southwest China. For. Ecol. Manag. 2023, 542, 121098. [Google Scholar] [CrossRef]
- Jia, S.; Akiyama, T. A Precise, Unified Method for Estimating Carbon Storage in Cool-Temperate Deciduous Forest Ecosystems. Agric. For. Meteorol. 2005, 134, 70–80. [Google Scholar] [CrossRef]
- Ohtsuka, T.; Akiyama, T.; Hashimoto, Y.; Inatomi, M.; Sakai, T.; Jia, S.; Mo, W.; Tsuda, S.; Koizumi, H. Biometric Based Estimates of Net Primary Production (NPP) in a Cool-Temperate Deciduous Forest Stand beneath a Flux Tower. Agric. For. Meteorol. 2005, 134, 27–38. [Google Scholar] [CrossRef]
- Chen, S.; Yoshitake, S.; Iimura, Y.; Asai, C.; Ohtsuka, T. Dissolved Organic Carbon (DOC) Input to the Soil: DOC Fluxes and Their Partitions during the Growing Season in a Cool-Temperate Broad-Leaved Deciduous Forest, Central Japan. Ecol. Res. 2017, 32, 713–724. [Google Scholar] [CrossRef]
- Ohtsuka, T.; Saigusa, N.; Koizumi, H. On Linking Multiyear Biometric Measurements of Tree Growth with Eddy Covariance-Based Net Ecosystem Production. Glob. Chang. Biol. 2009, 15, 1015–1024. [Google Scholar] [CrossRef]
- Ohtsuka, T.; Shizu, Y.; Hirota, M.; Yashiro, Y.; Jia, S.; Iimura, Y.; Koizumi, H. Role of Coarse Woody Debris in the Carbon Cycle of Takayama Forest, Central Japan. Ecol. Res. 2014, 29, 91–101. [Google Scholar] [CrossRef]
- Cao, R.; Chen, S.; Yoshitake, S.; Ohtsuka, T. Nitrogen Deposition and Responses of Forest Structure to Nitrogen Deposition in a Cool-Temperate Deciduous Forest. Forests 2019, 10, 631. [Google Scholar] [CrossRef]
- Inatomi, M.; Ito, A.; Ishijima, K.; Murayama, S. Greenhouse Gas Budget of a Cool-Temperate Deciduous Broad-Leaved Forest in Japan Estimated Using a Process-Based Model. Ecosystems 2010, 13, 472–483. [Google Scholar] [CrossRef]
- Nishimura, N.; Matsui, Y.; Ueyama, T.; Mo, W.; Saijo, Y.; Tsuda, S.; Yamamoto, S.; Koizumi, H. Evaluation of Carbon Budgets of a Forest Floor Sasa Senanensis Community in a Cool-Temperate Forest Ecosystem, Central Japan. Jpn. J. Ecol. 2004, 54, 143–158. [Google Scholar] [CrossRef]
- Yashiro, Y.; Shizu, Y.; Adachi, T.; Ohtsuka, T.; Lee, N.; Iimura, Y.; Koizumi, H. The Effect of Dense Understory Dwarf Bamboo (Sasa senanensis) on Soil Respiration before and after Clearcutting of Cool Temperate Deciduous Broad-Leaved Forest. Ecol. Res. 2012, 27, 577–586. [Google Scholar] [CrossRef]
- Lovett, G.M.; Weathers, K.C.; Arthur, M.A.; Schultz, J.C. Nitrogen Cycling in a Northern Hardwood Forest: Do Species Matter? Biogeochemistry 2004, 67, 289–308. [Google Scholar] [CrossRef]
- Ohtsuka, T. Carbon cycling at Takayama Forest: Results from intensive studies in the last decade, and further studies for a next decade. Jpn. J. Ecol. 2012, 62, 31–44. [Google Scholar]
- Ohtsuka, T.; Mo, W.; Satomura, T.; Inatomi, M.; Koizumi, H. Biometric Based Carbon Flux Measurements and Net Ecosystem Production (NEP) in a Temperate Deciduous Broad-Leaved Forest beneath a Flux Tower. Ecosystems 2007, 10, 324–334. [Google Scholar] [CrossRef]
- Rahmat, A.; Ariyanto, D.P.; Noda, K.; Onishi, T.; Ito, K.; Senge, M. Hydrological Characteristics under Deciduous Broadleaf and Evergreen Coniferous Forests in Central Japan. GEOMATE J. 2019, 16, 217–224. [Google Scholar] [CrossRef]
- Eom, H.; Borgatti, D.; Paerl, H.W.; Park, C. Formation of Low-Molecular-Weight Dissolved Organic Nitrogen in Predenitrification Biological Nutrient Removal Systems and Its Impact on Eutrophication in Coastal Waters. Environ. Sci. Technol. 2017, 51, 3776–3783. [Google Scholar] [CrossRef]
- Yin, R.; Zhou, S.; Lu, D.; Diao, S.; Shi, W.; Gong, H.; Dai, X. Evolution of Dissolved Organic Nitrogen (DON) during Sludge Reject Water Treatment Revealed by FTICR-MS. Sci. Total Environ. 2023, 893, 164944. [Google Scholar] [CrossRef]
- Xie, D.; Duan, L.; Du, E.; de Vries, W. Chapter 14—Indicators and thresholds for nitrogen saturation in forest ecosystems. In Atmospheric Nitrogen Deposition to Global Forests; Du, E., de Vries, W., Eds.; Academic Press: Cambridge, MA, USA, 2024; pp. 249–261. [Google Scholar] [CrossRef]
- Iimura, Y.; Morita, Y.; Ohtsuka, T. The effect of dense understory dwarf bamboo (Sasa senanensis) on soil nitrogen mineralization rate in a cool- temperate broad-leaved deciduous forest. Jpn. J. Soil Sci. Plant Nutr. 2019, 90, 381–385. [Google Scholar]
- Zhang, Q.; Zhang, J.; Shi, Z.; Kang, B.; Tu, H.; Zhu, J.; Li, H. Nitrogen Addition and Drought Affect Nitrogen Uptake Patterns and Biomass Production of Four Urban Greening Tree Species in North China. Sci. Total Environ. 2023, 893, 164893. [Google Scholar] [CrossRef]
- Yuan, Z.Y.; Chen, H.Y.H. Fine Root Biomass, Production, Turnover Rates, and Nutrient Contents in Boreal Forest Ecosystems in Relation to Species, Climate, Fertility, and Stand Age: Literature Review and Meta-Analyses. Crit. Rev. Plant Sci. 2010, 29, 204–221. [Google Scholar] [CrossRef]
- Yuan, Z.Y.; Chen, H.Y.H. Fine root dynamics with stand development in the boreal forest. Funct. Ecol. 2012, 26, 991–998. [Google Scholar] [CrossRef]
- Pei, Y.M.; Lei, P.F.; Xiang, W.H.; Ouyang, S.; Xu, Y.Y. Effect of Stand Age on Fine Root Biomass, Production and Morphology in Chinese Fir Plantations in Subtropical China. Sustainability 2018, 10, 2280. [Google Scholar] [CrossRef]
- Hu, M.; Zou, B.; Huang, Z.; Wang, S.; Su, X.; Ding, X.; Zheng, G.; Chen, H.Y.H. Fine Root Biomass and Necromass Dynamics of Chinese Fir Plantations and Natural Secondary Forests in Subtropical China. For. Ecol. Manage. 2021, 496, 119413. [Google Scholar] [CrossRef]
- Takeda, S.; Takahashi, K. Elevational Variation in Abundance of Coarse Woody Debris in Subalpine Forests, Central Japan. For. Ecol. Manag. 2020, 473, 118295. [Google Scholar] [CrossRef]
- Castagneri, D.; Garbarino, M.; Berretti, R.; Motta, R. Site and Stand Effects on Coarse Woody Debris in Montane Mixed Forests of Eastern Italian Alps. For. Ecol. Manag. 2010, 260, 1592–1598. [Google Scholar] [CrossRef]
- Jönsson, M.; Weslien, J.O.; Gustafsson, L. Coarse Woody Debris Legacies and Their Dynamics in Retained Forest Patches. For. Ecol. Manag. 2023, 541, 121063. [Google Scholar] [CrossRef]
Figure 1.
Location of the study site at Takayama Forest Research Station (★). A square indicates a permanent study plot (100 m × 100 m). The water catchment area is marked with black lines. A solid black circle indicates the location of a weir. The map was obtained from the Geospatial Information Authority of Japan.

Figure 2.
Nitrogen (N) cycle in the Takayama forest site. Pools in boxes are given in kg N ha−1, and fluxes on arrows are given in kg N ha−1 year−1. DON: dissolved organic N; DIN: dissolved inorganic N; TFa: throughfall above bamboo; TFb: throughfall below bamboo; SF: stemflow; CWD: coarse woody debris; STN: soil total nitrogen; SIN: soil inorganic N; NMR: net mineralization rate; NNR: net nitrification rate.


Table 1.
Pools in the Takayama forest site. Necromass and N pool of coarse woody debris (CWD) are the sum of three decay classes. Values in parentheses are standard deviations.
Table 1.
Pools in the Takayama forest site. Necromass and N pool of coarse woody debris (CWD) are the sum of three decay classes. Values in parentheses are standard deviations.
| Mass (Mg ha−1) | N Concentration (%) | N Pool (kg N ha−1) | |
|---|---|---|---|
| Biomass pools | |||
| Canopy trees | |||
| Foliage | 3.5 (0.2) | 2.4 (0.3) | 83.2 (4.0) |
| Stems | 128.4 (12.0) | 0.1 (0.1) | 154.1 (14.3) |
| Branches | 19.6 (1.7) | 0.7 (0.2) | 138.9 (14.6) |
| Coarse roots | 33.7 (2.6) | 0.1 (0.1) | 40.5 (3.1) |
| Fine roots | 2.3 (0.5) | 0.8 (0.2) | 17.7 (7.8) |
| Understory bamboos | |||
| Foliage | 1.1 (0.4) | 2.1 (0.1) | 22.4 (0.8) |
| Culms | 3.7 (0.7) | 0.5 (0.1) | 19.8 (0.6) |
| Fine roots | 3.1 (0.3) | 0.8 (0.0) | 24.5 (0.2) |
| Rhizomes | 2.3 (0.5) | 0.4 (0.0) | 9.0 (0.3) |
| Necromass pool | |||
| CWD | 13.0 | 0.1 (0.1) | 19.0 |
| Soil N pool (0–75 cm) | 3107.1 (1633.4) | 0.8 (0.5) | 8590.0 (446.0) |
| Extractable soil inorganic N | – | – | 3.1 (1.2) |
| Total Stand | 3317.8 | – | 9122.2 |
Table 2.
Input–output N (kg N ha−1 year−1) budget in the Takayama forest site. Values in parentheses are standard deviations.
Table 2.
Input–output N (kg N ha−1 year−1) budget in the Takayama forest site. Values in parentheses are standard deviations.
| Total N | NO3 + NO2–N | NH4–N | DON | Reference | |
|---|---|---|---|---|---|
| N input (a) | |||||
| N deposition | 11.1 (1.7) | 1.5 (0.1) | 1.7 (0.7) | 7.9 (1.2) | Cao et al., 2019 [34] |
| N output (b) | |||||
| Denitrification (N2O) | 0 | Inatomi et al., 2010 [35] | |||
| N leaching | 2.4 | 0.6 | 0.0 | 1.8 | |
| N budget (a–b) | 8.7 | 0.9 | 1.7 | 6.1 |
DON: dissolved organic N.
Table 3.
N requirement and supply (kg N ha−1 year−1) in the Takayama forest site. Values in parentheses are standard deviations.
Table 3.
N requirement and supply (kg N ha−1 year−1) in the Takayama forest site. Values in parentheses are standard deviations.
| N Fluxes | Contribution of N Supply | References | |
|---|---|---|---|
| N requirement | |||
| Tree | |||
| Foliage | 83.2 (4.0) | – | |
| Stems | 2.8 (0.7) | – | |
| Coarse roots | 0.6 (0.1) | ||
| Fine root | 30.2 (2.3) | – | |
| Bamboo | |||
| Foliage | 10.9 (0.6) | – | |
| Culm | 5.1 (0.3) | – | |
| Belowground | 6.6 (2.9) | – | |
| Total | 139.4 (10.9) | – | |
| N supply | |||
| Resorption | |||
| Tree foliage | 51.7 (2.5) | 37.2% | |
| Bamboo foliage | 0.3 (0.0) | 0.2% | |
| Canopy uptake | 0.7 (0.2) | 0.5% | Cao et al., 2019 [34] |
| Throughfall | 3.2 (1.5) | 2.3% | Cao et al., 2019 [34] |
| Mineralization | |||
| Litter leachate | |||
| Growing season | 5.9 (1.5) | 4.2% | |
| Snow season | 0.5 (0.3) | 0.4% | |
| Mineral soil (0–5 cm) | |||
| Growing season | 14.9 (17.8) | 10.7% | |
| Snow season | 6.4 (5.0) | 4.6% | |
| Total | 83.6 (28.8) | 60.1% |
Disclaimer/Publisher’s Note: The statements, opinions and data contained in all publications are solely those of the individual author(s) and contributor(s) and not of MDPI and/or the editor(s). MDPI and/or the editor(s) disclaim responsibility for any injury to people or property resulting from any ideas, methods, instructions or products referred to in the content. |
© 2024 by the authors. Licensee MDPI, Basel, Switzerland. This article is an open access article distributed under the terms and conditions of the Creative Commons Attribution (CC BY) license (https://creativecommons.org/licenses/by/4.0/).
Share and Cite
MDPI and ACS Style
Cao, R.; Chen, S.; Yoshitake, S.; Onishi, T.; Iimura, Y.; Ohtsuka, T. The Nitrogen Cycle of a Cool-Temperate Deciduous Broad-Leaved Forest. Forests 2024, 15, 725. https://doi.org/10.3390/f15040725
AMA Style
Cao R, Chen S, Yoshitake S, Onishi T, Iimura Y, Ohtsuka T. The Nitrogen Cycle of a Cool-Temperate Deciduous Broad-Leaved Forest. Forests. 2024; 15(4):725. https://doi.org/10.3390/f15040725
Chicago/Turabian StyleCao, Ruoming, Siyu Chen, Shinpei Yoshitake, Takeo Onishi, Yasuo Iimura, and Toshiyuki Ohtsuka. 2024. "The Nitrogen Cycle of a Cool-Temperate Deciduous Broad-Leaved Forest" Forests 15, no. 4: 725. https://doi.org/10.3390/f15040725
Note that from the first issue of 2016, this journal uses article numbers instead of page numbers. See further details here.