Article

Improving Tree Cover Estimation for Sparse Trees Mixed with Herbaceous Vegetation in Drylands Using Texture Features of High-Resolution Imagery

1
School of Surveying and Land Information Engineering, Henan Polytechnic University, Jiaozuo 454003, China
2
Key Laboratory of Soil and Water Conservation on the Loess Plateau of Ministry of Water Resources, Yellow River Institute of Hydraulic Research, Yellow River Conservancy Commission, Zhengzhou 450003, China
3
Co-Innovation Center for the Sustainable Forestry in Southern China, Nanjing Forestry University, Nanjing 210037, China
*
Author to whom correspondence should be addressed.
Forests 2024, 15(5), 847; https://doi.org/10.3390/f15050847
Submission received: 13 March 2024 / Revised: 28 April 2024 / Accepted: 10 May 2024 / Published: 12 May 2024

Abstract

:
Tree cover is a crucial vegetation structural parameter for simulating ecological, hydrological, and soil erosion processes on the Chinese Loess Plateau, especially after the implementation of the Grain for Green project in 1999. However, current tree cover products performed poorly across most of the Loess Plateau, which is characterized by grasslands with sparse trees. In this study, we first acquired high-accuracy samples of 0.5 m tree canopy and 30 m tree cover using a combination of unmanned aerial vehicle imagery and WorldView-2 (WV-2) imagery. The spectral and textural features derived from Landsat 8 and WV-2 were then used to estimate tree cover with a random forest model. Finally, the tree cover estimated using WV-2, Landsat 8, and their combination were compared, and the optimal tree cover estimates were also compared with current products and tree cover derived from canopy classification. The results show that (1) the normalized difference moisture index using Landsat 8 shortwave infrared and the standard deviation of correlation metric calculated by means of gray-level co-occurrence matrix using the WV-2 near-infrared band are the optimal spectral feature and textural feature for estimating tree cover, respectively. (2) The accuracy of tree cover estimated using only WV-2 is highest (RMSE = 7.44%), indicating that high-resolution textural features are more sensitive to tree cover than the Landsat spectral features (RMSE = 11.53%) on grasslands with sparse trees. (3) Textural features with a resolution higher than 8 m perform better than the combination of Landsat 8 and textural features, and the optimal resolution is 2 m (RMSE = 7.21%) for estimating tree cover, whereas the opposite is observed when the resolution of textural features is lower than 8 m. (4) The current global product seriously underestimates tree cover on the Loess Plateau, and the tree cover calculation using the canopy classification of high-resolution imagery performs worse than the method of directly using remote sensing features.

1. Introduction

Due to the high intensity of human activities such as cultivation and grazing that have occurred over the long term, the Chinese Loess Plateau is one of the most eroded regions and one of the most vulnerable areas to desertification in China [1,2]. In order to alleviate the deteriorating ecological environment and soil erosion, the government began to implement ecological restoration projects such as returning farmland to forest and grassland and closing mountains to grazing in 1999 to accelerate the restoration of forest and grass vegetation on the Loess Plateau [3,4]. Due to vegetation restoration in recent years [5], it has been possible to study the vegetation coverage in the Loess Plateau region.
Fractional vegetation cover (FVC) is defined as the proportion of the vertically projected area of vegetation (including leaves, stems, and branches) within a total ground area [6,7,8]. This concept is highly important in ecological, hydrological, and soil erosion dynamics research, as it serves as a key parameter in ecological–hydrological models and soil erosion models [9,10,11]. Therefore, the accuracy and quality of vegetation coverage data have gradually garnered attention and importance from numerous experts and scholars [12]. The Loess Plateau consists of arid/semi-arid areas [13,14], characterized by sparse mixed forests composed of artificially planted trees and green herbaceous vegetation, which represent typical landscapes in the region [15]. Vegetation coverage serves as an overall ecological indicator for the region [16,17], and it can be further divided into tree cover [18,19,20] and herbaceous vegetation cover, with tree coverage serving as a direct reflection of vegetation restoration. However, the similarity in spectral characteristics between woody vegetation and herbaceous vegetation cover is a key factor affecting the high-precision inversion of tree coverage in tree–grasslands in this region. Currently, the most mature and widely used tree coverage products include the global MODIS VCF tree coverage product [21] and a global 30 m spatial resolution tree cover product produced by Sexton et al. [22] using scale conversion methods. These published products have a medium-to-coarse spatial resolution, making them suitable for analyzing changes in tree cover over large areas. However, the reliability of these products in small-scale areas with mixed trees and green herbaceous vegetation remains controversial [23,24].
Inverting tree cover in sparse tree–grassland areas using remote sensing is a challenging task due to the coexistence of trees and herbaceous vegetation. To address the challenge of inverting tree cover in mixed-tree and herbaceous vegetation areas, remote sensing-based methods can generally be used in three ways: (1) Tree canopy coverage can be estimated using seasonal indicators [25,26]. This is challenging due to the limited seasonal variations in herbaceous vegetation and trees in arid/semi-arid regions of the Northern Hemisphere. Therefore, accurately estimating tree canopy coverage in this region using phenology-driven models is extremely difficult. (2) Tree cover can be directly acquired using high-resolution imagery or unmanned aerial vehicle (UAV) imagery [27,28,29]. (3) The reference tree cover can be obtained based on high-resolution imagery and using machine learning models to explore the statistical relationship between tree cover and remote sensing features to invert tree cover [24,30,31,32]. These studies have significantly advanced the mapping of regional-scale tree canopy coverage and enhanced our understanding of the ecological systems in sparse tree–grassland areas.
Based on previous research, it is known that the presence of grassland backgrounds significantly affects the estimation of tree cover based on remote sensing [28,30,31,33]. If only spectral information is used, the accuracy is not high enough. To this end, this study proposes a method for estimating tree cover based on texture features extracted from high-resolution satellite imagery, aiming to overcome the influence of grassland background on the accuracy of tree cover estimation in remote sensing. The specific objectives were to (1) validate whether high-resolution texture information improves tree cover inversion; (2) investigate the effect of high-resolution texture feature scales on tree cover inversion accuracy; and (3) compare the differences between the tree cover products generated in this study and the global tree cover products. The outcomes of these objectives should demonstrate how our approach provides a new and valuable tool to accurately invert tree canopy coverage in sparse tree–grassland areas using remote sensing data with high precision and its transferability to other arid regions.

2. Study Area and Data
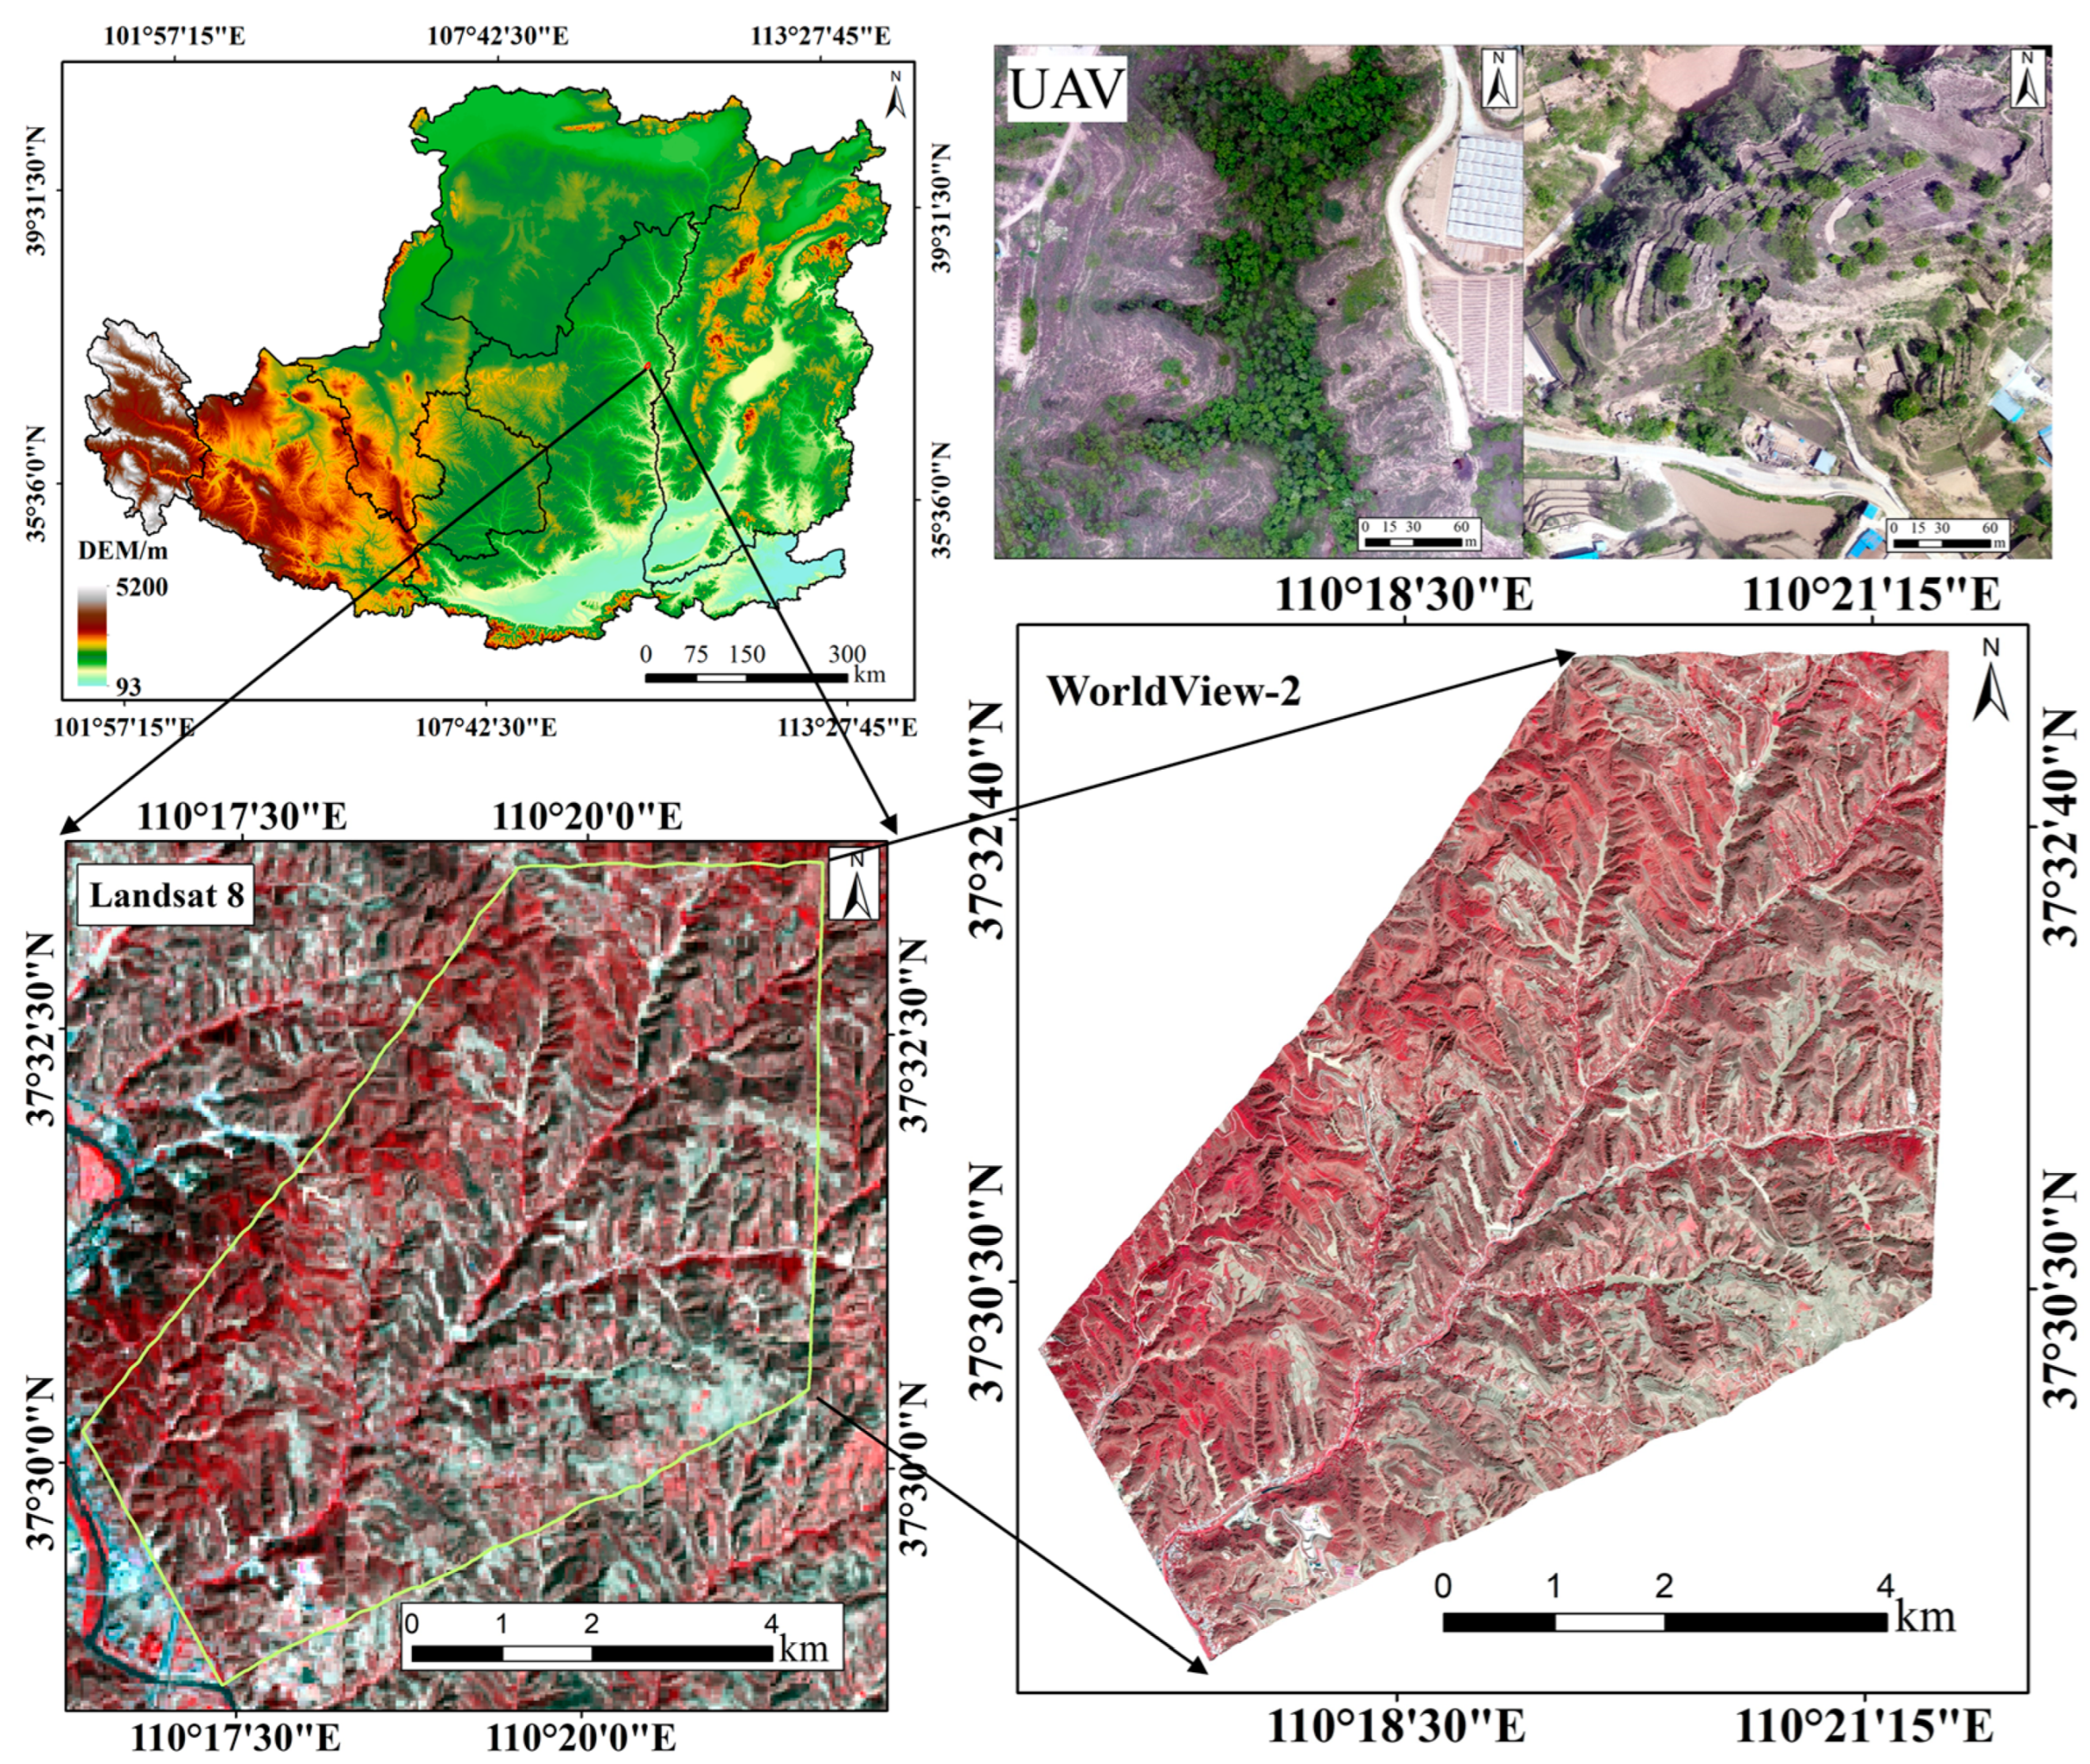
2.1. Study Area

The Peijiamao watershed is a first-class branch ditch on the left bank of the middle reaches of the Wuding River in Suide County, Shaanxi Province. It is about 1 km away from Suide County. Located in the hilly and gully areas of the Loess Plateau in northern Shaanxi, the area is dominated by sparse grasslands composed of plantation forests and green herbaceous vegetation. The geographical location is between 110°17′7″–110°23′44″ east longitude and 37°28′54″–37°33′30″ north latitude. The basin area is 39.3 km2, the basin shape is leaf-shaped, the basin’s length is 11.0 km, and the average width is 3.59 km. Since Suide County began to implement the policy of returning farmland to forest in 1999, the cultivation of land that is highly prone to soil erosion and desertification is being stopped in a planned and step-by-step manner, and trees and grass are being planted according to local conditions, gradually restoring vegetation [34]. Currently, the naturally growing vegetation mainly consists of shrubs, wild grass, and wildflowers. Shrubs mainly include Caragana korshinskii, Ziziphus jujuba var, Salix cheilophila, and Wikstroemia chamaedaphne Meisn. Economic forests or economically and ecologically versatile tree species such as apples, red dates, and Chinese pine are artificially cultivated, and tree species with a certain level of height information, such as Ziziphus jujuba var, black willow, apple, red date, and Chinese pine, are utilized for the inversion of vegetation coverage in woody plants. The location of the study area is shown in Figure 1.

2.2. Multiscale Remote Sensing Observation

2.2.1. Landsat 8 Imagery

The Google Earth Engine (GEE) platform provides surface reflectance products for Landsat series satellite data (https://www.usgs.gov/landsat-missions/landsat-collection-2-level-2-science-products, accessed on 12 March 2024). The spatial resolution is 30 m, and the temporal resolution is 16 days. This data product underwent atmospheric correction, eliminating the errors caused by atmospheric scattering, absorption, and reflection. Additionally, the F-mask algorithm was employed to identify clouds and cloud shadows in the images, effectively improving the efficiency of user data utilization. Due to terrain undulation, remote sensing images are subject to radiometric distortion, which has a significant impact on the subsequent study of tree coverage. Therefore, terrain correction was also performed on this image. Landsat 8 multispectral remote sensing imagery was acquired on 12 May 2017.

2.2.2. WorldView-2 High-Resolution Imagery

The WV-2 multispectral remote sensing image was acquired on 11 May 2017. First, the remote sensing image was preprocessed using ENVI 5.3 software for geometric correction, radiometric calibration, and atmospheric correction. Then, the panchromatic image and the multispectral image were fused using the Gram–Schmidt fusion method to obtain a multispectral image with a spatial resolution of 0.5 m. Finally, the DEM data for the area were used as the elevation image for orthorectification.

2.2.3. Unmanned Aerial Vehicle (UAV) Imagery

From 11 May to 13 May 2017, a three-day field data collection procedure for woody vegetation was conducted in Suide. The following describes the specific data collection process: First, referencing high-resolution satellite imagery from Google Earth 7.3 and the results of on-site field surveys, prior knowledge about the distribution of vegetation in the study area was obtained. According to the on-site survey, the main tree species in this area include Caragana korshinskii, Ziziphus jujuba var, Salix cheilophila, Wikstroemia chamaedaphne Meisn, apple, red date, and Chinese pine, with Caragana korshinskii accounting for a significant proportion. In this experimental area, 45 sample plots were randomly selected based on the distribution range of vegetation. Each sample plot was set as a 30 m × 30 m square area. A DJI Phantom 4 drone (DJI, New York, NY, USA) was used for data collection, with a flight altitude set at 100 m, a lateral overlap rate of 70%, a longitudinal overlap rate of 70%, a flight speed of 6 m per second, and a photo capture frequency of one photo every 2 s. The flight was conducted using flight route planning, with each flight lasting approximately 10 min. The acquisition of UAV imagery data primarily involved establishing a 30 m × 30 m square area with base stations set up at the four corners. This allowed for the use of the UAV to measure images in the designated region. Using Pix4Dmapper 4.5.6 software, the original aerial images were corrected and stitched together. In the end, 45 digital orthophoto images of the sample plots were obtained.

2.2.4. Tree Cover Products

We compared two global tree cover products. These two global products are the Terra MODIS Vegetation Continuous Field (VCF) product, provided by NASA LP DAAC at the USGS EROS Center, shortened to MODIS VCF product [21]; and the global forest cover and change product developed by Sexton et al. [22], referred to as the GFCC product.
The MODIS Vegetation Continuous Field (VCF) product (MOD44B), derived from MODIS 16-day surface reflectance composites that include MODIS bands 1–7 and brightness temperature bands 20, 31, and 32, contains fractional tree cover at a spatial resolution of 250 m and is widely used to estimate patterns and dynamics of forests (https://lpdaac.usgs.gov/products/mod44bv061/, accessed on 12 March 2024).
The Landsat Vegetation Continuous Field (VCF) tree cover layers contain estimates of the percentage of horizontal ground in each 30 m pixel covered by woody vegetation greater than 5 m in height (https://lpdaac.usgs.gov/products/gfcc30tcv003/, accessed on 12 March 2024). The dataset is available for four epochs centered on the years 2000, 2005, 2010, and 2015. The dataset is derived from the GFCC Surface Reflectance product (GFCC30SR), which is based on enhanced Global Land Survey (GLS) datasets. The GLS datasets are composed of high-resolution Landsat 5 Thematic Mapper (TM) (Vandenberg Air Force Base, California, CA, USA) and Landsat 7 Enhanced Thematic Mapper Plus (ETM+) (Vandenberg Air Force Base, California, CA, USA) images at 30 m resolution.

2.3. Sample Dataset

2.3.1. Creating a Sample Dataset of Tree Types

As shown in Figure 2, in the high-resolution WV-2 image, a 180 m× 180 m grid was set up to classify features into tree and non-tree. Through visual interpretation, samples of tree and non-tree were selected within each grid, resulting in a dataset of 643,725 classified sample points within the 180 m × 180 m grid. The dataset was divided into training and validation sets using a 7:3 ratio.

2.3.2. Creation of Tree Coverage Sample Dataset

A 30 m × 30 m grid was established on UAV imagery to fully match the 30 m × 30 m pixel range of Landsat 8. The tree canopy within the grid was interpreted using visual interpretation methods, and the tree cover within the grid was calculated. Based on the visual interpretation of UAV imagery, 45 tree canopy coverage sample points were obtained, which were evenly distributed within the study area. At the same time, the canopy of the WV-2 image corresponding to the UAV sample point was visually interpreted, and tree cover was calculated. Then, the tree cover obtained from the UAV image was used as a reference to establish a regression correction model with the tree cover visually interpreted from the WV-2 image. The calibration model had an R2 of 0.97 and an RMSE of 3.02%. The model accuracy was very high. This shows that the tree cover obtained from visual interpretation based on WV-2 imagery is very close to the tree cover obtained through UAV imagery interpretation.
A 30 m × 30 m grid was set up on WV-2 high-resolution imagery to fully match the 30 m × 30 m pixel range of Landsat 8. A grid was randomly selected, and visual interpretation methods were used to interpret the tree canopy within the grid and calculate the tree canopy coverage, obtaining a total of 1132 tree canopy coverage sample points. Although the tree canopy coverage obtained from the visual interpretation of high-resolution imagery was already very close to that obtained from UAV image interpretation, to reduce error, we used a calibration model to correct the tree canopy coverage of the 1132 sample points. The corrected canopy coverage was used as a reference for subsequent machine learning models. These corrected tree coverage sample points were divided into training and testing samples using a 7:3 ratio. The specific process is shown in Figure 3.

3. Methods

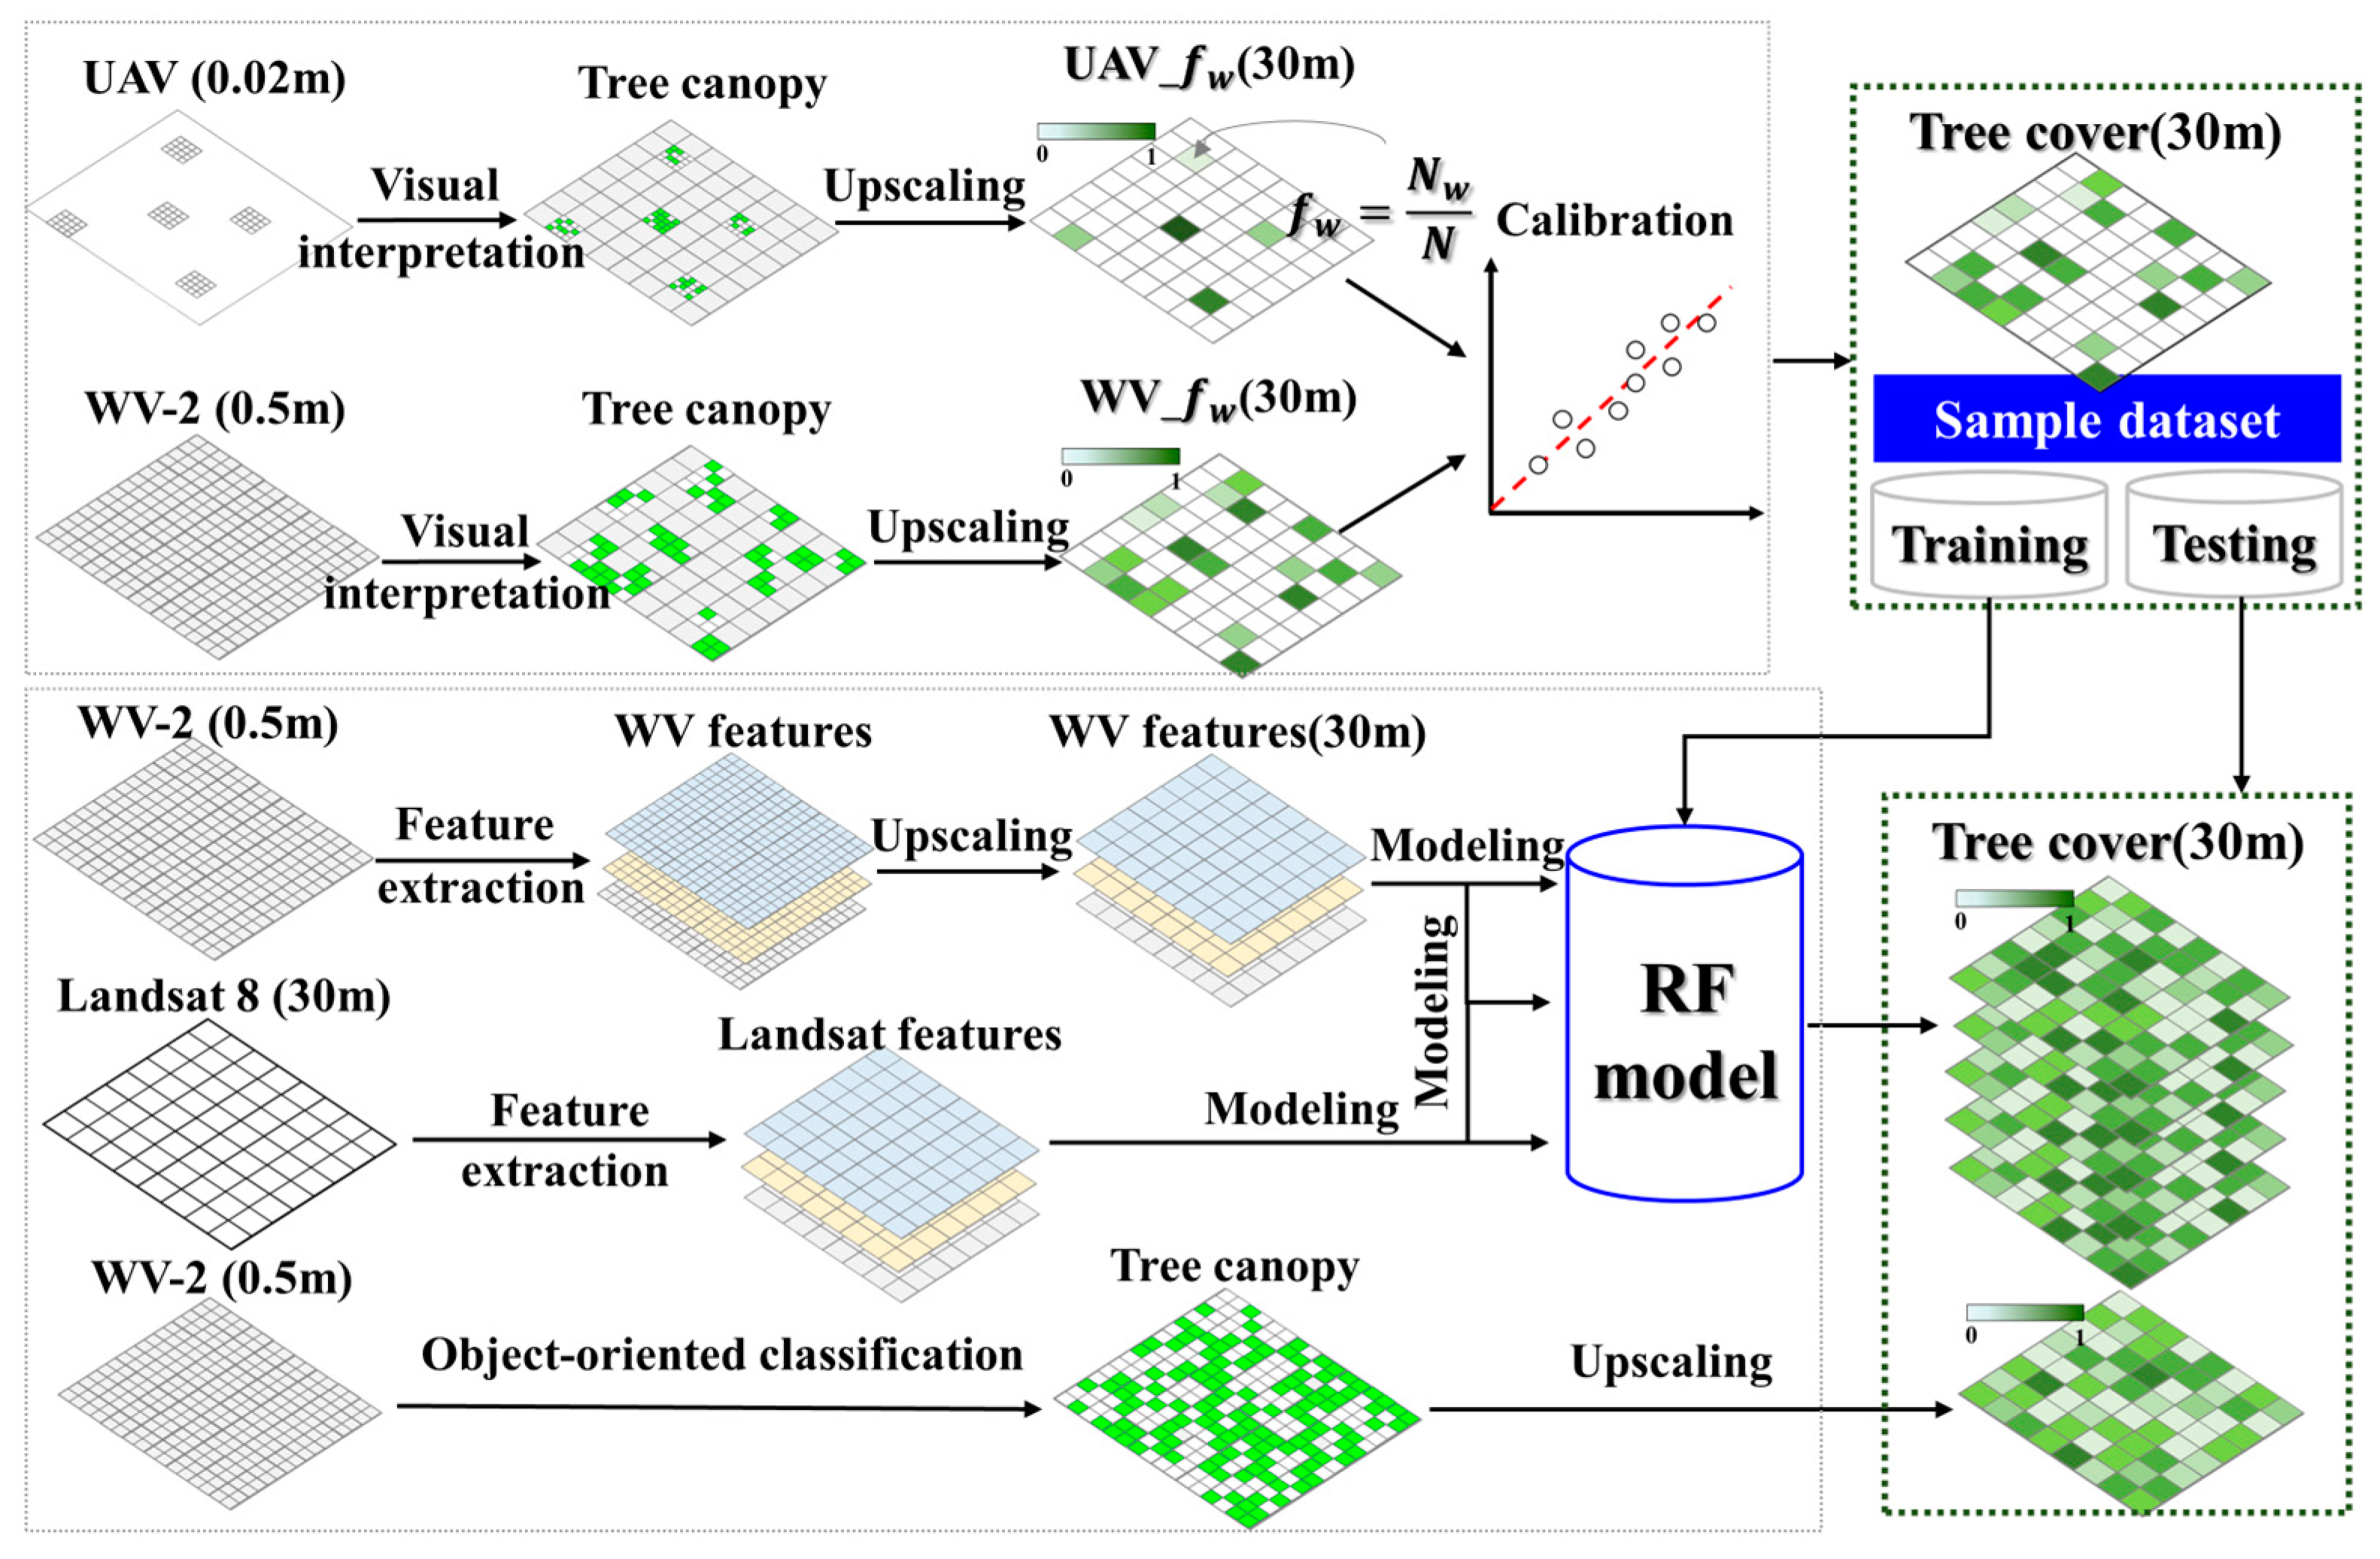
3.1. Overall Methodology

The methodological framework is shown in Figure 4. At 30 m resolution, to explore the optimal method for tree cover inversion, sample data were first established through visual interpretation based on UAV images and WV-2 images. Following that, object-based classification based on WV-2 imagery was used to directly obtain tree cover, and the random forest algorithm was utilized to build multiscale inversion models for the indirect estimation of tree cover using Landsat 8 data and WV-2 data. Finally, the accuracy of obtaining tree cover at different scales using different methods was compared, and their respective advantages and disadvantages were explored.

3.2. Tree Cover Derived from WV-2 Classification Map

High-resolution remote sensing images possess rich texture information, distinct spatial relationships, and clear geometric features. Therefore, object-oriented analysis methods are more suitable for high-resolution remote sensing images compared to pixel-based analysis methods [35]. Object-oriented classification technology treats adjacent pixels as objects, identifies interesting spectral elements, and fully utilizes the spatial, textural, and spectral information of high-resolution panchromatic and multispectral data for segmentation and classification. This approach outputs high-precision classification results or vectors [36]. This technology is divided into two main parts: image object segmentation and target classification. The study area of remote sensing data is divided into multiple scales, and the optimal segmentation scale for planting plots in the study area is selected based on the results at multiple scales. In the next step, classification is performed based on the training samples or threshold definition based on fuzzy logic [37].
This study utilized eCognition 9.5 software for object-oriented classification based on WV-2 high-resolution imagery, categorizing features in the image into tree and non-tree. Initially, a multiscale segmentation algorithm was applied to the study area. To ensure the accuracy of image classification, eCognition Segment Parameter (ESP) was used to determine the optimal segmentation parameters. The optimal segmentation scale was determined to be 43, with a shape factor of 0.1, a compactness factor of 0.8, and band weights of 1:1:1:2. Then, threshold classification was performed using remote sensing features such as Normalized Difference Vegetation Index (NDVI), the standard deviation of the near-infrared band, brightness, and the ratio of the red band. This process extracts various land cover types within the study area, including buildings, shadows, bare soil, and roads, and merges them into non-tree categories. The unclassified areas include tree, green herbaceous vegetation, terraced fields, and unextracted bare soil, among other land cover types. To distinguish between tree areas and green herbaceous vegetation, we constructed a dataset of tree-type samples. We designated green herbaceous vegetation, terraced fields, and unextracted non-tree areas as non-tree type samples, and visually interpreted trees as tree-type samples. Using the built-in feature selection function of eCognition 9.5 software for feature optimization, we ultimately selected spectral features such as the contribution ratio of the red band, the mean of the near-infrared band, the standard deviation of the near-infrared band, and brightness. Additionally, we chose texture features, including the standard deviation and mean of the near-infrared band, as well as the mean of the red band. The vegetation indices selected were the Normalized Difference Vegetation Index (NDVI), Visible-Band Difference Vegetation Index (VDVI), and Modified Soil Adjusted Vegetation Index (MSAVI). Finally, using the decision tree algorithm in the eCognition 9.5 software, we classified the unclassified areas into tree and non-tree types and then merged all non-tree types.
We used ENVI 5.3 to perform mask processing on the classified image, where pixel values representing tree types are considered 1, and pixel values representing non-tree types are considered 0. Using the IDL resampling algorithm, we aggregated the pixels within a 30 m × 30 m spatial range in the 0.5 m resolution classified image into one pixel of 30 m resolution and calculated the proportion of pixels representing tree types within the 30 m spatial range to the total number of pixels. This proportion was used as the tree coverage value for each pixel at a 30 m resolution. Thus, the tree cover for the study area was obtained.

3.3. Tree Cover Estimation Using Different Remote Sensing Features

3.3.1. Random Forest Model

In this study, we used random forest as a machine learning algorithm to understand the relationship between tree coverage and spectral information, vegetation index, and texture features, and then build a tree coverage inversion model. The random forest algorithm, proposed by Breiman in 2001 [38], is currently one of the most popular machine learning algorithms. The algorithm is based on the bagging ensemble learning method, which integrates multiple decision trees into a forest and combines them to predict the final result [38]. The random forest algorithm has excellent noise resistance; is simple, fast, and easy to parallelize; and also mitigates overfitting to some extent [39]. All models were individually tuned using 10 repeats of 10-fold cross-validation to identify the ideal parameter specification (Table 1). This covered the number of variables considered at each tree node and the number of trees constructed [25]. The model training and construction were both completed using Python (v3.11) language.

3.3.2. Image-Derived Predictor Variables

Vegetation indices are sensitive to the biophysical characteristics of vegetation. For complex surface imagery, extracting texture features from images can provide various pieces of useful information and improve the accuracy of inversion. In this study, three categories of remote sensing features were selected as experimental features: band reflectance, vegetation indices, and texture features. The vegetation indices used in this study include the following: Normalized Difference Vegetation Index (NDVI), Visible-Band Difference Vegetation Index (VDVI), Normalized Difference Moisture Index (NDMI), Ratio Vegetation Index (RVI), Enhanced Vegetation Index (EVI), Modified Soil Adjusted Vegetation Index (MSAVI), Difference Vegetation Index (DVI), Green Normalized Difference Vegetation Index (GNDVI), Green Red Vegetation Index (GRVI), and Near-Infrared Reflectance of Vegetation (NIRv).
Gray-level co-occurrence matrix (GLCM) is a statistical tool used to describe image texture features, which describes the spatial relationship between different pixel gray levels in an image [40]. From the 14 statistical texture measures defined by Haralick et al. [40] and to simplify the analysis by having a representative number of non-correlated variables [41], we calculated 8 GLCM textural features, namely mean, variance, homogeneity, contrast, dissimilarity, entropy, angular second moment (ASM), and correlation. The GLCM texture features were computed from the first principal component (PC1) of the satellite image bands in all directions (0°, 45°, 90°, and 135°) using a window of 3 m×3 m size, with a gray level quantization of 64 levels. The use of a 3 m × 3 m window showed better results in identifying subtle variations in the gray levels of pixels in semi-arid woodlands, characterized by low tree densities and isolated canopies [42,43]. Landsat imagery was used to extract 48 texture features. In order to make the scales synchronized, it was necessary to resample the 0.5 m resolution WV-2 image to a 30 m resolution. By means of the IDL resampling algorithm, based on the Landsat 8 image as a baseline, the mean and standard deviation of each image element in the range of 30 m × 30 m were calculated, and these statistical values were applied to the blank image after masking to obtain the image merged based on the mean and the image merged based on the standard deviation. We extracted 64 texture features based on WV-2 images. The extraction of band reflectance, vegetation indices, and texture features was performed using ENVI (version 5.3). The predictor variables are described in Table 2.

3.3.3. Optimum Remote Sensing Features Selection

Landsat 8 image feature factors were selected for 6 bands of reflectance, 2 thermal infrared spectra, 9 vegetation indices, and 48 texture features. The WV-2 image features included 64 texture features, 4 band reflectance factors, and 2 vegetation indices, totaling 135 feature variables (specific predictor variables can be found in Appendix A, Table A1). In order to investigate the optimal tree cover inversion method, we constructed three feature variable combination models based on Landsat 8 data and WV-2 data, respectively. Those based on Landsat 8 data comprised a total of 65 predictor variables (17 spectral information and 48 texture features); those based on WV-2 data comprised a total of 70 predictor variables (64 texture features and 6 spectra); and those based on both Landsat 8 data and WV-2 data comprised a total of 135 predictor variables (65 Landsat indices and 70 WV-2 indices).
To determine the best predictive models, it is necessary to perform variable selection on all predictor variables. According to statistical learning theory, a model with fewer but relatively accurate predictor variables is superior to a more complex model [54,55]. The backward elimination method can be used to determine the optimal number of predictor variables, leading to a concise model with reasonable accuracy [54,55,56]. To determine the most important predictor variables, we implemented recursive feature elimination (RFE) in the backward elimination method. RFE is a parameter selection process that incorporates the estimation of test (validation) errors and variable importance [57,58]. Firstly, a model is established using all available predictors (MPs), and the testing error is evaluated through 10-fold cross-validation (e.g., adjusted R2 and RMSE). Meanwhile, variable importance scores are computed. Next, a second model is constructed by removing the variable with the least contribution from MPs, and the testing error and variable importance are recalculated. This process is repeated until a one-variable model is reached. A full iteration of this procedure is repeated 10 times to account for variations in cross-validation sampling, providing a robust estimate of test errors. Recursive feature elimination iteratively refines the model by repeatedly eliminating features with minimal impact on performance, ultimately resulting in a more optimized and reliable model.

3.4. Accuracy Validation

To prevent spatial overfitting caused by spatial autocorrelation, 30% of independent sample data was randomly and uniformly selected within the study area as accuracy validation data before modeling. This was carried out to evaluate the model’s accuracy in estimating tree coverage. Comparing the tree coverage obtained through the visual interpretation of WV-2 imagery with the tree coverage values estimated using the model allows model accuracy to be assessed. The selected accuracy validation metrics include the coefficient of determination (R2) and root mean square error (RMSE) for model samples. The values of R2 and RMSE can be calculated as follows:
R 2 = 1 i = 1 N y i y ^ i 2 / i = 1 N y i y ¯ i 2
R M S E = 1 N i = 1 N y i y ^ i 2
where y i is the coverage obtained through visual interpretation, y ^ i is the estimated coverage by the model, y ¯ i is the average coverage obtained through visual interpretation, and N is the number of validation samples.
R2 is used to measure the goodness of fit between the inversion results and ground observations. The closer the value is to 1, the better the fit. RMSE measures the deviation between the predicted values of the model and the observed values, and a smaller value indicates more accurate results. In summary, higher R2 and lower RMSE values indicate that the model has better accuracy and reliability.
If the R2 and RMSE of two models are very close, the introduction of model evaluation metrics such as the Akaike Information Criterion (AIC) and Bayesian Information Criterion (BIC) can be helpful in assessing model performance and selecting the best model at this point. These information criteria can provide additional guidance and information during the model selection process, especially when comparing models with closer fits.
Both the AIC and BIC are information criteria designed to balance the model’s goodness of fit and model complexity. In general, lower AIC and BIC values indicate better model fit and lower complexity and are therefore better choices. They are calculated as follows:
A I C = n × ln R S S n + 2 × k  
B I C = n × ln R S S n + k × ln n
where n is the number of samples, RSS is the residual sum of squares, and k is the number of model parameters. In the random forest regression model, k can be approximately considered as the sum of the number of parameters in each decision tree.

4. Results

4.1. Recursive Feature Elimination (RFE)

The accuracy results of the recursive feature elimination (RFE) automatic variable selection method are shown in Figure 5. Across all methods, model accuracy is higher when the number of variables in the model exceeds 10, and performance rapidly declines when considering fewer than 10 variables. The medium-resolution tree cover estimation model based on Landsat 8 imagery achieves stability and high predictive accuracy when the number of feature factors is 13. This can be considered the optimal number of feature factors that balances prediction accuracy and simplifies the model, establishing the best-performing coverage estimation model. The optimal number of feature factors for the high-resolution tree cover model based on WV-2 imagery is 11. The optimal number of feature factors for the medium-to-high-resolution tree cover model based on Landsat 8 imagery and WV-2 imagery is 12.
The top five variables for each model are shown in Table 3. For the tree cover estimation model based on Landsat 8 medium-resolution imagery, the top five variables include NDMI, EVI, NDVI, RVI, and MSAVI, all of which are vegetation indices. The feature factors for the tree cover estimation model based on high-resolution WV-2 imagery include five texture information types: the correlation texture of the near-infrared-band standard deviation, the mean texture of the red-band mean, the mean texture of the near-infrared-band mean, the mean texture of the blue-band mean, and the angular second-moment texture of the near-infrared standard deviation. The feature factors for the medium-to-high-resolution tree cover estimation model based on Landsat 8 imagery and WV-2 imagery include the correlation texture of the near-infrared-band standard deviation, NDVI, EVI, the mean texture of red-band mean, and RVI.
Through the analysis of Figure 5 and Table 3, it can be observed that NDMI, as a vegetation index, plays a crucial role in the estimation model of tree cover. Through the comparison of the three different models, it is evident that the correlation texture of the near-infrared-band standard deviation significantly improves the model accuracy. This suggests that both medium-resolution spectral features and high-resolution texture features are more sensitive to tree cover. Among them, near-infrared and shortwave-infrared bands are used to construct vegetation indices, with near-infrared texture playing the most significant role.

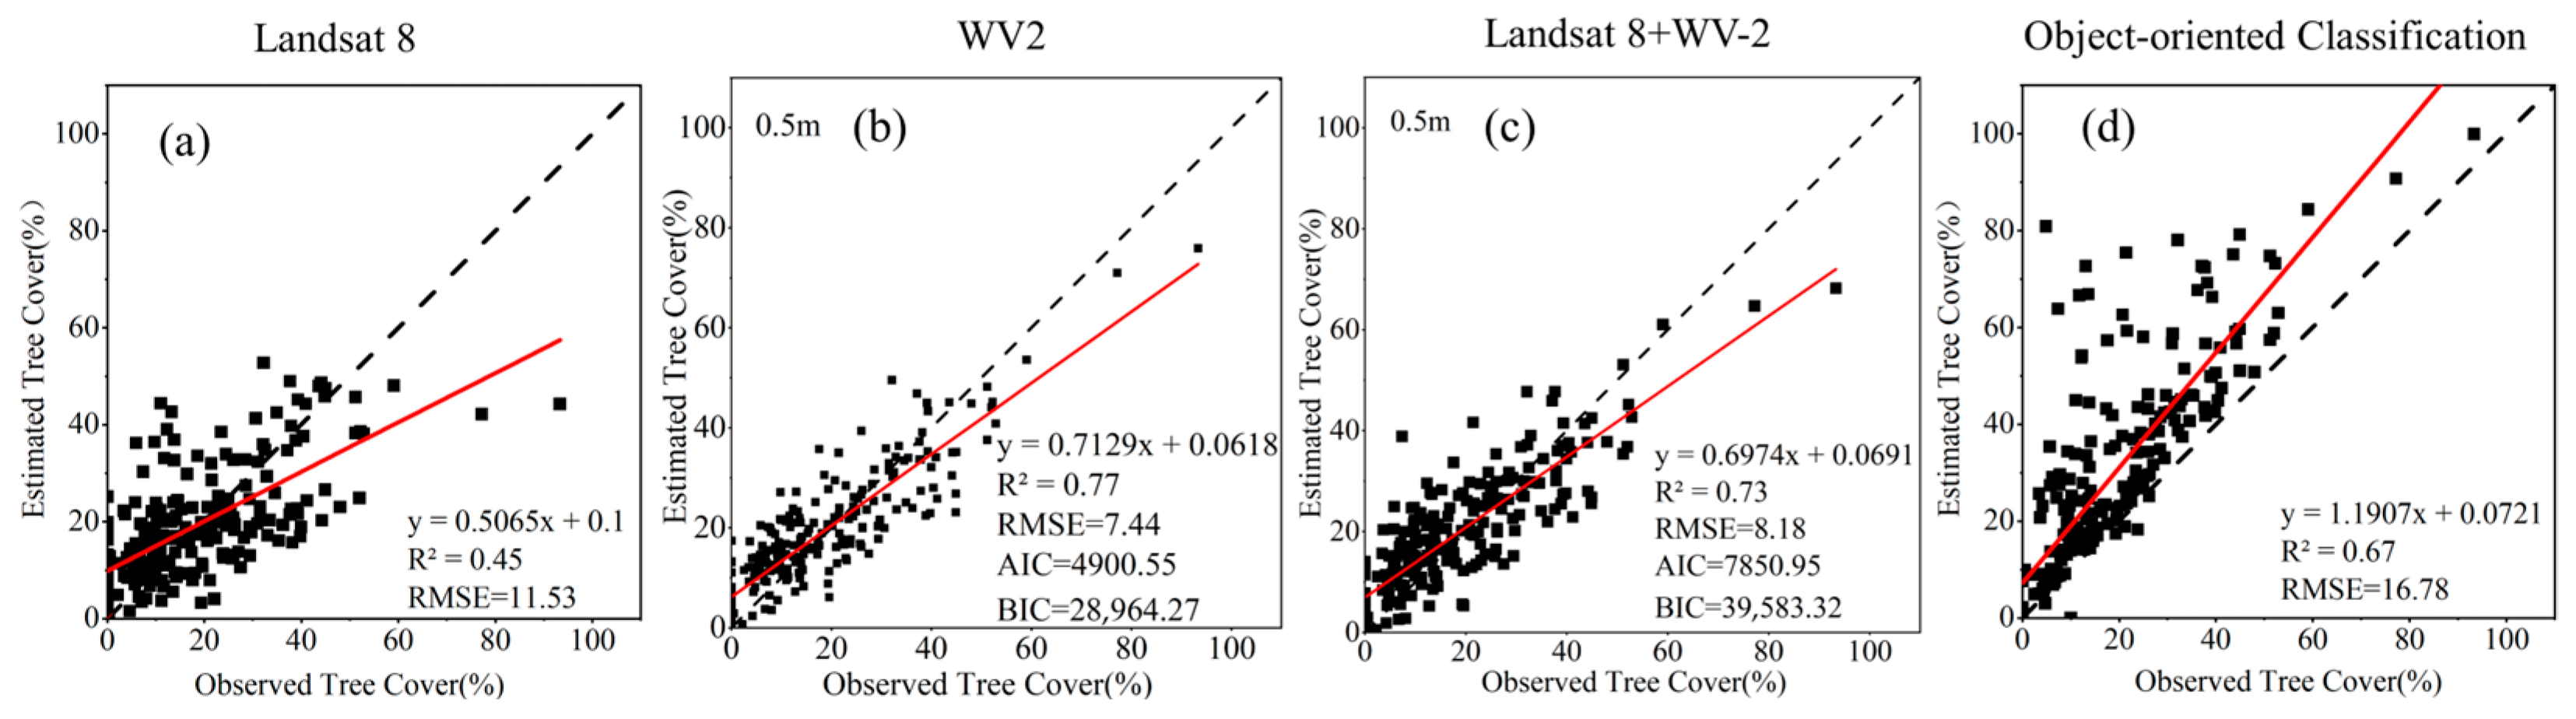
4.2. Validation Comparison between Model Accuracy Based on Different Methods

The accuracy results for the four methods are shown in Figure 6. The performance of the medium-resolution feature model based on Landsat 8 data is shown in Figure 6a. Models that only use remote sensing features such as spectral features, texture features, and vegetation indexes from Landsat data have poor performance. The R2 of tree coverage is 0.45, and the RMSE is 11.53%. Figure 6b depicts the high-resolution feature model, with a predicted R2 of 0.77, an RMSE of 7.44, an AIC of 4900.55, and a BIC of 28,964.27. Figure 6c represents the medium–high-resolution feature model, predicting an R2 of 0.73, an RMSE of 8.18, an AIC of 7850.95, and a BIC of 39,583.32. The tree cover validation sample points were compared with the tree cover obtained through classification, and the accuracy assessment is shown in Figure 6d. The R2 for tree cover is 0.67, and the RMSE is 16.78%. Although the R2 is relatively high, the RMSE is also high, which does not meet the evaluation standard of high R2 and low RMSE. Therefore, the overall accuracy is relatively low. Validation points are mostly above the 1:1 line, indicating an overestimation of tree cover.
The validation results indicate that the inversion accuracy based on high-resolution image classification results is the lowest, with a large number of overestimated values. The values of the spectral characteristics of medium-resolution remote sensing are mostly concentrated between 0% and 20%. The values of tree canopy coverage are excessively concentrated, and there is also a large number of overestimated sample points, resulting in lower inversion accuracy. By comparing the accuracy metrics of the high-resolution model and the medium–high-resolution model, we can see that although the values of R2 and RMSE are close between the two models, the high-resolution model has smaller AIC and BIC values. Based on the principle that smaller AIC and BIC values indicate better models, the high-resolution feature model performs the best, followed by the medium–high-resolution feature model.

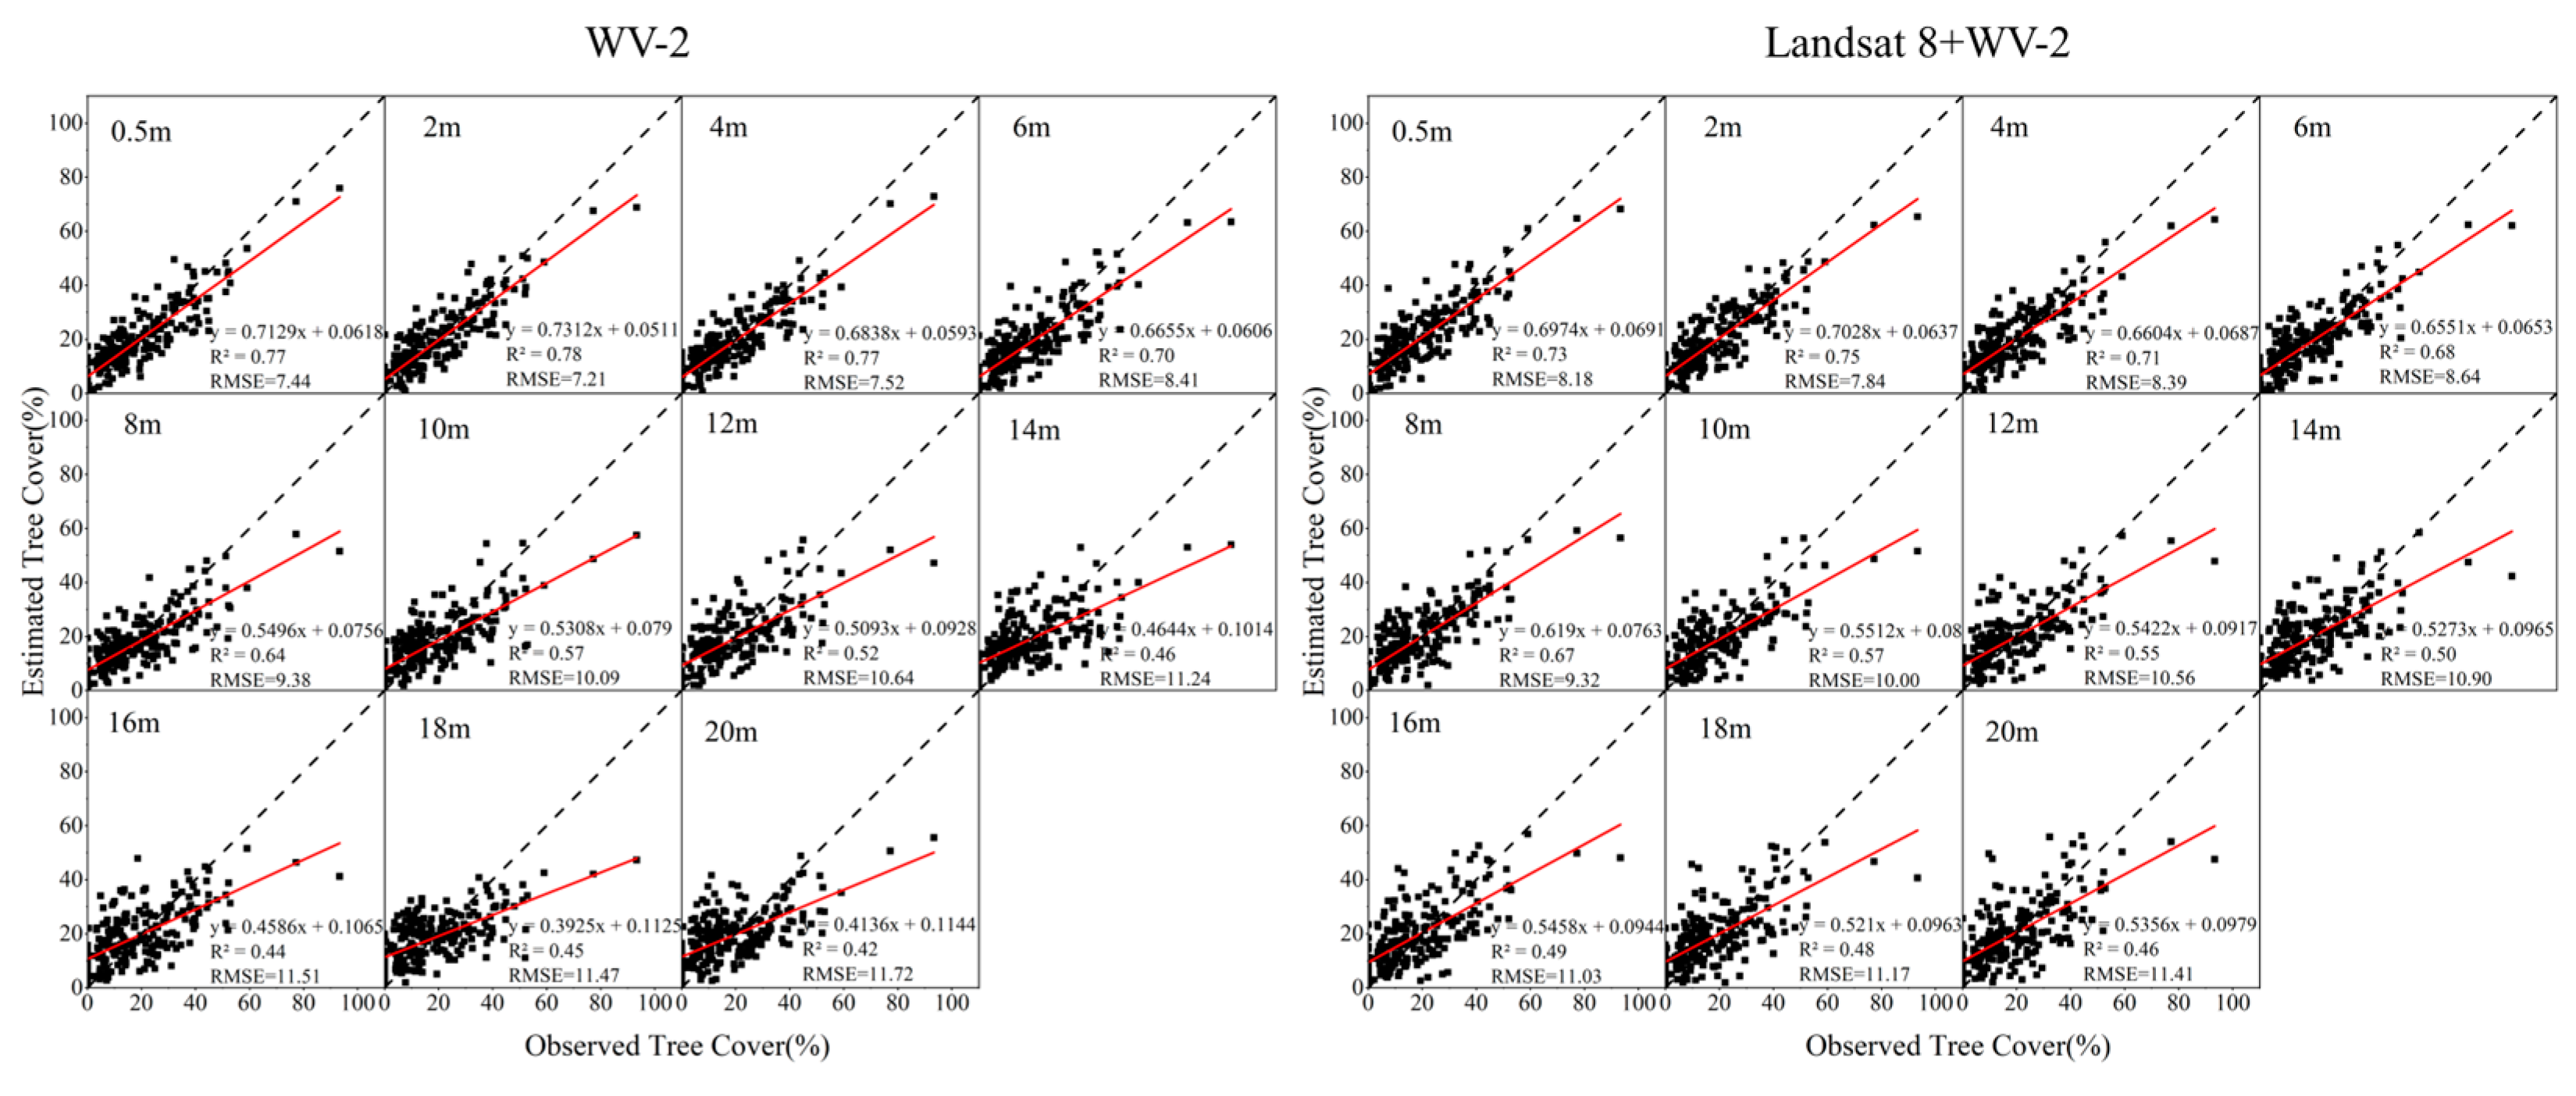
4.3. Comparison of Model Accuracy Verification Based on Texture Features at Different Resolutions

Research indicates that high-resolution image texture features make significant contributions to estimating tree coverage. Given this premise, we wanted to understand whether the effect of texture features on tree coverage changes with decreasing resolution, and if so, how it changes. Therefore, based on 0.5 m resolution WV-2 imagery, we obtained texture features at different resolutions through scale conversion and texture extraction, constructed high-resolution feature models at different scales, and compared them with models constructed using Landsat data and different resolution texture features (cooperative models). The performance of high-resolution feature models and cooperative models at different resolutions is shown in Figure 7. From a resolution of 0.5 m to 20 m, the overall trend of the model’s R2 gradually increases, the RMSE gradually decreases, and the overall performance of the model decreases. The model performance at a resolution of 2 m is the best. For the high-resolution texture feature model, the R2 is 0.78, and the RMSE is 7.21%. For the collaborative model, the R2 is 0.75, and the RMSE is 7.84%.

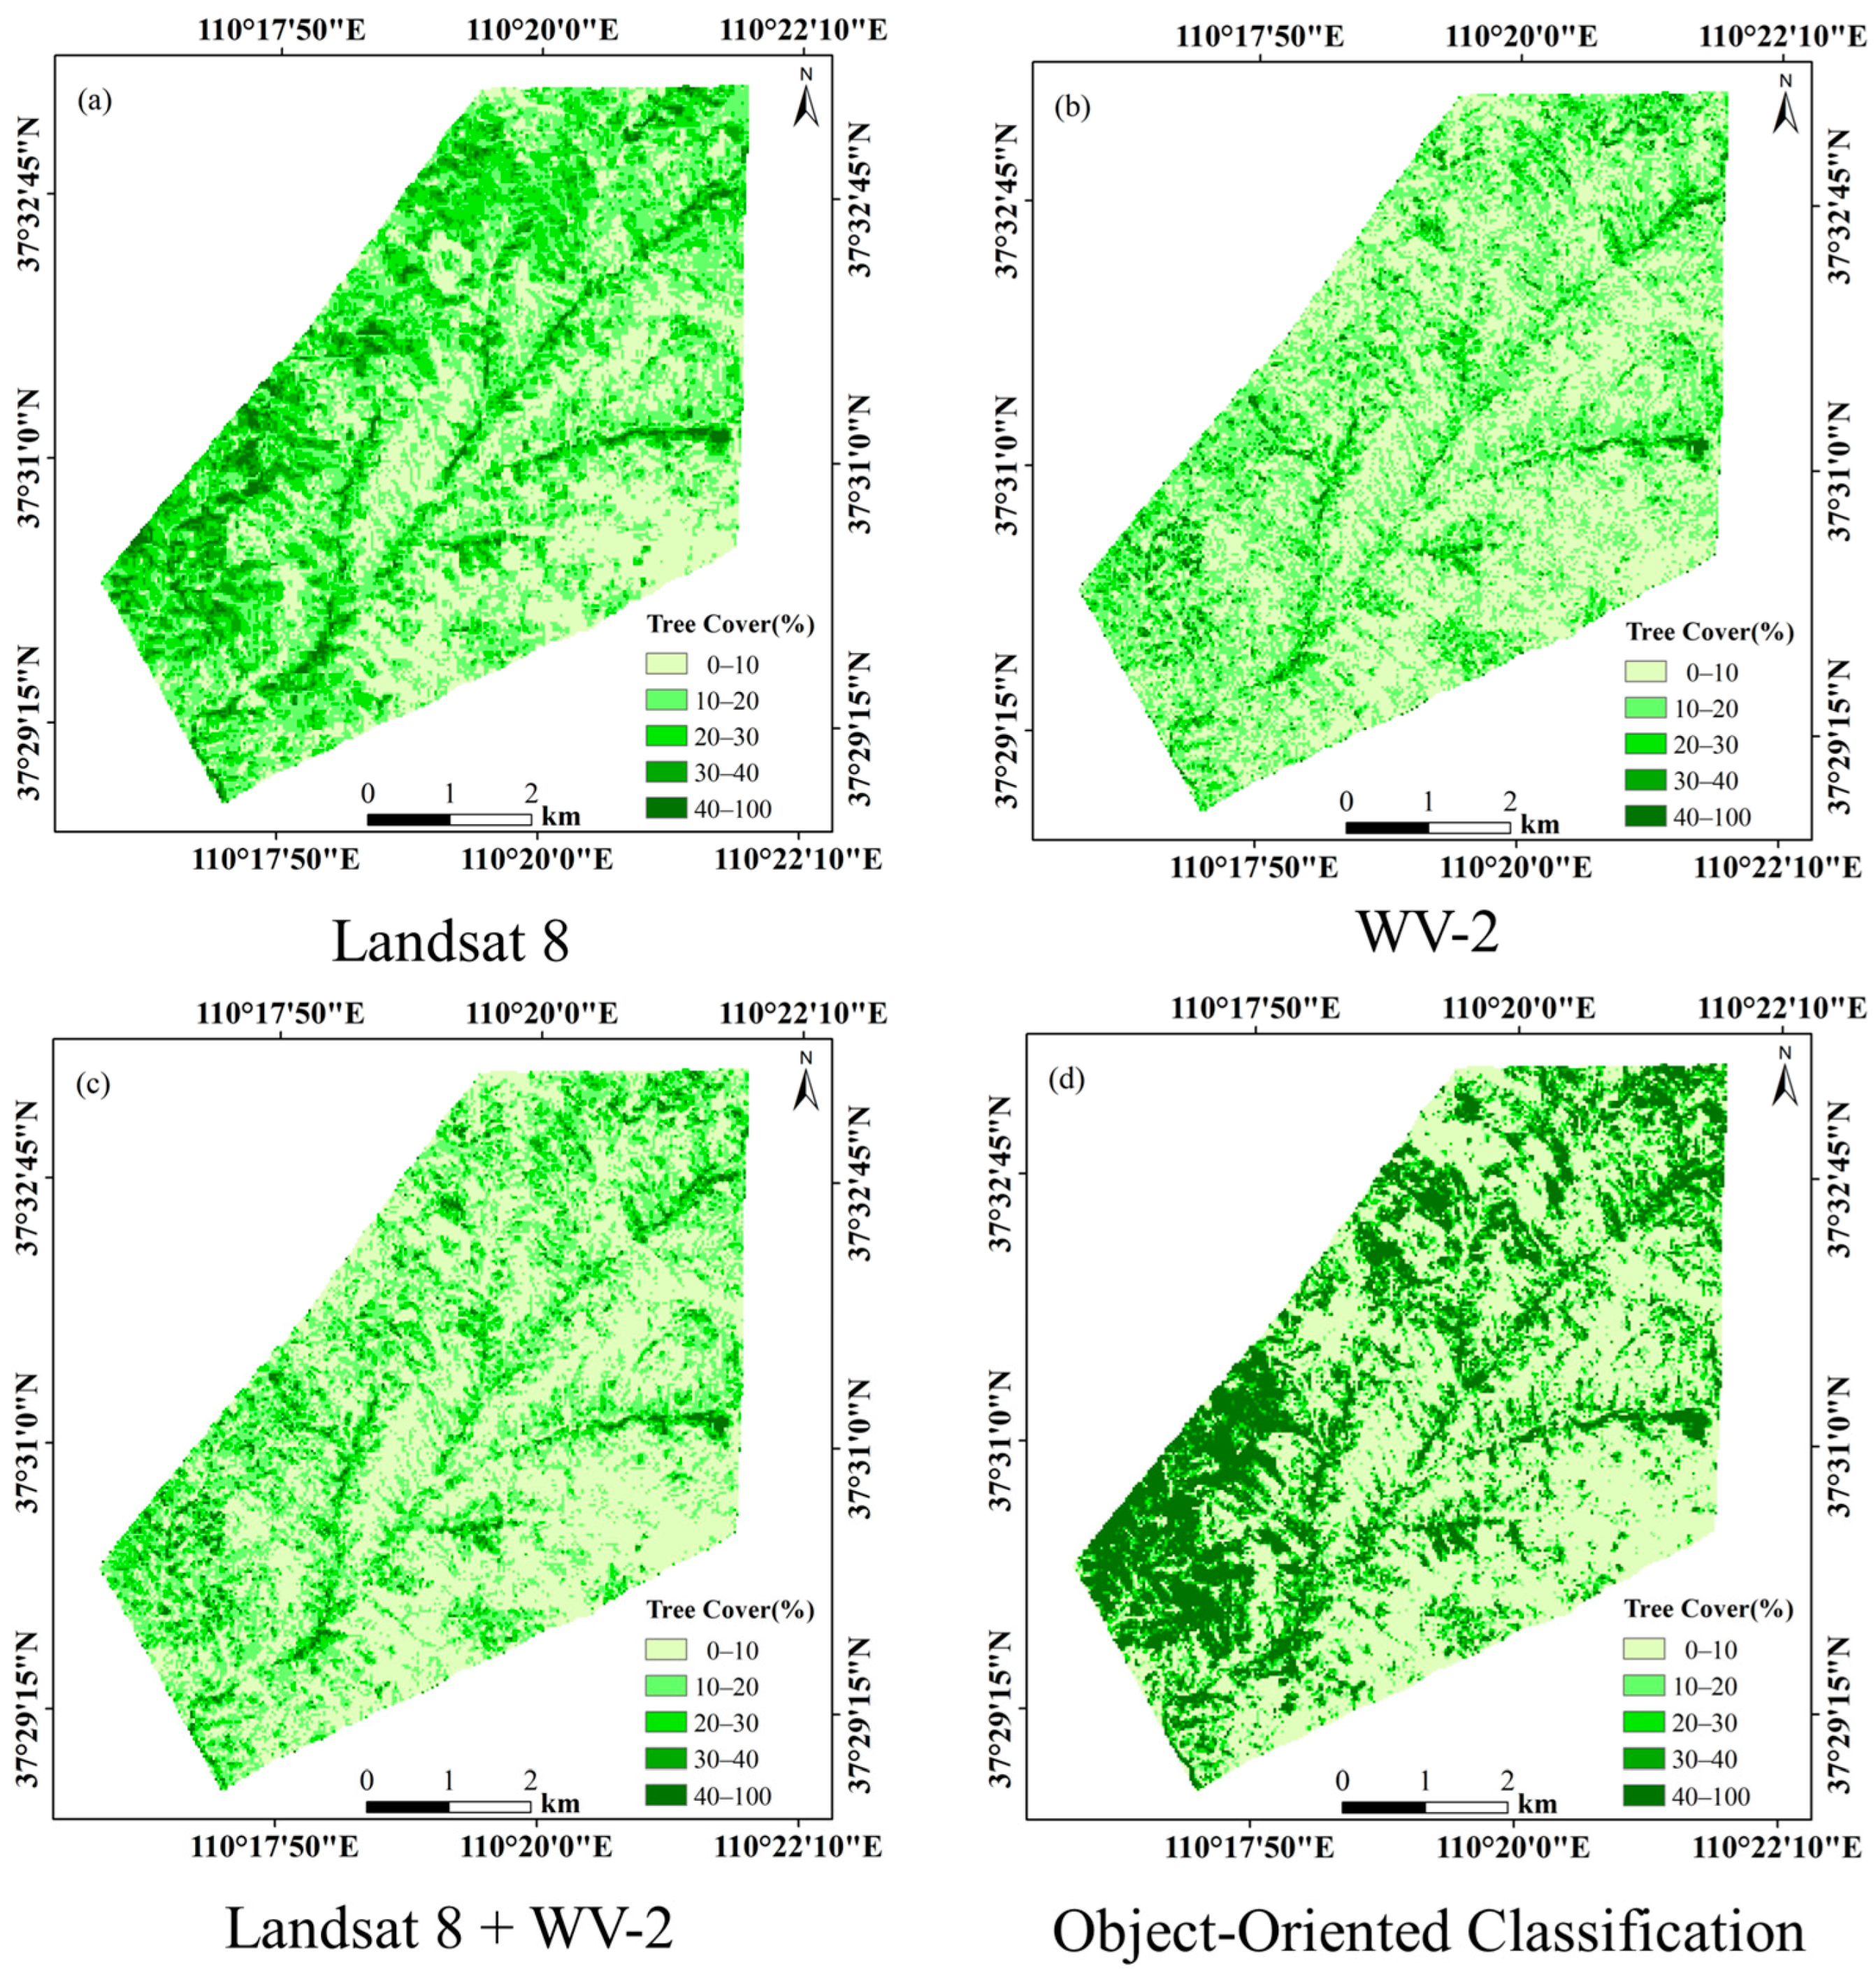
4.4. Tree Cover Mapping

Figure 8 shows the tree coverage maps of the study area generated using different methods. Through the analysis of the tree coverage map, it becomes clear that areas with coverage exceeding 40% are mostly located on both sides of roads and in the southwest region. The coverage in the majority of areas outside both sides of the road is below 10%. The coverage in the remaining fragmented areas ranges from 10% to 30%. This is consistent with the actual on-site growth conditions of trees. As shown in Figure 8, the tree cover based on the classification results of the high-resolution images shows a large number of high-value areas in the southwest, which is mainly due to the misclassification of grasses as trees. The results of the tree cover inversion based on the medium-resolution feature model show a large number of high-value areas in the southwest, which is mainly due to the difficulty of spectral information to extract the tree cover in the grassland context. The coverage image of the high-resolution model and the coverage map of the medium-to-high-resolution model are more consistent with reality. The overall tree coverage in the study area is around 30%.

5. Discussion

5.1. Implication of High-Resolution Imagery on Estimating Tree Cover

Tree cover is defined as the proportion of land covered by the vertical projection of tree and shrub canopies relative to the entire area [18,19,29]. Most studies utilizing remote sensing to estimate tree canopy cover use high-resolution images, which allow for the direct mapping of trees at a certain scale, identifying trees of a certain size as objects [22,59,60,61]. In order to explore the potential of high-resolution imagery for estimating tree canopy cover in sparse tree grasslands, we conducted a series of studies. First, we used WV-2 imagery to conduct object-oriented classification for the inversion of tree cover. Previous studies have successfully identified individual trees using high-resolution imagery [26,61,62], but unlike this study, there are differences in tree background. In sparse-tree grasslands, there are areas where trees and green vegetation mix together. Trees and green herbaceous plants have similar colors and texture features, and their spatial distribution and arrangement are quite complex and diverse. These factors greatly influence the accuracy of tree cover inversion (RMSE = 16.78%). Next, we employed the random forest modeling approach to explore the relationship between texture features in high-resolution imagery and tree cover. In this study, we found a relatively strong relationship between image texture (in particular, the near-infrared band’s gray-level co-occurrence matrix (GLCM) correlation and mean) and tree cover, which is consistent with previous research. This indicates that image texture is particularly useful in areas with open tree canopies [42,63]. The estimated accuracy of the best prediction model reached an R2 of 0.78 and an RMSE of 7.21 (Figure 7). Our modeling results also show that the joint use of Landsat 8 and WV-2 data improves tree cover inversion accuracy. This confirms previous work [32,64,65], but the joint use of Landsat 8 and WV-2 data did not have as good a model performance as using only WV-2 data. There are several factors that can explain this. Firstly, the resolution of the WV-2 images used in this study is 0.5 m, already reaching sub-meter resolution. The texture features of WV-2 images are better at capturing the characteristics of trees than the spectral features of Landsat images because WV-2 provides more observations for each pixel than Landsat. Many observations are crucial for accurately describing land cover [66,67]. Secondly, the texture features of sub-meter-resolution images can clearly identify the contours of trees, and adding Landsat data may eliminate some of the texture features, leading to a decrease in the inversion accuracy of the model.
We also conducted modeling studies on texture features at different resolutions. To more intuitively observe how the model performance varies with resolution, we generated bar charts for the RMSE values of the high-resolution model and the collaborative model and used two curves to represent the changes in values (Figure 9). Research indicates that at a resolution of 2 m, the RMSE curve shows an extremely low value, indicating that the model performance reaches its maximum at this resolution. There are several factors that can explain this: Firstly, high-resolution data at 0.5 m may contain too many details, leading the model to overfit noise or unnecessary differences during the training process, thereby reducing its generalization performance on new data. In this situation, by reducing resolution, the model may be more likely to capture more generalized features, improving its generalization performance and thus enhancing the model’s performance. Field surveys in the study area revealed that the average canopy diameter of trees is approximately 2 m. This corresponds precisely to the texture information at a resolution of 2 m, enabling the texture information at this resolution to accurately reflect the actual contours of trees in the study area. At this point, the model better matches the actual situation, resulting in the maximum performance of the model at a resolution of 2 m.
The high-resolution model outperforms the collaborative model up to 8 m resolution. This suggests that, at this stage, the texture information highlights tree cover more effectively than the spectral information from the medium-resolution Landsat data. After an 8 m resolution, the performance of the collaborative model is superior to that of the high-resolution model, which is consistent with the research findings of Baumann et al. [32]. This indicates that as the texture resolution decreases, some important features and minor texture information become blurred or merged, resulting in the model losing some key information in understanding object shape and structure. Texture features no longer play a decisive role, and the spectral features of medium-resolution Landsat images begin to take effect.

5.2. Comparison with Existing Tree Cover Products

Some global products aimed at mapping trees, forests, and woody cover are derived from optical remote sensing data with spatial resolutions ranging from 30 m to 250 m, using various satellite data sources, including MODIS and Landsat. To validate the superiority or inferiority of the Landsat tree cover product in this study, we compared it with two global products in the study area (Figure 10). Similarly, for Landsat products with a resolution of 30 m, the Landsat TC product is finer than the GLCC product. For continuous areas, trees can be fully represented, and individual trees can also be well inferred. Compared to the 250 m resolution MODIS VCF product, the fine-resolution Landsat product reveals many spatial details of tree cover distribution, and for trees in sparse grassland areas of the Loess Plateau, the MODIS VCF product is unable to show them at all.
The accuracy validation results of the Landsat TC, GFCC, and MODIS VCF products are shown in Figure 11. The estimation accuracy of the Landsat TC product is relatively good, with an R2 of 0.78 and an RMSE of 7.21. The accuracy of the GFCC product and MODIS product is very low, with the accuracy of the Landsat TC product being approximately 10 times higher than these two global products. The values of the GFCC product and MODIS product are both below the 1:1 line, significantly underestimating the tree coverage in the study area. The low values of MODIS VCF and GFCC are not surprising. The Loess Plateau area is a sparse tree–grassland region, but the algorithms behind these products are designed for forested areas rather than sparse tree–grassland regions [21,22]. Compared to the two global products, the Landsat TC product has higher accuracy. However, due to the expensive and scarce nature of high-resolution imagery, it is not feasible to conduct a large-scale estimation of tree coverage in sparse grasslands. For small-scale fine-grained monitoring, the Landsat TC product is undoubtedly very suitable.

5.3. Uncertainty

Our analysis produced high-performance, reliable maps that show a highly reasonable pattern of tree cover in the study area. Despite this, there are still some sources of uncertainty and limitations that need to be mentioned, specifically the following: (1) Uncertainty in reference tree cover samples is one of these limitations. The reference tree cover sample points were obtained through visual interpretation, and although 1132 sample points were randomly selected, they may not cover the entire study area. Further validation is needed to determine if they are representative of the entire region. Additionally, despite the high accuracy of manual visual interpretation, there may still be some errors. (2) Uncertainty in feature variable selection should also be noted. In sparse-tree grasslands, vegetation other than trees may exist beneath the tree canopy, and the feature variable extraction did not consider the spectral information needed to differentiate this understory vegetation from the tree canopy. (3) Uncertainty in classification and omission/commission errors (13%/9% producer/user accuracy, Table 2) may be attributed to factors such as illumination, shadow effects, sample selection, and complex backgrounds (trees and green herbaceous vegetation). (4) The tendency of the RF model to consistently overestimate low values and underestimate high values may be related to the properties of the algorithm and the characteristics of the reference data. The final predictions of the RF model are based on the average of the individual trees generated from bootstrap samples [38]; hence, RF predictions may tend to be biased toward the mean. (5) The image spatial scales do not entirely match. The mismatch in spatial scales between the resampled image pixels and the Landsat 8 remote sensing image pixels introduces errors in extracting different resolution texture features.

5.4. Applicability and Limitations to Other Geographical Regions

In this study, in order to overcome the negative effect of the image of grass background on the accuracy of tree cover estimation, a tree cover estimation method based on extracting texture features from high-resolution images is proposed. Our results indicate that based on random forest modeling, it is possible to estimate tree cover on sparse-tree grasslands with acceptable accuracy if high-resolution data subsets of the area of interest are available. Using this modeling approach can provide relatively accurate tree cover reference maps in areas with rugged terrain and strong spatial heterogeneity. In this study, apart from the on-site drone imagery, we also used WorldView-2 images to generate the reference dataset. Due to the high cost, the availability of such images may be limited, especially for large areas. However, this study found through modeling and the analysis of different resolution texture features that using images with a resolution of 2 m yields the best results for establishing random forest models in the Loess Plateau region. Nowadays, with the increasing availability of high-resolution imagery, this discovery undoubtedly greatly promotes the development of tree cover products in the region. Different regions have varying scales of tree canopies, so there is uncertainty in the resolution of high-resolution satellite images, and the optimal resolution needs to be determined based on the characteristics of the tree canopy in the study area. Additionally, in southern forest areas with higher tree cover, the effectiveness may be lower.

6. Conclusions

This study aimed to assess the impact of high-resolution imagery on tree cover in tree-sparse grasslands and to generate accurate 30 m tree cover products. The research found that tree cover inversion based on WV-2 image classification had low accuracy, influenced by factors such as illumination, shadow effects, sample selection, and complex backgrounds. In contrast, high-resolution imagery texture features performed best in tree cover modeling, especially with sub-meter-level texture features outperforming spectral features in satellite imagery. The effects of texture features on tree cover varied across different resolutions, with texture features performing better than spectral features at resolutions lower than 8 m, reaching optimal performance at a 2 m resolution. The random forest model exhibited biases in estimating high and low values, possibly related to algorithmic and reference data characteristics. Furthermore, spatial scale mismatch in imagery could lead to errors in texture feature extraction.
In summary, this study provides important insights into the use of high-resolution imagery in assessing tree cover. Future research should focus on addressing model biases and image scale matching issues to further optimize methods and results for tree cover assessment, enhancing the accuracy and reliability of evaluations.

Author Contributions

H.H.: conceptualization, data curation, formal analysis, writing—original draft preparation, writing—review and editing. Z.W.: conceptualization, writing—original draft preparation, writing—review and editing. J.C.: Supervision. Y.S.: formal analysis. All authors have read and agreed to the published version of the manuscript.

Funding

This research was funded by the National Key R&D Program of China (grant no. 2023YFC3209303), the Joint Funds of the National Natural Science Foundation of China (grant no. U2243212), and the Science Foundation for Young Elite Talents of YRCC (grant no. HQK-202307).

Data Availability Statement

Data are contained within the article.

Acknowledgments

We would like to express our thanks to the College of Landscape Architecture, Nanjing Forestry University—Haoran Yu—for his significant contributions to the review and revision of the abstract, discussion, and language expression of this article.

Conflicts of Interest

The authors declare no conflicts of interest.

Appendix A

Table A1. All predictor variables for the tree canopy coverage estimation model. SD: standard deviation; M: mean.
Landsat 8 WV-2
Blue, Green, Red, NIR, SWIR1, SWIR2Blue, Green, Red, NIR
TIRS1, TIRS2NDVIVDVI
NDMINDVIBlue M GLCM MeanBlue M GLCM Variance
RVIEVIBlue M GLCM
Homogeneity
Blue M GLCM Contrast
GRVINIRvBlue M GLCM
Dissimilarity
Blue M GLCM Entropy
DVIGNDVIBlue M GLCM ASMBlue M GLCM
Correlation
MSAVI Green M GLCM MeanGreen M GLCM
Variance
Blue GLCM MeanBlue GLCM VarianceGreen M GLCM
Homogeneity
Green M GLCM
Contrast
Blue GLCM
Homogeneity
Blue GLCM ContrastGreen M GLCM
Dissimilarity
Green M GLCM
Entropy
Blue GLCM
Dissimilarity
Blue GLCM EntropyGreen M GLCM ASMGreen M GLCM
Correlation
Blue GLCM ASMBlue GLCM CorrelationRed M GLCM MeanRed M GLCM Variance
Green GLCM MeanGreen GLCM VarianceRed M GLCM
Homogeneity
Red M GLCM Contrast
Green GLCM
Homogeneity
Green GLCM ContrastRed M GLCM
Dissimilarity
Red M GLCM Entropy
Green GLCM
Dissimilarity
Green GLCM EntropyRed M GLCM ASMRed M GLCM
Correlation
Green GLCM ASMGreen GLCM CorrelationNIR M GLCM MeanNIR M GLCM Variance
Red GLCM MeanRed GLCM VarianceNIR M GLCM
Homogeneity
NIR M GLCM Contrast
Red GLCM
Homogeneity
Red GLCM ContrastNIR M GLCM
Dissimilarity
NIR M GLCM Entropy
Red GLCM
Dissimilarity
Red GLCM EntropyNIR M GLCM ASMNIR M GLCM
Correlation
Red GLCM ASMRed GLCM CorrelationBlue SD GLCM MeanBlue SD GLCM
Variance
NIR GLCM MeanNIR GLCM VarianceBlue SD GLCM
Homogeneity
Blue SD GLCM
Contrast
NIR GLCM
Homogeneity
NIR GLCM ContrastBlue SD GLCM
Dissimilarity
Blue SD GLCM Entropy
NIR GLCM
Dissimilarity
NIR GLCM EntropyBlue SD GLCM ASMBlue SD GLCM
Correlation
NIR GLCM ASMNIR GLCM CorrelationGreen SD GLCM MeanGreen SD GLCM
Variance
SWIR1 GLCM MeanSWIR1 GLCM VarianceGreen SD GLCM
Homogeneity
Green SD GLCM
Contrast
SWIR1 GLCM
Homogeneity
SWIR1 GLCM ContrastGreen SD GLCM
Dissimilarity
Green SD GLCM
Entropy
SWIR1 GLCM
Dissimilarity
SWIR1 GLCM EntropyGreen SD GLCM ASMGreen SD GLCM
Correlation
SWIR1 GLCM ASMSWIR1 GLCM CorrelationRed SD GLCM MeanRed SD GLCM
Variance
SWIR2 GLCM MeanSWIR2 GLCM VarianceRed SD GLCM
Homogeneity
Red SD GLCM Contrast
SWIR2 GLCM
Homogeneity
SWIR2 GLCM ContrastRed SD GLCM
Dissimilarity
Red SD GLCM Entropy
SWIR2 GLCM
Dissimilarity
SWIR2 GLCM EntropyRed SD GLCM ASMRed SD GLCM
Correlation
SWIR2 GLCM ASMSWIR2 GLCM CorrelationNIR SD GLCM MeanNIR SD GLCM
Variance
NIR SD GLCM
Homogeneity
NIR SD GLCM
Contrast
NIR SD GLCM
Dissimilarity
NIR SD GLCM Entropy
NIR SD GLCM ASMNIR SD GLCM
Correlation

References

  1. Deng, N.; Wang, H.; Hu, S.; Jiao, J. Effects of afforestation restoration on soil potential N2O emission and denitrifying bacteria after farmland abandonment in the Chinese loess plateau. Front. Microbiol. 2019, 10, 262. [Google Scholar] [CrossRef] [PubMed]
  2. Lan, X.; Liu, Z.; Yang, T.; Cheng, L.; Wang, X.; Wei, W.; Ge, Y.; Chen, X.; Lin, L.; Zhao, T.; et al. Land-Use Intensity Reversed the Role of Cropland in Ecological Restoration Over the World’s Most Severe Soil Erosion Region. Earth’s Future 2023, 11, e2022EF003388. [Google Scholar]
  3. Huang, W.; Wang, P.; He, L.; Liu, B. Improvement of water yield and net primary productivity ecosystem services in the Loess Plateau of China since the “Grain for Green” project. Ecol. Indic. 2023, 154, 110707. [Google Scholar] [CrossRef]
  4. Zhan, T.; Zhao, W.; Feng, S.; Hua, T. Plant community traits respond to grazing exclusion duration in alpine meadow and alpine steppe on the Tibetan plateau. Front. Plant Sci. 2022, 13, 863246. [Google Scholar] [CrossRef] [PubMed]
  5. Liu, Y.; Ge, J.; Guo, W.; Cao, Y.; Chen, C.; Luo, X.; Yang, L.; Wang, S. Revisiting biophysical impacts of greening on precipitation over the Loess Plateau of China using WRF with water vapor tracers. Geophys. Res. Lett. 2023, 50, e2023GL102809. [Google Scholar] [CrossRef]
  6. Zhang, X.; Liao, C.; Li, J.; Sun, Q. Fractional vegetation cover estimation in arid and semi-arid environments using HJ-1 satellite hyperspectral data. Int. J. Appl. Earth Obs. Geoinf. 2013, 21, 506–512. [Google Scholar] [CrossRef]
  7. Jia, K.; Liang, S.; Liu, S.; Li, Y.; Xiao, Z.; Yao, Y.; Jiang, B.; Zhao, X.; Wang, X.; Xu, S.; et al. Global land surface fractional vegetation cover estimation using general regression neural networks from MODIS surface reflectance. IEEE Trans. Geosci. Remote Sens. 2015, 53, 4787–4796. [Google Scholar] [CrossRef]
  8. Song, D.X.; Wang, Z.; He, T.; Wang, H.; Liang, S. Estimation and validation of 30 m fractional vegetation cover over China through integrated use of Landsat 8 and Gaofen 2 data. Sci. Remote Sens. 2022, 6, 100058. [Google Scholar] [CrossRef]
  9. Wen, Z.; Brian, G.L.; Jiao, F.; Lei, W.; Shi, H. Stratified vegetation cover index: A new way to assess vegetation impact on soil erosion. Catena 2010, 83, 87–93. [Google Scholar]
  10. Chen, Y.; Wang, F.; Liu, G.; Yu, X.; Jia, G.; Gan, P. Modified vegetation-erosion dynamics model and its application in typical watersheds in the Loess Plateau. Int. J. Sediment Res. 2011, 26, 78–86. [Google Scholar] [CrossRef]
  11. Chen, J.; Yi, S.; Qin, Y.; Wang, X. Improving estimates of fractional vegetation cover based on UAV in alpine grassland on the Qinghai–Tibetan Plateau. Int. J. Remote Sens. 2016, 37, 1922–1936. [Google Scholar] [CrossRef]
  12. Panagiotidis, D.; Abdollahnejad, A.; Slavik, M. 3D point cloud fusion from UAV and TLS toassess temperate managed forest structures. Int. J. Appl. Earth Obs. Geoinf. 2022, 112, 102917. [Google Scholar]
  13. Yin, Y.; Yuan, Y.; Zhang, X.; Hu, H.; Cheng, Y.; Borjigin, S. Comparison of the responses of soil fungal community to straw, inorganic fertilizer, and compost in a farmland in the Loess Plateau. Microbiol. Spectr. 2022, 10, e02230-21. [Google Scholar] [CrossRef] [PubMed]
  14. Wang, A.; Gao, X.; Zhou, Z.; Yang, H.; Zhao, X.; Wang, Y.; Li, M.; Zhao, X. Dynamic responses of tree-ring growth to drought over Loess Plateau in the past three decades. Ecol. Indic. 2022, 143, 109423. [Google Scholar] [CrossRef]
  15. Shi, Y.; Wang, Z.; Liu, L.; Li, C.; Peng, D.; Xiao, P. Improving Estimation of Woody Aboveground Biomass of Sparse Mixed Forest over Dryland Ecosystem by Combining Landsat-8, GaoFen-2, and UAV Imagery. Remote Sens 2021, 13, 4859. [Google Scholar] [CrossRef]
  16. Liu, Y.; Huang, H.; Meng, L.; Liu, M.; Wu, Z.; Liu, T.; Labat, D. Spatial-temporal evolution of vegetation coverage and its relationship with terrain and human factors in the upper reaches of Ganjiang River Basin, China. Front. Earth Sci. 2023, 10, 1043403. [Google Scholar] [CrossRef]
  17. Zhong, G.; Chen, J.; Huang, R.; Yi, S.; Qin, Y.; You, H.; Han, X.; Zhou, G. High Spatial Resolution Fractional Vegetation Coverage Inversion Based on UAV and Sentinel-2 Data: A Case Study of Alpine Grassland. Remote Sens. 2023, 15, 4266. [Google Scholar] [CrossRef]
  18. Gonsamo, A.; D’odorico, P.; Pellikka, P. Measuring fractional forest canopy element cover and openness–definitions and methodologies revisited. Oikos 2013, 122, 1283–1291. [Google Scholar] [CrossRef]
  19. Yang, L.; Jia, K.; Liang, S.; Wei, X.; Yao, Y.; Zhang, X. A robust algorithm for estimating surface fractional vegetation cover from landsat data. Remote Sens. 2017, 9, 857. [Google Scholar] [CrossRef]
  20. Bastin, J.F.; Finegold, Y.; Garcia, C.; Mollicone, D.; Rezende, M.; Routh, D.; Zohner, C.M.; Crowther, T.W. The global tree restoration potential. Science 2019, 365, 76–79. [Google Scholar] [CrossRef]
  21. DiMiceli, C.M.; Carroll, M.L.; Sohlberg, R.A.; Huang, C.; Hansen, M.C.; Townshend, J.R. Annual Global Automated MODIS Vegetation Continuous Fields (MOD44B) at 250 m Spatial Resolution for Data Years Beginning Day 65, 2000–2010; University of Maryland: College Park, MD, USA, 2017. [Google Scholar]
  22. Sexton, J.O.; Song, X.P.; Feng, M.; Noojipady, P.; Anand, A.; Huang, C.; Kim, D.H.; Collins, K.M.; Channan, S.; DiMiceli, C.; et al. Global, 30-m resolution continuous fields of tree cover: Landsat-based rescaling of MODIS vegetation continuous fields with lidar-based estimates of error. Int. J. Digit. Earth 2013, 6, 427–448. [Google Scholar] [CrossRef]
  23. Herrmann, S.M.; Wickhorst, A.J.; Marsh, S.E. Estimation of tree cover in an agricultural parkland of Senegal using rule-based regression tree modeling. Remote Sens. 2013, 5, 4900–4918. [Google Scholar] [CrossRef]
  24. Brandt, J.; Ertel, J.; Spore, J.; Stolle, F. Wall-to-wall mapping of tree extent in the tropics with Sentinel-1 and Sentinel-2. Remote Sens. Environ. 2023, 292, 113574. [Google Scholar] [CrossRef]
  25. Brandt, M.; Hiernaux, P.; Tagesson, T.; Verger, A.; Rasmussen, K.; Diouf, A.A.; Mbow, C.; Mougin, E.; Fensholt, R. Woody plant cover estimation in drylands from Earth Observation based seasonal metrics. Remote Sens. Environ. 2016, 172, 28–38. [Google Scholar] [CrossRef]
  26. Higginbottom, T.P.; Symeonakis, E.; Meyer, H.; van der Linden, S. Mapping fractional woody cover in semi-arid savannahs using multi-seasonal composites from Landsat data. ISPRS J. Photogramm. Remote Sens. 2018, 139, 88–102. [Google Scholar] [CrossRef]
  27. Brandt, M.; Tucker, C.J.; Kariryaa, A.; Rasmussen, K.; Abel, C.; Small, J.; Chave, J.; Rasmussen, L.V.; Hiernaux, P.; Diouf, A.A.; et al. An unexpectedly large count of trees in the West African Sahara and Sahel. Nature 2020, 587, 78–82. [Google Scholar] [CrossRef]
  28. Zhang, W.; Brandt, M.; Wang, Q.; Prishchepov, A.V.; Tucker, C.J.; Li, Y.; Lyu, H.; Fensholt, R. From woody cover to woody canopies: How Sentinel-1 and Sentinel-2 data advance the mapping of woody plants in savannas. Remote Sens. Environ. 2019, 234, 111465. [Google Scholar] [CrossRef]
  29. Abdollahnejad, A.; Panagiotidis, D.; Surový, P. Estimation and Extrapolation of Tree Parameters Using Spectral Correlation between UAV and Pléiades Data. Forests 2018, 9, 85. [Google Scholar] [CrossRef]
  30. Shafeian, E.; Fassnacht, F.E.; Latifi, H. Mapping fractional woody cover in an extensive semi-arid woodland area at different spatial grains with Sentinel-2 and very high-resolution data. Int. J. Appl. Earth Obs. Geoinf. 2021, 105, 102621. [Google Scholar] [CrossRef]
  31. Anchang, J.Y.; Prihodko, L.; Ji, W.J.; Kumar, S.S.; Ross, C.W.; Yu, Q.Y.; Lind, B.; Sarr, M.A.; Diouf, A.A.; Hanan, N.P. Toward operational mapping of woody canopy cover in tropical savannas using Google Earth Engine. Front. Environ. Sci. 2020, 8, 4. [Google Scholar] [CrossRef]
  32. Liao, Z.M.; Van Dijk, A.I.; He, B.B.; Larraondo, P.R.; Scarth, P.F. Woody vegetation cover, height and biomass at 25-m resolution across Australia derived from multiple site, airborne and satellite observations. Int. J. Appl. Earth Obs. Geoinf. 2020, 93, 102209. [Google Scholar] [CrossRef]
  33. Baumann, M.; Levers, C.; Macchi, L.; Bluhm, H.; Waske, B.; Gasparri, N.I.; Kuemmerle, T. Mapping continuous fields of tree and shrub cover across the Gran Chaco using Landsat 8 and Sentinel-1 data. Remote Sens. Environ. 2018, 216, 201–211. [Google Scholar] [CrossRef]
  34. Wang, W.; Sun, L.; Luo, Y. Changes in vegetation greenness in the upper and middle reaches of the Yellow River Basin over 2000–2015. Sustainability 2019, 11, 2176. [Google Scholar] [CrossRef]
  35. Zhang, J.; Zhang, Y.; Zhou, T.; Sun, Y.; Yang, Z.; Zheng, S. Research on the identification of land types and tree species in the Engebei ecological demonstration area based on GF-1 remote sensing. Ecol. Inform. 2023, 77, 102242. [Google Scholar] [CrossRef]
  36. Zhao, F.; Wu, X.; Wang, S. Object-oriented vegetation classification method based on UAV and satellite image fusion. Procedia Comput. Sci. 2020, 174, 609–615. [Google Scholar] [CrossRef]
  37. Rafieyan, O.; Darvishsefat, A.A.; Babaii, S.; Mataji, A. Evaluation of pixel-based and object-based classification methods for tree identification using aerial images (case study: A forestation in Chamestan-Nur). Iran. J. For. 2011, 3, 35–47. [Google Scholar]
  38. Breiman, L. Random forests. Mach. Learn. 2001, 45, 5–32. [Google Scholar] [CrossRef]
  39. Li, L.; Schmitt, R.W.; Ummenhofer, C.C.; Karnauskas, K.B. North Atlantic salinity as a predictor of Sahel rainfall. Sci. Adv. 2016, 2, e1501588. [Google Scholar] [PubMed]
  40. Haralick, R.M.; Shanmugam, K.; Dinstein, I.H. Textural features for image classification. IEEE Trans. Syst. Man Cybern. 1973, SMC-3, 610–621. [Google Scholar] [CrossRef]
  41. Hall-Beyer, M. Practical guidelines for choosing GLCM textures to use in landscape classification tasks over a range of moderate spatial scales. Int. J. Remote Sens. 2017, 38, 1312–1338. [Google Scholar] [CrossRef]
  42. Karlson, M.; Ostwald, M.; Reese, H.; Sanou, J.; Tankoano, B.; Mattsson, E. Mapping tree canopy cover and aboveground biomass in Sudano-Sahelian woodlands using Landsat 8 and random forest. Remote Sens. 2015, 7, 10017–10041. [Google Scholar] [CrossRef]
  43. Godinho, S.; Guiomar, N.; Gil, A. Estimating tree canopy cover percentage in a mediterranean silvopastoral systems using Sentinel-2A imagery and the stochastic gradient boosting algorithm. Int. J. Remote Sens. 2018, 39, 4640–4662. [Google Scholar] [CrossRef]
  44. Rouse, J.W.; Haas, R.H.; Derring, D.W. Monitoring Vegetation Systems in the Great Plains with ERTS. Proceedings, 3rd Earth Resource Technology Satellite (ERTS) Symposium, vol. 1974, 1, p. 48-62. Available online: https://ntrs.nasa.gov/citations/19740022614 (accessed on 12 March 2024).
  45. Wang, X.; Wang, M.; Wang, S.; Wu, Y. Extraction of vegetation information from visible unmanned aerial vehicle images. Nongye Gongcheng Xuebao/Trans. Chin. Soc. Agric. Eng. 2015, 31, 152–159. [Google Scholar]
  46. Gao, B.C. NDWI—A normalized difference water index for remote sensing of vegetation liquid water from space. Remote Sens. Environ. 1996, 58, 257–266. [Google Scholar] [CrossRef]
  47. Pearson, R.L.; Miller, L.D. Remote Mapping of Standing Crop Biomass for Estimation of Productivity of the Shortgrass Prairie. In Proceedings of the 8th International Symposium on Remote Sensing of Environment, Pawnee National Grasslands, Colorado, Ann Arbor, MI, USA, 2–6 October 1972; Asrar, G., Ed.; pp. 1357–1381. [Google Scholar]
  48. Liu, H.Q.; Huete, A. A feedback based modification of the NDVI to minimize canopy background and atmospheric noise. IEEE Trans. Geosci. Remote Sens. 1995, 33, 457–465. [Google Scholar] [CrossRef]
  49. Tucker, C.J. Red and photographic infrared linear combinations for monitoring vegetation. Remote Sens. Environ 1979, 8, 127–150. [Google Scholar]
  50. Badgley, G.; Field, C.B.; Berry, J.A. Canopy near-infrared reflectance and terrestrial photosynthesis. Sci. Adv. 2017, 3, e1602244. [Google Scholar] [CrossRef]
  51. Richardson, A.J.; Wiegand, C. Distinguishing Vegetation from Soil Background Information. Photogramm. Eng. Remote Sens 1977, 43, 1541–1552. [Google Scholar]
  52. Shanahan, J.F.; Schepers, J.S.; Francis, D.D. Use of remote-sensing imagery to estimate corn grain yield. Agron. J. 2001, 93, 583–589. [Google Scholar] [CrossRef]
  53. Qi, J.; Huete, A.R.; Moran, M.S.; Chehbouni, A.; Jackson, R.D. Interpretation of vegetation indices derived from multi-temporal SPOT images. Remote Sens. Environ. 1993, 44, 89–101. [Google Scholar] [CrossRef]
  54. Hastie, T.; James, G.; Witten, D.; Tibshirani, R. An Introduction to Statistical Learning; Springer: New York, NY, USA, 2013. [Google Scholar]
  55. Kuhn, M.; Johnson, K. Applied Predictive Modeling; Springer: New York, NY, USA, 2013. [Google Scholar]
  56. Aujla, I.S.; Paulitz, T.C. An improved method for establishing accurate water potential levels at different temperatures in growth media. Front. Microbiol. 2017, 8, 1497. [Google Scholar] [CrossRef] [PubMed]
  57. Gidskehaug, L.; Anderssen, E.; Alsberg, B.K. Cross model validation and optimisation of bilinear regression models. Chemom. Intell. Lab. Syst. 2008, 93, 1–10. [Google Scholar] [CrossRef]
  58. Guyon, I.; Weston, J.; Barnhill, S.; Vapnik, V. Gene selection for cancer classification using support vector machines. Mach. Learn. 2002, 46, 389–422. [Google Scholar] [CrossRef]
  59. Sterling, S.J.; Orr, B. Patterns of Tree Distribution within Small Communities of the Sudanian Savanna-Sahel. Land 2014, 3, 1284–1292. [Google Scholar] [CrossRef]
  60. Bastin, J.F.; Berrahmouni, N.; Grainger, A.; Maniatis, D.; Mollicone, D.; Moore, R.; Patriarca, C.; Picard, N.; Sparrow, B.; Abraham, E.M.; et al. The Extent of Forest in Dryland Biomes. Science 2017, 356, 635–638. [Google Scholar] [CrossRef]
  61. Guo, J.; Xu, Q.; Zeng, Y.; Liu, Z.; Zhu, X.X. Nationwide urban tree canopy mapping and coverage assessment in Brazil from high-resolution remote sensing images using deep learning. ISPRS J. Photogramm. Remote Sens. 2023, 198, 1–15. [Google Scholar] [CrossRef]
  62. Pu, R.; Landry, S. A comparative analysis of high spatial resolution IKONOS and WorldView-2 imagery for mapping urban tree species. Remote Sens. Environ. 2012, 124, 516–533. [Google Scholar] [CrossRef]
  63. Eckert, S. Improved forest biomass and carbon estimations using texture measures from Worldview-2 satellite data. Remote Sens 2012, 4, 810–829. [Google Scholar] [CrossRef]
  64. Gu, Z.J.; Ju, W.M.; Li, L.; Li, D.Q.; Liu, Y.B.; Fan, W.L. Using vegetation indices and texture measures to estimate vegetation fractional coverage (VFC) of planted and natural forests in Nanjing City, China. Adv. Space Res. 2013, 51, 1186–1194. [Google Scholar] [CrossRef]
  65. Zhao, Q.; Wang, F.; Zhao, J.; Zhou, J.; Yu, S.; Zhao, Z. Estimating Forest Canopy Cover in Black Locust (Robinia pseudoacacia L.) Plant. Loess Plateau Using Random Forest. Forests 2018, 9, 623. [Google Scholar] [CrossRef]
  66. Baumann, M.; Ozdogan, M.; Richardson, A.D.; Radeloff, V.C. Phenology from Landsat when data is scarce: Using MODIS and Dynamic Time-Warping to combine multi-year Landsat imagery to derive annual phenology curves. Int. J. Appl. Earth Obs. Geoinf. 2017, 54, 72–83. [Google Scholar] [CrossRef]
  67. Massey, R.; Sankey, T.T.; Congalton, R.G.; Yadav, K.; Thenkabail, P.S.; Ozdogan, M.; Meador, A.J.S. MODIS phenology-derived, multi-year distribution of conterminous US crop types. Remote Sens. Environ. 2017, 198, 490–503. [Google Scholar] [CrossRef]
Figure 1. The geographical location and on-site observation UAV imagery of the study area. The yellow polygon represents the boundary of the study area.
Forests 15 00847 g001
Figure 2. Creating tree classification sample points based on WV-2 images on a 180 m × 180 m grid. The area inside the red circle shows the detailed image display section.
Forests 15 00847 g002
Figure 3. The establishment and validation of tree cover samples. The top −left image displays the tree sample points within the corresponding grid of visually interpreted UAV images and WV-2 images. The bottom −left image compares the tree canopy coverage between UAV images and WV-2 images. The image on the right depicts the random distribution of tree sample points on Landsat imagery.
Forests 15 00847 g003
Figure 4. The overall workflow for obtaining tree cover, directly and indirectly, using different methods.
Forests 15 00847 g004
Figure 5. The cross-validation R2 and RMSE results for the recursive feature elimination (RFE) process. The unit of RMSE is in percentage points of tree coverage (0%–100%).
Forests 15 00847 g005
Figure 6. The accuracy validation results of different methods: (a) comparison between the 30% testing sample tree cover predicted using the medium-resolution feature model; (b) comparison between the 30% testing sample tree cover predicted using the high-resolution feature model; (c) comparison between the 30% testing sample tree cover predicted using the medium–high-resolution feature model; and (d) accuracy validation of tree cover based on object-oriented classification.
Forests 15 00847 g006
Figure 7. Comparison between the model-predicted tree coverage based on 11 resolution texture features and 30% of the test samples. The image on the left shows the use of only WV-2 image texture features. The image on the right shows the use of WV-2 image texture features and Landsat 8 image spectral features.
Forests 15 00847 g007
Figure 8. Inversion research of tree coverage mapping in the study area using different methods at 30 m resolution: (a) A tree cover map was inverted using a medium-resolution feature model; (b) A tree cover map was inverted using 2 m resolution texture feature model; (c) A tree cover map was inverted using a combined model of 2 m resolution texture features and Landsat 8 features; and (d) Based on the classification map of WV-2 imagery, a tree cover map was inverted.
Forests 15 00847 g008
Figure 9. The variation in RMSE results for high-resolution and medium–high-resolution models at different resolutions. The red line represents the RMSE variation curve obtained by using Landsat 8 data and texture features from WV-2 at different resolutions to construct a random forest model. The black line represents the RMSE variation curve obtained by using texture features from WV-2 at different resolutions to construct a random forest model.
Forests 15 00847 g009
Figure 10. The estimation of tree canopy coverage (%) is derived from multiple products, including the 30 m resolution Landsat tree cover, 30 m GFCC, and 250 m MODIS VCF. Each image window covers a spatial range of 8 km × 8 km, presenting sparse tree conditions.
Forests 15 00847 g010
Figure 11. Accuracy validation of different products (%). The image on the left shows the Landsat tree cover product generated based on 2 m resolution texture features modeled from WV-2 imagery, the image in the middle shows the results of the GFCC product, and the image on the right shows the results of the MODIS VCF product.
Forests 15 00847 g011
Table 1. Parameter settings for determining optimal hyperparameters for random forest models.
Landsat 8WV-2Landsat 8 + WV-2
RFn_estimators = 501, max_depth = None,
min_samples_leaf = 9, min_samples_split = 1,
random_state = 70
n_estimators = 455, max_depth = 42,
min_samples_leaf = 4, min_samples_split = 11,
random_state = 70
n_estimators = 550, max_depth = 15,
min_samples_leaf = 3, min_samples_split = 2,
random_state = 85
Table 2. Feature factors and descriptions of the tree cover estimation model.
FeatureDescriptionsFeatureDescriptions
Landsat 8 reflectanceBlue, Green, Red, NIR,
SWIR1, SWIR2
NDVI
[44]
M N I R M R e d M N I R + M R e d
WorldView-2 reflectanceBlue, Green, Red, NIRVDVI
[45]
2 × M G r e e n M R e d M B l u e 2 × M G r e e n + M R e d + M B l u e
GLCM Mean i = 0 N g j = 0 N g p i , j × i NDMI
[46]
M N I R M S W I R 1 M N I R + M S W I R 1
GLCM Variance i = 0 N g j = 0 N g p i , j × ( i u ) 2 RVI
[47]
M N I R M R e d
GLCM Homogeneity i = 0 N g j = 0 N g p ( i , j ) 1 + ( i j ) 2 EVI
[48]
2.5 × ( M N I R M R e d ) M N I R + 6 × M R e d 7.5 × M B l u e + 1
GLCM Contrast i = 0 N g j = 0 N g p i , j × ( i j ) 2 GRVI
[49]
M G r e e n M R e d M G r e e n + M R e d
GLCM Dissimilarity i = 0 N g j = 0 N g p ( i , j ) × i j NIRv
[50]
M N I R M R e d × M N I R M N I R + M R e d
GLCM Entropy i = 0 N g j = 0 N g p i , j × ln p ( i , j ) DVI
[51]
M N I R M R e d
GLCM ASM i = 0 N g j = 0 N g p ( i , j ) 2 GNDVI
[52]
M N I R M G r e e n M N I R + M G r e e n
GLCM Correlation i = 0 N g i = 0 N g i u × j u × p ( i , j ) σ 2
MSAVI
[53]
2 × M N I R + 1 ( 2 × M N I R + 1 ) 2 8 × ( M N I R M R e d ) 2
Blue, Green, Red, NIR, SWIR1, and SWIR2 represent the blue, green, red, near-infrared, shortwave infrared 1, and shortwave infrared 2 bands of Landsat 8 imagery. Blue, Green, Red, and NIR represent the blue, green, red, and near-infrared bands of WorldView-2 imagery. M represents band reflectance and Ng is the image grayscale; i and j represent row and column numbers, and P(i,j) is the joint conditional probability density between grayscale levels; μ and σ are the mean and variance of P(i,j).
Table 3. The top five variables in the recursive feature elimination (RFE) models for different methods. SD: standard deviation; M: mean.
NumberLandsat 8WV-2Landsat 8 + WV-2
1NDMINIR SD GLCM CorrelationNIR SD GLCM Correlation
2EVIRed M GLCM MeanNDMI
3NDVINIR M GLCM MeanEVI
4RVIBlue M GLCM MeanRed M GLCM Mean
5MSAVINIR SD GLCM ASMRVI
Disclaimer/Publisher’s Note: The statements, opinions and data contained in all publications are solely those of the individual author(s) and contributor(s) and not of MDPI and/or the editor(s). MDPI and/or the editor(s) disclaim responsibility for any injury to people or property resulting from any ideas, methods, instructions or products referred to in the content.

