Increasing Drought Sensitivity and Decline of Atlas Cedar (Cedrus atlantica) in the Moroccan Middle Atlas Forests


Abstract
: An understanding of the interactions between climate change and forest structure on tree growth are needed for decision making in forest conservation and management. In this paper, we investigated the relative contribution of tree features and stand structure on Atlas cedar (Cedrus atlantica) radial growth in forests that have experienced heavy grazing and logging in the past. Dendrochronological methods were applied to quantify patterns in basal-area increment and drought sensitivity of Atlas cedar in the Middle Atlas, northern Morocco. We estimated the tree-to-tree competition intensity and quantified the structure in Atlas cedar stands with contrasting tree density, age, and decline symptoms. The relative contribution of tree age and size and stand structure to Atlas cedar growth decline was estimated by variance partitioning using partial-redundancy analyses. Recurrent drought events and temperature increases have been identified from local climate records since the 1970s. We detected consistent growth declines and increased drought sensitivity in Atlas cedar across all sites since the early 1980s. Specifically, we determined that previous growth rates and tree age were the strongest tree features, while Quercus rotundifolia basal area was the strongest stand structure measure related to Atlas cedar decline. As a result, we suggest that Atlas cedar forests that have experienced severe drought in combination with grazing and logging may be in the process of shifting dominance toward more drought-tolerant species such as Q. rotundifolia.1. Introduction
Climate-related tree decline and mortality is a recurrent phenomenon that has been reported in a variety of forest communities around the world [1-5]. Drought-induced mortality has been noted in forests subjected to severe water deficit, many of which are located in the Mediterranean Basin [6-9]. The common causal factor in these study cases appears to be drought and/or high temperatures, raising the possibility that tree mortality may be occurring in response to ongoing climate warming and drying [10]. Increases in the frequency, duration, and severity of drought and heat stress associated with climate change could substantially alter the composition, structure, and biogeography of forests in many regions [11,12].
Climate change may intensify physiological stress on long-lived woody vegetation, occasionally leading to sudden growth reduction and higher mortality rates [13-16]. Widespread mortality events can transform landscapes at regional scales through local changes in community structure and function [12,17-19]. Moreover, land-cover changes greatly influence surface energy balances and consequently climate [20,21]. Variations in surface-radiation regimes and convective heat, derived from drought-induced tree decline and mortality, can considerably influence local, regional, and ultimately global climatic conditions [22]. Indeed, the effects of land-cover changes have recently been associated with the persistent predictions of warming and drying throughout the Mediterranean Basin [23].
The large-scale control of climate on water availability may also be influenced by stand structure and species composition at the local scale [24], as well as by topography and soil properties [25]. Approaches covering stand structure and climate trends are therefore still needed for an understanding of their implications in forest dynamics. Depending on the structural attributes of a stand (horizontal and vertical structure, density, basal area), similar forest communities might exhibit different responses and ecological thresholds in the face of climate change-induced die-offs. Denser stands normally result in stronger tree-to-tree competition [26] and subsequent self-thinning, which alters, for instance, the soil-water availability per unit of basal area [27,28]. Forest dynamics can also be driven by the frequency and magnitude of droughts, which may kill dominant canopy trees, leading to changes in forest structure, including the regeneration environment [3,16,29]. For instance, gaps created when trees die, promote high light intensity and a more xeric environment in the already drier stands [30]. Moreover, the stand structure of a forest can be changed directly by human-induced perturbations [29,31-33], with significant implications for stand structure and dynamics and ecosystem function [20,23,34].
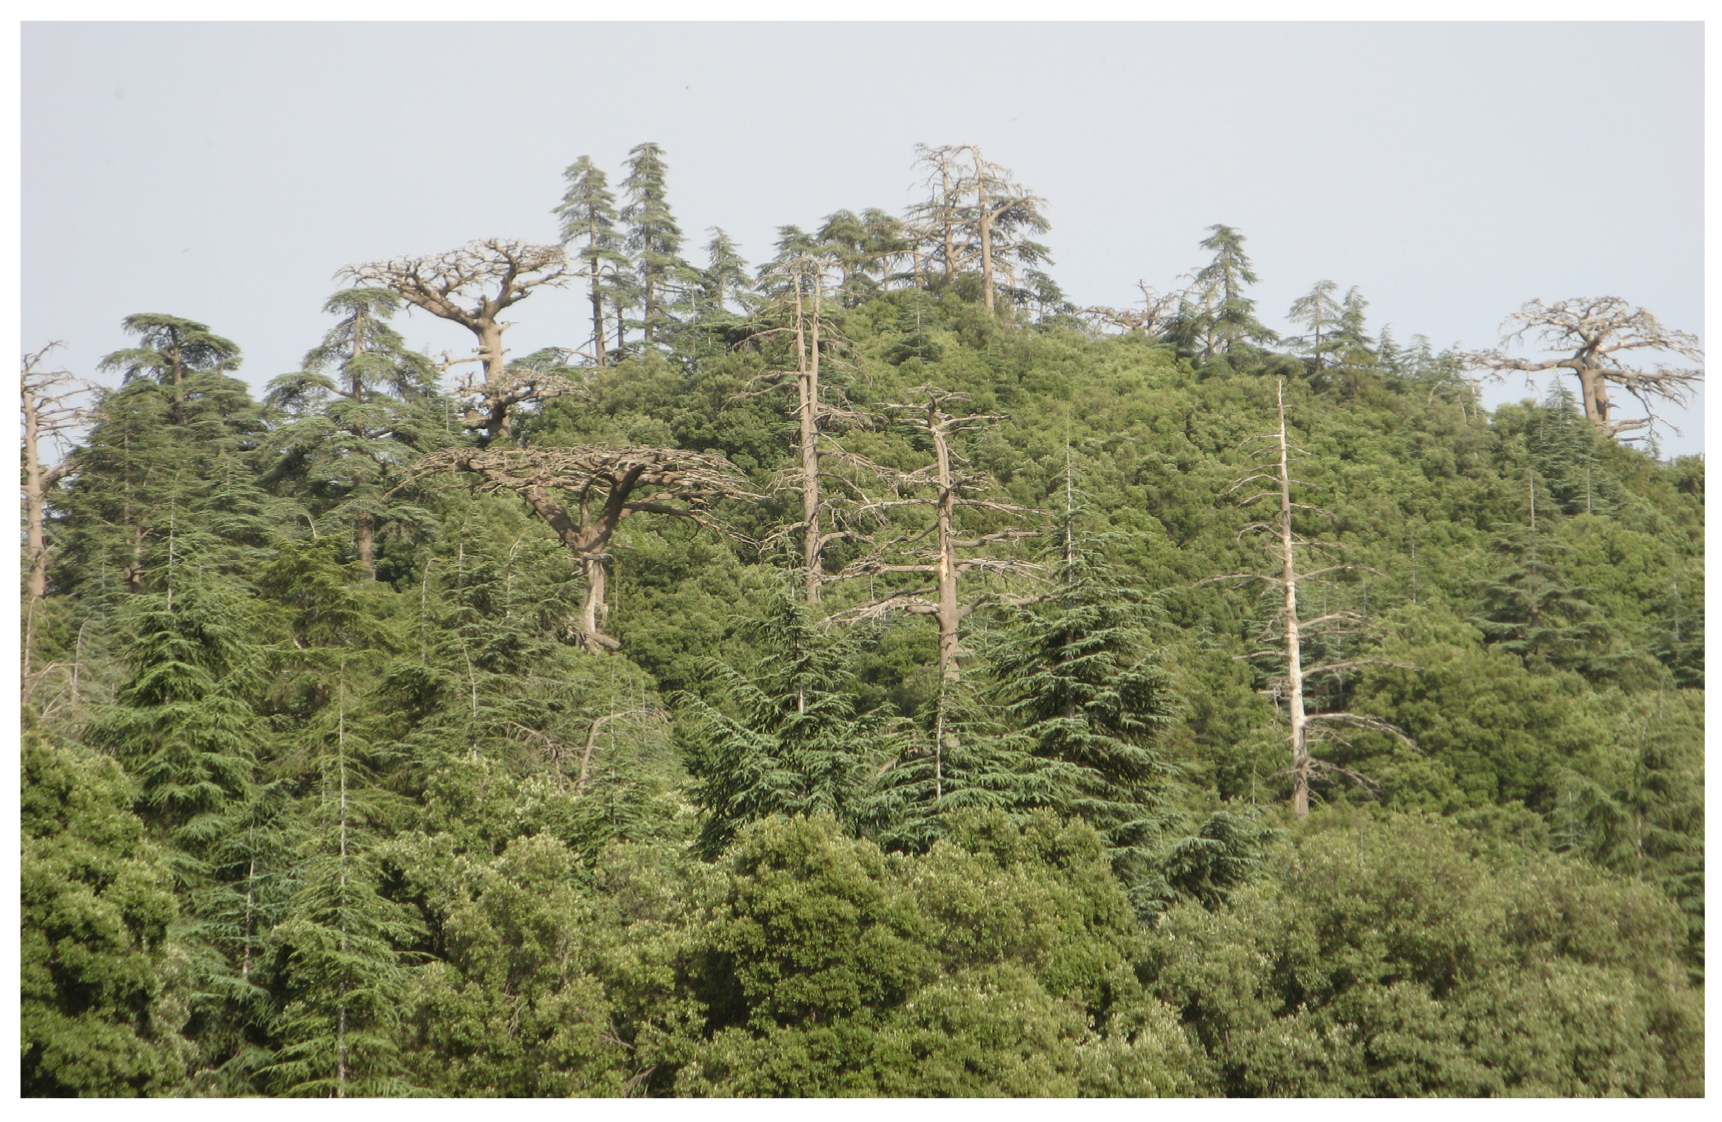
The Atlas cedar (Cedrus atlantica Manetti) is an endemic species of the North African mountains from Morocco and Algeria [35]. Although it has relatively wide tolerances with regard to climate and soil type, Atlas cedar is threatened by climatic change, particularly by the projected temperature increase, which will alter soil-water availability and plant evapotranspiration [36,37]. Since the early 1980s, severe droughts have been related to Atlas cedar decline and mortality [5,38,39], mainly in the drier mountainous areas near the Sahara [40]. In addition to these hypothesized climate-driven factors, human perturbation by overgrazing, logging, pruning of lower branches for livestock winter fodder and firewood have led to soil erosion and degradation of the remaining historic forest, resulting in a loss of natural vegetation cover [41]. Moreover, crown defoliation by processionary caterpillars (Thaumetopoea bonjeani and T. pityocampa), cedar bark stripping by Barbary Macaques (Macaca sylvanus), and damage by cedar bark beetles (Phaenops marmottani) seem to have exacerbated the recent Atlas cedar decline [37,38,42].
In some places, the Atlas cedar mortality appears to take place on dry sites [37,40], affecting mainly old trees. Drought-induced mortality of large trees, as well as the selective logging, pruning and pollarding of these big individuals, trigger the replacement of the original canopy trees by new individuals [31,32,43]. Because altered conditions of light and soil moisture are expected in the gaps caused by tree mortality or logging, compared to canopy conditions, other species with different resource requirements could undergo successful recruitment, with major implications for community biodiversity and dynamics [19,30,34,44,45]. Consistent with this scenario, changes in the regeneration pattern of the natural vegetation associated with high mortality rates of Atlas cedar or intense human perturbation may promote shifts in species composition in these forests.
Although many factors may be involved in the Atlas cedar dieback, in the present study we focus on temperature and precipitation trends, and extreme drought events (inferred from local climate records and regional Palmer Drought Severity Index) and stand-structure features. Here, we use previous growth and defoliation percentage as indicators of impending tree decline and mortality and we quantify the relationships of these response variables with tree age, size, and stand structure. Our specific aims are: (i) to quantify and compare the basal-area increment patterns and drought sensitivity of Atlas cedar in contrasting stands; and (ii) to determine the relative contribution of previous growth, tree age and size, and stand structure to recent Atlas cedar decline in the Middle Atlas (northern Morocco).
2. Materials and Methods
2.1. Natural History and Field Sampling
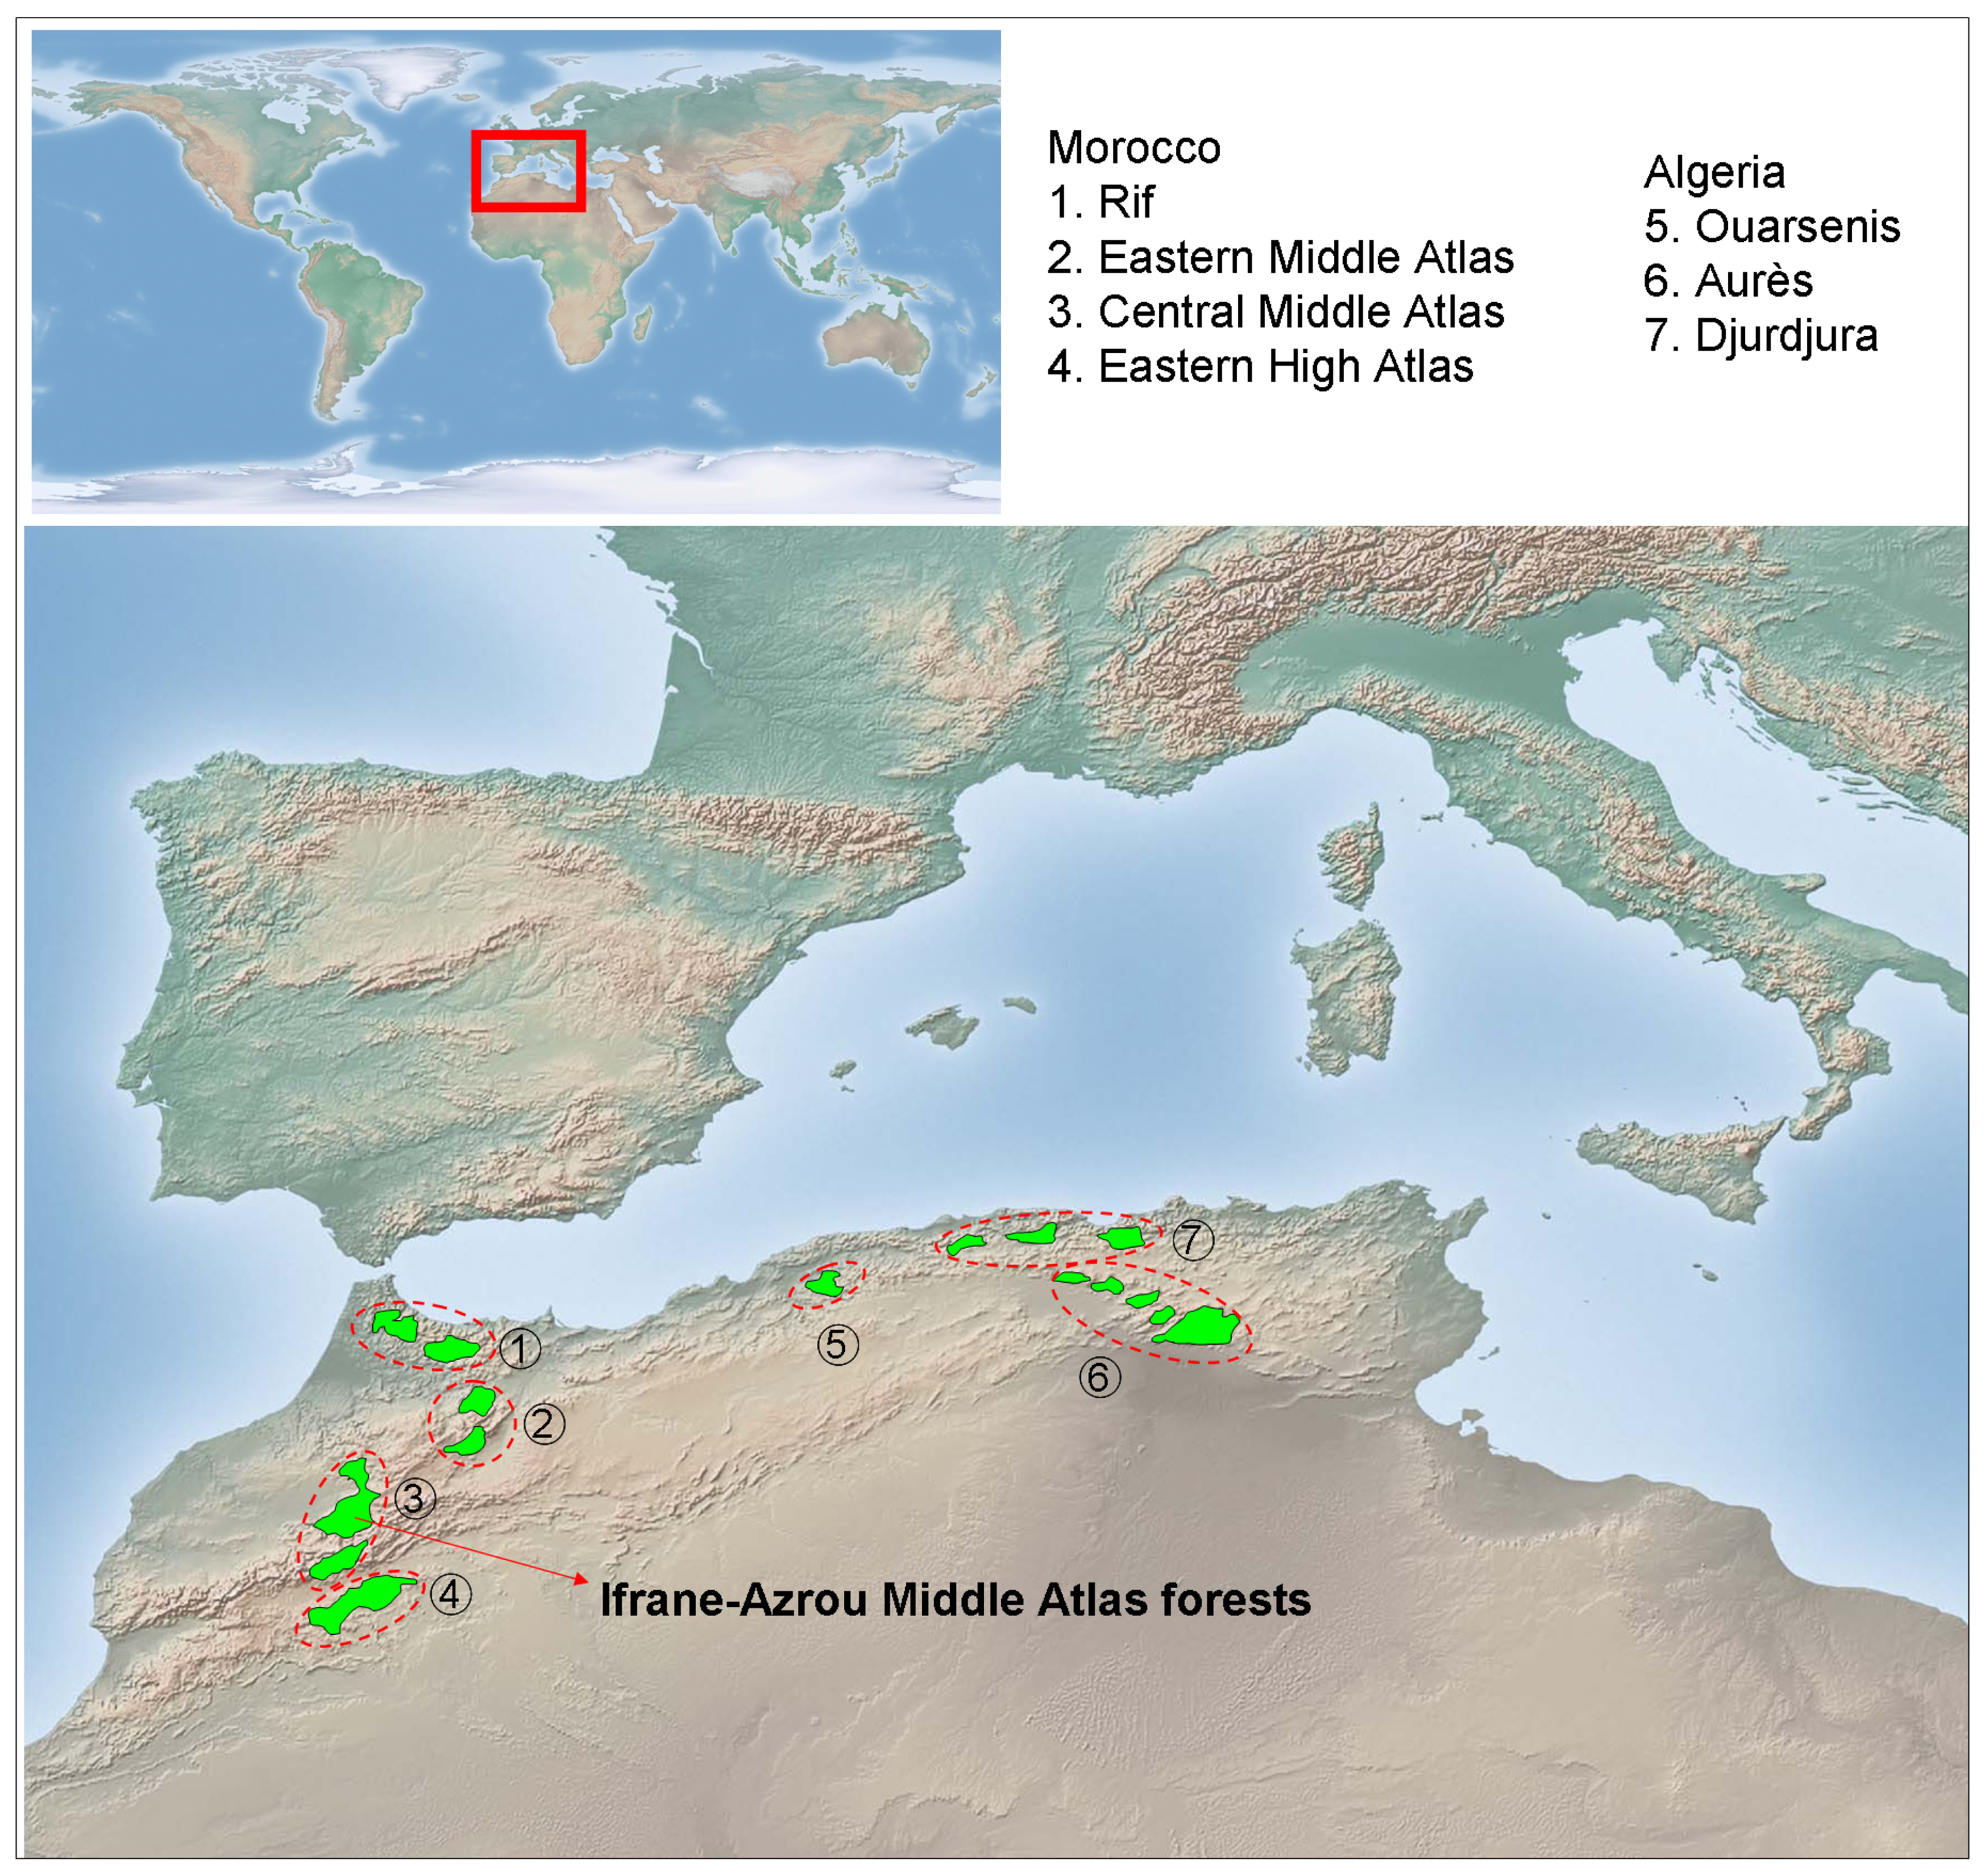
The genus Cedrus may have once been present in coastal mountains of the former Tethys Sea from north-western Africa and southern Europe to western Asia, including the rising Himalayas. The Pleistocene ice ages and emerging deserts isolated the western, central, and eastern populations, leading to speciation and caused the extinction of the genus in Europe. Currently, this genus includes three extant species native from the Mediterranean mountains and one species from the Himalaya: Cedrus atlantica Manetti, from Algeria and Morocco; Cedrus libani Rich., from Asia Minor; Cedrus brevifolia (Hooker fil.) Henry, from Cyprus; and Cedrus deodara Don, from Afghanistan and southern slopes of western Himalaya. The Atlas cedar forests (Figure 1) cover an area of over 130,000 ha [36] distributed in Morocco (Rif, Middle Atlas, and north-eastern High Atlas) and Algeria (Aurès, Belezma, Hodna, Djbel Babor, Djurdjura, Blida and Ouarsenis). Atlas cedar occurs at elevations of 1,300 to 2,600 m a.s.l., where the amount of annual rainfall ranges from 500 to 2,000 mm and the minimum temperature of the coldest month ranges between −1 and −8 °C [35,46]. The Middle Atlas (northern Morocco) contains about 80% of the Atlas cedar forest surface area (ca. 100,000 ha). Middle Atlas cedar forests contain several evergreen (holm oak, Quercus rotundifolia Lam.; prickly juniper, Juniperus oxycedrus L.; European holly, Ilex aquifolium L.) and deciduous (Acer opalus Mill., Crataegus laciniata Ucria) tree and shrub species.
The most abundant tree species in the stands studied was Q. rotundifolia, mostly regenerated as sprouts which were distinguishable from seedlings because they lacked scars of cotyledonary leaves. In this region, the Atlas cedar mortality appears to be taking place mainly in old trees on dry sites such as steep slopes with southern exposure and rocky soils [37].
The study was conducted during 2009 and 2010 in Atlas cedar stands located at the Ifrane-Azrou Atlas cedar forests (Ifrane National Park, northern Morocco; Figure 1). For the description and quantification of the stand structure and spatial patterns of Atlas cedar, four study plots with contrasting structure and composition were selected based on an extensive field survey (area delimited by the coordinates latitude 33°24′40″−33°24′60″N; longitude 5°03′00″−5°08′40″W; elevation range 1,830−1,890 m a.s.l.). We sampled two plots in old growth stands, apparently subjected to intense logging and grazing (thereafter plots M. ATLAS 1 and 2) and two plots composed by an agradative closed canopy, apparently subjected to lower perturbation regimes (thereafter plots M. ATLAS 3 and 4). We avoided sampling stands with very high Atlas cedar mortality due to difficulties in obtaining and cross-dating wood cores from dead trees. Within each plot (ca. 0.13 ha in size; located about 1 km apart from each other), all trees with a diameter greater than 3 cm at 1.3 m from the base (diameter at breast height; dbh) were identified, tagged, and mapped, and their diameter was measured. All stands were located on limestone substrates.
The tree-to-tree competition intensity (CI) of each tree cored for dendrochronological analyses (focal tree thereafter) was estimated by calculating a distance-dependent competition index that takes into account the number, size, and distance of adjacent trees [47]. The degree of competition experienced by the focal tree (i) was calculated as the sum over all j neighboring trees within a radius R of the quotients between the basal-area ratio BAj/BAi and the distance between the focal tree i and the corresponding neighboring tree j (distij). The threshold radius above which neighbors were regarded as not competing was 8 m (see [26]).
2.2. Climate Data
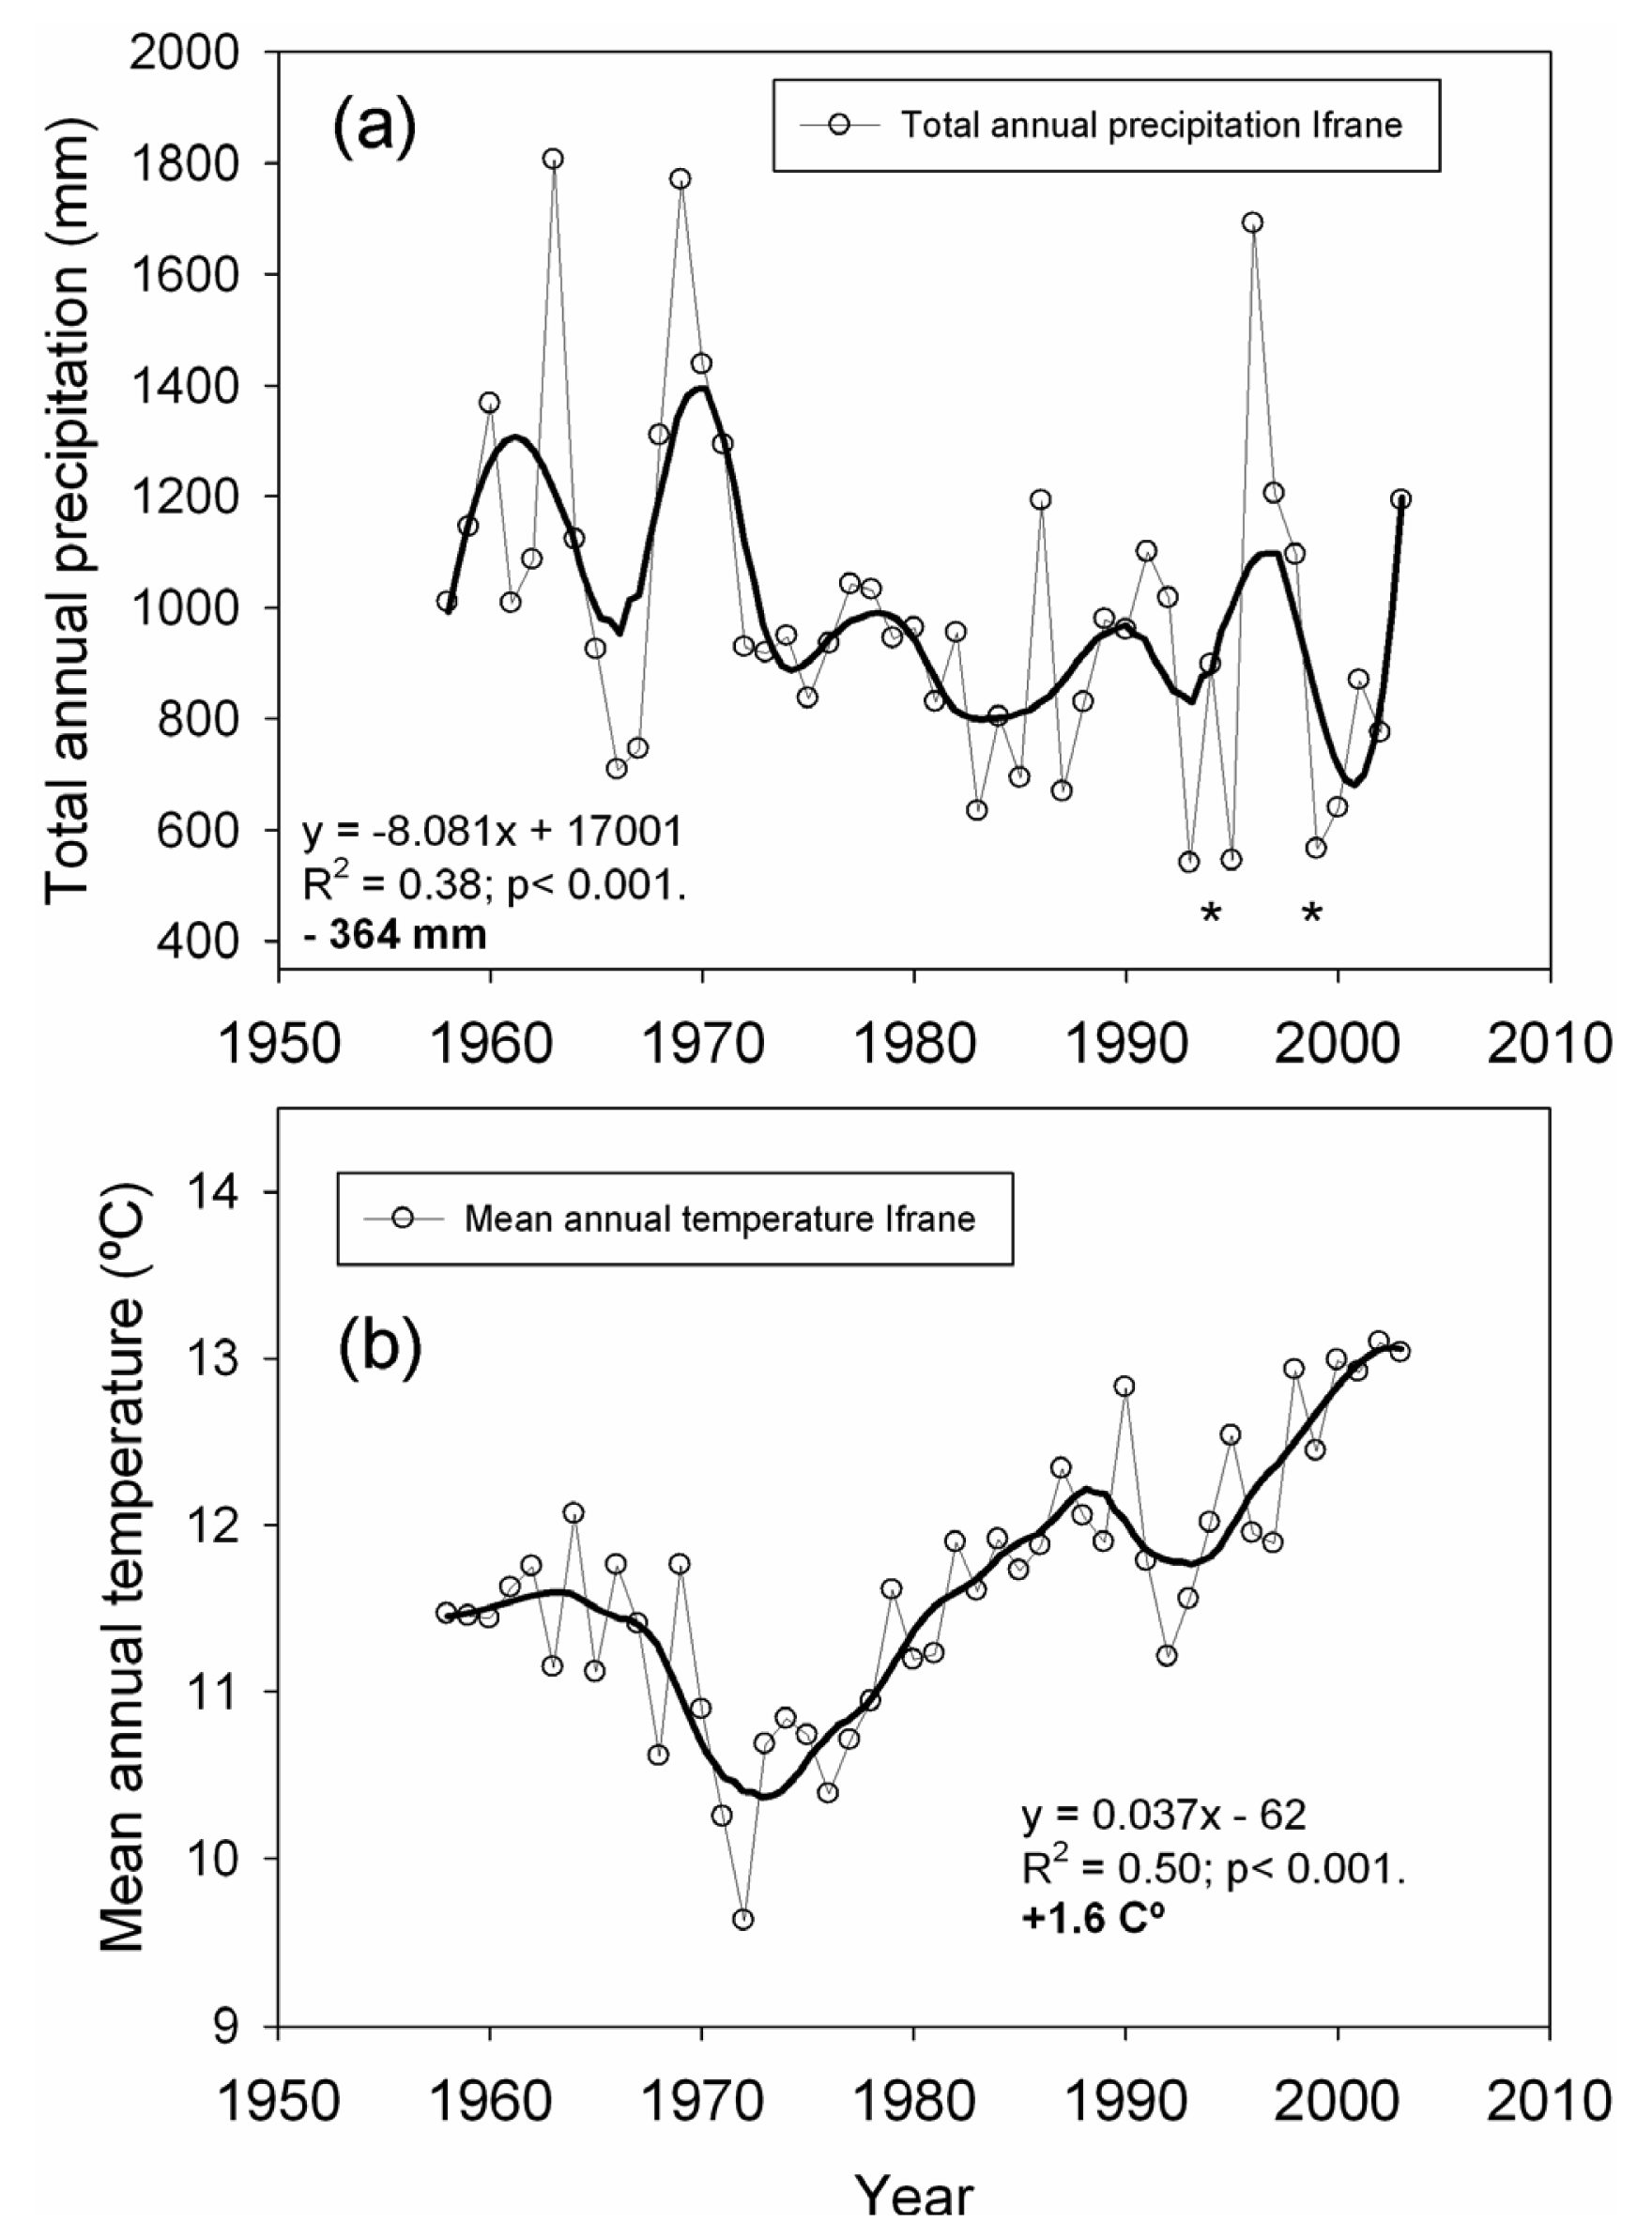
We used local climatic data (annual and monthly mean temperature and total precipitation) from the Ifrane meteorological station located 14 km from the studied plots (33°32′N, 5°07′W, 1,630 m, period 1958–2003) in order to quantify temperature and precipitation trends over the second half of the 20th century. We also used these data to identify extreme drought events, defined as years with total precipitation at least two standard deviations below the mean [9]. For the estimation of long-term trends, the raw climatic data were smoothed by polynomial regression and weights computed from the Gaussian density function (LOESS). Trends were then estimated over the smoothed series by least-squares linear regression, as well as the average slope per decade [9,48].
2.3. Dendrochronology and Drought Sensitivity
To quantify the growth patterns of Atlas cedar trees, we randomly selected five to ten dominant and co-dominant trees per plot (a total of 32 trees were sampled; 10, 5, 9, 8 trees for plots 1, 2, 3 and 4, respectively) and took two to three cores at breast height (1.3 m) on the cross-slope sides of the trunk using a Pressler increment borer. Most cedars were cored with a borer 40 cm long, but a 60 cm length borer was used for large trees. All cored trees were examined for symptoms corresponding to crown defoliation (expressed as percentage of total crown), presence of processionary caterpillar, bark stripping by Barbary Macaques, and the presence of bark beetles. Sampling included only living trees, both healthy (defoliation lower than 50%) and declining trees (defoliation greater than 50%, abundant dead branches, abundant brown and red needles), throughout the size (dbh) range of dominant and co-dominant trees in each plot.
All cores were sanded until tree rings were clearly visible under a binocular microscope and samples were visually cross-dated. Tree-ring widths were measured to the nearest 0.001 mm using a LINTAB measuring device (F. Rinntech, Heidelberg, Germany), and cross-dating quality was checked using COFECHA [49]. The trend due to the geometrical constraint of adding a volume of wood to a stem of increasing radius was corrected by converting tree-ring widths into basal area increments (BAI).
When a wood core did not reach the pith, we calculated basal area increment values as follows: first, we calculated the tree stem radius (Rad) from its perimeter value (Per) measured at 1.3 m from the base, as Rad = Per/2π; then, we obtained the radius inside bark (RadIB) as the difference between Rad and the bark thickness measured in the field. The difference between RadIB and the core length (CL) gives the radius of the stem just prior to the formation of the first tree-ring captured by the borer. Thus, the stem basal area at that time (BA0) can be estimated as:
The stem basal area by the end of the following year (the year of formation of the oldest tree-ring in the core) can be calculated as:
where TRW1 is the measured width of the oldest ring in the core. Therefore, the first basal area increment value in our time series is:
BAI1= BA1 − BA0 = π × (RadIB − CL + TRW1)2 − π × (RadIB − CL)2; the second one is:
BAI2 = BA2 − BAI1 = π × (RadIB − CL + TRW1 + TRW2)2 − π × (RadIB − CL + TRW1)2,
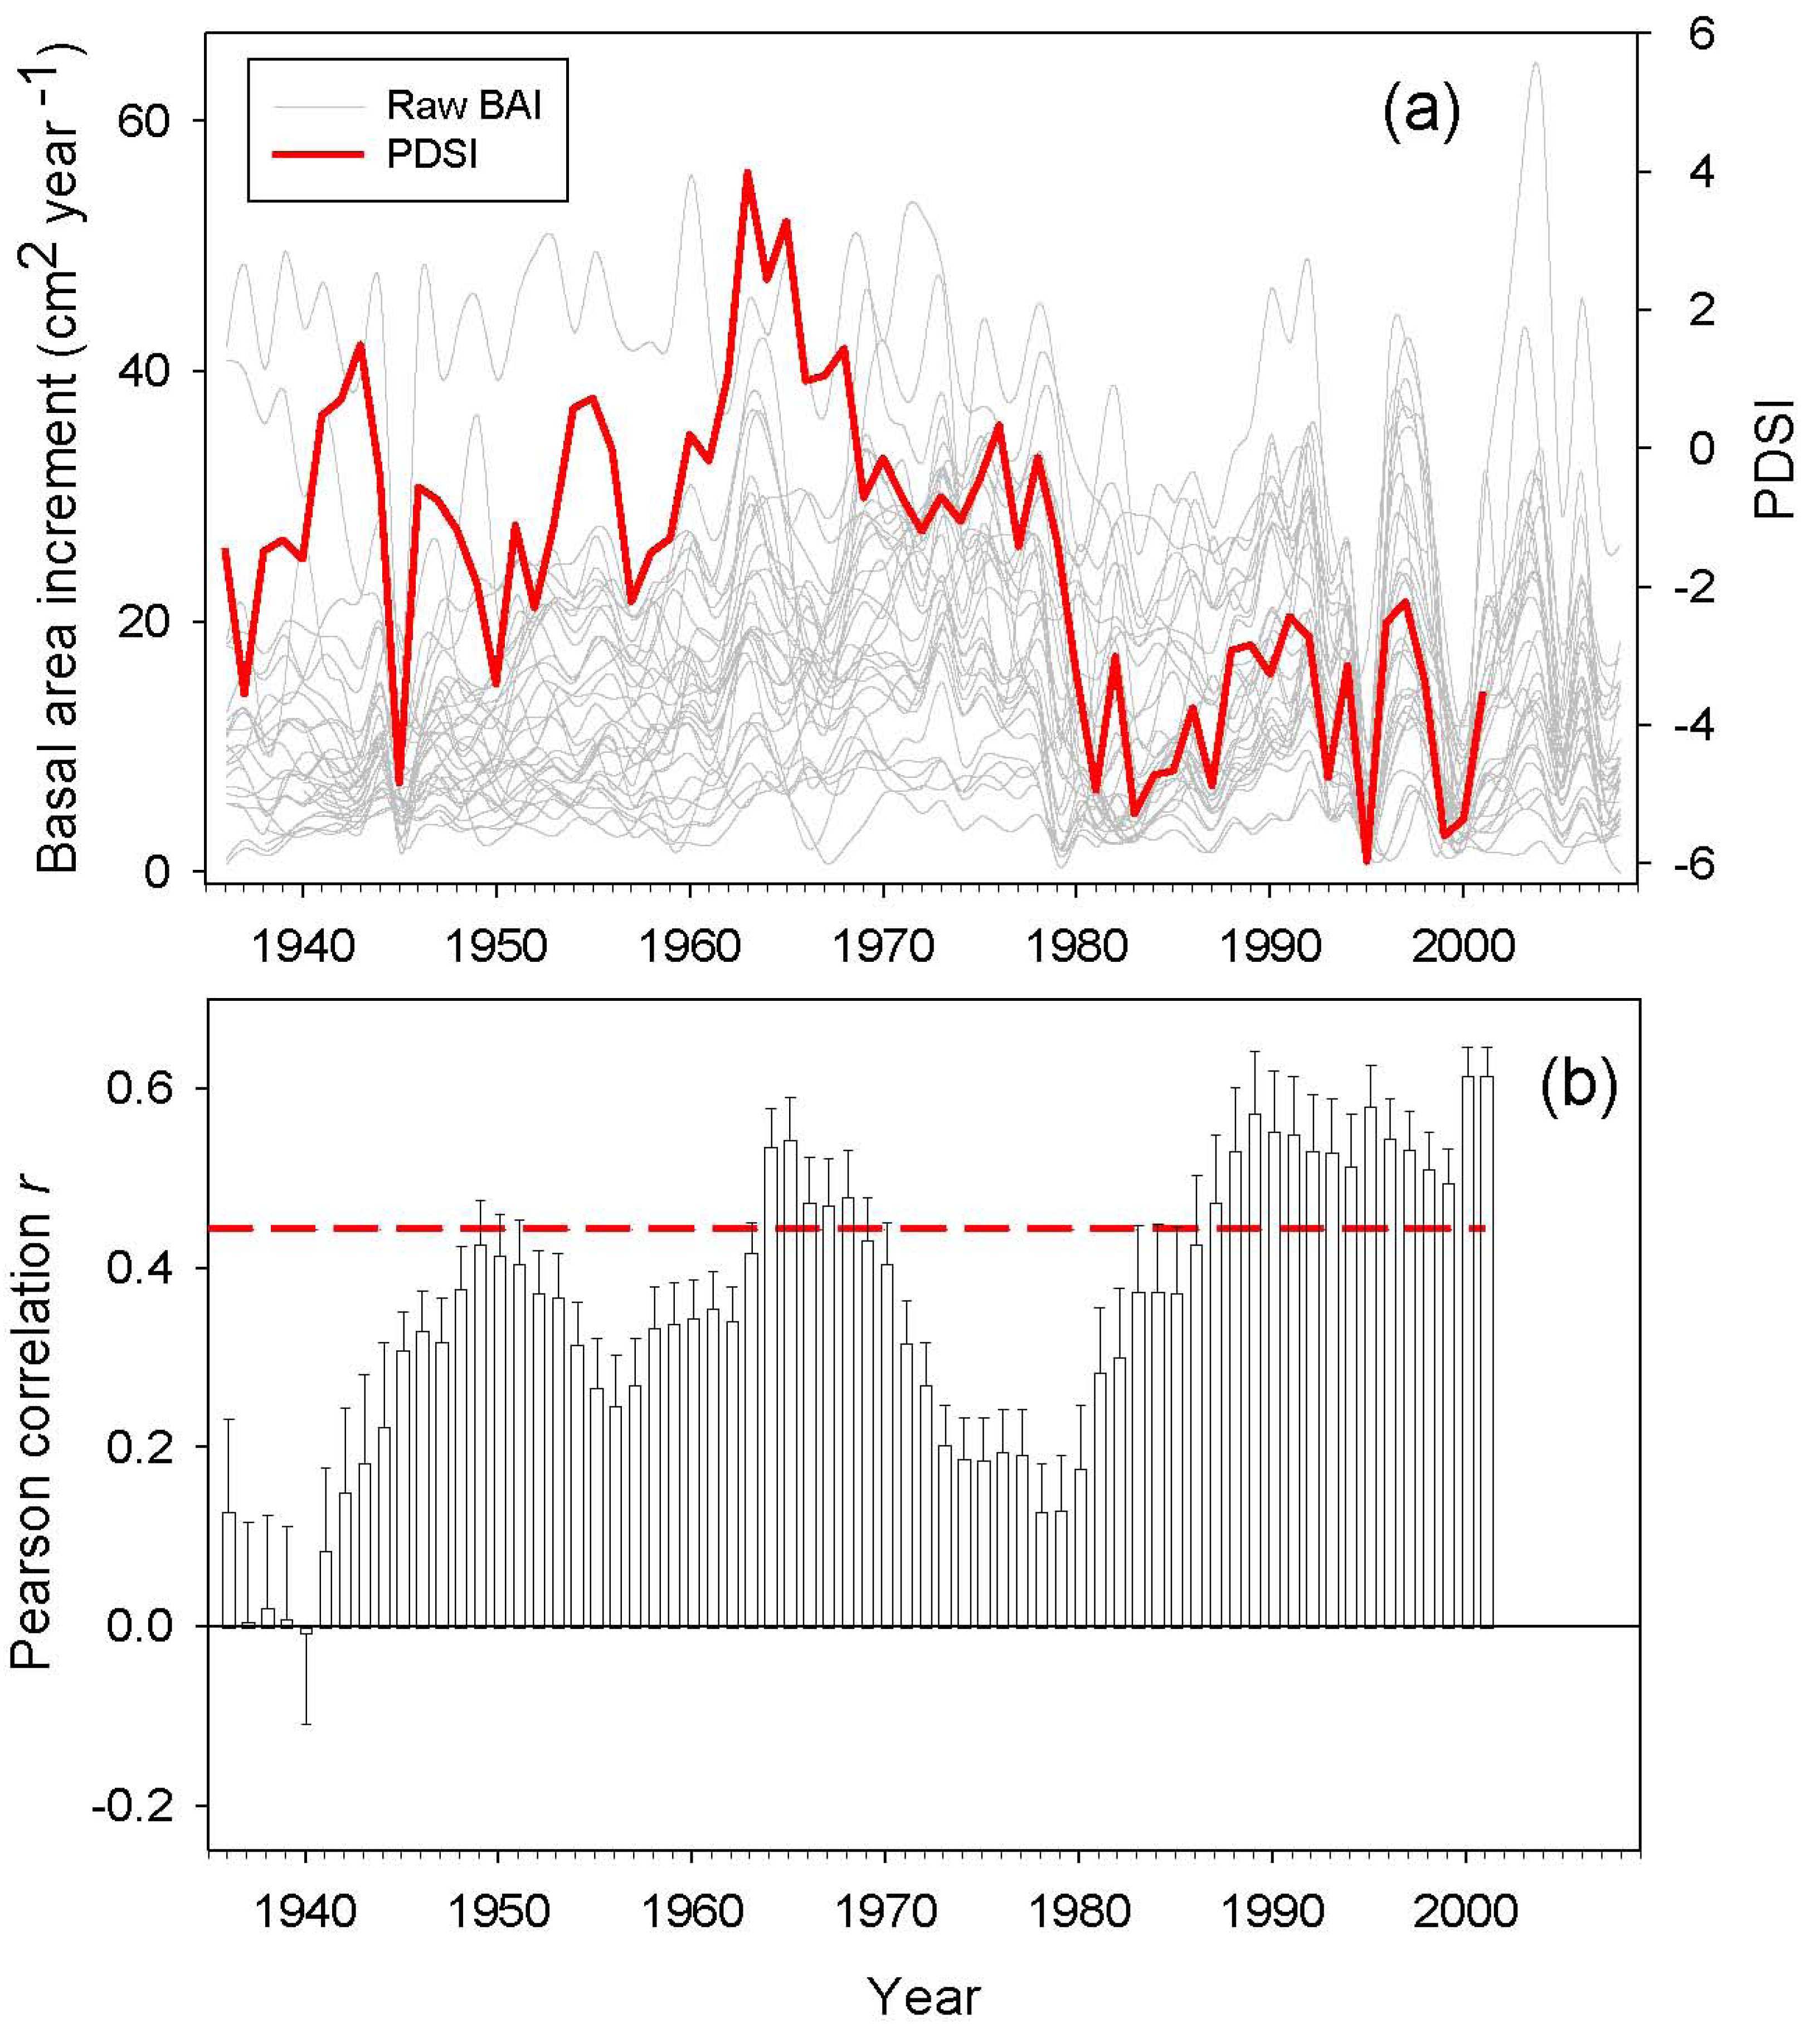
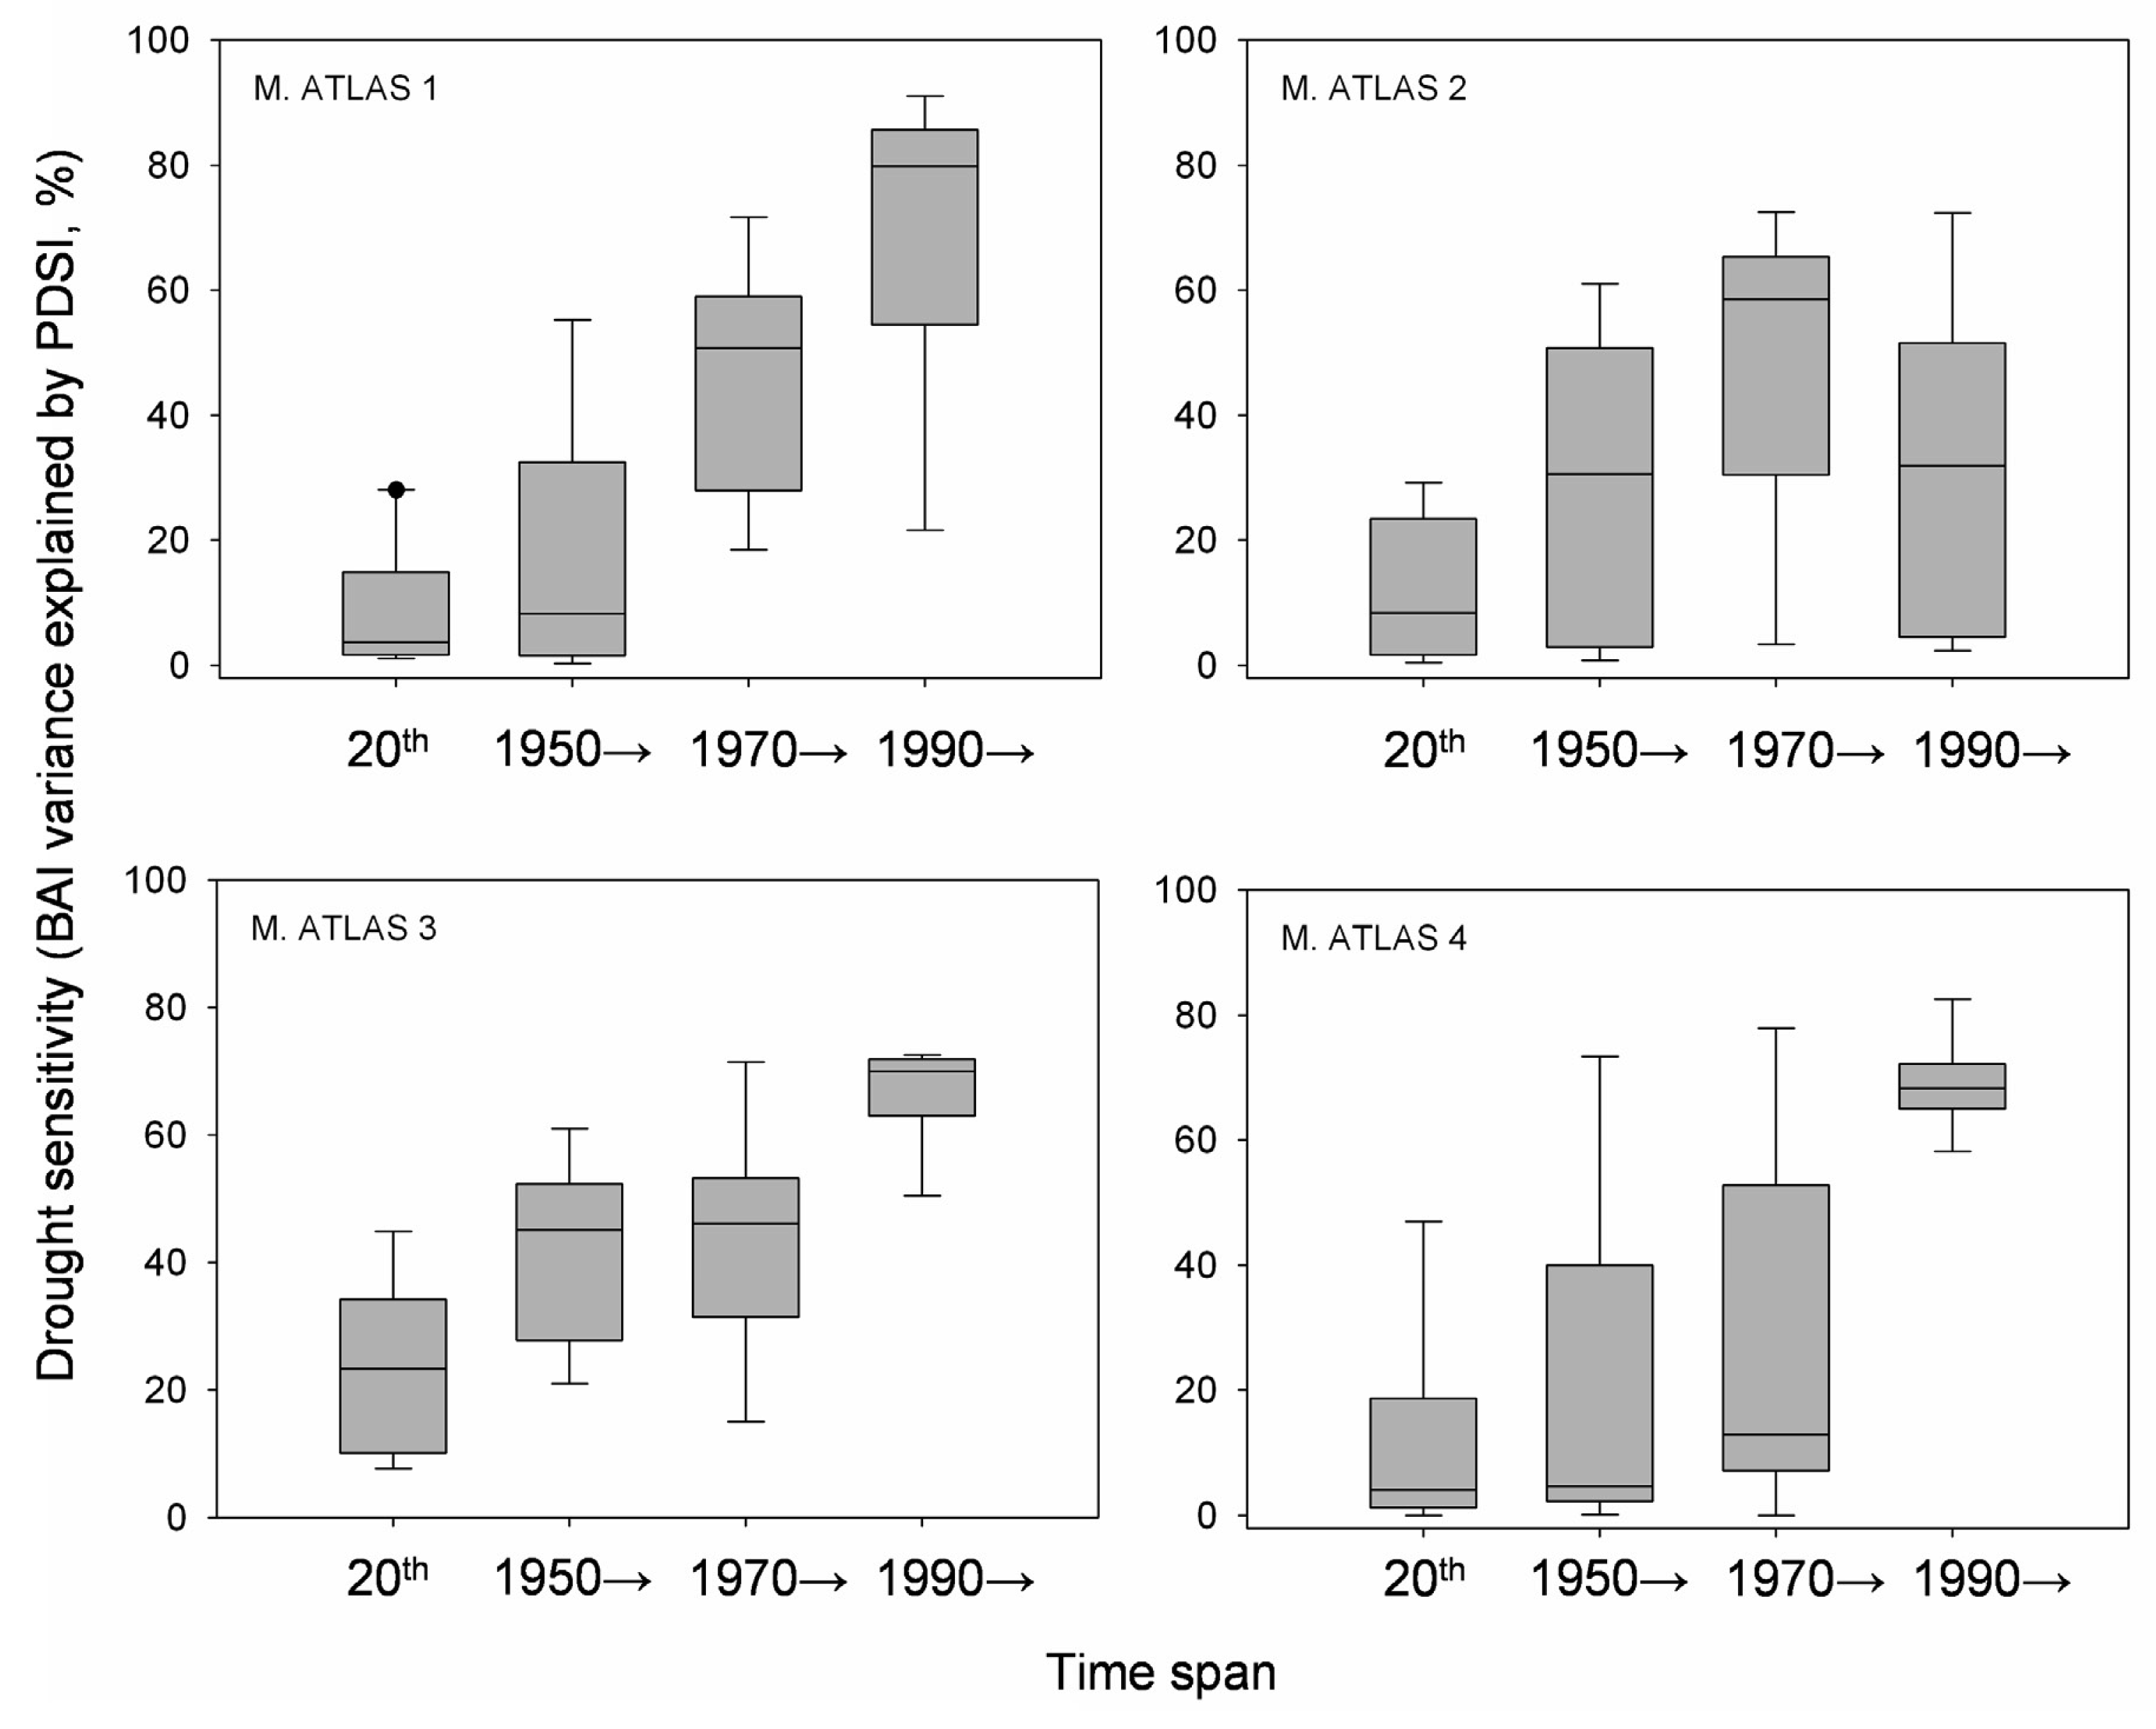
BAI trends were calculated for different time periods by least-squares linear regression [9]. Drought sensitivity was defined as the BAI variance explained by the Palmer Drought Severity Index (PDSI). We used the PDSI reconstructed by Esper et al. (2007) for the same study area [50]. We expected a high correlation between the PDSI and BAI data, since PDSI was reconstructed using as a proxy Atlas cedar tree-ring widths. However, Esper et al. (2007) focused on old growth cedar trees and used standardized chronologies [50], while the present study sampled dominant and co-dominant trees and used raw BAI data. Based on this difference, it would be expected to obtain contrasting correlations. Therefore, we assumed that those periods when the correlations between PDSI and BAI are low may correspond to growth suppressions or releases induced by local non-climatic perturbations, such as human logging and pruning, and/or insect outbreaks. Correlations analyses were performed for the following time spans: the entire 20th century, the second half of the 20th century, the period 1970–2009, and the period 1990–2009.
2.4. Variance Partitioning for Recent Growth Rate and Defoliation
To disentangle the relative contribution of tree features and stand structure to the recent Atlas cedar growth trends and decline symptoms (defoliation) we conducted a partial redundancy analysis (pRDA; see [48]. The mean 1990 to 2009 BAI of each cored tree and the canopy defoliation (%) were included in the RDA as response variables. The explanatory variables were divided into two groups: (1) tree features, which included the tree age at coring height; tree dbh; tree basal area; and mean BAI for the 1900–1990 span, as an indicator of long-term tree growth rate; (2) stand structure-related variables, which included the competition index; the surrounding basal area of neighboring (within a 8 m radius) living cedar trees; the surrounding basal area of living holm oak (Q. rotundifolia) trees; and the surrounding basal area of cut stumps; the latter was used as an indicator of human logging intensity.
Variance partitioning was performed to determine the total variance explained, the pure tree features effects, the pure stand structure effects, the shared effects of both groups and the amount of residual variation. We then followed a sequence of steps for variance partitioning in RDA: first, we applied an RDA on the response variables against tree features and stand structure together; second, we applied an RDA on the response variables against tree features alone; third, we applied an RDA on the response variables against stand structure alone; fourth, we applied a partial RDA on the response variables against tree features, using stand structure as covariates; and fifth, we applied a partial RDA on the response variables against stand structure, using tree features as covariates. Using the total sum of canonical eigenvalues of each RDA analysis (which is similar to R2 in regression), the pure tree and stand structure effects, the shared information and the residual variation can all be explained as a percentage of the total inertia (variation).
Finally, to test which of the single explanatory variables was the most important, we performed a forward selection in the partial RDAs. For these, the sum of all canonical eigenvalues was used as a tool to assess the marginal effects (i.e., how well does a specific selection of explanatory variables explains the variance) for mean 1990–2009 BAI and the defoliation percentage of each cored tree. RDA was implemented using the Brodgar v2.4.1 statistical package (Highland Statistics Ltd., Newburgh, UK).
3. Results
3.1. Climate Trends
Linear regression analysis performed over the smoothed series for total annual precipitation showed a significant negative trend (−364 mm on average for the 1958–2003 span; Figure 2), which represents an approximate 28% reduction in the total annual precipitation. The greatest precipitation decrease was found in early spring (March and April, data not shown). The strength of the extreme drought events worsened towards the last decades of the 20th century (Figure 2). Drought events registered in 1993, 1995 and 1999 represent the lowest annual precipitation recorded for the second half of the 20th century. Linear regression analyses performed over the smoothed series for mean annual temperature showed a total increase of +1.6 °C, in which the highest temperature increases were observed from March to June (data not shown).
3.2. Stand Structure and Composition and Mean Growth
The agradative stands (plots M. ATLAS 3 and 4) were dominated by living Atlas cedar trees with mean dbh between 10 and 20 cm and scattered large trees at very low density. Living holm oak and prickly juniper (J. oxycedrus) showed higher values of the basal area in the plot selected in old-growth open stand (plot 2), which showed smaller living cedar basal area (Figure 3; Table 1) and presented cut cedar stumps of large diameter, although this plot had the lowest stump density. Deciduous tree species (A. opalus, C. laciniata) had an overall low density and were small trees with diameters of less than 10 cm thick. Dead Atlas cedars were mainly trees of dbh between 6 and 10 cm, and they were more abundant in the stands with high cedar density (plots 3 and 4) than elsewhere.
Within the cored trees the higher values of competition index were found in the stands with higher cedar density (about 1,100 trees per hectare) and lower mean age at coring height (Table 2). These stands composed by a closed cedar trees canopy had the lower density of holm oak. In contrast, the open stand (plot M. ATLAS 2), composed of isolated old trees and large cut stumps of Atlas cedar, showed the higher density of holm oak (Table 1).
3.3. BAI Trends and Drought Sensitivity
Annual BAI data for the study area showed both growth releases (1990, 1996 and 2003) and years characterized by sudden growth reductions (1985, 1994 and 1999) superimposed over a long-term declining trend from the onset of the 1980s onwards (Figure 4). Correlations between BAI and PDSI over a 20 year span was significant for two time periods located around the middle 1940s and from the beginning of the 1980s onwards. The studied trees showed increasing drought sensitivity throughout the 20th century, having the highest correlations between the PDSI and the BAI from 1990 onwards (Figure 5). However, plot M. ATLAS 2 deviated from this pattern of increasing drought sensitivity over time, since there from 1990 onwards the correlation between PDSI and BAI decreased.
3.4. RDA and Partial RDA Analyses
Results of RDA and partial RDA analyses for tree features and stand structure as explanatory variables of 1990–2009 mean BAI and tree defoliation appear in Table 3. The pure tree-features effect was equal to 33.1% of the variation, while the variance accounted for by stand structure-related variables was 5.8% (Table 4). The shared amount of variation was 19.4%, indicating that tree variables strongly covary with stand-structure variables. Variance decomposition indicated that tree age and tree mean growth had a greater effect on BAI and defoliation than stand structure.
The mean 20th-century BAI accounted for 14.7% of the variance and was positively related to the mean 1990–2009 BAI and negatively related to the percentage of defoliation of the studied trees. Tree age accounted for 13.5% of the variance and was negatively related to the mean 1990–2009 BAI and positively related to defoliation (Table 5). When the effects of tree variables were removed (see the variance partitioning procedure at material and methods section), the surrounding living holm oak trees basal area was negatively correlated to recent Atlas cedar BAI, providing a marginally significant effect (Table 5). In contrast, cedar and stumps neighborhoods and competition index were not significant. Both tree age and mean 20th century BAI showed a highly significant effect when they were included in the model, which indicates that old trees (independently of the mean growth rate) and trees with low mean growth rate (independent of the age) had the maximum likelihood of decline.
4. Discussion
4.1. Climatic Induction of Atlas Cedar Forest Decline
Our results support the contention that rising spring-to-summer temperatures and decreasing rainfall from winter to early summer will magnify Atlas cedar drought stress and growth decline [39,50-52]. Dendroclimatic reconstructions of drought in North Africa confirm that during the early 2000s this area experienced the most severe droughts since at least the middle of the 15th century [53]. Such retrospective assessment based on tree-ring Atlas cedar chronologies is also consistent with climate data and model projections which respectively indicate and forecast a trend of increasing aridity in the Mediterranean Basin for the past and current centuries [54-56].
Significant radial-growth reductions in response to severe droughts have been reported in other Mediterranean mountain conifers. Climate warming and increasing water stress appear to be the main causes of growth decline in Pinus sylvestris [57,58], Pinus nigra [9], and Abies alba [59,60] near the southern limit of the species distribution range, and have also caused a severe BAI reduction in the relict fir (A. pinsapo) [61]. Climatic stress influences tree physiological status and may determine whether a tree can withstand, for instance, severe defoliations or bark stripping by Barbary Macaques. In turn, climate change appears to exert a significant effect on herbivore behavior [42,62]. Recently, cedar bark stripping by Barbary Macaques appears to have increased the incidence of decline in some Atlas cedar forests [62]. The Barbary Macaques strip the bark of cedar branches and tree apices in search of water and sugars, particularly as water resources are limited and protected from monkeys [42]. In the studied stands, we detected no significant bark stripping, although previous researchers have suggested that water scarcity and monkey exclusion from previously available permanent water sources are linked to intense cedar bark-stripping behavior by Barbary Macaques [42,62,63]. This fact increases the complexity of the multifactorial Atlas cedar decline, since Barbary Macaques are a protected species and a major faunal component of Atlas cedar forests and a valuable tourist attraction [64].
4.2. Potential Vegetation Shifts in Declining Atlas Cedar Forests
In the Mediterranean Basin, human demographic pressure and livestock grazing have widely disturbed the main forest ecosystems which show a continual regression in terms of surface area in the most xeric areas [41]. The Atlas cedar forests of the Middle Atlas in Morocco have been severely affected by drought, by overgrazing involving mixed herds of goat and sheep, as well as by excessive logging for timber, firewood, and livestock fodder [64]. Human disturbances have strongly altered Atlas cedar forest structure and holm oak stand densities, which were formerly coppiced through frequent cutting cycles, and the resulting open areas serve for grazing (see holm oak and stump basal area in Table 1). Ongoing decline of open Atlas cedar stands in intensively logged and overgrazed areas are leading to their replacement by holm oak and prickly juniper. High-frequency cutting and worsening drought could be encouraging the extension of high-density holm oak coppices and decline of the Atlas cedar overstory (Figure 3). Further exclusion of cedar regeneration by more competitive oak seedlings and the replacement of this conifer by this and other angiosperm species with a more efficient hydraulic system might accelerate the postulated vegetation shift [12].
Atlas cedar decline symptoms have attracted attention mainly in 2001 but records go back several decades to the 1940s when a severe drought caused death of the cedars presumably with a comparable dieback extent [37,40,64]. In our study area, an estimated 23% of the Atlas forest surface area (3,400 of 15,000 hectares) showed some decline symptoms after the 1999–2000 drought events [64]. Many factors may be involved in this decline episode such as drought and high-temperature extremes, silvicultural practices, overgrazing, removal of lower branches for winter fodder, and pests and disease [37]. In the Moroccan Middle Atlas, the cedar decline seems to occur mainly in old trees. However, the Atlas cedar mortality pattern appeared highly heterogeneous, showing both clumped and scattered spatial patterns, and trees located near declining individuals frequently exhibited no symptoms.
4.3. Potential Carbon and Water Cycles Changes in Declining Atlas Cedar Forests
The decline of the Atlas cedar forests in the Middle Atlas could affect both carbon and water cycles at a regional scale. Successive replacement of cedars and deciduous drought-vulnerable tree species by better drought-adapted evergreen species could cause a reduction in net primary production, because the Atlas cedar is the species that reaches the greatest biomass in the Middle Atlas forests [37]. Decline and mortality imply a net input of organic carbon to the soil, which could enhance the soil heterotrophic respiration and the decomposition of organic matter, thus increasing carbon emissions [65]. Total evapotranspiration may be higher in heavily logged and overgrazed open stands than in the closed cedar forest during the summer months, as a result of higher soil and air temperatures, and greater vapor pressure deficits in the open canopies [24,66]. Available soil moisture should in addition become limited by the erosion losses of the upper organic soil layer, after the taller trees were felled for timber, or killed by severe drought events [12].
We hypothesized that heavily logged and overgrazed stands would show stronger Atlas cedar growth decline in response to climate stress. However, stand structure alone does not explain the differences in BAI decline with increasing climate stress. Our results suggest that Atlas cedar growth decline is induced mainly by recent climate change [67,68], with tree age and prior growth rate playing the role of a predisposing decline factor. However, human logging seems to promote the replacement of the closed cedar forest by open mixed stands dominated by cedar and holm oak.


| Plot | M. ATLAS 1 | M. ATLAS 2 | M. ATLAS 3 | M. ATLAS 4 | |||||||||
|---|---|---|---|---|---|---|---|---|---|---|---|---|---|
| Species | Living | Dead | Stump | Living | Dead | Stump | Living | Dead | Stump | Living | Dead | Stump | |
| Cedrus atlantica | Mean dbh (cm) | 21.9 | 10.5 | 13.5 | 20.6 | 8.0 | 33.6 | 19.2 | 6.1 | 8.5 | 19.1 | 5.9 | 14.0 |
| Basal area (m2ha−1) | 40.13 | 0.65 | 2.91 | 12.69 | 0.07 | 18.08 | 36.75 | 0.37 | 2.78 | 60.01 | 0.46 | 23.15 | |
| Density (trees ha−1) | 538 | 35 | 191 | 197 | 14 | 70 | 1048 | 95 | 422 | 1153 | 125 | 679 | |
| Quercus rotundifolia | Mean dbh (cm) | 5.3 | 9.0 | 10.5 | 9.0 | 37.8 | 10.5 | 14.0 | 11.8 | − | 13.3 | 0.0 | 17.7 |
| Basal area (m2ha−1) | 2.36 | 0.04 | 0.06 | 16.94 | 2.18 | 0.06 | 4.36 | 0.38 | − | 1.82 | 0.00 | 0.46 | |
| Density (trees ha−1) | 969 | 7 | 7 | 1296 | 14 | 7 | 238 | 27 | − | 87 | 0 | 19 | |
| Total | Others tree species | Acer opalus, Juniperus oxycedrus | Acer opalus, Juniperus oxycedrus | Acer opalus, Ilex aquifolium, Crataegus laciniata | Juniperus oxycedrus, Ilex aquifolium | ||||||||
| Basal area (m2ha−1) | 42.9 | 0.7 | 3.0 | 30.0 | 2.3 | 18.1 | 41.2 | 0.8 | 2.8 | 61.9 | 0.5 | 23.6 | |
| Density (trees ha−1) | 1592 | 49 | 205 | 1528 | 28 | 77 | 1327 | 122 | 436 | 1315 | 125 | 698 | |
| Plot | M. ATLAS 1 | M. ATLAS 2 | M. ATLAS 3 | M. ATLAS 4 |
|---|---|---|---|---|
| Competition Index | 0.94 ± 0.25 a | 1.18 ± 0.33 a | 3.24 ± 1.01 b | 3.93 ± 0.58 b |
| DBH of cored trees (cm) | 57 ± 17 b | 51 ± 6 b | 34 ± 2 a | 47 ± 6 b |
| Age at DBH of cored trees (years) | 158 ± 53 c | 226 ± 20 c | 84 ± 2 a | 108 ±26 b |
| 20th century BAI (cm2 year−1) | 16.35 ± 2.71 b | 11.32 ± 1.68 a | 12.78 ± 1.69 a | 19.05 ± 2.04 b |
| 1970–2008 century BAI (cm2 year−1) | 20.14 ± 2.44 b | 11.43 ± 1.84 a | 12.24 ± 1.66 a | 21.76 ± 3.69 b |
| 1990–2008 century BAI (cm2 year−1) | 17.72 ± 2.13b | 9.36 ± 1.26 a | 11.96 ± 1.66 a | 21.67 ± 3.60 b |
| 1970–2008 century BAI trend (cm2 year−2) | −0.33 ± 0.10 b | −0.34 ± 0.10 b | −0.13 ± 0.06 a | −0.06 ± 0.16 a |
| 1990–2008 century BAI trend (cm2 year−2) | −0.49 ± 0.21 b | −0.41 ± 0.22 b | −0.18 ± 0.06 a | −0.25 ± 0.18 a |
| Step | Explanatory variables | Explained variance (%) | ||
|---|---|---|---|---|
| 1 | Tree features and stand structure | 58.24 | ||
| 2 | Tree features | 52.39 | ||
| 3 | Stand structure | 25.16 | ||
| 4 | Tree features with stand structure as covariable | 33.10 | ||
| 5 | Stand structure with tree features as covariable | 5.80 | ||
| Component | Explanatory variables | Explained variance (%) |
|---|---|---|
| A | Tree features | 33.10 |
| B | Stand structure | 5.80 |
| C | Shared (3–5) | 19.36 |
| D | Residual | 41.76 |
| Total | 100 |
| Explanatory variables group | Variable | Eigenvalue using only one explanatory variable | Eigenvalue as % (of sum all eigenvalues) using only one explanatory variable | F | P |
|---|---|---|---|---|---|
| Tree features (X) | Mean growth (20th Century) | 14.7 | 44.41 | 6.7 | 0.004 |
| Tree basal area | 4.9 | 14.8 | 0.39 | 0.66 | |
| Tree age | 13.5 | 40.79 | 10.8 | 0.001 | |
| Stand structure-related variables (W) | Cedar basal area | 1 | 17.24 | 0.12 | 0.877 |
| Holm oak basal area | 3.8 | 65.52 | 2.66 | 0.05 | |
| Stump basal area | 0.9 | 15.52 | 0.91 | 0.414 | |
| Competition index | 0.1 | 1.72 | 0.07 | 0.935 | |
Acknowledgments
J.C. Linares and L. Taïqui received financial support for this work from the Spanish Agency for International Cooperation and Develop (AECID), project A/024752/09. J.C. Linares is grateful to J. A. Carreira, at the University of Jaén, for providing additional support for this work. L. Taïqui is grateful to M. Jabrane at the University of Tetouan and M. Benzyane, ex-Director of the National Centre of Forest Research in Morocco, for providing the climatic data of Ifrane. J. J. Camarero is grateful for the support of ARAID and the Globimed network ( http://www.globimed.net/). We also want to thank four anonymous reviewers for their helpful comments.
References
- Williamson, G.B.; Laurance, W.F.; Oliveira, A.A.; Delamonica, P.; Gascon, C.; Lovejoy, T.E.; Pohl, L. Amazonia tree mortality during the 1997 El Niño drought. Conserv. Biol. 2000, 14, 1538–1542. [Google Scholar]
- Rice, K.J.; Matzner, S.L.; Byer, W.; Brown, J.R. Patterns of tree dieback in Queensland, Australia: The importance of drought stress and the role of resistance to cavitation. Oecologia 2004, 139, 190–198. [Google Scholar]
- Dobbertin, M. Tree growth as indicator of tree vitality and of tree reaction to environmental stress: A review. Eur. J. Forest Res. 2005, 124, 319–333. [Google Scholar]
- Van Mantgem, P.J.; Stephenson, N.L.; Byrne, J.C.; Daniels, L.D.; Franklin, J.F.; Fulé, P.Z.; Harmon, M.E.; Larson, A.J.; Smith, J.M.; Taylor, A.H.; et al. Widespread increase of tree mortality rates in the western United States. Science 2009, 323, 521–524. [Google Scholar]
- Allen, C.D.; Macalady, A.K.; Chenchouni, H.; Bachelet, D.; McDowell, N.; Vennetier, M.; Kitzberger, T.; Rigling, A.; Breshears, D.D.; Hogg, E.H.; et al. A global overview of drought and heat-induced tree mortality reveals emerging climate change risks for forests. For. Ecol. Manag. 2010, 259, 660–684. [Google Scholar]
- Peñuelas, J.; Lloret, F.; Montoya, R. Severe drought effects on mediterranean woody flora in Spain. For. Sci. 2001, 47, 214–218. [Google Scholar]
- Martínez-Vilalta, J.; Piñol, J. Drought-induced mortality and hydraulic architecture in pine populations of the NE Iberian Peninsula. For. Ecol. Manag. 2002, 161, 247–256. [Google Scholar]
- Sarris, D.; Christodoulakis, D.; Körner, C. Impact of recent climatic change on growth of low elevation eastern Mediterranean forest trees. Clim. Change 2010, 106, 203–223. [Google Scholar]
- Linares, J.C.; Tíscar, P.A. Climate change impacts and vulnerability of the southern populations of Pinus nigra subsp. salzmannii. Tree Physiol. 2010, 30, 795–806. [Google Scholar]
- Boisvenue, C.; Running, S.W. Impacts of climate change on natural forest productivity-evidence since the middle of the 20th century. Glob. Change Biol. 2006, 12, 1–12. [Google Scholar]
- Thuiller, W.; Albert, C.; Araujo, M.B.; Berry, P.M.; Cabeza, M.; Guisan, A.; Hickler, T.; Midgley, G.F.; Paterson, J.; Schurr, F.M.; et al. Predicting global change impacts on plant species’ distributions: Future challenges. Perspect. Plant Ecol. Evol. Syst. 2008, 9, 137–152. [Google Scholar]
- Gonzalez, P.; Neilson, R.P.; Drapek, R.J. Global patterns in the vulnerability of ecosystems to vegetation shifts due to climate change. Glob. Ecol. Biogeogr. 2010, 19, 755–768. [Google Scholar]
- Bigler, C.J.; Gricar, J.; Bugmann, H.; Cufar, K. Growth patterns as indicators of impending tree death in silver fir. For. Ecol. Manag. 2004, 199, 183–190. [Google Scholar]
- Bréda, N.; Huc, R.; Granier, A.; Dreyer, E. Temperate forest trees and stands under severe drought: A review of ecophysiological responses, adaptation processes and long-term consequences. Ann. For. Sci. 2006, 63, 625–644. [Google Scholar]
- Wunder, J.; Reineking, B.; Bigler, C.J.; Bugmann, H. Predicting tree mortality from growth data: How virtual ecologists can help real ecologists. J. Ecol. 2008, 96, 174–187. [Google Scholar]
- McDowell, N.; Allen, C.D.; Marshall, L. Growth, carbon isotope discrimination, and climate-induced mortality across a Pinus ponderosa elevation transect. Glob. Change Biol. 2010, 16, 399–415. [Google Scholar]
- Allen, C.D.; Breshears, D.D. Drought-induced shift of a forest woodland ecotone: Rapid landscape response to climate variation. Proc. Natl. Acad. Sci. USA 1998, 95, 14839–14842. [Google Scholar]
- Aitken, S.N.; Yearman, S.; Holliday, J.A.; Wang, T.; Curtis-McLane, S. Adaptation, migration or extirpation: Climate change outcomes for tree populations. Evol. Appl. 2008, 1, 95–111. [Google Scholar]
- Galiano, L.; Martinez-Vilalta, J.; Lloret, F. Drought-induced multifactor decline of Scots pine in the Pyrenees and potential vegetation change by the expansion of co-occurring oak species. Ecosystems 2010, 13, 978–991. [Google Scholar]
- Pautasso, M.; Dehnen-Schmutz, K.; Holdenrieder, O.; Pietravalle, S.; Salama, N.; Jeger, M.J.; Lange, E.; Hehl-Lange, S. Plant health and global change—Some implications for landscape management. Biol. Rev. 2010, 85, 729–755. [Google Scholar]
- Bala, G.; Caldeira, K.; Wickett, M.; Phillips, T.J.; Lobell, D.B.; Delire, C.; Mirin, A. Combined climate and carbon-cycle effects of large-scale deforestation. Proc. Natl. Acad. Sci. USA 2007, 104, 6550–6555. [Google Scholar]
- Bonan, G.B. Forests and climate change: Forcings, feedbacks, and the climate benefits of forests. Science 2008, 320, 1444–1449. [Google Scholar]
- Rotenberg, E.; Yakir, D. Contribution of semi-arid forests to the climate system. Science 2010, 327, 451–454. [Google Scholar]
- Aussenac, G. Interactions between forest stands and microclimate: Ecophysiological aspects and consequences for silviculture. Ann. For. Sci. 2000, 57, 287–301. [Google Scholar]
- Stephenson, N.L. Climatic control of vegetation distribution: The role of water balance. Am. Nat. 1990, 135, 649–670. [Google Scholar]
- Linares, J.C.; Camarero, J.J.; Carreira, J.A. Competition modulates the adaptation capacity of forests to climatic stress: Insights from recent growth decline and death in relict stands of the Mediterranean fir Abies pinsapo. J. Ecol. 2010, 98, 592–603. [Google Scholar]
- Peet, R.K.; Christensen, N.L. Competition and tree death. BioScience 1987, 37, 586–594. [Google Scholar]
- Kenkel, N.C. Pattern of self-thinning in jack pine: Testing the random mortality hypothesis. Ecology 1988, 69, 1017–1024. [Google Scholar]
- Runkle, J.R. Canopy tree turnover in old-growth mesic forests of Eastern North America—Statistical data included. Ecology 2000, 79, 1768–1780. [Google Scholar]
- Suarez, M.L.; Kitzberger, T. Recruitment patterns following a severe drought: Long-term compositional shifts in Patagonian forests. Can. J. For. Res. 2008, 38, 3002–3010. [Google Scholar]
- Oliver, C.D.; Larson, B.C. Forest Stand Dynamics; McGraw-Hill: New York, NY, USA, 1990; p. 467. [Google Scholar]
- Veblen, T.T. Regeneration dynamics. In Plant Succession: Theory and Prediction; Glenn-Lewin, D.C., Peet, R.K., Veblen, T.T., Eds.; Chapman and Hall: London, UK, 1992; pp. 152–187. [Google Scholar]
- Abrams, M.D.; Orwig, D.A. A 300-year history of disturbance and canopy recruitment for co-occurring white pine and hemlock on the Allegheny Plateau, USA. J. Ecol. 1996, 84, 353–363. [Google Scholar]
- Condit, R. Ecological implications of changes in drought patterns: Shifts in forest composition in Panama. Clim. Change 1998, 39, 413–427. [Google Scholar]
- Benabid, A. Biogéographie phytosociologie et phytodynamique des cédraies de l'Atlas Cedrus atlantica (Manetti). Le cèdre de l'Atlas. Actes du séminaire international sur le cèdre de l'Atlas. Annal. Rech. For. Maroc 1994, 27, 62–76. [Google Scholar]
- Cheddadi, R.; Fady, B.; Françis, L.; Hajar, L.; Suc, J.-P.; Huang, K.; Demateau, M.; Vendramin, G.; Ortu, E. Putative glacial refugia of Cedrus atlantica deduced from quaternary pollen records and modern genetic diversity. J. Biogeogr. 2009, 36, 1361–1371. [Google Scholar]
- Et-tobi, M.; Mhirit, O.; Benzyane, M. Changements climatiques, dégradations et dépérissements: Arguments et nouveaux outils pour une reforme de la sylviculture des cédraies au Maroc. Ann. Rech. For. Maroc 2009, 41, 27–47. [Google Scholar]
- Bentouati, A. La situation du cèdre de l'Atlas en Algérie. Forêt méditerr. 2008, 29, 203–208. [Google Scholar]
- Mokrim, A. Dépérisement du cèdre de l'Atlas: Ambiance climatique et bilan de la croissance radiale. Ann. Rech. For. Maroc 2009, 41, 48–68. [Google Scholar]
- Chenchouni, H.; Abdelkrim, S.B.; Athmane, B. The deterioration of the Atlas Cedar (Cedrus atlantica) in Algeria. Presented at the conference Adaptation of Forests and Forest Management to Changing Climate with Emphasis on Forest Health: A Review of Science, Policies, and Practices, Umeå, Sweden, 25–28 August 2008.
- Barbero, M.; Bonin, G.; Loisel, R.; Quezel, P. Changes and disturbances of forest ecosystems caused by human activities in the western part of the mediterranean basin. Vegetatio 1990, 87, 151–173. [Google Scholar]
- Camperio Ciani, A.; Martinoli, C.; Capiluppi, C.; Arahou, M.; Mouna, M. Effects of water availability and habitat quality on bark-stripping behavior in Barbary macaques. Conserv. Biol. 2001, 15, 259–265. [Google Scholar]
- Ferris-Kaan, R.; Peace, A.J.; Humphrey, J.W. Assessing structural diversity in managed forests. In Assessment of Biodiversity for Improved Forest Planning; Bachmann, P., Kohl, M., Paivinen, R., Eds.; Kluwer Academic Publishers: Dordrecht, The Netherlands, 1998; pp. 331–342. [Google Scholar]
- Slik, J.W.F. El Niño droughts and their effects on tree species composition and diversity in tropical rain forests. Oecologia 2004, 141, 114–120. [Google Scholar]
- Kelly, A.E.; Goulden, M.L. Rapid shifts in plant distribution with recent climate change. Proc. Natl. Acad. Sci. USA 2008, 105, 11823–11826. [Google Scholar]
- Mhirit, O. Le cèdre de l'Atlas (Cedrus atlantica Manetti). Présentation générale et état des connaissances à travers le reseau Silva Mediterranea ‘Le Cèdre'. Le cèdre de l'Atlas. Actes du seminaire international sur le cèdre de l'Atlas. Ann. Rech. For. Maroc 1994, 27, 4–21. [Google Scholar]
- Hegyi, F. A Simulation Model for Managing Jack-Pine Stands. In Growth Models for Tree and Stand Simulation; Fries, J., Ed.; Royal College of Forestry: Stockholm, Sweden, 1974; pp. 74–90. [Google Scholar]
- Zuur, A.F.; Ieno, E.N.; Smith, G.M. Analysing Ecological Data; Springer: New York, NY, USA, 2007; p. 680. [Google Scholar]
- Holmes, R.L. Computer-assisted quality control in tree-ring dating and measurement. Tree-Ring Bull. 1983, 43, 68–78. [Google Scholar]
- Esper, J.; Frank, D.C.; Büntgen, U.; Verstege, A.; Luterbacher, J.; Xoplaki, E. Long-term drought severity variations in Morocco. Geophys. Res. Lett. 2007, 34, L17702. [Google Scholar]
- Till, C.; Guiot, J. Reconstruction of precipitation in Morocco since 1100 AD based on Cedrus atlantica tree-ring widths. Quat. Res. 1999, 33, 337–351. [Google Scholar]
- Touchan, R.; Anchukaitis, K.J.; Meko, D.M.; Attalah, S.; Baisan, C.; Aloui, A. Long term context for recent drought in northwestern Africa. Geophys. Res. Lett. 2008, 35, L13705. [Google Scholar]
- Luterbacher, J.; Dietrich, D.; Xoplaki, E.; Grosjean, M.; Wanner, H. European seasonal and annual temperature variability, trends and extremes since 1500. Science 2004, 303, 1499–1503. [Google Scholar]
- Norrant, C.; Douguédroit, A. Monthly and daily precipitation trends in the Mediterranean (1950–2000). Theor. Appl. Climatol. 2006, 88, 89–106. [Google Scholar]
- Luterbacher, J.; Xoplaki, E.; Casty, C.; Wanner, H.; Pauling, A.; Küttel, M.; Rutishauser, T.; Brönnimann, S.; Fischer, E.; Fleitmann, D.; et al. Mediterranean climate variability over the last centuries: A review. In The Mediterranean Climate: An Overview of the Main Characteristics and Issues; Lionello, P., Malanotte-Rizzoli, P., Boscolo, R., Eds.; Elsevier: Amsterdam, The Netherlands, 2006; pp. 27–148. [Google Scholar]
- Xoplaki, E.; González-Rouco, J.F.; Luterbacher, J.; Wanner, H. Wet season Mediterranean precipitation variability: Influence of large-scale dynamics and trends. Clim. Dyn. 2004, 23, 63–78. [Google Scholar]
- Eilmann, B.; Weber, P.; Rigling, D.; Eckstein, D. Growth reactions of Pinus sylvestris L. and Quercus pubescens Willd. to drought years at a xeric site in Valais, Switzerland. Dendrochronologia 2006, 23, 121–132. [Google Scholar]
- Martínez-Vilalta, J.; López, B.C.; Adell, N.; Badiella, L.; Ninyerola, M. Twentieth century increase of Scots pine radial growth in NE Spain shows strong climate interactions. Glob. Change Biol. 2008, 14, 2868–2881. [Google Scholar]
- Camarero, J.J.; Padró, A.; Martin-Bernal, E.; Gil-Pelegrín, E. Aproximación dendroecológica al decaimiento del abeto (Abies alba Mill.) en el pirineo Aragonés. Montes 2002, 70, 26–33. [Google Scholar]
- Macias, M.; Andreu, L.; Bosch, O.; Camarero, J.J.; Gutiérrez, E. Increasing aridity is enhancing silver fir Abies alba (Mill.) water stress in its south-western distribution limit. Clim. Change 2006, 79, 289–313. [Google Scholar]
- Linares, J.C.; Camarero, J.J.; Carreira, J.A. Interacting effects of climate and forest-cover changes on mortality and growth of the southernmost European fir forests. Glob. Ecol. Biogeogr. 2009, 18, 485–497. [Google Scholar]
- Camperio Ciani, A.; Mouna, M. Human and environmental causes of the rapid decline of the Barbary Macaque in the Middle Atlas of Morocco. In The Barbary Macaque: Biology; Hodges, J.K., Cortes, J., Eds.; Management & Conservation, Nottingham University Press: Nottingham, UK, 2007. [Google Scholar]
- Mehlman, P. Comparative density, demography, and ranging behavior of Barbary macaques (Macaca sylvanus) in marginal and prime conifer habitats. Int. J. Primatol. 1989, 10, 269–292. [Google Scholar]
- FAO-UNESCO. Overview of Forest Pests; FAO Forestry Department: Rome, Italy, 2007. [Google Scholar]
- Breshears, D.D.; Allen, C.D. The importance of rapid, disturbance-induced losses in carbon management and sequestration. Glob. Ecol. Biogeogr. 2002, 11, 1–5. [Google Scholar]
- Breda, N.; Granier, A.; Aussenac, G. Effects of thinning on soil water balance and tree water relations, transpiration and growth in oak forest (Quercus petraea (Matt) Liebl.). Tree Physiol. 1995, 15, 295–306. [Google Scholar]
- Aussenac, G.; Finkelstein, D. Influence de la sécheresse sur la croissance et la photosyntheses du Cèdre. Ann. Sci. For. 1983, 40, 67–77. [Google Scholar]
- Till, C. The summary response function of Cedrus atlantica (Endl.) Carriere in Morocco. Tree-Ring Bull. 1987, 47, 23–36. [Google Scholar]
- Conflict of Interest: The authors declare no conflict of interest.
© 2011 by the authors; licensee MDPI, Basel, Switzerland. This article is an open access article distributed under the terms and conditions of the Creative Commons Attribution license (http://creativecommons.org/licenses/by/3.0/).
Share and Cite
Linares, J.C.; Taïqui, L.; Camarero, J.J. Increasing Drought Sensitivity and Decline of Atlas Cedar (Cedrus atlantica) in the Moroccan Middle Atlas Forests. Forests 2011, 2, 777-796. https://doi.org/10.3390/f2030777
Linares JC, Taïqui L, Camarero JJ. Increasing Drought Sensitivity and Decline of Atlas Cedar (Cedrus atlantica) in the Moroccan Middle Atlas Forests. Forests. 2011; 2(3):777-796. https://doi.org/10.3390/f2030777
Chicago/Turabian StyleLinares, Juan C., Lahcen Taïqui, and Jesús Julio Camarero. 2011. "Increasing Drought Sensitivity and Decline of Atlas Cedar (Cedrus atlantica) in the Moroccan Middle Atlas Forests" Forests 2, no. 3: 777-796. https://doi.org/10.3390/f2030777