Article

Comparison of Pyrolysis Mass Spectrometry and Near Infrared Spectroscopy for Genetic Analysis of Lignocellulose Chemical Composition in Populus

1
School of Forest Resources & Conservation, University of Florida, P.O. Box 110410, Gainesville, FL 32611-0410, USA
2
Escola de Agronomia, Universidade Federal de Goias, P.O. Box 131, Goiânia, GO 74690-900, Brazil
3
Genetics Institute and Plant Molecular and Cellular Biology Program, University of Florida, P.O. Box 110410, Gainesville, FL 32611-0410, USA
*
Author to whom correspondence should be addressed.
Forests 2014, 5(3), 466-481; https://doi.org/10.3390/f5030466
Submission received: 15 January 2014 / Revised: 7 March 2014 / Accepted: 12 March 2014 / Published: 21 March 2014
(This article belongs to the Special Issue Improving Wood Quality from Planted Forests)

Abstract

:
Genetic analysis of wood chemical composition is often limited by the cost and throughput of direct analytical methods. The speed and low cost of Fourier transform near infrared (FT-NIR) overcomes many of these limitations, but it is an indirect method relying on calibration models that are typically developed and validated with small sample sets. In this study, we used >1500 young greenhouse grown trees from a clonally propagated single Populus family, grown at low and high nitrogen, and compared FT-NIR calibration sample sizes of 150, 250, 500 and 750 on calibration and prediction model statistics, and heritability estimates developed with pyrolysis molecular beam mass spectrometry (pyMBMS) wood chemical composition. As calibration sample size increased from 150 to 750, predictive model statistics improved slightly. Overall, stronger calibration and prediction statistics were obtained with lignin, S-lignin, S/G ratio, and m/z 144 (an ion from cellulose), than with C5 and C6 carbohydrates, and m/z 114 (an ion from xylan). Although small differences in model statistics were observed between the 250 and 500 sample calibration sets, when predicted values were used for calculating genetic control, the 500 sample set gave substantially more similar results to those obtained with the pyMBMS data. With the 500 sample calibration models, genetic correlations obtained with FT-NIR and pyMBMS methods were similar. Quantitative trait loci (QTL) analysis with pyMBMS and FT-NIR predictions identified only three common loci for lignin traits. FT-NIR identified four QTLs that were not found with pyMBMS data, and these QTLs were for the less well predicted carbohydrate traits.

1. Introduction

Forests trees capture greenhouse gases [1] and provide a renewable supply of wood for pulp, paper, construction and bioenergy. Genetic improvement of forest tree species, such as Eucalyptus, Populus, and Pinus species has increased growth, improved stem form and disease resistance [2], leading to significant gains in yield at shorter rotations [3,4]. However, despite the importance of wood chemical composition for yields of chemical pulp and biofuel and our knowledge of genes that code for enzymes involved in synthesis of cellulose, hemicellulose and lignin from model herbaceous and tree species, forest tree breeders have only recently begun dissecting the genetic architecture of these traits [5,6,7,8,9,10,11].
A variety of methods for measuring the chemical composition of lignocellulosic biomass have been developed and some have been applied to understand genetic control and environmental effects [12,13]. Although classical wet chemical methods have been used widely, their application for genetic analyses is limited by their high cost and low throughput. Composition data from miniaturized wet chemical methods were used to calculate genetic parameters for wood chemical composition in loblolly pine [14] and Eucalyptus [13,15]. Pyrolysis molecular beam mass spectrometry (pyMBMS) is faster than wet chemical methods and has been used to characterize lignocellulosic components in herbaceous and woody biomass [16,17,18], analyze genetic trials aimed at characterizing trait genetic architecture [19], map quantitative trait loci (QTL) [10,20] and identify genes that affect cellulose, hemicellulose and lignin content in pine and poplar [19,21]. Despite these advances in our knowledge of the genetic mechanisms controlling wood lignocellulose composition, analysis of the very large number of samples needed for traditional and advanced molecular marker based breeding in commercially important species requires faster and lower cost methods [22].
One such method is near infrared (NIR) spectroscopy, which is an indirect method that relates absorbance differences in NIR wavelengths to differences in anatomical, chemical and mechanical properties. NIR has been used for qualitative and quantitative chemical analyses in many fields and industrial applications, including agricultural products [23], food [24], and forestry [25,26,27]. NIR relies on multivariate models to predict properties of new samples, and has been used to estimate genetic parameters for wood chemical content in different tree species. For example, in Eucalyptus globulus [12,28,29,30,31] NIR was utilized for prediction of cellulose, pulp yield, lignin and extractives, and Eucalyptus nitens [32,33] for cellulose, and in Pinus pinaster Ait [34,35] for lignin, extractives, cellulose and monosaccharides. Nevertheless, no direct comparison of genetic parameter estimates of wood chemical composition obtained with NIR and a direct method have been reported. Nor have the utility of NIR predictions for quantitative trait loci (QTL) mapping, association genetics, and genomic selection been investigated.
The goals of this research were to assess the importance of calibration sample size on FT-NIR model predictions and compare genetic parameter estimates and significant QTLs from the indirect FT-NIR predictions to pyMBMS within a single Populus family.

2. Materials and Methods

2.1. Samples and FT-NIR

For this research, wood samples from a single pseudo-backcross family of Populus were used. The experimental design, sample processing and collection of pyMBMS data are described in detail by Novaes et al. [10]. Briefly, ground samples of wood were available from 2376 plants from 396 genotypes grown under two different nitrogen treatments (with ~3 clonal replicates) and then harvested after 10 weeks. The basal 5 cm section of the debarked stem were dried and ground to 40 mesh. Pyrolysis MBMS data were available for wood samples from two replicates (1515), and 1505 of these samples were scanned with FT-NIR. The spectra were obtained with a Perkin-Elmer Spectrum 400 FTIR/FTNIR (PerkinElmer Ltd., Beaconsfield, UK) equipped with an X-Y stage autosampler to increase the efficiency of scanning. About 4 mg of powdered samples were loaded into wells of an X-Y plate (96 wells) autosampler with diffuse reflectance from Pike technologies (Pike Tech., Madison, WI, USA). Aliquots from each wood sample were loaded into three wells and each well was scanned 32 times, at a resolution of 8 cm−1 (10,000–4000 cm−1). Spectra from the three wells were averaged prior to analysis. The Spectrum Quant+ software (PerkinElmer Ltd., Beaconsfield, UK) was used for calibration and prediction. The second derivatives of the NIR spectra were applied to adjust the baseline. In all calibrations with the software package, a partial least square (PLS) algorithm was used to develop the calibration and prediction models from FT-NIR spectra data. The 1505 samples were randomly separated into calibration and prediction sets (150 vs. 1355, 250 vs. 1255, 500 vs. 1005, and 750 vs. 755). Calibration models were also developed using full cross validation.

2.2. Calibration Statistics

The standard error of estimate (SEE) was used to determine how fit the calibration models were, and standard error of prediction (SEP) was used to determine how fit is the prediction performed by this calibration model [27], as described below:
Forests 05 00466 i001
where ŷi is the estimated value of sample i by the calibration model, yi is the known value (from pyMBMS) of sample i, n is the number of samples in the calibration model.
Forests 05 00466 i002
where ypred,i is the predicted value of sample i by the calibration model, yref,i is the known value (from pyMBMS) of sample i, m is the number of samples in the prediction set.
The coefficient of determination (R2) was utilized to evaluate the calibration and prediction performances.

2.3. Statistical Analysis of Phenotypic Data

The distribution of residuals was checked by PROC INSIGHT (SAS Institute Inc. 9.2® 2002–2008, Cary, NC, USA). Data cleaning was conducted by removing outliers and recording errors as reported by Novaes et al. [10]. The mixed model used in this paper was the same as before [10]:
yijklmno = μ + ri + Tk + rtik + bj(i) + cl + rcil + tckl + pm(i) + qn(i) + eijklmno
where yijklmno is the response of the oth ramet of the lth clone in the kth treatment of the jth bench within the ith replication; μ is population mean; ri is the random effect of replication, which is normally and independently distributed (NID) as N(0, σ2r); Tk is the treatment effect of nitrogen; rtik is the interaction of replication by treatment, ~NID(0, σ2rt); bj(i) is the random effect of bench (incomplete block) within replication, ~ NID(0, σ2rbc); cl is the random effect of clone, ~NID(0, σ2c); rcil is the random effect of replication by clone interaction, ~NID(0, σ2rc); tckl is the random effect of treatment by clone interaction, ~NID(0, σ2tc); pm(i) is the random effect of row within replication, ~NID(0, σ2p); qn(i) is the random effect of column with replication, ~NID(0, σ2q); eijklmno is the random error effect within the experiment,
Forests 05 00466 i003
The treatment effect for each trait was obtained using the SAS® System for mixed models. Restricted maximum likelihood with ASReml was utilized to obtain the variance components and genetic parameters. For least-square means in QTL analysis, we took both clone effect and its interaction with treatment as fixed effects in the model.
ASReml was used to calculate the clonal repeatability for each trait in the univariate analysis with estimates of variance components as follows:
Forests 05 00466 i004
where σc, σrc, σtc, Forests 05 00466 i005 were defined as previously. Pair-wise genetic correlations between wood chemical traits were estimated as described before [10].

2.4. QTL Analysis

A previously published genetic map [10,36] was utilized to test whether the FT-NIR wood chemical predictions could be used to detect genomic loci (QTL) controlling the quantitative traits. Briefly, the genetic map contains 163 microsatellite and 18 microarray-based markers covering all the 19 linkage groups of poplar, at an average density of one marker for every 16 cM (Kosambi’s map function). The genetic map was constructed on MapMaker 3.0 [37] and the QTL analysis was performed with composite interval mapping based on maximum likelihood estimation [38] using Windows QTL Cartographer v.2.5 [39]. The presence of QTLs along the linkage groups is tested with a likelihood ratio (LR) test. The LR compares the likelihood of having a QTL (full model) at any single position of the map against the likelihood of not having it (reduced model). The LR threshold for definition of a QTL was α = 0.05, determined with genome-wide analysis of 1000 permutations [40]. For this article we only tested the performance of the FT-NIR prediction with the 500 sample set on the high N fertilization treatment.

3. Results

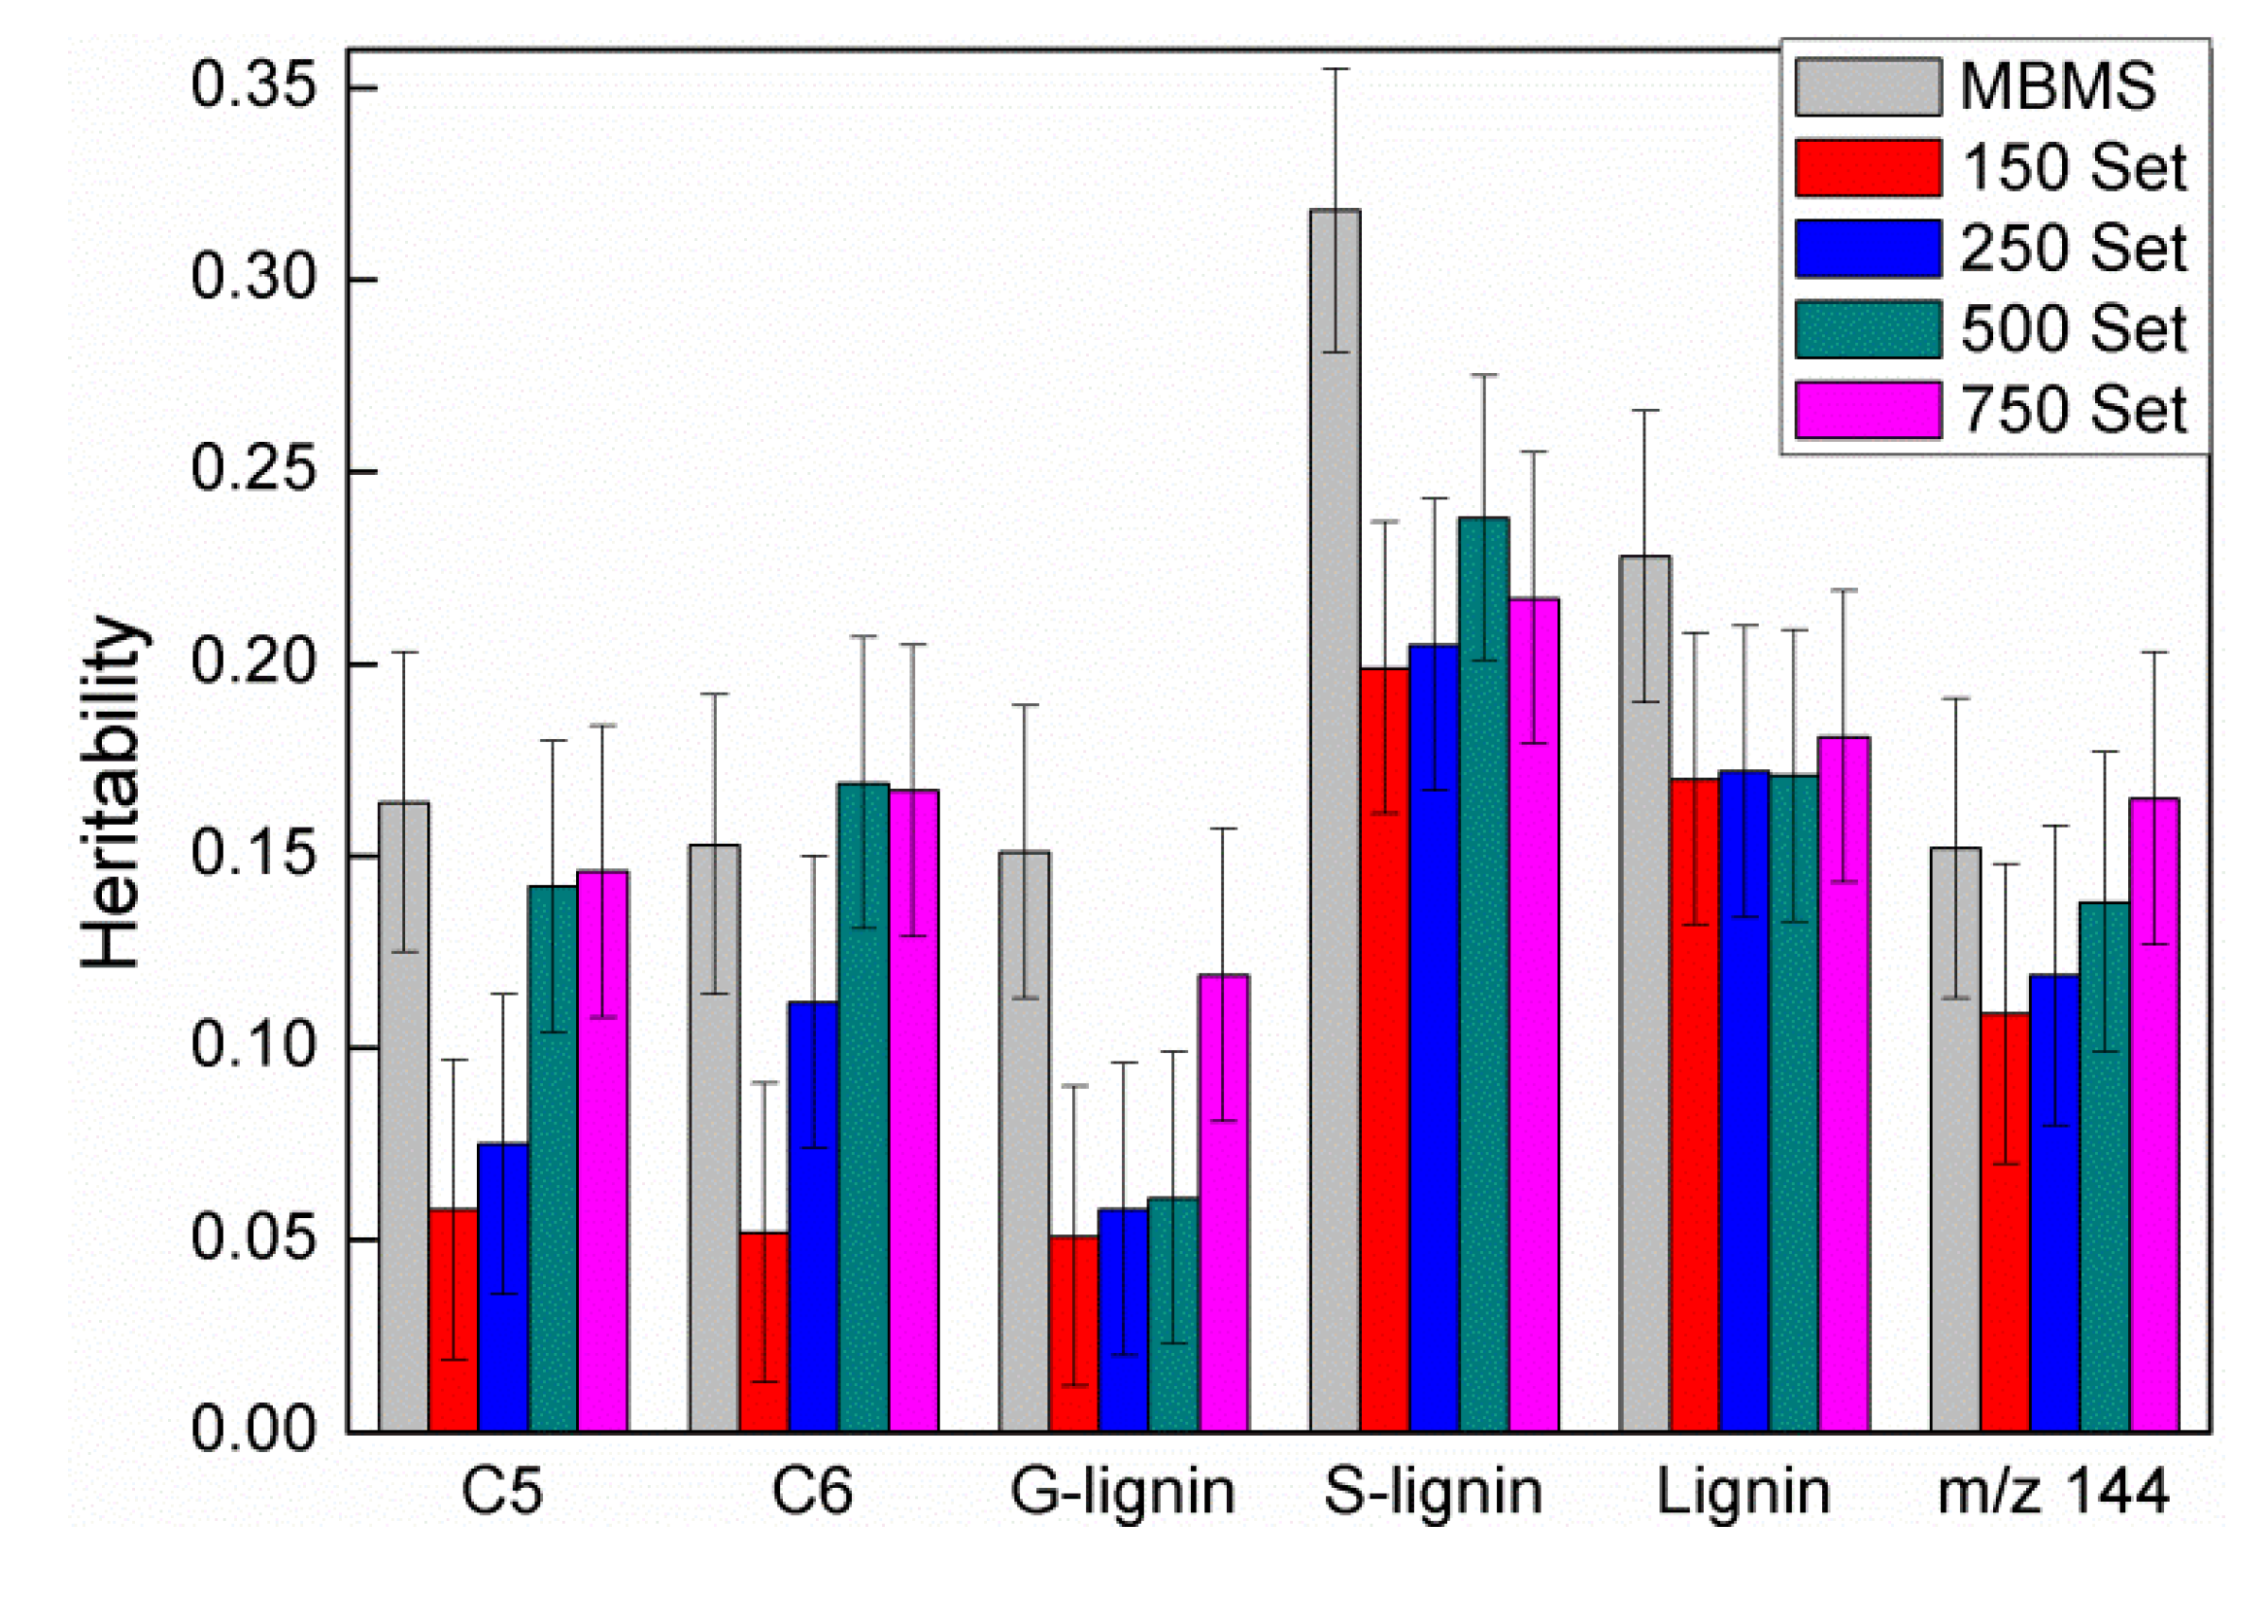
3.1. Effects of Sample Size on Calibration and Prediction

To investigate the impact of the number of samples needed for good calibration and prediction using pyMBMS data, we compared the correlation coefficients when using 150, 250, 500 and 750 samples in the calibration set (Table 1). All sets of samples were chosen randomly, and the remaining samples were used as a prediction set. The four calibration sets had similar means and ranges of chemical components (data not shown). In general, similar calibration R2 were obtained with all sample sets for lignin, G-lignin, and S-lignin (Table 1); however, the calibration R2 for C5, C6 and m/z 114, an ion from xylan, were overall lower than for lignin and more variable across different sample sizes (Table 1). The prediction correlation coefficients strengthened slightly for all chemical components with increasing sample size. For example, lignin prediction increased from R2 = 75.50% (150) to R2 = 82.39% (750) (Table 1). The lignin prediction results were better than the sugar (C5, C6) components, except for m/z 144, an ion arising from cellulose, which had a prediction R2 of 70.55% with the 500 calibration sample set.
We previously reported that when grown at high nitrogen, wood lignin content is significantly lower than when grown at low nitrogen [10]. The FT-NIR predicted lignin contents also differed significantly between low and high nitrogen environments, for calibration models developed with all sample sizes (Table 2). For the 500 sample calibration set, FT-NIR prediction has a slope of 0.813 relative to the pyMBMS; the predicted FT-NIR values were slightly higher at high nitrogen, and slightly lower at low nitrogen than the pyMBMS data (Figure 1) [41]. With both FT-NIR and pyMBMS all carbohydrate components did not differ between nitrogen levels. These results validate the ability of calibration models to detect relatively large differences in poplar wood lignin content induced by nitrogen availability.
Figure 1. Pyrolysis molecular beam mass spectrometry (pyMBMS) vs. Fourier transform near infrared (FT-NIR) predicted lignin for low and high nitrogen treatments.
Forests 05 00466 g001
Table 1. Different sample size calibration and prediction results.
TraitFactorsCalibration % R2SEESEPPrediction % R2
150 setLignin385.001.291.5575.50
G-lignin477.710.801.1956.00
S-lignin387.530.921.1072.25
C5467.631.392.3129.91
C6250.493.043.4837.85
m/z 114471.20.280.4449.37
m/z 144376.670.220.2862.93
250 setLignin487.391.171.4579.96
G-lignin476.160.791.0259.94
S-lignin489.50.811.0378.71
C5466.421.361.8136.06
C6474.612.252.9547.89
m/z 114472.450.280.3650.53
m/z 144484.740.180.2464.91
500 setLignin586.681.131.3281.54
G-lignin577.460.760.9462.24
S-lignin481.870.981.0880.14
C5456.271.501.7436.89
C6464.422.472.8349.45
m/z 114464.920.300.3452.37
m/z 144580.860.180.2270.55
750 setLignin584.791.261.3982.39
G-lignin778.210.760.9569.23
S-lignin483.780.991.0880.41
C5447.531.661.8241.27
C6457.622.752.9949.44
m/z 114459.750.320.3555.46
m/z 144576.720.200.2369.97
Note: 150, 250, 500 and 750 sets are randomly selected samples from all samples for calibrations. All pyMBMS chemical data were peak intensities. Lignin: (G-lignin + S-lignin + 120 + 152 + 180 + 181) × correction factor, G-lignin: Guaiacyl lignin monomer m/z peaks sum of 124 + 137 + 138 + 150 + 164 + 178, S-lignin: Syringyl lignin m/z peaks sum of 154 + 167 + 168 + 182 + 194 + 208 + 210, C5: Five-carbon hemicelluloses sugar m/z peaks sum of 57 + 73 + 85 + 96 + 114, C6: Six-carbon cellulose sugar m/z peaks sum of 57 +60+ 73 + 98 + 126 + 144, m/z 114: peak 114 intensity associated with xylose(3-hydroxy-2-penteno-l,5-lacto, C5H6O3), m/z 144: peak 144 intensity associated with glucose (methylbenzodioxole, C8H8O2, due to levoglucosan) [16,42].
Table 2. Estimates of clonal repeatability and average trait value for seven wood chemistry phenotypes in two nitrogen treatments with pyMBMS and FT-NIR of 500 set.
TraitH2± SEN (L) Mean ± SEN (H) Mean ± SEProb > |t|
FT-NIRpyMBMSFT-NIRpyMBMSFT-NIRpyMBMSFT-NIRpyMBMS
Lignin0.17 ± 0.040.23 ± 0.0421.6 ± 0.121.7 ± 0.117.5 ± 0.117.4 ± 0.1<0.0001<0.0001
G-lignin0.06 ± 0.040.15 ± 0.0413.2 ± 0.113.2 ± 0.111.2 ± 0.111.2 ± 0.1<0.0001<0.0001
S-lignin0.24 ± 0.040.32 ± 0.0413.0 ± 0.113.0 ± 0.110.2 ± 0.110.2 ± 0.1<0.0001<0.0001
C50.14 ± 0.040.16 ± 0.0425.6 ± 0.125.7 ± 0.127.1 ± 0.127.0 ± 0.1<0.0001<0.0001
C60.17 ± 0.040.15 ± 0.0432.7 ± 0.132.9 ± 0.135.7 ± 0.135.5 ± 0.2<0.0001<0.0001
m/z 1440.14 ± 0.040.15 ± 0.040.89 ± 0.010.90 ± 0.011.35 ± 0.011.34 ± 0.02<0.0001<0.0001
m/z 1140.04 ± 0.040.17 ± 0.031.80 ± 0.011.83 ± 0.012.47 ± 0.012.43 ± 0.02<0.0001<0.0001
Note: Clonal repeatability (H2), Standard error (SE), N (L): Low nitrogen treatment, N (H): High nitrogen treatment. The last column is the p-values for testing nitrogen treatment for each phenotype.
An important standard measure of genetic control of a phenotype is heritability, the ratio of genetic to phenotypic variation. The best measure of genetic control for clonally propagated populations is clonal repeatability, a measure of broad sense heritability or total genetic control. With the FT-NIR predicted values, the clonal repeatabilities were all lower than those obtained with the pyMBMS data (Figure 2). For C5, C6, m/z 144, and G-lignin, the FT-NIR heritability estimates increased with larger calibration sample size (Figure 2). For m/z 114, an ion from xylan, the heritability was zero for every calibration set, and thus was dropped from the genetic analyses described below. For this population a random set of 500 samples gave strong calibration models with the smallest standard errors of prediction and for all chemical components gave the highest estimates of genetic control for most traits. Thus, the 500 sample calibration model was used to predict the chemical composition of the 1505 wood samples for the genetic correlation and QTL analyses described below.
Figure 2. Clonal repeatability and standard errors for different FT-NIR size calibration sets compared with pyMBMS; Error bars correspond to standard errors of the mean.
Forests 05 00466 g002

3.2. Comparison of Heritability and Genetic Correlations among Traits
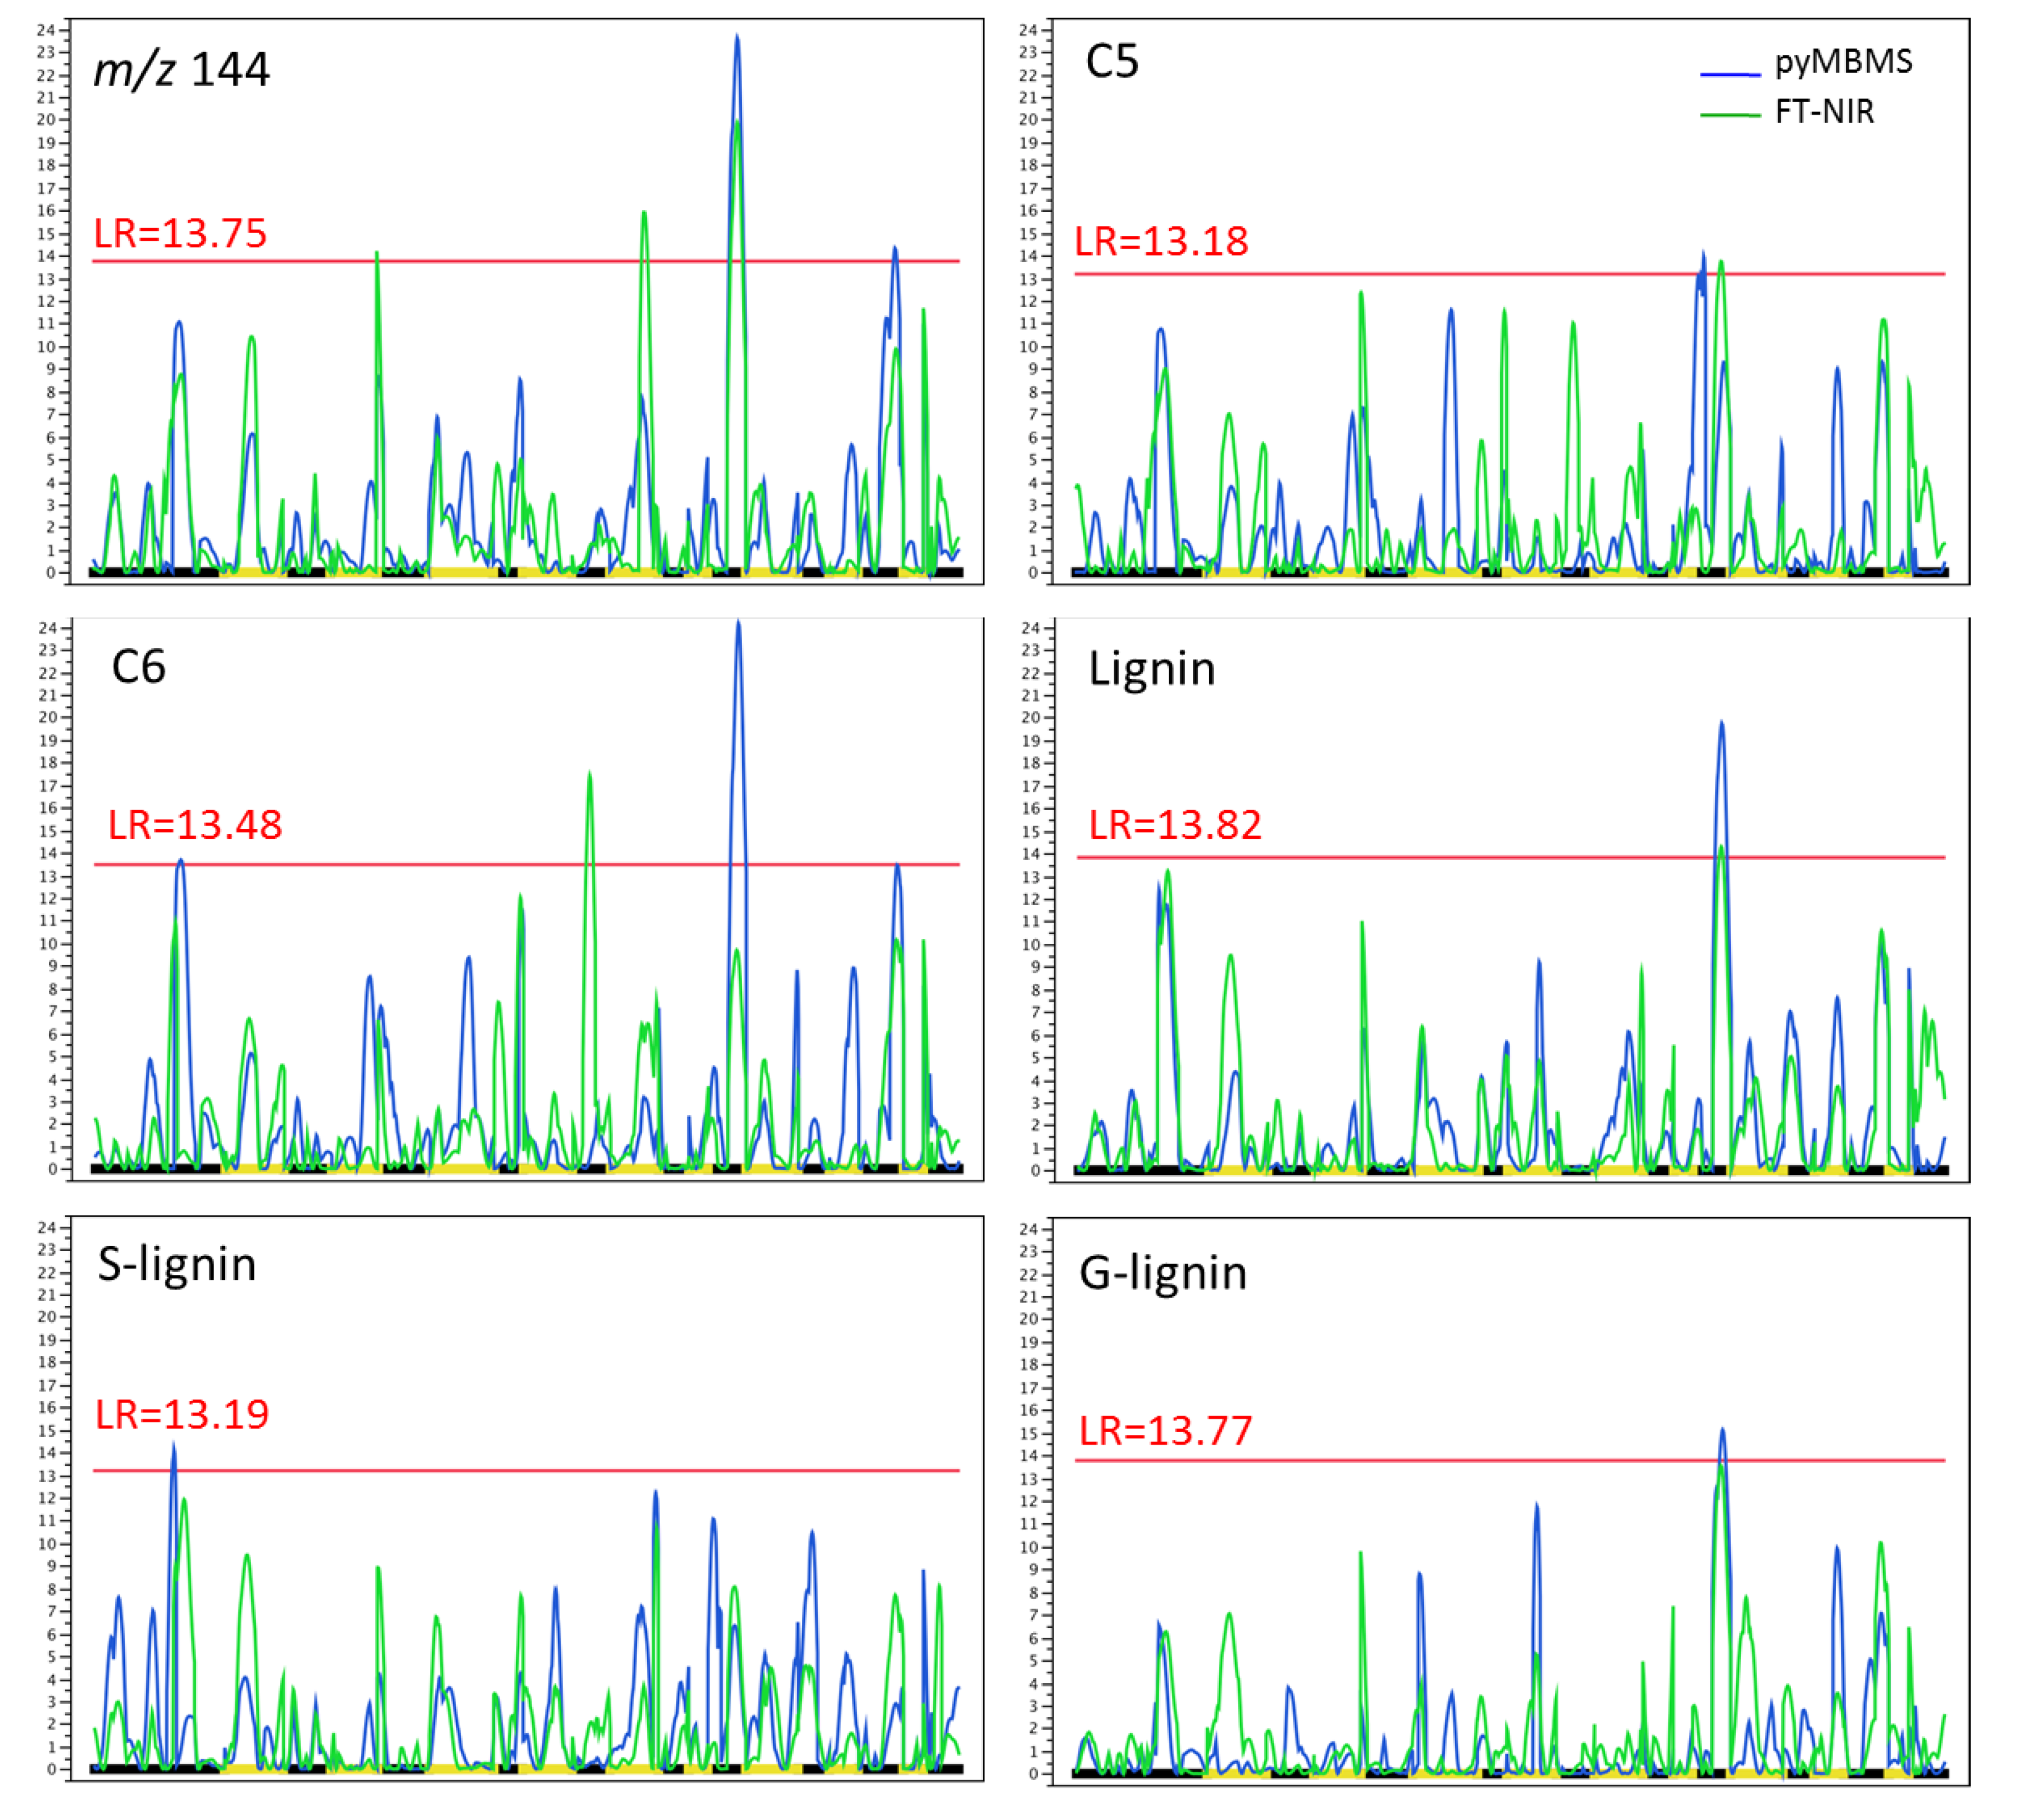
Compared with pyMBMS, the clonal repeatability estimates with FT-NIR predictions were about 25% lower for total lignin and S-lignin and 60% lower for G-lignin. For both pyMBMS and FT-NIR, the genetic control of lignin was higher than for carbohydrates [10]. However, the clonal repeatability was very similar for C5 and cellulose m/z 144 ions, and a little better for C6 estimated with FT-NIR when compared with pyMBMS (Table 2). Interestingly, with FT-NIR the genetic control of m/z 144, a cellulose ion, was almost as high as the sum of the C6 sugar ions [16].
Pair-wise genetic correlations between traits are important for understanding whether common genetic pathways are involved in the control of two or more traits and for applying the appropriate breeding and selection strategies. Genetic correlations of chemical traits within and across pyMBMS and FT-NIR were quite similar, with most of the pair-wise correlation estimates being stronger than 0.60 (absolute value) (Table 3). The strongest genetic correlations between pyMBMS and FT-NIR predictions were for lignin (1.00), S-lignin (0.99), G-lignin (0.74), S/G (0.92), C6 (0.87), C5 (0.73), C6/C5 (1.00), m/z 144 (0.87), and C6/lignin (0.87). Genetic correlations among chemical components were similar between pyMBMS and FT-NIR data for most of the traits, except for 9 pairs where correlations differed by more than 0.2.
Pair-wise genetic correlations between pyMBMS and FT-NIR predictions indicate lignin, S-lignin, S/G, C6, C6/C5, m/z 144 and C6/Lignin were highly correlated while G-lignin and C5 had weaker correlations (Table 4).

3.3. QTL Analysis

For all six wood chemistry traits under high nitrogen treatment, QTL analyses were performed using values from all 1505 samples predicted with the 500 sample calibration model. The objective was to compare the number of QTLs and whether the QTLs detected with FT-NIR co-localize with those detected by pyMBMS. Even though the level of genetic control estimated with FT-NIR data were considerably lower than those estimated with pyMBMS, seven QTLs were identified with the FT-NIR predictions and eight with pyMBMS (Table 5). However, only three of these QTLs mapped to the same intervals in both pyMBMS and FT-NIR (Table 5, Figure 3). These coincidences were detected for m/z 144, lignin and G-lignin, and were all located on the same region of LGXIII. We previously identified this region as having a major effect on wood chemical and growth traits of this family [10]. More specifically, this region explains 56% of the heritable variation for cellulose to lignin ratio, as well as 20%–25% of the heritable variation for biomass.
Table 3. Pair-wise comparisons of genotypic correlations between chemical traits for both NIR and pyMBMS.
TraitLigninS-ligninG-ligninS/GC6C5C6/C5m/z 144C6/L
MSNIRMSNIRMSNIRMSNIRMSNIRMSNIRMSNIRMSNIRMSNIR
Lignin——1.000.920.990.510.790.700.90−0.99−1.00−0.81−1.00−1.00−0.98−1.00−0.97-1.00−1.00
SL0.920.99——0.990.140.700.920.96−0.85−1.000.620.99−1.00−0.97−0.92−1.00-0.93−1.00
GL0.510.790.140.70——0.74−0.260.45−0.64−0.61−0.69−0.580.420.67−0.57−0.58 -0.62−0.71
S/G0.700.900.920.96−0.260.45——0.920.540.950.290.96−0.86-0.930.640.950.640.94
C6−0.99−1.00−0.85−1.00−0.64−0.610.540.95——0.870.961.000.881.000.981.000.981.00
C5−0.81−1.000.620.99−0.69−0.58−0.29−0.960.961.00——0.730.720.990.901.000.881.00
C6/C5−1.00−0.98−1.00−0.970.420.67−0.86−0.930.881.000.720.99——1.000.951.000.961.00
m/z144−1.00−0.97−0.92−1.00−0.57−0.580.640.950.981.000.901.000.951.00——0.870.990.98
C6/L−1.00−1.00−0.93−1.00−0.62−0.710.640.940.981.000.881.000.961.000.99 0.98——0.87
Note: MS: pyMBMS, NIR: FT-NIR. Bold type means pair-wise traits with correlation > |0.60|, Underline correlations are used for ranking, and Italic correlation pairs are correlations differed by more than 0.2. C6/C5: ratio of C6/C5, S/G: ratio of S-lignin/G-lignin, C6/L: ratio of C6/lignin.
Table 4. Pair-wise estimates of genotypic correlations between pyMBMS and FT-NIR.
FT-NIR predicted traits
TraitLigninSLGLS/GC6C5C6/C5m/z 144C6/L
pyMBMS traitsLignin1.000.920.930.80−0.96−1.00−0.89−1.00−1.00
SL1.000.990.730.95−0.99−1.00−0.94−1.00−1.00
GL0.290.180.74−0.27−0.24−0.28−0.18−0.27−0.31
S/G0.850.880.420.92−0.84−0.85−0.82−0.86−0.89
C6−0.76−0.74−0.65−0.630.870.960.740.940.74
C5−0.51−0.49−0.51−0.390.500.730.480.510.48
C6/C5−1.00−1.00−0.83−0.931.001.001.001.001.00
m/z 144−0.84−0.83−0.65−0.740.860.860.860.870.83
C6/L−0.88−0.84−0.78−0.720.860.880.830.860.87
Note: Bold type means pair-wise traits with correlation > |0.60|. C6/C5: ratio of C6/C5, S/G: ratio of S-lignin/G-lignin, C6/L: ratio of C6/lignin.
Table 5. Number of quantitative trait loci (QTLs) detected with pyMBMS and FT-NIRS for six wood chemical traits. Coincidental QTLs map to the same intervals in the genome.
TraitNumber of QTLs
pyMBMSFT-NIRCoincident
m/z 144231
C5110
C6210
Lignin111
G-lignin111
S-lignin100
Total873
Figure 3. QTL profiles for pyMBMS (blue) and FT-NIR (green) predictions for six wood chemistry traits. The FT-NIR predictions were conducted with the 500 samples calibration set. The likelihood ratio (LR) threshold is indicated in each figure (red line), the y-axis is the likelihood ratio and the black and yellow bars on the x-axis delimit each linkage group.
Forests 05 00466 g003
As expected, the QTL profiles of pyMBMS and FT-NIR tend to be more similar for traits that have stronger genotypic correlation between both estimates. For example, for lignin (r = 1.0), C6 (r = 0.87) and m/z 144 (r = 0.87) the QTL profiles with pyMBMS and FT-NIR tend to co-vary (Figure 3). Generally for these traits, when a QTL is detected with one of the two techniques there is a peak on the QTL profile of the other that may or may not be above significance threshold. Conversely, for C5 sugars, which have weak correlation between estimates obtained with pyMBMS and FT-NIR (r = 0.73), the QTL profiles are quite different, even though the one significant QTL was detected with both methods.

4. Discussion

The low cost and high throughput of FT-NIR offers the opportunity for efficiently phenotyping the thousands of wood samples needed for dissecting genetic and environmental control of wood lignocellulose composition. However, because FT-NIR is an indirect method, robust calibration models with high prediction precision need to be developed and broadly validated. In this study, pyMBMS chemical composition data and FT-NIR spectra were used to calibrate and predict the composition of 1505 poplar samples from a single family, grown under high and low nitrogen [10].

4.1. Calibration, Prediction, and Sample Size

FT-NIR calibration models to estimate wood chemical composition have been reported for a number of species; however, most of these models were calibrated with wood chemistry data obtained from wet chemical methods using modest sample sizes and moderate calibration and prediction results were obtained [27,41,43,44,45,46]. Recently, global NIR models were developed with multiple pine species from multiple sites with high calibration and validation precision for lignin (R2 of calibration and validation 0.97 and 0.95 respectively) and cellulose (R2 of calibration and validation 0.84 and 0.72 respectively) content [47,48]. For Eucalyptus, more than 40 species across Australia (720 samples) were used to calibrate NIR models to predict Kraft pulp yield with R2 = 0.91 and low standard error of cross validation (1.36%) [49]. However, the utility of these global calibrations for genetic analyses has not been reported.
For indirect methods requiring calibration, an important question is how many samples are needed in the calibration set to develop strong predictive models that can be used for environmental and genetic analyses of wood chemistry. Although the R2 of calibration models were slightly weaker with 150 and 250 compared with the 500 and 750 sample sets (Table 1), the R2 of prediction models increased for all components with increasing sample size, with the strongest coefficients being obtained with 500 or 750 sample sets. Random sets of 500 samples yielded calibration models with R2 that ranged from 0.56 to 0.87 (Table 1) and were sufficient for developing good predictive models for all components. Overall, stronger calibration and prediction statistics were obtained with lignin than carbohydrates (Table 1), likely reflecting the quality of the estimation of lignin compared with the carbohydrate data from pyMBMS [11,50,51]. Reported calibration and prediction statistics using wet chemical methods were stronger than predictions obtained with pyMBMS [47]. One reason could be that the sum of peak intensities, arising from the breakdown of molecules during pyrolysis might be a mixture of several chemical components.

4.2. Genetic Parameters and Environmental Control

A few reports have demonstrated that NIR predictions can be used to estimate genetic parameters. For Pinus pinaster Ait and Pinus taeda, Isik et al. [52], Perez et al. [34] and Gaspar et al. [35] showed NIR as a potential tool to estimate heritabilities and genetic correlations for tree selection in physical and chemical properties. For Eucalyptus globulus and Eucalyptus nitens, the application of NIR focused on predicting the genetic parameters for cellulose [28,33], pulp yield [12,30,31], lignin [29]. Schimleck et al. [15,32] investigated the cellulose content predicted with a NIR calibration model as an alternative to estimate Kraft pulp yield in Eucalyptus nitens. NIR analysis provided estimates of genetic parameters that were as good as direct cellulose assessment, demonstrating that the heritability and genetic gain could be estimated by NIR. However, these studies suffer from the lack of validation of the accuracy and reliability of the estimates from NIR predictions.
No comparison of direct and indirect estimates of wood chemical composition and of genetic parameter estimates has been reported previously. Heritability estimates with FT-NIRS were a little lower than the estimates with pyMBMS except for C6 (Table 2). Figure 2 demonstrates that estimates of genetic control were more similar between FT-NIR predictions and pyMBMS data when larger 500 and 750 sample sizes were used for NIR calibration. This suggests that for genetic analyses, using more samples in the calibration is important, even though the statistics of calibration and prediction were similar between the 250 and 500 sample sets. Consequently, with pyMBMS data, sample sizes of 500 or more for NIR calibration should be used when the goal is to partition variances and estimate heritability.
Pair-wise genetic correlations obtained with FT-NIR predicted chemical traits were close to those obtained with the direct pyMBMS method. For example, predicted lignin was highly correlated with predicted S-lignin (0.99), G-lignin (0.79), S/G (0.90), C6 (−1.00), C5 (−1.00), C6/C5 (−0.98), m/z 144 (−0.97) and C6/lignin (−1.00) (Table 3), where pyMBMS lignin performed in a similar way. We also investigated the genetic correlation for chemical components between pyMBMS data and FT-NIR predictions, and they had the similar correlation estimates for most of the chemical traits, except for 17 pairs where correlations differed by more than 0.2. Consequently, the results proved FT-NIR can provide a robust model for genetic correlations [13].
Previously, Novaes et al. [10] observed that nitrogen application during early growth of Populus significantly increased the content of C5 (hemicellulose) and C6 (cellulose), and decreased lignin content. With FT-NIR predictions, nitrogen fertilization was also highly significant for all chemical traits, with the C6 increase being larger than the C5 increase, and total lignin decrease was much more than S-lignin and G-lignin (Table 2). This shows that the nitrogen effect could be of major importance for enhancing cellulose content in wood.

4.3. QTL Mapping

In total 7 QTLs identified with FT-NIR and 8 with py-MBMS, but only three were colocalized to the same interval. With the pyMBMS data, one QTL was identified for S-lignin but none were identified with FT-NIR. This relatively low coincidence of QTLs between the two methods requires additional investigation to understand whether the seven QTLs detected only with FT-NIR are real, even though a the stringent (α = 0.05, with 1000 genome-wide permutation tests) QTL threshold used gives statistical strength to the hypothesis that the novel FT-NIR QTLs are real. However, it is important to note the low prediction R2 of C6 (49%) and C5 (52%), for which two QTLs were identified only with FT-NIR predictions. Because coincident QTLs for lignin and m/z 144 were detected with FT-NIR predictions and pyMBMS data, this suggests that FT-NIR can be used when calibration models yield good predictions (R2 > 0.80). Once a good calibration model is obtained, FT-NIR is less costly and faster than direct methods, such as wet chemistry. FT-NIR may be especially interesting for genetic analyses of wood chemistry, given the fact that these studies, such as QTL and association studies, require the phenotyping of thousands of individuals.

5. Conclusions

These results show that FT-NIR, coupled with pyMBMS for model calibration, is an appropriate high-throughput method for wood chemical calibration. Our results show good and moderate calibration and prediction results for lignin and carbohydrates, respectively. Our study demonstrates the similarity of the direct and indirect estimates of wood chemical composition and genetic parameter estimates. Strong genetic correlations are obtained between the FT-NIR and pyMBMS. However, QTLs detected by FT-NIR and pyMBMS are quite different.

Acknowledgments

We thank Dudley A. Huber and Patricio R. Munoz for advice on the analysis of the data with ASReml. This research is supported by the Florida Energy Systems Consortium.

Conflicts of Interest

The authors declare no conflict of interest.

References

  1. McCarl, B.A.; Schneider, U.A. Climate change-Greenhouse gas mitigation in us agriculture and forestry. Science 2001, 294, 2481–2482. [Google Scholar] [CrossRef]
  2. McKeand, S.; Mullin, T.; Byram, T.; White, T. Deployment of genetically improved loblolly and slash pines in the south. J. For. 2003, 101, 32–37. [Google Scholar]
  3. Fox, T.R.; Jokela, E.J.; Allen, H.L. The development of pine plantation silviculture in the southern united states. J. For. 2007, 105, 337–347. [Google Scholar]
  4. Li, X.B.; Huber, D.A.; Powell, G.L.; White, T.L.; Peter, G.F. Breeding for improved growth and juvenile corewood stiffness in slash pine. Can. J. For. Res. 2007, 37, 1886–1893. [Google Scholar] [CrossRef]
  5. Greaves, B.L.; Borralho, N.M.; Raymond, C.A. Breeding objective for plantation eucalypts grown for production of kraft pulp. For. Sci. 1997, 43, 465–472. [Google Scholar]
  6. Peter, G.F.; White, D.E.; Torre, R.D.L.; Singh, R. The value of forest biotechnology: A cost modelling study with loblolly pine and kraft linerboard in the southeastern USA. Int. J. Biotechnol. 2007, 9, 415–435. [Google Scholar] [CrossRef]
  7. Kien, N.D.; Quang, T.H.; Jansson, G.; Harwood, C.; Clapham, D.; von Arnold, S. Cellulose content as a selection trait in breeding for kraft pulp yield in Eucalyptus urophylla. Ann. For. Sci. 2009, 66, 1–8. [Google Scholar]
  8. Quang, T.H.; Kien, N.D.; von Arnold, S.; Jansson, G.; Thinh, H.H.; Clapham, D. Relationship of wood composition to growth traits of selected open-pollinated families of Eucalyptus urophylla from a progeny trial in Vietnam. New For. 2010, 39, 301–312. [Google Scholar] [CrossRef]
  9. Zhang, D.; Zhang, Z.; Yang, K. Qtl analysis of growth and wood chemical content traits in an interspecific backcross family of white poplar (Populus tomentosa × P. Bolleana) × P. tomentosa. Can. J. For. Res. 2006, 36, 2015–2023. [Google Scholar] [CrossRef]
  10. Novaes, E.; Osorio, L.; Drost, D.R.; Miles, B.L.; Boaventura-Novaes, C.R.; Benedict, C.; Dervinis, C.; Yu, Q.; Sykes, R.; Davis, M. Quantitative genetic analysis of biomass and wood chemistry of populus under different nitrogen levels. New Phytol. 2009, 182, 878–890. [Google Scholar] [CrossRef]
  11. Li, X. Breeding for Improved Growth, Wood Quality, and Chemistry for Southern Pines by Combining Quantitative Genetics and Association Mapping. Ph.D. Thesis, University of Florida, Gainesville, FL, USA, 15 December 2009. [Google Scholar]
  12. Raymond, C.A.; Schimleck, L.R.; Muneri, A.; Michell, A.J. Genetic parameters and genotype-by-environment interactions for pulp-yield predicted using near infrared reflectance analysis and pulp productivity in Eucalyptus globulus. Int. J. For. Genet. 2001, 8, 213–224. [Google Scholar]
  13. Schimleck, L.R. Near infrared spectroscopy: A rapid, non-destructive method for measuring wood properties and its application to tree breeding. N. Z. J. For. Sci. 2008, 38, 14–35. [Google Scholar]
  14. Sykes, R.; Li, B.; Isik, F.; Kadla, J.; Chang, H.M. Genetic variation and genotype by environment interactions of juvenile wood chemical properties in Pinus taeda L. Ann. For. Sci. 2006, 63, 897–904. [Google Scholar] [CrossRef]
  15. Kube, P.D.; Raymond, C.A.; Banham, P.W. Genetic parameters for diameter, basic density, cellulose content and fibre properties for Eucalyptus nitens. For. Genet. 2001, 8, 285–294. [Google Scholar]
  16. Evans, R.J.; Milne, T.A. Molecular characterization of the pyrolysis of biomass. 1. Fundamentals. Energy Fuels 1987, 1, 123–137. [Google Scholar] [CrossRef]
  17. Evans, R.J.; Milne, T.A. Molecular characterization of the pyrolysis of biomass. 2. Applications. Energy Fuels 1987, 1, 311–319. [Google Scholar] [CrossRef]
  18. Agblevor, F.A.; Evans, R.J.; Johnson, K.D. Molecular-beam mass-spectrometric analysis of lignocellulosic materials: I. Herbaceous biomass. J. Anal. Appl. Pyrolysis 1994, 30, 125–144. [Google Scholar] [CrossRef]
  19. Voelker, S.L.; Lachenbruch, B.; Meinzer, F.C.; Jourdes, M.; Ki, C.; Patten, A.M.; Davin, L.B.; Lewis, N.G.; Tuskan, G.A.; Gunter, L. Antisense down-regulation of 4CL expression alters lignification, tree growth, and saccharification potential of field-grown poplar. Plant Physiol. 2010, 154, 874–886. [Google Scholar] [CrossRef]
  20. Sewell, M.M.; Davis, M.F.; Tuskan, G.A.; Wheeler, N.C.; Elam, C.C.; Bassoni, D.L.; Neale, D.B. Identification of qtls influencing wood property traits in loblolly pine (Pinus taeda L.). II. Chemical wood properties. Theor. Appl. Genet. 2002, 104, 214–222. [Google Scholar]
  21. Tuskan, G.; West, D.; Bradshaw, H.D.; Neale, D.; Sewell, M.; Wheeler, N.; Megraw, B.; Jech, K.; Wiselogel, A.; Evans, R. Two high-throughput techniques for determining wood properties as part of a molecular genetics analysis of hybrid poplar and loblolly pine. Appl. Biochem. Biotechnol. 1999, 77, 55–65. [Google Scholar] [CrossRef]
  22. Jannink, J.L.; Lorenz, A.J.; Iwata, H. Genomic selection in plant breeding: From theory to practice. Brief. Funct. Gen. 2010, 9, 166–177. [Google Scholar] [CrossRef]
  23. Nicolai, B.M.; Beullens, K.; Bobelyn, E.; Peirs, A.; Saeys, W.; Theron, K.I.; Lammertyn, J. Nondestructive measurement of fruit and vegetable quality by means of nir spectroscopy: A review. Postharvest Biol. Technol. 2007, 46, 99–118. [Google Scholar] [CrossRef]
  24. Alishahi, A.; Farahmand, H.; Prieto, N.; Cozzolino, D. Identification of transgenic foods using NIR spectroscopy: A review. Spectrochim. Acta Part A Mol. Biomol. Spectrosc. 2010, 75, 1–7. [Google Scholar] [CrossRef]
  25. Tsuchikawa, S. A review of recent near infrared research for wood and paper. Appl. Spectrosc. Rev. 2007, 42, 43–71. [Google Scholar] [CrossRef]
  26. So, C.L.; Via, B.K.; Groom, L.H.; Schimleck, L.R.; Shupe, T.F.; Kelley, S.S.; Rials, T.G. Near infrared spectroscopy in the forest products industry. For. Prod. J. 2004, 54, 6–16. [Google Scholar]
  27. Jones, P.D.; Schimleck, L.R.; Peter, G.F.; Daniels, R.F.; Clark, A. Nondestructive estimation of wood chemical composition of sections of radial wood strips by diffuse reflectance near infrared spectroscopy. Wood Sci. Technol. 2006, 40, 709–720. [Google Scholar] [CrossRef]
  28. Raymond, C.A.; Schimleck, L.R. Development of near infrared reflectance analysis calibrations for estimating genetic parameters for cellulose content in Eucalyptus globulus. Can. J. For. Res. 2002, 32, 170–176. [Google Scholar] [CrossRef]
  29. Poke, F.S.; Potts, B.M.; Vaillancourt, R.E.; Raymond, C.A. Genetic parameters for lignin, extractives and decay in Eucalyptus globulus. Ann. For. Sci. 2006, 63, 813–821. [Google Scholar] [CrossRef]
  30. Silva, J.C.; Borralho, N.M.G.; Araujo, J.A.; Vaillancourt, R.E.; Potts, B.M. Genetic parameters for growth, wood density and pulp yield in Eucalyptus globulus. Tree Genet. Gen. 2009, 5, 291–305. [Google Scholar] [CrossRef]
  31. Stackpole, D.J.; Vaillancourt, R.E.; Downes, G.M.; Harwood, C.E.; Brad, P.M. Genetic control of kraft pulp yield in Eucalyptus globulus. Can. J. For. Res. 2010, 40, 917–927. [Google Scholar] [CrossRef]
  32. Schimleck, L.R.; Kube, P.D.; Raymond, C.A. Genetic improvement of kraft pulp yield in Eucalyptus nitens using cellulose content determined by near infrared spectroscopy. Can. J. For. Res. 2004, 34, 2363–2370. [Google Scholar] [CrossRef]
  33. Hamilton, M.G.; Raymond, C.A.; Harwood, C.E.; Potts, B.M. Genetic variation in Eucalyptus nitens pulpwood and wood shrinkage traits. Tree Genet. Gen. 2009, 5, 307–316. [Google Scholar] [CrossRef]
  34. Perez, D.d.S.; Guillemain, A.; Alazard, P.; Plomion, C.; Rozenberg, P.; Carlos Rodrigues, J.; Alves, A.; Chantre, G. Improvement of Pinus pinaster ait elite trees selection by combining near infrared spectroscopy and genetic tools. Holzforschung 2007, 61, 611–622. [Google Scholar]
  35. Gaspar, M.J.; Alves, A.; Louzada, J.L.; Morais, J.; Santos, A.; Fernandes, C.; Almeida, M.H.; Rodrigues, J.C. Genetic variation of chemical and mechanical traits of maritime pine (Pinus pinaster aiton). Correlations with wood density components. Ann. For. Sci. 2011, 68, 255–265. [Google Scholar] [CrossRef]
  36. Drost, D.R.; Novaes, E.; Boaventura-Novaes, C.; Benedict, C.I.; Brown, R.S.; Yin, T.; Tuskan, G.A.; Kirst, M. A microarray-based genotyping and genetic mapping approach for highly heterozygous outcrossing species enables localization of a large fraction of the unassembled Populus trichocarpa genome sequence. Plant J. 2009, 58, 1054–1067. [Google Scholar] [CrossRef]
  37. Lander, E.S.; Green, P.; Abrahamson, J.; Barlow, A.; Daly, M.J.; Lincoln, S.E.; Newburg, L. Mapmaker: An interactive computer package for constructing primary genetic linkage maps of experimental and natural populations. Genomics 1987, 1, 174–181. [Google Scholar] [CrossRef]
  38. Zeng, Z.-B. Theoretical basis for separation of multiple linked gene effects in mapping quantitative trait loci. Proc. Natl. Acad. Sci. 1993, 90, 10972–10976. [Google Scholar] [CrossRef]
  39. Wang, S.; Basten, C.; Zeng, Z. Windows QTL Cartographer 2.5; Department of Statistics, North. Carolina State University: Raleigh, NC, USA, 2007. [Google Scholar]
  40. Churchill, G.A.; Doerge, R.W. Empirical threshold values for quantitative trait mapping. Genetics 1994, 138, 963–971. [Google Scholar]
  41. Poke, F.S.; Raymond, C.A. Predicting extractives, lignin, and cellulose contents using near infrared spectroscopy on solid wood in eucalyptus globulus. J. Wood Chemi. Technol. 2006, 26, 187–199. [Google Scholar] [CrossRef]
  42. Sykes, R.; Yung, M.; Novaes, E.; Kirst, M.; Peter, G.; Davis, M. High-throughput screening of plant cell-wall composition using pyrolysis molecular beam mass spectroscopy. In Biofuels: Methods and Protocols; Mielenz, J.R., Ed.; Humana Press: New York, NY, USA, 2009; Volume 581, pp. 169–183. [Google Scholar]
  43. Hou, S.; Li, L. Rapid characterization of woody biomass digestibility and chemical composition using near-infrared spectroscopy. J. Integr. Plant Biol. 2011, 53, 166–175. [Google Scholar] [CrossRef]
  44. Kelley, S.S.; Rials, T.G.; Snell, R.; Groom, L.H.; Sluiter, A. Use of near infrared spectroscopy to measure the chemical and mechanical properties of solid wood. Wood Sci. Technol. 2004, 38, 257–276. [Google Scholar]
  45. Nkansah, K.; Dawson-Andoh, B.; Slahor, J. Rapid characterization of biomass using near infrared spectroscopy coupled with multivariate data analysis: Part 1 yellow-poplar (Liriodendron tulipifera L.). Bioresour. Technol. 2010, 101, 4570–4576. [Google Scholar] [CrossRef]
  46. Wright, J.A.; Birkett, M.D.; Gambino, M.J.T. Prediction of pulp yield and cellulose content from wood samples using near-infrared reflectance spectroscopy. Tappi J. 1990, 73, 164–166. [Google Scholar]
  47. Hodge, G.R.; Woodbridge, W.C. Global near infrared models to predict lignin and cellulose content of pine wood. J. Near Infrared Spectrosc. 2010, 18, 367–380. [Google Scholar] [CrossRef]
  48. Hodge, G.R.; Woodbridge, W.C. Use of near infrared spectroscopy to predict lignin content in tropical and sub-tropical pines. J. Near Infrared Spectrosc. 2004, 12, 381–390. [Google Scholar] [CrossRef]
  49. Downes, G.M.; Meder, R.; Hicks, C.; Ebdon, N. Developing and evaluating a multisite and multispecies NIR calibration for the prediction of kraft pulp yield in eucalypts. South. For. 2009, 71, 155–164. [Google Scholar]
  50. Sykes, R.; Kodrzycki, B.; Tuskan, G.; Foutz, K.; Davis, M. Within tree variability of lignin composition in populus. Wood Sci. Technol. 2008, 42, 649–661. [Google Scholar] [CrossRef]
  51. Davis, M.; Elam, C.; Wiselogel, A.; Evans, R.; Tuskan, G.; West, D.; Megraw, R.; Wheeler, N.; Jech, K.; Sewell, M. Application of Pyrolysis Molecular Beam Mass Spectrometry for the Determination of Loblolly Pine and Hybrid Poplar Cell Wall Composition. TAPPI Pulping: Atlanta, Georgia, 1999; pp. 1077–1082. [Google Scholar]
  52. Isik, F.; Mora, C.R.; Schimleck, L.R. Genetic variation in pinus taeda wood properties predicted using non-destructive techniques. Ann. For. Sci. 2011, 68, 283–293. [Google Scholar] [CrossRef]

