Article

Monitoring Forest Recovery Following Wildfire and Harvest in Boreal Forests Using Satellite Imagery

1
Centre d’étude de la forêt, Université du Québec à Montréal, C.P. 8888, Succursale, Centre-ville, Montréal, QC H3C 3P8, Canada
2
Ressources naturelles Canada, Service canadien des forêts, Centre de foresterie des Laurentides, 1055 du PEPS, C.P. 10380, Station Sainte-Foy, Québec, QC G1V 4C7, Canada
3
Forest Research Institute, Industrial Chair NSERC-UQAT-UQAM in Sustainable Forest Management, Université du Québec en Abitibi-Témiscamingue, 445 boulevard de l’Université, Rouyn-Noranda, QC J9X 5E4, Canada
*
Author to whom correspondence should be addressed.
Forests 2015, 6(11), 4105-4134; https://doi.org/10.3390/f6114105
Submission received: 29 July 2015 / Revised: 7 November 2015 / Accepted: 12 November 2015 / Published: 18 November 2015

Abstract

:
In the managed boreal forest, harvesting has become a disturbance as important as fire. To assess whether forest recovery following both types of disturbance is similar, we compared post-disturbance revegetation rates of forests in 22 fire events and 14 harvested agglomerations (harvested areas over 5–10 years in the same vicinity) in the western boreal forest of Quebec. Pre-disturbance conditions were first compared in terms of vegetation cover types and surficial deposit types using an ordination technique. Post-disturbance changes over 30 years in land cover types were characterized by vectors of succession in an ordination. Four post-disturbance stages were identified from the 48 land thematic classes in the Landsat images: “S0” stand initiation phase; “S1” early regeneration phase; “S2” stem exclusion phase; and “S3” the coniferous forest. Analyses suggest that fire occurs in both productive and unproductive forests, which is not the case for harvesting. Revegetation rates (i.e., rapidity with which forest cover is re-established) appeared to be more advanced in harvested agglomerations when compared with entire fire events. However, when considering only the productive forest fraction of each fire, the revegetation rates are comparable between the fire events and the harvested agglomerations. The S0 is practically absent from harvested agglomerations, which is not the case in the fire events. The difference in revegetation rates between the two disturbance types could therefore be attributed mostly to the fact that fire also occurs in unproductive forest, a factor that has to be taken into account in such comparisons.

1. Introduction

Natural disturbances such as fire or insect outbreaks play an important role in the dynamics of boreal forests and contribute to their maintenance and renewal [1]. Of these natural disturbances, fire remains the most important in terms of the sheer magnitude of the area that is affected [2,3] and this disturbance is responsible for shaping the boreal forest [4,5]. However, forest harvesting in Eastern Canadian boreal forest has gradually increased and, in some regions, even replaced fire in terms of area disturbed per year as the predominant agent of disturbance in this territory [6,7,8,9]. In the Eastern Canadian Shield of Quebec, 19,915 km2 (0.02%) were affected by fire between 1990 and 2008, in comparison with 51,953 km2 (0.49%) of logged forest [9]. At the regional scale, 205,635 ha were burned whereas 413,054 ha were logged in the region west of Lac Saint-Jean between 1973 and 1997 [8]. Moreover, the resilience of the boreal forest and its underlying dynamics may differ considerably between fire and harvesting [10,11]. Currently, there is a wide range of arguments that have contrasted the beneficial and detrimental effects of both types of disturbance on forest recovery.
Post-fire forest recovery in the boreal coniferous forests, i.e., the capacity of the forest to regenerate and to maintain its productivity over the long-term, has been extensively studied for many years [3,4,12]. In burned areas, pre-disturbance species composition and fire severity are factors that will determine the composition of post-disturbance regeneration. Some species of the boreal forest (Pinus banksiana Lambert, Picea mariana (Miller) BSP, and Populus tremuloides Michx.) are well adapted to fire and can colonize burned stands in the first few years following a burn [13,14]. As post-fire regeneration densities of these species are strongly influenced by their basal areas in the pre-fire stands [14,15,16], a return to the pre-fire vegetation composition is usually rapid when the basal area is sufficient. This is not necessarily observed with traditional clear-cutting where mixed stands with a predominance of deciduous trees will dominate the post-harvest stands [17]. However, post-fire regeneration failures have been observed in Northern Quebec [18,19]. When time intervals between fires are short, there is a lack of regeneration because the stands did not have time to rebuild their areal seed banks between the two episodes [18,20]. Similarly, under certain biophysical limiting conditions, a full restocking of sites after fire may not be reached [21,22].
The type of surficial deposit, drainage characteristics, and the topography of a territory can influence both fire and harvesting post-disturbance forest composition [23,24,25,26,27]. Harvesting with protection of the regeneration and soils (CPRS in Quebec, i.e. CLAAG, Careful Logging Around Advanced Growth) has been used since the mid-1990s, and could favor a rapid return of stands to their pre-harvest compositions by maintaining the pre-established regeneration, which then becomes a major component of the regeneration after harvesting [23,28]. Lecomte et al. [25] and Lafleur et al. [29] observed, however, that following a low severity fire, sparse regeneration and poor growth can result from CLAAG in paludified sites throughout a stand’s history.
Actually, most of the published work on landscape analyses and monitoring forest over larger areas comes from, among all available remote sensing imagery, Landsat imagery [30,31,32], because images cover large areas (185 × 185 km) with a high spatial resolution (30 m), quality, and relatively short time frequency. The use of satellite imagery allows for the comparison of the revegetation rate (i.e., rapidity with which forest cover will rebuild) among different types of disturbances such as fire and harvesting [33,34,35] and it is considered as the most promising method to measure and evaluate landscape vegetation cover [36,37,38] and landscape metrics analysis [39]. The main objective of this study was to compare forest recovery following fire or harvesting in the black spruce-feather moss subdomain of Western Quebec using satellite data in terms of rate and composition. More specifically, (1) we compared the pre-disturbance conditions in terms of vegetation composition and surficial deposit characteristics; (2) we analyzed the post-disturbance recovery after fire or harvesting using succession vectors that describe changes in vegetation composition throughout time; (3) we evaluated the rate of revegetation over the first 30 years following the disturbance by comparing Landsat imagery taken at different times since the disturbance (between 1985 and 2005); and (4) we compared the post-disturbance land cover composition of fire events and harvested agglomerations. Our first hypothesis was that the vegetation cover types affected by fires vary (from forested to non-forested) and occur on different surficial deposit types, while those affected by harvest are exclusively forested and are mainly located on productive surficial deposits. Our second hypothesis predicted that post-fire and post-harvest revegetation rates are different in young post-disturbance stages but similar in advanced ones. Finally, the third hypothesis suggested that composition is dominated by softwoods in post-fire events and by hardwoods after harvesting.

2. Study Area

Our study area was located within the black spruce-feather moss subdomain [40] of Western Quebec. The study area extended from the James Bay Lowlands in the west to the Canadian Shield to the east (80° W to 74° W), and from 49° N to 51° N, which covers 9218 km2 (Figure 1). It concerns the four ecological regions 6a, 6b, 6c, and 6d. Ecological regions 6a and 6b belong to the James Bay Lowlands. All 6b and the western part of 6a were dominated by poorly drained organic soils (>60%), whereas clay soils were more common in the eastern part of 6a. Regions 6c and 6d fall on the Canadian Shield and were characterized by thick glacial till and, to a lesser degree, organic soils mostly occurring in the northern part. According to [41], the poorly drained organic soils constitute the dominant type of deposit in the west, while thick glacial till predominates in the east (Figure 1). Mean annual precipitation varies between 700 and 900 mm, while mean annual temperature varies between 2.5°C and 0°C. Topographic relief is relatively uniform and flat in the west and is characterized by plains with a few scattered rocky hills. It is more rugged in the east, consisting mostly of hills. Major bodies of water (e.g., lakes) in the west are few and smaller compared with those in the east, and are more uniformly shaped or circular. In the west, wetlands are more abundant, forming large peatlands [42], which would explain less pressure on forests by industrial activities in this part of the territory.
Figure 1. Study area and location of fire event and harvested agglomeration that were sampled. Fire event 1: burned areas where pre-burned mature forest covers <40%; fire event 2: burned areas where pre-burned mature forest covers >40% and for which the provided time since fire (TSF) is mainly between 14 and 19 years.
Forests 06 04105 g001
Fires are scattered throughout the territory whereas harvested zones are concentrated in the southern part of the study area, where wetlands are less abundant [42], and extend gradually towards the northeast.

3. Materials and Methodology

Two main data sources were used to compare harvested agglomerations and fire events undergoing post-disturbance recovery, the forest inventory SIFORT (Spatial information on Forest Composition based on Tessellate) database and a classified multi-temporal mosaic developed from Landsat TM (Thematic Mapper) imagery. SIFORT [43] is a geospatial database that divided an area into tiles of 15 s in longitude by 15 s in latitude (approximately 14 ha) where information for each grid centroid is sampled from the forest inventory maps produced by the MFFPQ (Ministère des Forêts, de la Faune et des Parcs du Québec) using air photos at 1/5000 scale [43]. It provides information on stand origin, composition, age, height, cover density, surficial deposit, and drainage for each of the three decadal inventories. It is a geo-referenced database grouping data collected from the last three decadal forest inventories (SIFORT 1, 1969; SIFORT 2, 1985 and SIFORT 3, 1994). We have used these databases to identify stand vegetation cover types prior to fire or harvesting disturbances to identify surficial deposit types and to define the time since harvesting in the harvested agglomerations.
The multi-temporal Landsat imagery mosaics were already classified by the remote sensing team of UQAT (Université du Québec en Abitibi-Temiscamingue) and LFC (Laurentian Forestry Centre of the Canadian Forest Service, Quebec). These mosaics were previously used to measure and monitor the state of the forest over a large area (11.6 million ha) of boreal forest in eastern Canada using several criteria (based on a combination of land thematic classes) for a 20-year period (1985–2005) [31]. Kappa validation was assessed using 53,000 fine-resolution geo-referenced digital aerial color photo frames and temporal change error was also performed. A modal filter (90 m by 90 m) was used to reduce classification between classes and size. These mosaics show an overall accuracy varying between 62 and 83% for 1985, 1995, 2000, and 2005 [31,44]. Landsat images were collected during the peak growing season and top-of-atmosphere reflectance correction was used. To report and monitor the state of the forest, a hybrid method (supervised and unsupervised techniques) was used and 48 thematic classes based on Canada’s National Forest Inventory were identified [45] for each period 1985, 1995, 2000, and 2005. In the current work, we used this product (48 thematic classes) to construct more robust groupings (with less classes), allowing the characterization and comparison of the post-disturbance recovery within burned and harvested areas over time (see next sections). The classified images were first processed with Majority Filter in ArcGIS 9.3 (ESRI Inc., Redlands, CA, USA), with a 3 × 3 moving window (pixels 30 m), to eliminate isolated pixels resulting from classification errors of diverse origins. This operation also minimized errors that could occur when overlaying two successive satellite images. As the methods involved many different steps, the overall approach is described in Figure 2. To avoid problems related to pseudo-replication, large N, and spatial auto-correlation, all the analyses were conducted on a per disturbance event basis. This implied, however, that the time since disturbance was more complex to define for the harvested agglomerations (harvested areas over 5–10 years in the same vicinity, see Section 3.2 for details).
Figure 2. Summary of the methodology steps followed in this study.
Forests 06 04105 g002

3.1. Fire Event Selection

Fires were first identified and dated using the spatially explicit database provided by the MFFPQ. The following criteria were used to select post-disturbance areas: (1) multiple satellite mosaics of the same area over time were available; (2) fire events were not truncated and there was no cloud coverage; (3) data from SIFORT were available to determine the pre-fire vegetation and site conditions; and (4) the selected fires had not been salvage-logged. In total, 22 fires with sizes varying between 2000 ha and 52,000 ha were retained for this study (Table 1). The post-fire satellite image dates provided time since fire (TSF), which varied from three months to 29 years. At least two scenes were acquired for each fire, while for some fires (fl5, f7, and f13), three post-fire scenes were available. In total, 48 post-fire scenes were obtained for the selected fires, of which 21, 21, and six had a TSF of 0 to 10 years, 11 to 20 years, and 21 to 29 years, respectively.
Table 1. Area, year of disturbance, and time since disturbance (TSD) for each image period for the 22 fire events and 14 harvested agglomerations. For the harvested agglomerations, the 10th and 90th percentiles (in area) are presented in parentheses after the year of disturbance. nd, no data; bh, before harvest.
NumberArea (ha)Year of disturbanceTSD
Image 1985Image 1995Image 2000Image 2005
Firesf12,0261996ndnd49
f22,4861987ndnd1318
f43,1621976ndnd2429
f53,2711996ndnd49
f74,24319860.25nd1419
f95,1751997ndnd38
f105,3831986ndnd1419
f135,70319860.2591419
f145,8531988ndnd1217
f156,1291980nd152025
f176,9731996ndnd49
f187,376197649ndnd
f2010,1771996ndnd49
f2110,3731995ndnd510
f2211,2201986ndnd1419
f2620,1521986ndnd1419
f2721,2621996ndnd49
f2820,9141976ndnd2429
f2933,3251986ndnd1419
f3036,3251983ndnd1722
f3242,7531996ndnd38
f3351,8821986ndnd1419
Harvestc115,9321976 (1971–1980)9192429
c227,1521978 (1974–1982)7172227
c348,1211978 (1976–1981)7172227
c47,6261980 (1978–1982)5152025
c516,9231976 (1971–1979)9192429
c612,5951981 (1978–1984)4141924
c796,5741978 (1976–1983)7172227
c843,8231988 (1984–1993)bh71217
c94,1651985 (1984–1985)0101520
c1014,3791986 (1984–1988)bh91419
c1111,8781990 (1987–1994)bh51015
c1247,9821989 (1984–1993)bh61116
c1334,1461987 (1985–1990)bh81318
c1435,4031988 (1984–1992)bh71217

3.2. Delineation of Harvested Agglomerations

The harvested agglomerations that result from an agglomeration of harvested blocks over time were digitized by drawing polygons on the satellite imagery with ArcGIS 9.3. These areas were easily identified on the images by their regular geometric configurations. To ensure that these were authentic harvested agglomerations, SIFORT data containing logging dates were superimposed on the satellite images. It should be noted that the boundaries/edges of these harvested agglomerations were delineated subjectively on the images by remaining within the boundaries of the same harvested agglomeration.
While a fire event is produced over a relatively short period of time, i.e., a few days to several weeks, a harvested agglomeration can result from several years of harvesting. Consequently, when comparing post-fire and post-harvest forest revegetation, the latter will exhibit a spread of ages over time. To minimize this effect, using the SIFORT database, we retained only agglomerations that took less than 10 years to be created (Table 1). To estimate mean TSH (time since the last harvest) for each harvested agglomeration, we calculated the mean logging date, weighted by the surface area harvested each year for each harvesting agglomeration from the SIFORT database (Table 1).
Because of their spatial concentration and agglomeration, the number of harvested agglomerations that we could select was limited. In total, 14 harvested agglomerations (numbered c1, c2, c3, etc.) were chosen, with sizes varying between 4000 ha and 97,000 ha. Considering the SIFORT minimal resolution of 14 ha, that means we have between 285 and 6928 points to describe pre-disturbance conditions for each selected harvested agglomeration. Once harvested agglomerations had been chosen, we proceeded with extracting information from the classified satellite images. We were able to generate 50 scenes for 14 harvested agglomerations that corresponded to at least three post-disturbance time periods for each harvested agglomeration. The mean TSH dates varied between six months and 29 years, with 16 scenes of 0–10 years, 20 of 11–20 years, and 12 of 20–29 years (Table 1).

3.3. Pre-Disturbance States

As knowing the composition of the vegetation cover types that existed prior to the disturbance is important in explaining changes that take place afterwards, we used the SIFORT database to describe both vegetation composition and surficial deposits. One variable, describing the vegetation cover types before disturbance (combining the land class codes, stand composition types, disturbance origin, and age class), was created for each fire event and each harvest agglomeration. In order to standardize information codes available in SIFORT 1, 2, and 3, 11 vegetation cover types were defined (Appendix Table A1): bare humid, bare dry, open water, recently disturbed, deciduous regeneration, and conifer regeneration, with mature forest covers of shade-intolerant deciduous species, shade-intolerant deciduous species with conifers, jack pine, black spruce, and balsam fir. The surficial deposits and drainage class corresponding to the disturbed areas were also extracted from the SIFORT database. Surficial deposits and drainage were grouped in seven classes: rocky outcrops, tills, Cochrane tills, sand types, mesic clay, sub-hydric clays, and poorly drained and organic soils (Org) (Appendix Table A2).
As a first step, principal component analyses (PCA) were conducted in JMP 7.0.1 (Version 7.0.1, SAS Institute 2008, Cary, NC, USA) to assess whether fire events and harvested agglomerations were produced under (1) similar vegetation cover types and (2) similar surficial deposits and drainage conditions. According to [46], the PCA is an ideal technique for data with approximately linear relationships among variables. Its objective is to reduce a data set with n objects and p variables to a smaller number of synthetic variables that represent most of the information in the original data set. The structure of the ordination is based solely on the matrix of correlations among variables. Vegetation type or surficial deposit proportions were expressed for each fire event and harvested agglomeration.

3.4. Post-Disturbance Changes

We evaluated the post-disturbance changes using three different analyses. First, we looked at succession changes using the land cover type of the classified satellite images. Secondly, we assessed the rapidity of forest recovery by looking at four forest development stages that correspond to a recovery gradient of forests. Finally, we evaluated whether forest composition differs among disturbance types using composition information from the images.

3.4.1. Post-Disturbance Successional Pathways

In order to compare the post-disturbance recovery between a fire event and harvested agglomeration, we first produced a PCA ordination using the 48 post-fire and 50 post-harvest scenes and the land cover types of the satellite images (Appendix Table A3) as the vegetation descriptors. The successional vectors of change were created by joining the information of the same scene for successive time periods (corresponding to time since disturbance, TSD).

3.4.2. Rate of Forest Revegetation

To estimate the rates of forest revegetation of the disturbed areas, the 48 land thematic classes of satellite images were grouped based on the nature of cover type, stand cover density (open cover types vs. closed cover types), stand cover composition, and TDS abundance profile into four development post-disturbance stages (Appendix Table A3). The Stage 0 (S0: stand initiation phase) groups cover type still showed traces of recent disturbances such as burn or post-fire regeneration and were mostly abundant in the first 10 years after disturbance; regeneration Stage 1 (S1: early regeneration phase), representing the early stage of development, was composed of land cover types that corresponded mostly to low height shrub vegetation and also occurred mainly during the first 10 years after disturbance; Stage 2 (S2: stem exclusion phase) grouped young mixed forest cover types mostly characterized by mixed regeneration and open mixed cover with a deciduous component. This stage appears more frequently in the Landsat images of more than 10 years post-disturbance and can last up to 30 years post-disturbance a time where coniferous species start to dominate the canopy. Lastly, Stage 3 (S3: the coniferous forest) grouped coniferous forest cover types typically observed in black spruce-feather moss forest in which the canopy is dominated by black spruce and jack pine and corresponded to either residual habitats or revegetation generally established around 30 years following disturbance. The shaded, cloudy snow and ice classes, together with rocky outcrops and urban environment cover land classes, were grouped as ‘other’ and excluded from the analyses. This classification results from the metadata associated with the image classification and was confirmed by observation of successive images from the same scene for which TSD was known.
Forest revegetation rates were obtained from the overlap of two sequential classified satellite images of the same territory, corresponding to different times since the disturbance. For example, for a fire event that was disturbed in 1986, by superimposing the images of 2000 and 2005, we assess transition (changes of the stage) for all cells composing a fire. As forest succession did not follow a gradual process or evolution, the transitions from the initial stage to any of the successive ones were then pooled in three types of changes depending on the initial stage: from S0 to S1, S2, or S3; from S1 to S2 or S3; or from S2 to S3. The same exercise was applied for all the fire events and harvested agglomerations and the results were then reported over a fixed period of time (i.e., five years) for comparison purposes. The observed rates of revegetation in the fire events can therefore be compared with the harvested agglomerations. Arcsine-square root-transformation of the rate of revegetation (as a proportion) was performed prior to the statistical analysis, where a t-test was applied to determine how the mean rates of forest revegetation for fire events compared with the harvested ones.
To provide the most pairwise comparisons of forest revegetation after fire and forest harvesting, we compared the harvested agglomerations only with the fires that had burned mature forests. To do so, an analysis was conducted with ArcGIS 9.3 to identify the burned areas that had originated from mature forest cover available in the SIFORT database before the fire. In order to perform comparisons between post-fire and post-harvest, Landsat images taken between 10 and 29 years after disturbance were used.

3.4.3. Post-Disturbance Composition

In order to assess if post-disturbance compositions were similar, three groups were created according to the TSD for all harvested agglomerations and only the fire events that had burned at least 40% of the mature forest cover. Group 1 corresponded to a TSD of 0–13 years of age, group 2 to a TSD of 14–20 years of age, and group 3 consisted of TSD > 20 years of age. The 48 land thematic classes from Landsat were also grouped into four land cover types: (1) unproductive and non-forested land cover types, (2) recently disturbed, (3) coniferous, and (4) deciduous (Appendix Table A4). The unproductive and non-forested land cover types were excluded from these analyses.

4. Results

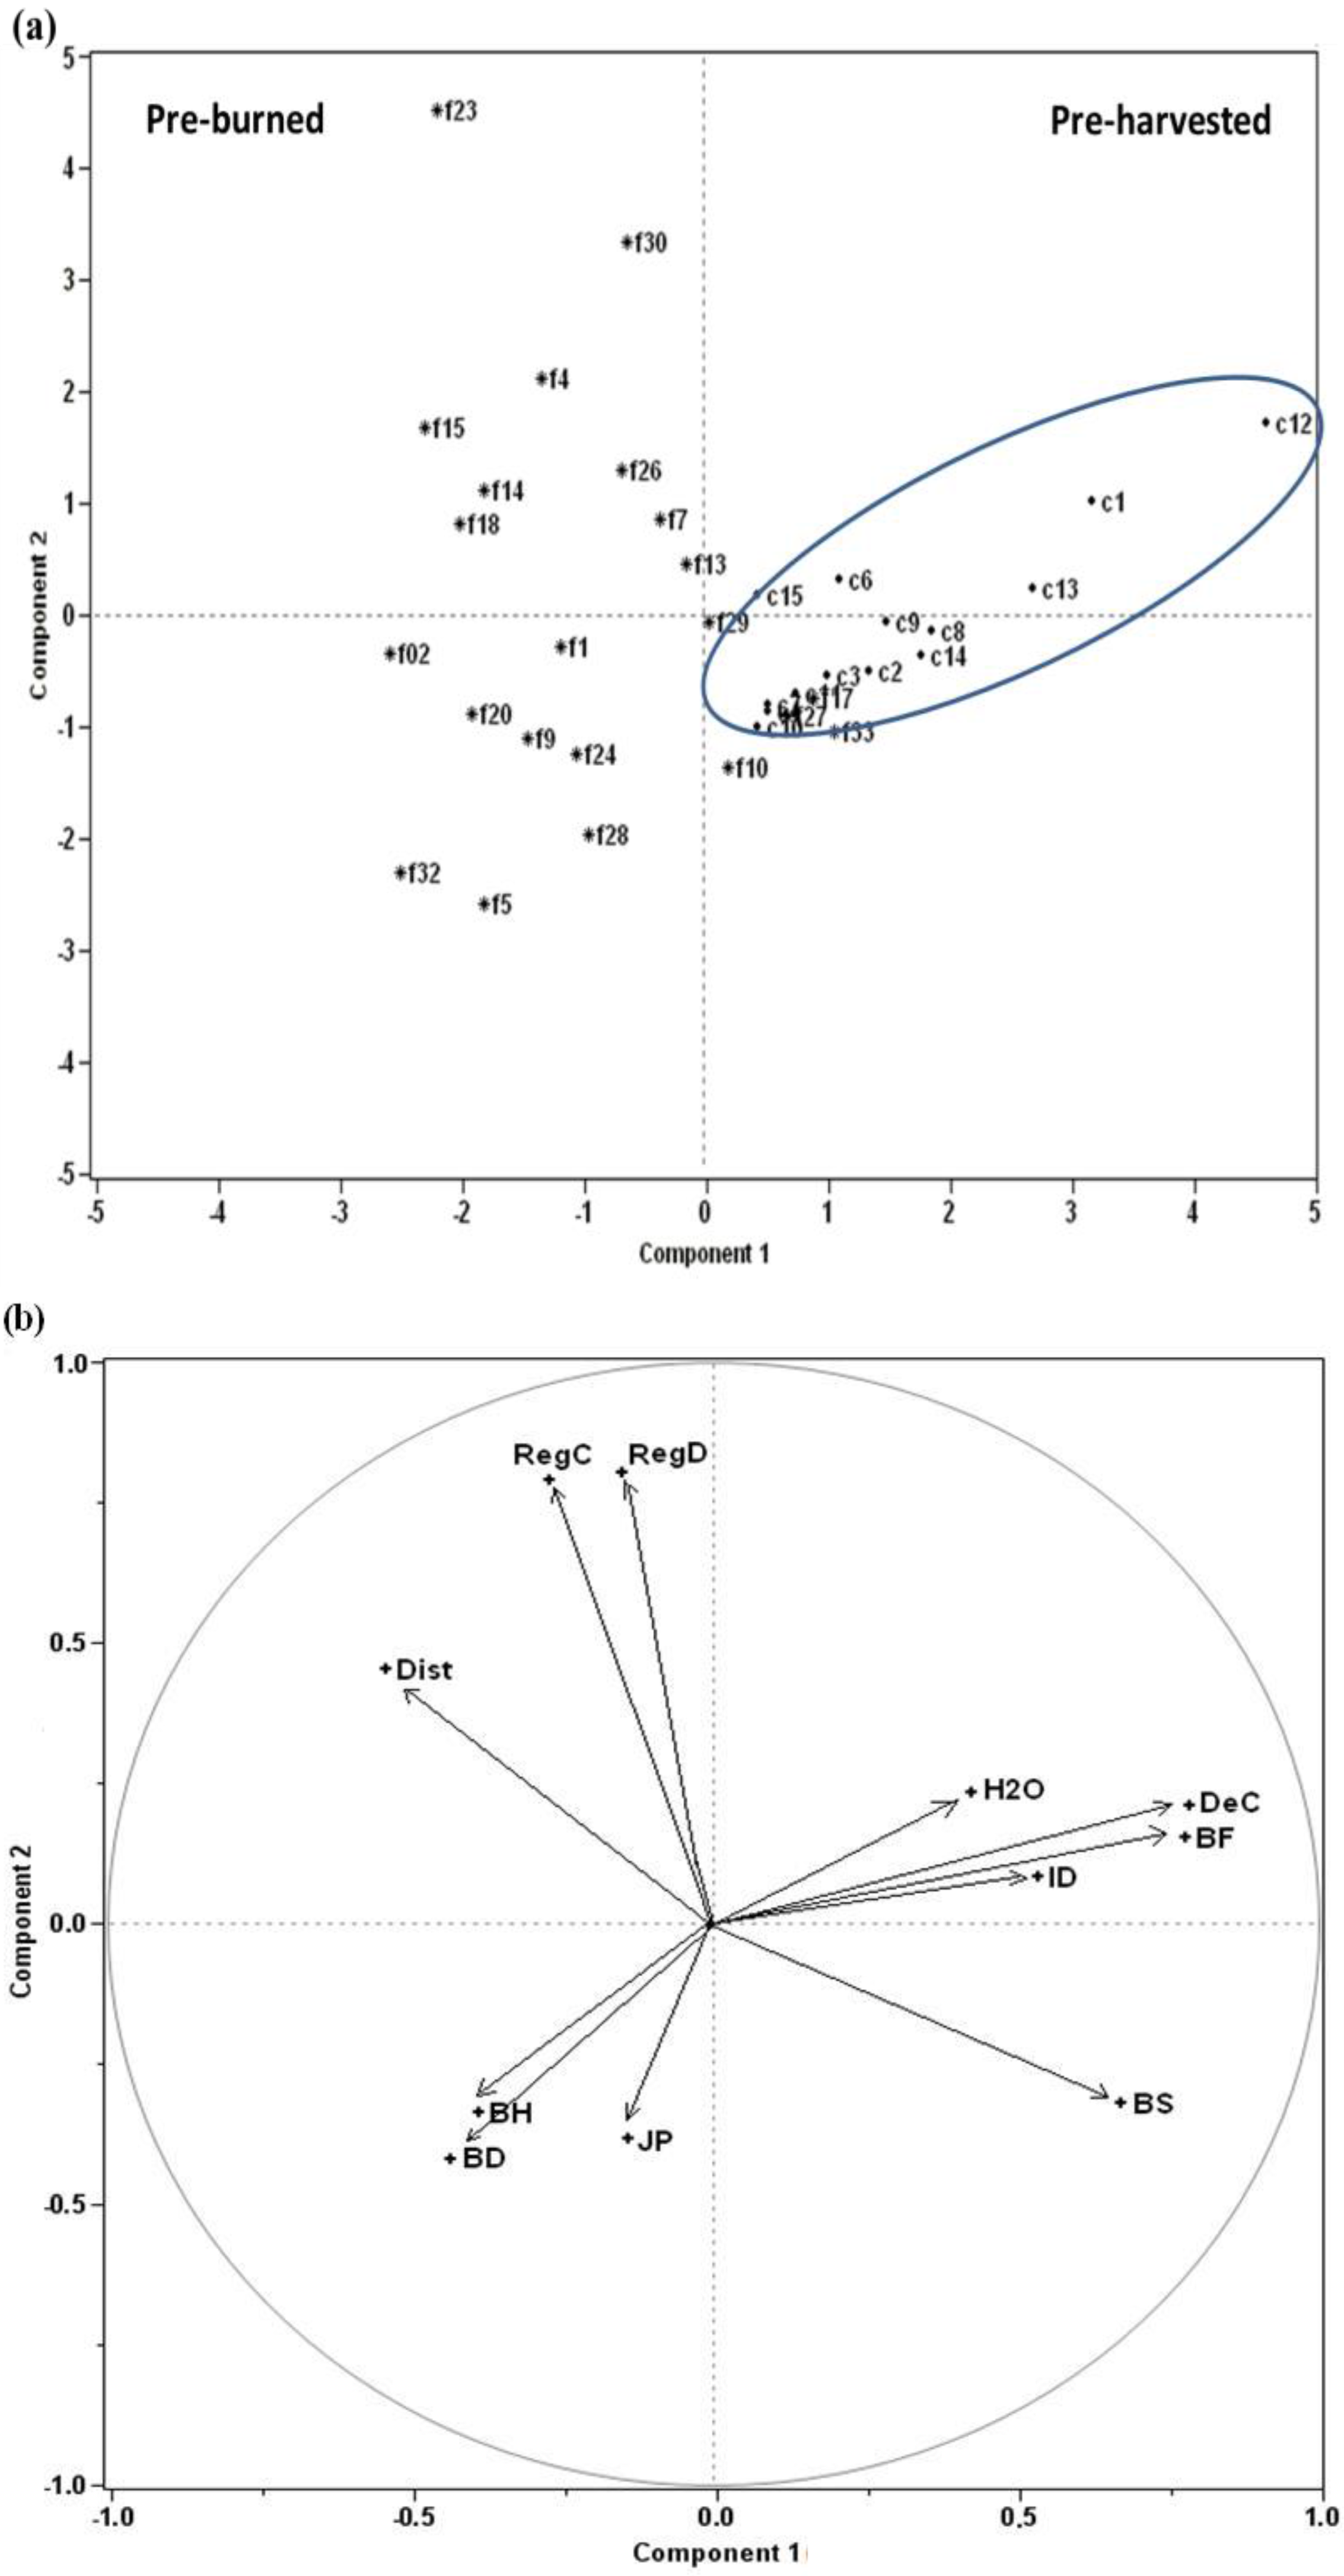
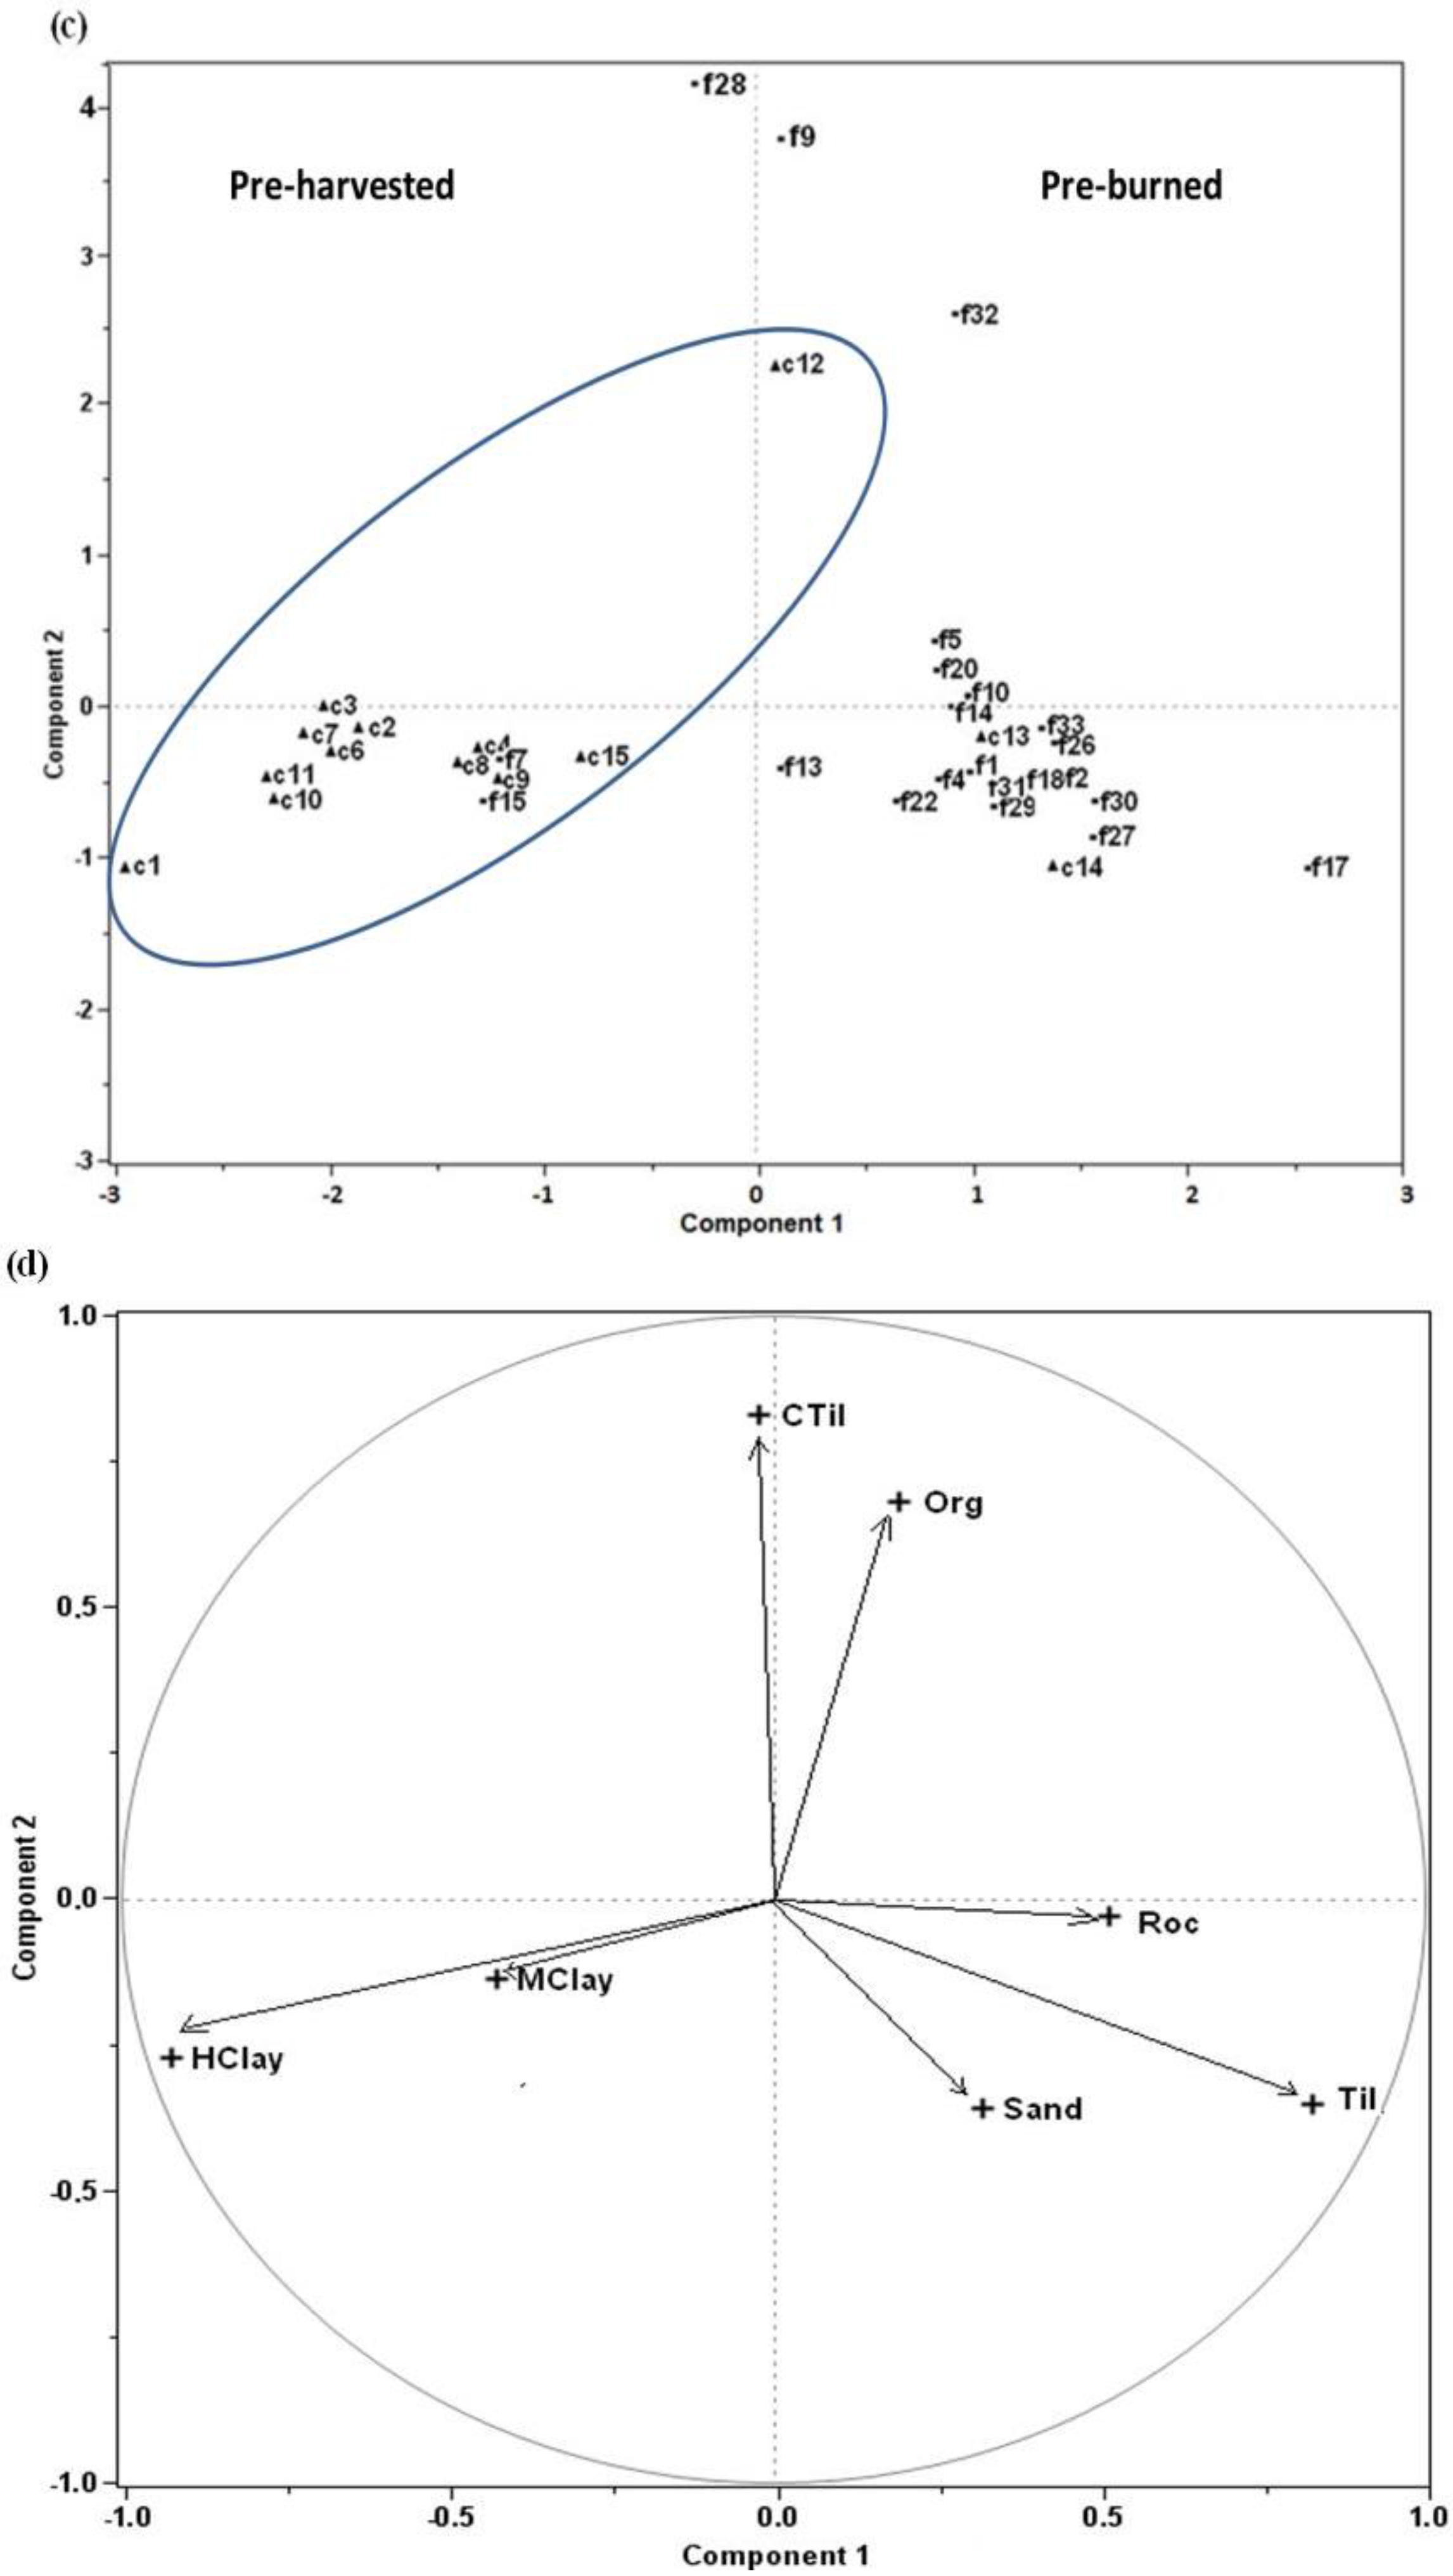
4.1. Pre-Disturbance States

The vegetation cover types clearly separated the pre-fire events from the pre-harvested agglomerations on the PCA ordination (Figure 3a). The pre-fire events are situated on the left side of axis 2, while the pre-harvested agglomerations are on the right. Overall, three fire events (f17, f27, and f33) and four harvested agglomerations (c4, c7, c10, and c11) overlapped near the center of the graph. This distinction between the two disturbances showed that vegetation cover types that are affected by fire and logging differ considerably. In fact, harvesting took place solely in mature deciduous and coniferous stands of dense and open mixed cover or, in other words, commercial forest (Figure 3b). The fires, in contrast, occurred in a variety of vegetation cover types that included mature forest cover (coniferous), low shrubs, and non-forested areas (woodlands, mosses, wetlands) (Figure 3b). Similarly, surficial deposits that were associated with certain vegetation cover types differed between the harvested agglomerations and burned events (Figure 3c). Harvested agglomerations were situated mainly on hydric (HClay) and mesic (MClay) clays, while fires occurred on a range of surficial deposits, including well- or excessively well-drained rocky outcrops, tills, and sandy soils (Figure 3d).
Figure 3. Results of two PCAs based on pre-disturbance vegetation cover types (a and b) and the types of surficial deposits (c and d) on which the two disturbances occurred for 22 fire events and 14 harvested agglomerations. Data derived from the SIFORT database. Each cover type or surficial deposit is described as its relative proportion (%) within its disturbed area. (a and c) Scores. The letters preceding numbers represent type of disturbance (f = fires; c = harvests), (b and d) Loadings. RegC (coniferous regeneration), RegD (deciduous regeneration), Dist (disturbance), ID (mature forest covers of shade-intolerant deciduous), BH (bare humid), BD (bare dry), JP (mature forest covers of jack pine), H2O (water), DeC (mature forest covers of shade-intolerant deciduous), BF (mature forest covers of balsam fir), BS (mature forest covers of black spruce), Roc (rocky outcrops), Til (tills), CTil (cochrane tills), Sand (sand types), MClay (mesic clay), HClay (sub-hydric clay), Org (organic soils).
Forests 06 04105 g003aForests 06 04105 g003b

4.2. Post-Disturbance Changes

4.2.1. Post-Disturbance Successional Pathways

The PCA ordination of post-disturbance land cover types shows the same distinction as the pre-disturbance one: for the most part, harvested agglomerations are distinct from the fire events (Appendix Figure A1a). The harvested agglomerations appear mostly to the right of the first axis while the fire events are on the left. Some older fire events are found on the right side with the harvests, such as f18, f4, f22, and f30. In addition, certain young harvested agglomerations are found on the left side with the fires, such as c4, c7, c8, c10, and c12. The harvested agglomerations are mostly linked to deciduous cover types (Appendix Figure A1b).
To control for time since disturbance, we compared six fire events (five fires that were 14 to 19 years old and one fire that was 24 to 29 years old) with 14 harvested agglomerations of similar age. The PCA shows that the harvested agglomerations are distributed according to a TSD gradient expressed by axis 1, separating the young harvests (to the left) from the old harvests (to the right) (Figure 4a,b). In the young harvests, we encounter an abundance of recently disturbed covers (harvests and post-harvest regeneration) compared with old harvests that were dominated by open deciduous species and dense mixedwood stands. In the six fire events, all post-fire stages are located in the lower left-hand region of the ordination, in close proximity to young harvests dominated by coniferous woodlands with moss, and moss and rock ground cover. The successional vector lengths of the six burns (in bold) are shorter and more diverse in direction than those of the harvests (Figure 4a). However, the harvest trajectory is longer and shows two patterns of recovery (evolutionary series): one generating mixed regeneration, while the second generates more open and humid areas, which are less forested (Figure 4b).
Figure 4. PCA showing successional pathways of post-disturbance land cover types of fire events and harvested agglomerations. Each land cover type is described using its relative proportion within the disturbed area. (a) Disturbance scores (fire events and harvested agglomerations). The digit represents the TSD (time since disturbance). The fire events (in bold) with pre-burned mature forest covers >40%. (b) Loadings of land cover types. CfRg (coniferous regeneration), Herb (perennial crops, pasture, fallow, grassland), DcRg (deciduous regeneration), DyDc (dense young deciduous), OmDc (open mixed deciduous tendency), Exl (exposed land), OCfmo (open coniferous with moss), DeDc (dense deciduous), MCfmo (medium coniferous cover with moss), DmDc (dense mixed deciduous tendency), MoRoc (moss and rock), BpBrHpHr (burn, post-burn regeneration, harvest, and post-harvest regeneration), Cwmo (coniferous woodland with moss), DmCf (dense mixed deciduous with coniferous tendency), ODc (open deciduous), DmCf (dense mixed deciduous with coniferous tendency), OmDcCf (open mixed deciduous and coniferous tendency), LSh (low shrubs), WlTr (wetland with tall shrubs and trees), MRg (mixed regeneration), Lic (lichens).
Forests 06 04105 g004aForests 06 04105 g004b

4.2.2. Post-Disturbance Forest Revegetation Rates

Among the 22 fires, only six fires presented at least 40% of mature forest cover in the fire event (f7, f10, f13, f28, f29, and f33) and a time since disturbance similar to what is observed in harvested agglomeration (Table 2). Comparison of forest revegetation rate was done between these six fire events (five that were 14 to 19 years old and one that was 24 to 29 years old) and nine harvested agglomerations (all 11 to 25 years old) of similar age (Table 3). When the entire area of each fire event is considered (Table 3a), the six fires show a lower revegetation rate compared with harvested agglomerations when starting from S0 (0.45 ± 0.15 vs. 0.76 ± 0.16) and S1 (0.58 ± 0.12 vs. 0.66 ± 0.11) (Table 3c). Note, however, that the S0 maturation stage appears rarely after harvesting (cover less than 10% of harvested area) since advanced regeneration was protected in harvesting operations. When starting from S2, in contrast, revegetation rates are very similar between the harvests and fires (0.11 ± 0.07 vs. 0.11 ± 0.06). The S2 maturation stage also appears relatively rare for both disturbance origins because of the young age of the compared areas (less than 20 years for most of them). When considering only the mature forest portion of the fire events, the rate of revegetation from S1 (0.64 ± 0.1), the most important initial stage for both disturbance origins, appears more similar to the rate that was calculated for the harvested ones (0.66 ± 0.11) (Table 3b,c).
Table 2. Amount of mature cover (%) in pre-disturbed areas. The “mature” forest covers were considered when black spruce (BS), jack pine (JP), shade-intolerant deciduous species (Fi), shade-intolerant deciduous species with conifers (DeC), and balsam fir (BF) were present. In bold, fire events with >40% pre-disturbance mature forest cover and for which TSF (time since the last fire) is estimated between 14 and 19 years. *TSF was estimated to be between 24 and 29 years.
No fireMature cover (%)No harvestMature cover (%)
f28*75.7c1088.3
f1075.3c0483.7
f3372.1c0783.1
f2167.7c1182.5
f2767.7c0280.3
f1765.7c0377.6
f161.4c0877.5
f2954.3c0976.6
f550.8c1276.5
f1348.7c1472.3
f748.4c1572.3
f2037.5c1371.1
f2626.2c0660.5
f922.1c0158.3
f417.9
f3016.9
f1414.5
f214.1
f2212.9
f1812.4
f1511.2
f3210.7
Table 3. Comparison of revegetation rate (over a five-year period) between burned (14 to 29 years old) (a) for the entire area of fire events, (b) for the fires that burned only in the mature forested portion, and (c) harvested (10 to 25 years old) agglomerations. Means and standard deviations (SD) are included for each type of change.
(a)
FiresPeriodForest revegetation rate (over a five-year period) for each type of change
S0 to S1-S2-S3S1 to S2-S3 S2 to S3
f1014–190.370.470.17
f3314–190.430.600.21
f2824–290.760.410.04
f2914–190.400.670.11
f714–190.340.740.03
f1314–190.410.570.12
Mean 0.450.580.11
SD 0.150.120.07
(b)
FiresPeriodRevegetation rate (over a five-year period) for each type of change
S0 to S1-S2-S3S1 to S2-S3S2 to S3
f1014–190.370.470.17
f3314–190.460.660.21
f2824––290.740.460.04
f2914–190.400.730.10
f714–190.330.720.01
f1314–190.430.680.11
Mean 0.460.640.11
SD 0.140.100.08
(c)
HarvestPeriodRevegetation rate (over a five-year period) for each type of change
S0 to S1-S2-S3S1 to S2-S3S2 to S3
c420–250.530.800.03
c619–240.530.620.04
c812–170.910.760.15
c915–200.920.650.09
c1014–190.800.530.08
c1110–150.740.610.07
c1211–160.940.600.18
c1313–180.660.520.17
c1412–170.850.810.21
Mean 0.760.660.11
SD 0.160.110.07
In terms of statistical inference, the revegetation rate of the S0 initial stage appears faster after harvesting than after fire (p = 0.001 for S0 initial stage). This difference is significant when we consider only the mature forest portion of the pre-fire event or the entire burned area. For the S1 initial stage, the difference appears quasi-significant when we compare the revegetation rate of the entire area of the fire event to the harvested agglomeration (p = 0.107), and becomes non-significant if we consider only the mature forest portion of the fire event (p = 0.488). As expected by the simple comparison of their mean values, the revegetation rate of the S2 initial stage shows no significant difference between the fire event and harvested agglomeration.

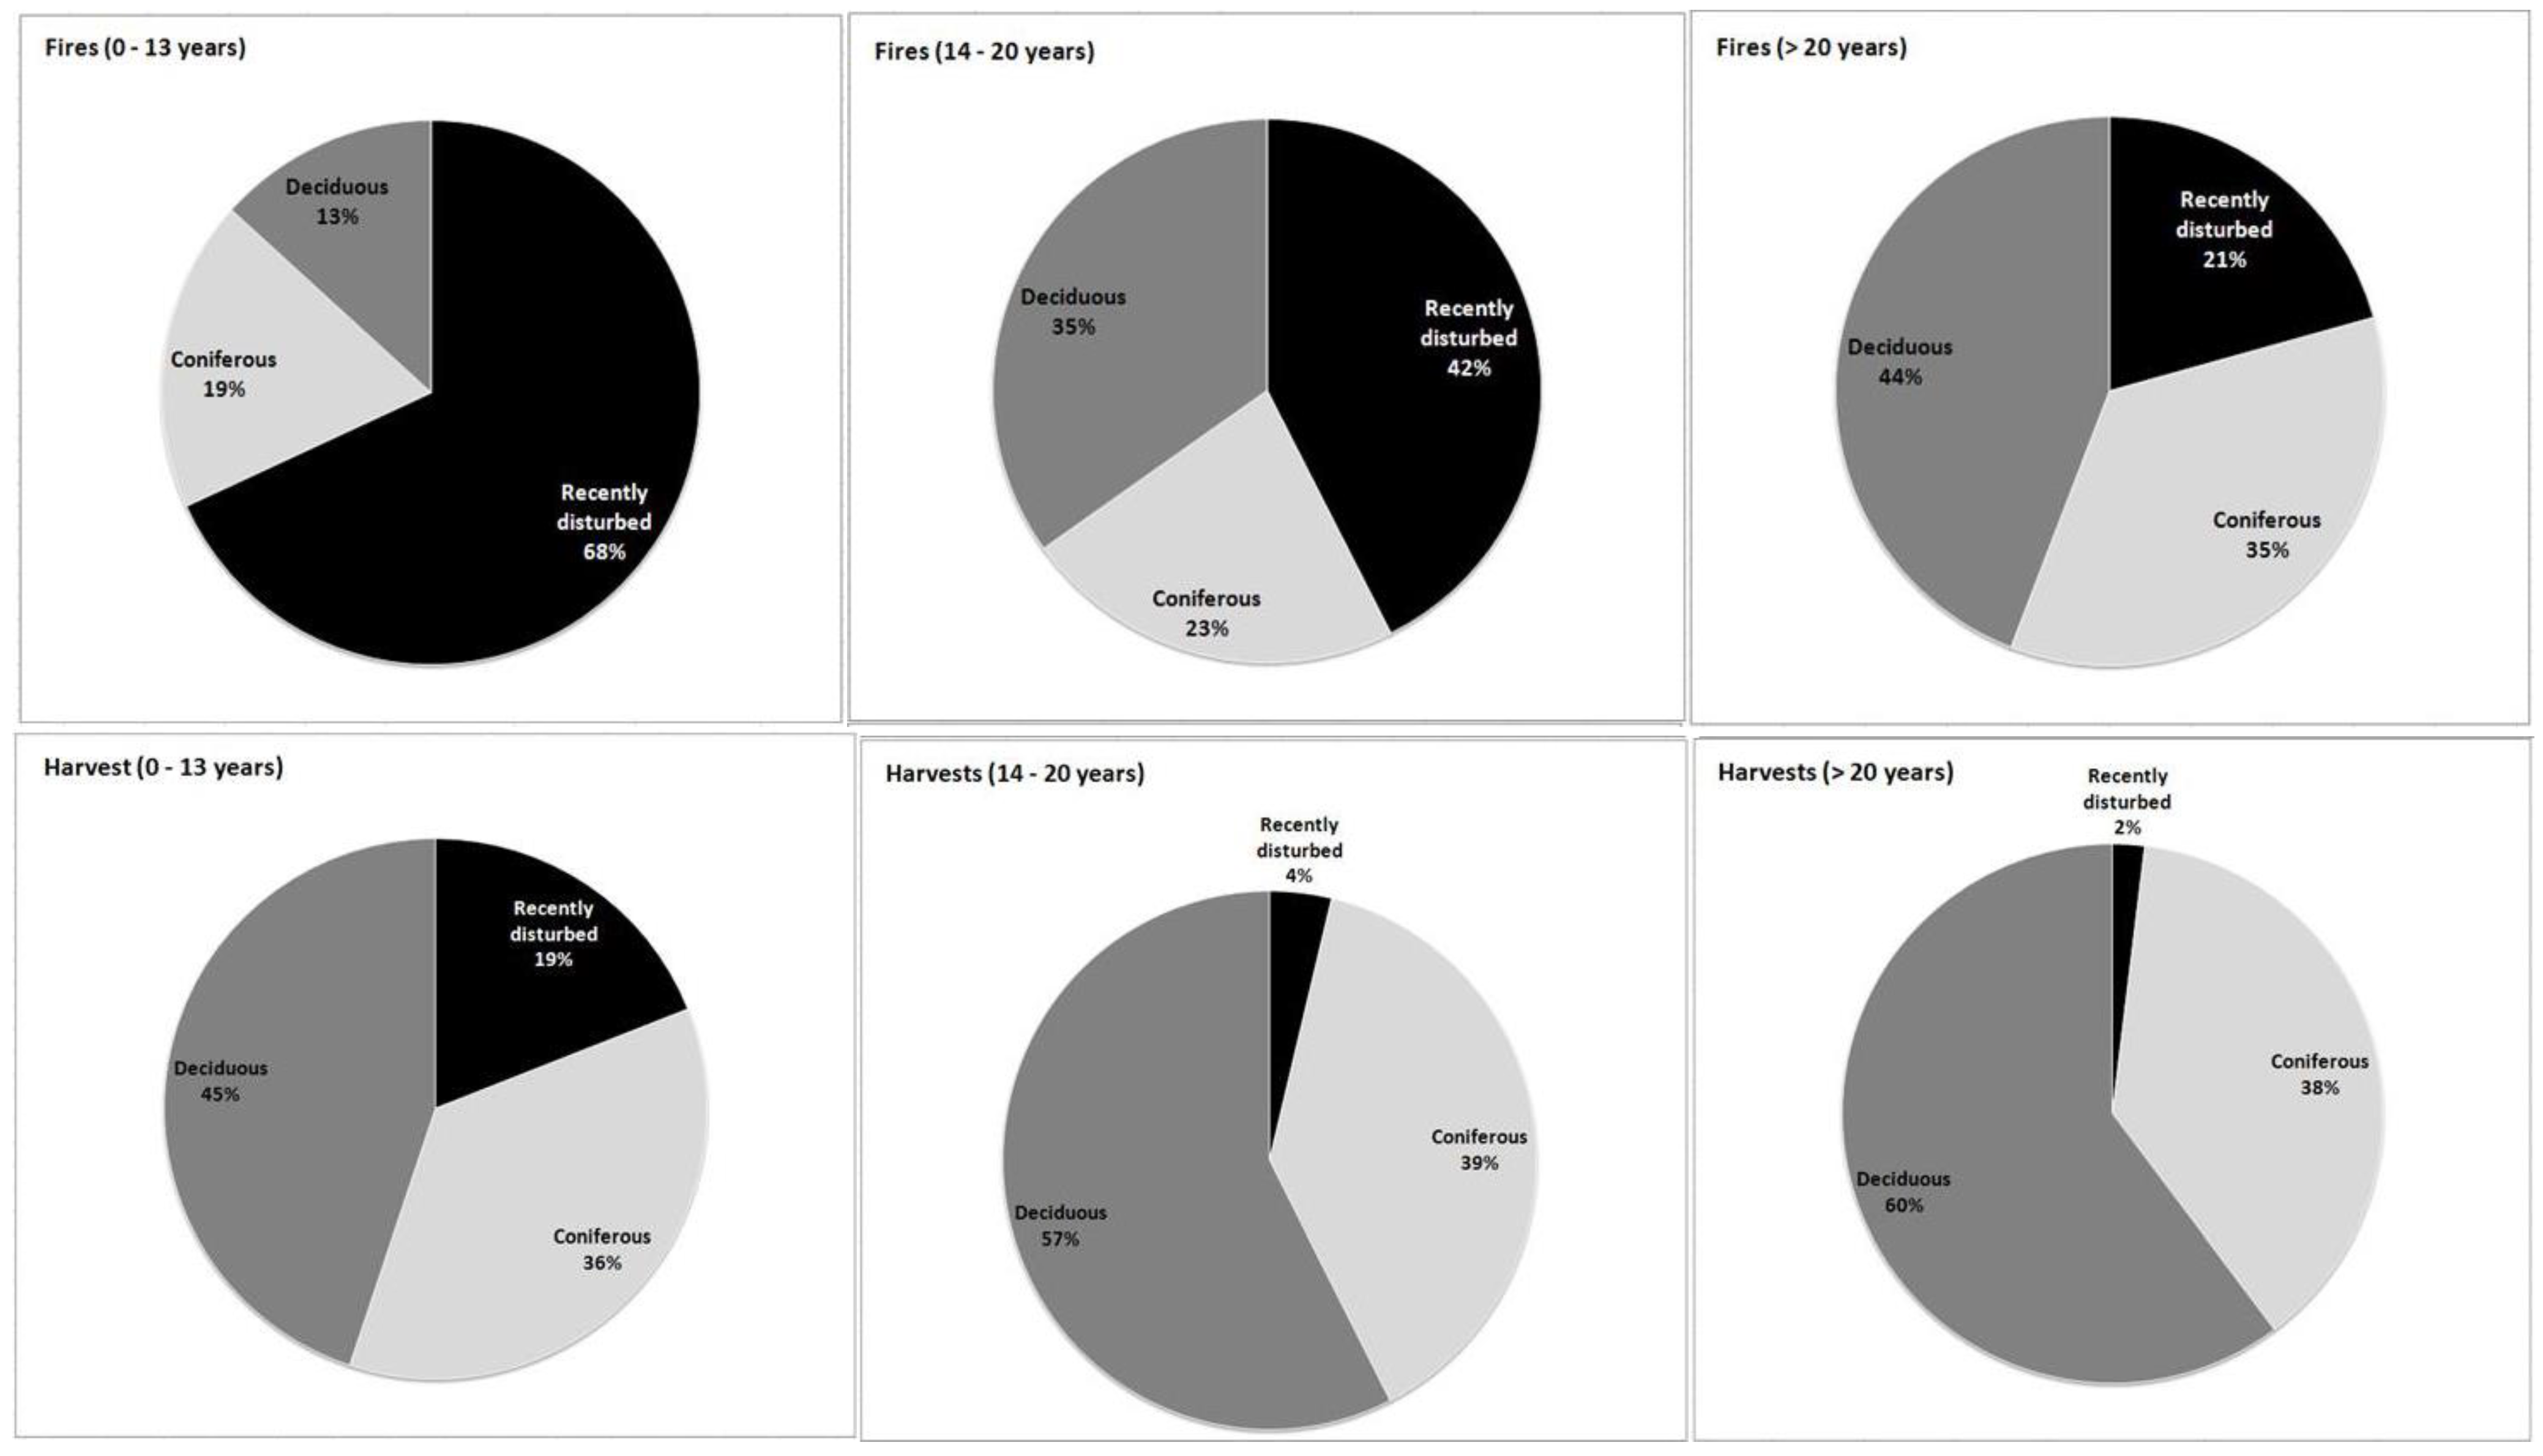
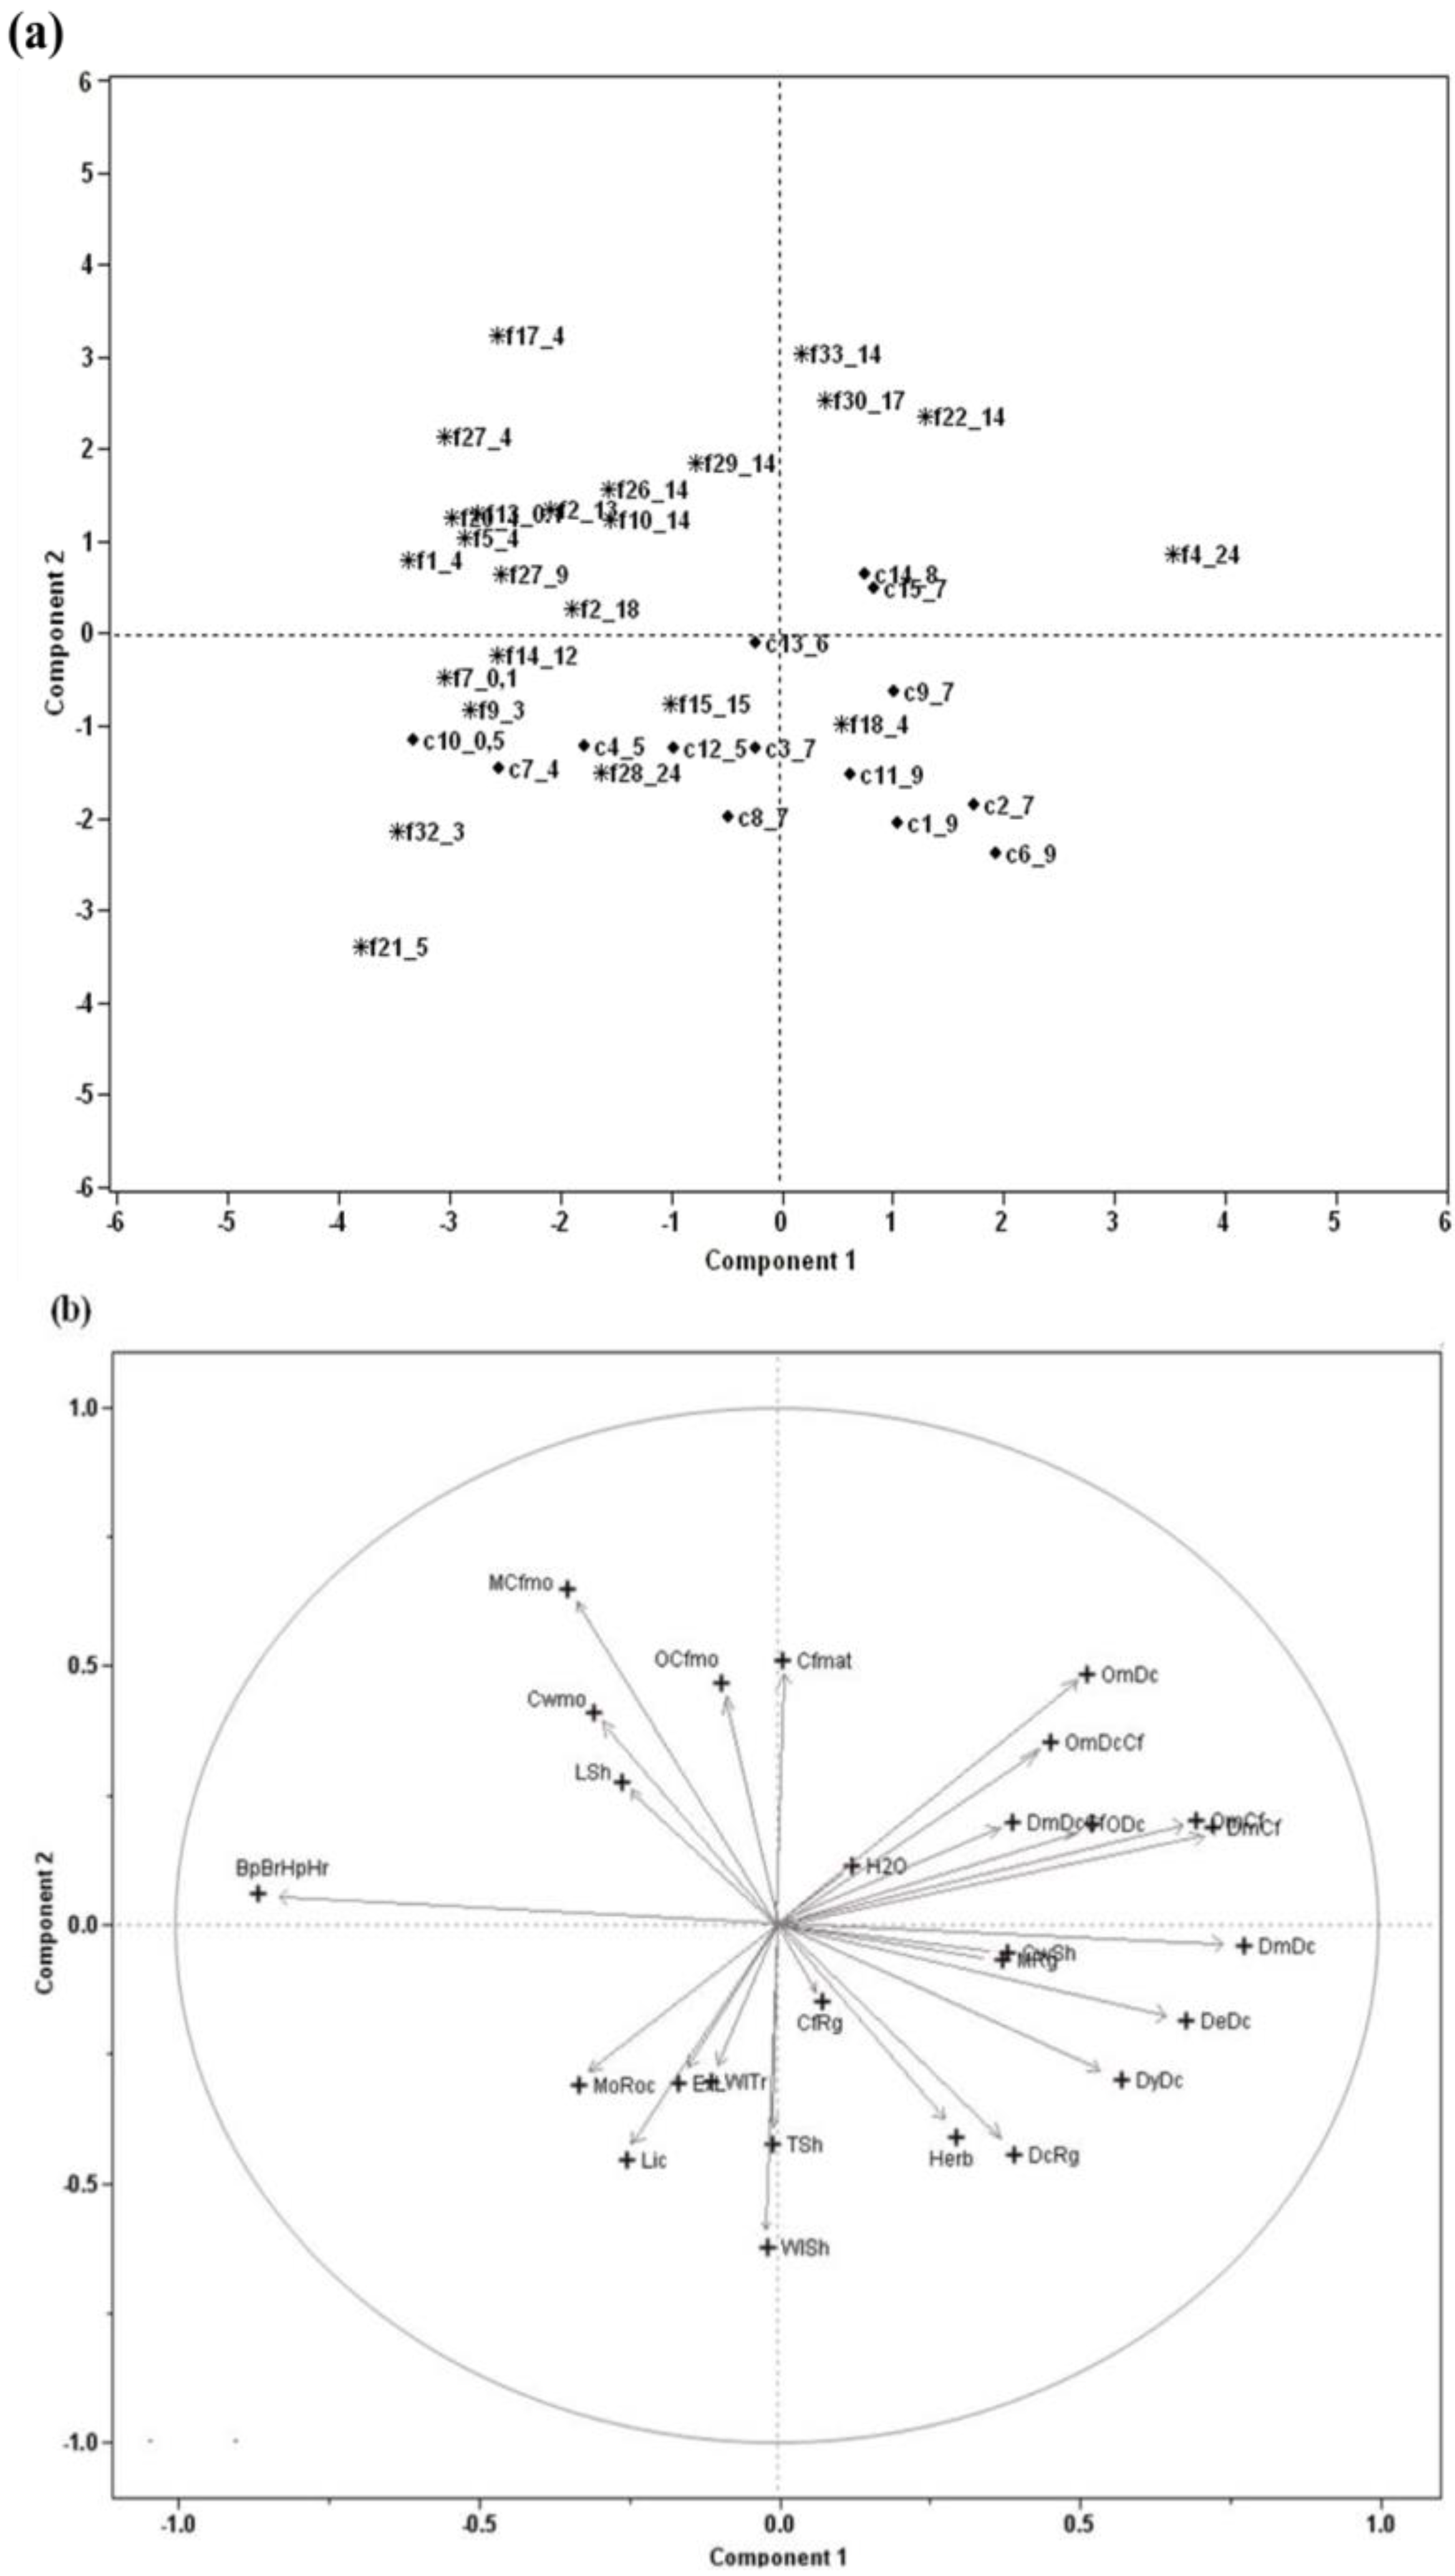
4.2.3. Post-Disturbance Composition

Cover composition comparisons were made using fires that had at least 40% of mature forest prior to the disturbance. Land cover composition for areas aged between 0 and 13 years following fire was largely dominated by the recently disturbed class (68%), followed by coniferous (19%) and broad-leaf tree species (13%) (Figure 5). Following harvest, broad-leaf vegetation dominates (45%), followed by conifers (36%), with the recently disturbed class representing only 19%.
Figure 5. Comparison of cover composition between fire events and harvested agglomerations in three TSD classes. Only fires that had burned at least 40% of mature forest cover prior to the disturbance have been analyzed.
Forests 06 04105 g005
For fire events that were aged 14 to 20 years following the fire, the recently disturbed class is also dominant (42%), followed by broad-leaf tree species (35%) and conifers (23%). Following harvest, broad-leaf tree species remain more dominant (57%), followed by conifers (39%). The recently disturbed class decreases substantially to 4% of the harvested area.
In post-fire events exceeding 20 years of age, the recently disturbed class decreases (21%), and broad-leaf tree species (44%) and conifers (35%) increase in the burned area. Similarly, the recently disturbed class decreases in harvested stands until 2%, leading to dominance by broad-leaf tree species (60%) and conifers (38%).

5. Discussion

Although many studies have used satellite imagery to characterize revegetation dynamics after major disturbances (e.g., [47,48,49]), to our knowledge, none have compared post-fire and post-harvest revegetation on a large scale in the boreal forest. The use of temporal satellite images has limitations related to classification accuracy due to a complexity of spectral characteristics of the Earth’s surface [50]. Spectral response is influenced by factors such as the species mixture, canopy closure, and understory contribution [51]. These factors produced a broad range of spectral values and textures related to one stand structure instead of its composition. For example, [52] found low accuracy classifying from Landsat images of mixed stands, and [53] found that stand age and height influence the overall canopy and understory reflectance values. Adding textural information during the classification process can improve classification accuracy by 12% or more [54]. Among remote sensing analysis methods, geographic object-based image analysis is considering a promising approach [55,56]. This approach integrates image segmentation and classification and radiometric and textural image attributes that reduce the level of subjectivity by the analyst as used in Enhancement-Classification Method (ECM) [31].
We trust that these weaknesses are not major factors in our analysis, however. First, our analysis was made on part of the eastern boreal forest only, and concerned areas that had recently been disturbed only, reducing the variability in forest types as compared to larger areas. The ordination performed on all land cover types also showed a clear discrimination between fire events and harvested agglomerations, suggesting that post-disturbance vegetation dynamics follow different pathways depending on the disturbance origin. Furthermore, succession rates were assessed on differences between highly contrasted land cover types that characterize canopy closure over the first 30 years in black spruce-feather moss forest (see Appendix Table A3). For instance, Stage 1 (S1: early regeneration) and Stage 2 (S2: stem exclusion) are grouping several of the 48 thematic classes and have spectral values associated with shrub vegetation or mixed forest cover types, respectively. These highly contrasted classes constitute a robust grouping. Finally, results reported in this study were mainly based on a comparison between fire events and harvested agglomerations. As land cover types that constitute each of our successional stages appeared in both disturbances, it would be surprising that the highlighted differences could result from an unbalanced distribution in error rates between the two disturbance types.
Concerning the pre-disturbance state, the environments in which fire and harvesting occur may differ over space and through time. Fires are not “very selective”, occurring in the spring and summer more or less randomly within the landscape [57,58,59]. Logging operations take place in the mature forest fraction of the landscape, and tend to be conducted on productive sites. Our results show that fires occurred in a higher diversity of environments without any noticeable distinction in the vegetation cover, thereby confirming the random nature of fires in the boreal forest. Madoui et al. [60] also showed that fires can propagate in non-productive forested areas (open wetlands) under extreme meteorological conditions. In fact, surficial deposits and landscape configuration strongly contribute to how succession takes place [20,61,62,63]. It is evident that differences in forest cover composition and the surficial deposits of harvested or fire events could explain the results that we obtained. Lafleur et al. [29] found that stocking after harvest is affected more strongly by soil type than by harvesting method.
Considering that post-disturbance succession is largely influenced by the severity of the disturbance and pre-disturbance vegetation [14,62], the non-productive forested character of the vegetation cover prior to the fire could explain some apparent regeneration failures seen after fires. As harvesting occurs almost exclusively in productive forest, this type of problem is less likely to be observed in these landscapes, although the survival of pre-established regeneration could be influenced not only by harvesting but also by the changes that the site undergoes after logging [64].

5.1. Post-Disturbance Recovery

The differences in land cover dynamics between post-fire and post-harvest disturbances could be attributable predominantly to variation in the biological legacies left behind after these types of disturbances [65]. In comparing the different scenes taken after fire and harvesting during the 30 years following the disturbance using successional vectors, we noticed that fire events show little change in their land cover types. The harvests show more change in vegetation composition and their successional pathways appear to be much longer. Even though harvested agglomerations appear at a more advanced stage of recovery than burned areas of a similar age, harvesting favors the establishment of an immature deciduous stage that could delay the return of coniferous cover.
These differences between post-fire and post-harvest forest recovery are best illustrated through ordination, which includes harvests and only the fires that occurred mostly in productive forests (Figure 4). The short successional vectors of fires suggest that their vegetation covers undergo little change. In fact, according to [66], the short successional vectors of fires reflect a re-establishment of forest stands by the same species, especially the relatively mono-specific tendency of jack pine. The revegetation rate of the forest cover in fire events occurs differently when compared with the mature logged areas. From one standpoint, the harvested agglomerations consist of very few stand initiation areas (stage 0) in comparison with fire events of a similar age. The fires, especially when severe, return the ecosystem to its initial stage of development by burning the humus layer, thereby exposing the mineral soil and destroying competing vegetation. Logging operations protect the humus layer and understory vegetation [11], which explains why S0 is practically absent from harvested agglomerations. This advanced recovery in logged areas is also seen in S1 but to a lesser extent. This can be explained by the fact that the fires extend over heterogeneous environments (productive and unproductive vegetation cover) such as wetlands and lichen ground covers, among others. The surge in regeneration in environments with low productivity would then be weaker than in forested sites. Forest harvesting occurs only in the productive forest fraction of the harvest agglomeration, in which sites with low productivity are absent. This is consistent with what the analysis of the forested fraction suggests for fire events; it shows that revegetation rates are similar to those of the harvested agglomerations when considering the transition from S1 and from S2. These results suggest that the limitations of post-fire revegetation could be attributed to the state of the vegetation cover prior to fire more than to the effect of fire per se.

5.2. Post-Disturbance Composition

In the first 13 years following fire, burned areas differed in land cover composition from harvested ones. The recently burned class dominates the post-fire events, whereas the broad-leaf and coniferous classes dominate the harvested agglomerations. In fact, fire events begin regenerating on soils devoid of vegetation (primary stage of succession), whereas harvested agglomerations already contain established vegetation, which explained the abundance of conifers. In early stages of succession, harvested stands that were harvested using CLAAG contain a relatively larger coniferous component than burned stands do, due to the protection of advanced coniferous regeneration. When examining fire events and harvested agglomerations in this age class (0 to 13 years old), we observe that half (50%) of the fire events that were sampled could be dated between four or five years following disturbance, compared with only 19% in the harvested agglomerations. This response could explain the dominance of the recently disturbed stage following fires, representing the period prior to conifer establishment. At this stage, low shrubs and post-fire regeneration are dominant.
Between 14 and 20 years following disturbance, fire events are still in the process of recovery, which would explain the dominance of the recently burned class. Conversely, this component is negligible in harvested stands. At this age stage, the deciduous component dominates harvested stands. This has been observed and supported by several authors; indeed, Harvey and Bergeron [17] found that, following harvest, a significant reduction in conifer density was observed, which led to a mixed species composition or dominance by hardwoods.
At an older age (>20 years), vegetation closure is more pronounced in harvested versus burned stands. In harvested agglomerations, we did not observe any large changes in stand composition, except in the recently disturbed class, which disappears in favor of an increase in the hardwood component. In contrast, the coniferous component of burned stands increases at the expense of the recently disturbed class. Additionally, small conifers that may have been hidden by low shrubs in early stages of succession begin to emerge as the canopy closes. This especially applies to black spruce, which exhibits slow juvenile growth rates. Thus, it may take several years to meet or exceed the height of shrubs [67], which would permit detection on satellite imagery.

6. Conclusion

Our work showed that forest recovery after fire and harvesting appears to be different both because succession does not start at the same development stage, and because fire occurs in environments that are more heterogeneous than harvesting. It is recognized in the literature that, in the case of a severe fire, the forest ecosystem would reinitiate succession, whereas after harvest, the same ecosystem is already in advance from a successional viewpoint due to the low impact of the disturbance on the understory. During the first 20 years following a disturbance, the fire events evolve slowly, while the harvest agglomerations display a much faster succession. The short succession vectors of fires reflect a re-establishment of forest stands with the same species composition. However, the harvested agglomeration trajectories are longer and generally show two patterns of recovery, in which one results in mixed regeneration while the other tendency shows the onset of open landscapes. Although the differences exist early after the disturbances, we cannot assess if differences in future stand development over the long-term would remain, as we do not have post-disturbance stands older than 30 years. We showed, however, that the post-disturbance vegetation cover observed in fires that mostly burned in mature forested fractions (i.e. pre-fire productive forest) achieved closure just as quickly as that observed in the harvested agglomerations. This suggests that the perceived difference in the rapidity of canopy closure after fire compared with that following harvesting is partly attributable to the fact that fires burn in heterogeneous environments in which areas are less productive than those affected by harvesting. Therefore, the recovery problems that are often attributed to a direct effect of the last fire event could be better explained by pre-disturbance conditions. Our results therefore suggest that these factors need to be considered when comparing the forest recovery after fire or harvesting.

Acknowledgements

The original data set was obtained from the MFFPQ (Ministère des Forêts, de la Faune et des Parcs du Québec) and Natural Resources Canada, and we especially thank Julie Fortin (Direction de l’environnement et de la protection des forêts) for providing provincial fire data and André Beaudoin (Canadian Forest Service) for providing satellite imagery. We also thank Mélanie Desrochers for her assistance with GIS, Steve Cumming and Nicolas Mansuy for useful comments, and William F.J. Parsons and Pameal Cheers for English editing. We are most grateful to the Centre d’étude de la forêt (CEF) and Canadian Forest Service staff for logistical support. Le Fonds québécois de la recherche sur la nature et les technologies de Québec (FQRNT) and Université du Québec à Montréal (UQAM) (Bourse d’excellence) provided financial support. We finally thank the reviewers and associate editors for their comments.

Conflicts of Interest

The authors declare no conflict of interest.

Appendixes

Table A1. Grouping of the vegetation cover types based on SIFORT.
Original code*New codeDesignation
DHBHBare humid
ME 90
DSBDBare dry
EAH2OWater
E 90BSBlack spruce
BB 90IDShade-intolerant deciduous
FI 90
TR 90
BBR 90DeCShade-intolerant deciduous with coniferous
FIPG 90
FIR 90
TRR 90
BRDistDisturbance
CH
BR 10
CT10
EPG 90JPJack pine
PG 90
PGE 90
FI 30RegDDeciduous regeneration
FIPG 30
FIR 30
FIR30
E 30RegCConiferous regeneration
EPG 30
PG 30
PGE 30
S 30
S 90BFBalsam fir
*DH, Bare humid; ME, Larch; DS, Bare dry; EA, Water; E, Black spruce; BB, Paper birch; FI, Shade intolerant deciduous; TR, Trembling aspen; BBR, Paper birch, conifers; FIPG, Shade-intolerant deciduous, jack pine; FIR, Shade-intolerant deciduous, conifers; TRR, Trembling aspen, conifers; BR, Burned; CH, Windthrow; CT, Clearcut; EPG, Spruce, jack pine; PG, Jack pine; PGE, Jack pine, spruce; FIPG, Shade-intolerant deciduous, jack pine; S, Balsam fir. The numbers 10, 30, and 90 correspond to the ages. (Source: SIFORT).
Table A2. Grouping of the surficial deposits based on SIFORT.
Surficial deposit codesDesignation
R; RLA; R7; R7T; RAA; RS, M1A; 1ARRocky outcrop
1AM;Till
1AA; 1AAMCochrane till
2A; 2AE; 2AK; 2BE; 3AN, 4GS, 5S, 6S, 9SSand type
5A; 4AMesic clay
4GA4Sub-hydric clay
7E; 7TPoorly drained and organic soil
Table A3. Successional stages based on land cover types from satellite imagery and mean relative occupancy (%) of each land cover type by disturbance type.
EOSD ClassSuccessional stagesDesignationCodeFire eventsHarvested agglomerations
1OthersShadowShd1,50.3
2 CloudsCld2.41.3
9Unproductive and non-forested land typesWaterH2O1.92.3
5Exposed landExL0.71.1
19LichensLic4.00.3
20Moss and rockMoRoc1.60.4
24Wetland with herbsHbWl0.80.4
18 Herb (perennial crops, pasture, fallow) grasslandHerb-0.9
31 Coniferous woodland with lichenCwLi0.30.1
32 Coniferous woodland with mossCwmo2.31.5
45 Coniferous woodland with shrubsCwSh0.42.8
7 
Stand initiation
Stage 0
BurnB36.80.2
8HarvestedH-3.8
15Post-fire regenerationPBr20.91.1
16Post-harvest regenerationPHr5.84.0
14Low shrubsLSh4.01.0
10 
 
Early regeneration
Stage 1
Tall shrubsTSh1.01.0
11Coniferous regenerationCfRg0.53.3
12Deciduous regenerationDcRg0.24.5
48Dense young deciduousDyDc-1.6
40Open mixed coniferous tendencyOmCf0.73.4
41Open mixed deciduous and coniferous tendencyOmDcCf0.20.7
26Young coniferousYCf-0.4
23Wetland with shrubsWlSh1.92.5
13 
 
Stem exclusion
Stage 2
Mixed regenerationMRg5.523.0
33Dense deciduousDeDc-3.0
34Open deciduousODc0.63.4
36Dense mixed deciduous tendencyDmDc-4.4
38Dense mixed deciduous with coniferous tendencyDmDcCf0.10.5
39Open mixed deciduous tendencyOmDc1.44.1
22Coniferous stands
Stage 3
Wetland with tall shrubs and treesWlTr4.53.7
25Dense coniferous matureDCfmat0.81.6
27Medium coniferous cover with mossMCfmo2.21.7
28Medium coniferous cover with lichenMCfli0.30.2
29Open coniferous with lichenOCfli0.50.3
30Open coniferous with mossOCfmo3.74.5
37Dense mixed coniferous tendencyDmCf0.610.7
Table A4. Post-disturbance types of land cover composition used.
Unproductive and non-forested land typesRecently disturbedConiferousDeciduous
WaterBurnTall shrubsMixed regeneration
Exposed landHarvestConiferous regenerationDense deciduous
LichensPost-fire regenerationOpen mixed coniferous tendencyOpen deciduous
Moss and rockPost-harvest regenerationYoung coniferousDense mixed deciduous tendency
Wetland with herbsLow shrubsWetland with shrubsDense mixed deciduous with coniferous tendency
Herb (perennial crops, pasture, fallow, grassland) Wetland with tall shrubs and treesOpen mixed deciduous tendency
Coniferous woodland with lichen Dense coniferous matureDeciduous regeneration
Coniferous woodland with moss Medium coniferous cover with mossDense young deciduous
Coniferous woodland with shrubs Medium coniferous cover with lichenOpen mixed deciduous and coniferous tendency
Open coniferous with lichen
Open coniferous with moss
Dense mixed coniferous tendency
Figure A1. PCA showing the post-disturbance of the land cover types from images of 22 fire events and 14 harvested agglomerations. Each cover type was described using its relative proportion in the disturbed area in the PCA (a) Scores: f = fires; c = harvests. First digit = number of disturbances; the second one = time since the last disturbance. (b) Loadings (land cover types). MCfmo (medium coniferous cover with moss), DCfmat (dense coniferous mature), OmDc (open mixed deciduous tendency), OCfmo (open coniferous with moss), Cwmo (coniferous woodland with moss), OmDcCf (open mixed deciduous and coniferous tendency), LSh (low shrubs), DmDcCf (dense mixed deciduous and coniferous tendency), OmCf (open mixed coniferous tendency), ODc (oOpen deciduous), DmDf (dense mixed coniferous tendency), H2O (water), BpBrHpHr (burn, post-burn, harvest and post-harvest), DmDc (dense mixed deciduous tendency), CwLi (coniferous woodland with lichen), MRg (mixed regeneration), CfRg (coniferous regeneration), DeDc (dense deciduous), MoRoc (moss and rock), ExL (exposed land), DyDc (dense young deciduous), TSh (tall shrubs), Herb (perennial crops, pasture, fallow, grassland), Lic (lichens), DcRg (deciduous regeneration), WiSh (wetland with shrubs). Note that the recent disturbances of fires and harvests (BpBrHpHr) deviate from the rest of the disturbed types.
Forests 06 04105 g006

References

  1. Bergeron, Y.; Engelmark, O.; Harvey, B.; Morin, H.; Sirois, L. Key issues in disturbance dynamics in boreal forests. J. Veg. Sci. 1998, 9, 463–610. [Google Scholar] [CrossRef]
  2. Johnson, E.A. Fire and Vegetation Dynamics: Studies from the North American Boreal Forest; Cambridge University Press: New York, USA, 1992. [Google Scholar]
  3. Payette, S. Fire as a controlling process in the North American boreal forest. In Systems Analysis of the Global Boreal Forest; Shugart, H.H., Leemans, R., Eds.; Cambridge University Press: Cambridge, UK, 1992; pp. 144–169. [Google Scholar]
  4. Heinselman, M.L. Fire in the virgin forest of the Boundary Waters Canoe Area, Minnesota. Quat. Res. 1973, 3, 329–382. [Google Scholar] [CrossRef]
  5. Bergeron, Y. The influence of island and mainland lakeshore landscapes on boreal forest-fire regimes. Ecology 1991, 72, 1980–1992. [Google Scholar] [CrossRef]
  6. Imbeau, L.; Monkkonen, M.; Desrochers, A. Long-term effects of forestry on birds of the eastern Canadian boreal forests: A comparison with Fennoscandia. Conserv. Biol. 2001, 15, 1151–1162. [Google Scholar] [CrossRef]
  7. Schroeder, D.; Perera, A.H. A comparison of large-scale spatial vegetation patterns following clearcuts and fires in Ontario’s boreal forests. For. Ecol. Manag. 2002, 159, 217–230. [Google Scholar] [CrossRef]
  8. Perron, N.; Bélanger, L.; Vaillancourt, M.A. Spatial structure of forest stands and remnants under fire and timber harvesting regimes. In Ecosystem Management in the Boreal Forest; Gauthier, S., Vaillancourt, M.A., Eds.; Les Presses de l’Université du Québec: Québec, Canada, 2009; pp. 129–154. [Google Scholar]
  9. Stinson, G.; Kurz, W.A.; Smyth, C.E.; Neilson, E.T.; Dymond, C.C.; Metsaranta, J.M.; Boisvenue, C.; Rampley, G.J.; Li, Q.; White, T.M.; et al. An inventory-based analysis of Canada’s managed forest carbon dynamics, 1990 to 2008. Global Chang. Biol. 2011, 17, 2227–2244. [Google Scholar] [CrossRef]
  10. Bergeron, Y.; Harvey, B.; Leduc, A.; Gauthier, S. Stratégies d’aménagement forestier qui s’inspirent de la dynamique des perturbations naturelles: considérations à l’échelle du peuplement et de la forêt. For. Chron. 1999, 75, 55–61. [Google Scholar] [CrossRef]
  11. McRae, D.J.; Duchesne, L.C.; Freedman, B.; Lynham, T.J.; Woodley, S. Comparisons between wildfire and forest harvesting and their implications in forest management. Environ. Rev. 2001, 9, 223–260. [Google Scholar] [CrossRef]
  12. Sirois, L. Impact of fire on Picea mariana and Pinus banksiana seedlings in subarctic lichen woodlands. J. Veg. Sci. 1993, 6, 795–802. [Google Scholar] [CrossRef]
  13. St-Pierre, H.; Gagnon, R.; Bellefleur, P. Régénération après feu de l'épinette noire (Picea mariana) et du pin gris (Pinus banksiana) dans la forêt boréale, Québec. Can. J. For. Res. 1992, 22, 474–481. [Google Scholar] [CrossRef]
  14. Greene, D.F.; Johnson, E.A. Modelling recruitment of Populus tremuloides, Pinus banksiana, and Picea mariana following fire in the mixedwood boreal forest. Can. J. For. Res. 1999, 29, 462–473. [Google Scholar] [CrossRef]
  15. Greene, D.F.; Noel, J.; Bergeron, Y.; Rousseau, M.; Gauthier, S. Recruitment of Picea mariana, Pinus banksiana, and Populus tremuloides across a burn severity gradient following wildfire in the southern boreal forest of Quebec. Can. J. For. Res. 2004, 34, 1845–1857. [Google Scholar] [CrossRef]
  16. Ilisson, T.; Chen, H.Y.H. The direct regeneration hypothesis in northern forests. J. Veg. Sci. 2009, 20, 735–744. [Google Scholar] [CrossRef]
  17. Harvey, B.D.; Bergeron, Y. Site patterns of natural regeneration following clear-cutting in Northwestern Quebec. Can. J. For. Res. 1989, 19, 1458–1469. [Google Scholar] [CrossRef]
  18. Jasinski, J.P.P.; Payette, S. The creation of alternative stable states in the southern boreal forest, Québec, Canada. Ecol. Monogr. 2005, 75, 561–583. [Google Scholar] [CrossRef]
  19. Lecomte, N.; Simard, M.; Asselin, H.; Nappi, A.; Noël, J.; Bergeron, Y. Similarities and Differences between Harvesting and Wildfire Induced Disturbances in Fire Mediated Canadian Landscapes; Technical Report Bulletin No. 924; National Council for Air and Stream Improvement: Québec, QC, Canada, 2006; p. 61. [Google Scholar]
  20. Mansuy, N.; Gauthier, S.; Robitaille, A.; Bergeron, Y. Regional patterns of postfire canopy recovery in the northern boreal forest of Quebec: Interactions between surficial deposit, climate, and fire cycle. Can. J. For. Res. 2012, 42, 1328–1343. [Google Scholar] [CrossRef]
  21. Van Bogaert, R.; Gauthier, S.; Drobyshev, I.; Jayen, K.; Greene, D.F.; Bergeron, Y. Prolonged absence of disturbance associated with increased environmental stress may lead to reduced seedbank size in Picea mariana in boreal eastern North America. Ecosystems 2015. [Google Scholar] [CrossRef]
  22. Van Bogaert, R.; Gauthier, S.; Raulier, F.; Saucier, J.-P.; Boucher, D.; Robitaille, A.; Bergeron, Y. Exploring forest productivity at an early age after fire: A case study at the northern limit of commercial forests in Quebec. Can. J. For. Res. 2015, 45, 579–593. [Google Scholar] [CrossRef]
  23. Harvey, B.D.; Brais, S. Effects of mechanized careful logging on natural regeneration and vegetation competition in the southeastern Canadian boreal forest. Can. J. For. Res. 2002, 32, 653–666. [Google Scholar] [CrossRef]
  24. Jobidon, R.; Groot, A.; Nguyen, T.; Jetté, J.P.; Gauthier, G.; Pothier, D.; Ruel, J.C.; De Grandpré, L.; Bégin, L.; Beaupré, P. Coupe avec Protection des Petites tiges Marchandes (CPPTM); Avis scientifique; Comité consultatif scientifique du Manuel d’aménagement forestier: Québec, QC, Canada, 2002; p. 146. [Google Scholar]
  25. Lecomte, N. La Dynamique des espèces et des Peuplements après feu dans la Pessière de la Partie nord de la Ceinture D'argile; Université du Québec à Montréal: Montreal, QC, Canada, 2005; p. 172. [Google Scholar]
  26. Cyr, D.; Gauthier, S.; Bergeron, Y. Scale-dependent determinants of heterogeneity in fire frequency in a coniferous boreal forest of eastern Canada. Landscape Ecol. 2007, 22, 1325–1339. [Google Scholar] [CrossRef]
  27. Mansuy, N.; Gauthier, S.; Robitaille, A.; Bergeron, Y. The effects of surficial deposit-drainage combinations on spatial variations of fire cycles in the boreal forest of eastern Canada. Int. J. Wildland Fire 2010, 19, 1083–1098. [Google Scholar] [CrossRef]
  28. Greene, D.F.; Kneeshaw, D.D.; Messier, C.; Lieffers, V.; Cormier, D.; Doucet, R.; Coates, K.D.; Groot, A.; Grover, G.; Calogeropoulos, C. Modelling silvicultural alternatives for conifer regeneration in boreal mixedwood stands (aspen/white spruce/balsam fir). For. Chron. 2002, 78, 281–295. [Google Scholar] [CrossRef]
  29. Lafleur, B.; Paré, D.; Fenton, N.J.; Bergeron, Y. Do harvest methods and soil type impact on the regeneration and growth of black spruce stands of northwestern Quebec? Can. J. For. Res. 2010, 40, 1843–1851. [Google Scholar] [CrossRef]
  30. Wulder, M.A.; White, J.C.; Masek, J.G.; Dwyer, J.; Roy, D.P. Continuity of Landsat observations: Short term considerations. Remote Sens. Environ. 2011, 115, 747–751. [Google Scholar] [CrossRef]
  31. Valeria, O.; Laamrani, A.; Beaudoin, A. Monitoring the state of a large boreal forest region in eastern Canada through the use of multitemporal classified satellite imagery. Can. J. Remote Sens. 2012, 38, 91–108. [Google Scholar] [CrossRef]
  32. Frazier, R.J.; Coops, N.C.; Wulder, M.A.; Kennedy, R. Characterization of aboveground biomass in an unmanaged boreal forest using Landsat temporal segmentation metrics. ISPRS J. Photogramm. Remote Sens. 2014, 92, 137–146. [Google Scholar] [CrossRef]
  33. Healey, S.P.; Cohen, W.B.; Zhigiang, Y.; Krankina, O.N. Comparison of tasseled cap-based Landsat data structures for use in forest disturbance detection. Remote Sens. Environ. 2005, 97, 301–310. [Google Scholar] [CrossRef]
  34. Kennedy, R.E.; Yang, Z.; Cohen, W.B. Detecting trends in forest disturbance and recovery using yearly Landsat time series: 1. LandTrendr—Temporal segmentation algorithms. Remote Sens. Environ. 2010, 114, 2897–2910. [Google Scholar] [CrossRef]
  35. Bolton, D.K.; Coops, N.C.; Wulder, M.A. Characterizing residual structure and forest recovery following high-severity fire in the western boreal of Canada using Landsat time-series and airborne lidar data. Remote Sens. Environ. 2015, 163, 48–60. [Google Scholar] [CrossRef]
  36. Wulder, M.A.; Hall, R.J.; Coops, N.C.; Franklin, S.E. High spatial resolution remotely sensed data for ecosystem characterization. BioScience 2004, 54, 511–521. [Google Scholar] [CrossRef]
  37. Boyd, D.; Danson, F. Satellite remote sensing of forest resources: Three decades of research development. Prog. Phys. Geog. 2005, 29, 1–26. [Google Scholar] [CrossRef]
  38. Banskota, A.; Kayastha, N.M.; Falkowski, J.; Wulder, M.A.; Froese, R.E.; White, J.C. Forest monitoring using landsat time series data: A review. Can. J. Remote Sens. 2014, 40, 362–384. [Google Scholar] [CrossRef]
  39. Uuemaa, E.; Mander, Ü.; Marja, R. Trends in the use of landscape spatial metrics as landscape indicators: A review. Ecol. Indic. 2013, 28, 100–106. [Google Scholar] [CrossRef]
  40. Saucier, J.P.; Bergeron, J.F.; Grondin, P.; Robitaille, A. Les régions écologiques du Québec méridional (3e version): Un des éléments du système hiérarchique de classification écologique du territoire mis au point par le ministère des Ressources naturelles du Québec. L’Aubelle 1998, 124, S1–S12. [Google Scholar]
  41. Robitaille, A.; Saucier, J.P. Paysages régionaux du Québec méridional. Direction de la gestion des stocks forestiers et Direction des relations publiques, Ministère des Ressources naturelles du Québec; Les Publications du Québec: Québec, Canada, 1998. [Google Scholar]
  42. Payette, S.; Rochefort, L. Écologie des Tourbières du Québec-Labrador; Les Presses de l’Université Laval: Québec, Canada, 2001. [Google Scholar]
  43. Pelletier, G.; Dumont, Y.; Bédard, M. SIFORT: Système d’Information FORestière par Tesselle, Manuel de l’usager; Ministère des Ressources naturelles et de la Faune du Québec: Québec, QC, Canada, 2007. [Google Scholar]
  44. Wulder, M.A.; White, J.C.; Cranny, M.; Hall, R.J.; Luther, J.E.; Beaudoin, A.; Goodenough, D.G.; Dechka, J.A. Monitoring Canada’s forests. Part 1: Completion of the EOSD land cover project. Can. J. Remote Sens. 2008, 34, 549–584. [Google Scholar] [CrossRef]
  45. Valeria, O.; Laamrani, A.; Beaudoin, A.; Côté, S.; Simard, G. Rapport de l’état de la forêt en Abitibi-Témiscamingue et au Nord-du-Québec à l’aide d’outils de Télédétection. Rapport de recherche. Université du Québec en Abitibi-Témiscamingue et Ressources naturelles Canada; Rouyn-Noranda: Québec, QC, Canada, 2008; p. 91. Available online: http://abitibiwatch.uqat.ca/information_links/Abitibiwatch-oct-2008.pdf (accessed on 13 September 2013).
  46. McCune, B.; Grace, J.B.; Urban, D.L. Analysis of Ecological Communities; MjM Software, Gleneden Beach: Oregon, USA, 2002; p. 300. [Google Scholar]
  47. Sader, S.A.; Bertrand, M.; Wilson, E.H. Satellite change detection of forest harvest patterns on an industrial forest landscape. For. Sci. 2003, 49, 341–353. [Google Scholar]
  48. Goetz, S.J.; Fiske, G.J.; Bunn, A.G. Using satellite time-series data sets to analyze fire disturbance and forest recovery across Canada. Remote Sens. Environ. 2006, 101, 352–365. [Google Scholar] [CrossRef]
  49. Ireland, G.; Petropoulos, G.P. Exploring the relationships between post-fire vegetation regeneration dynamics, topography and burn severity: A case study from the Montane Cordillera ecozones of Western Canada. Appl. Geogr. 2015, 56, 232–248. [Google Scholar] [CrossRef]
  50. Fuller, R.M.; Smith, G.M.; Devereux, B.J. The characterisation and measurement of land cover change through remote sensing: Problems in operational applications? Int. J. Appl. Earth Obs. Geoinf. 2003, 4, 243–253. [Google Scholar] [CrossRef]
  51. Wulder, M.A.; LeDrew, E.F.; Franklin, S.E.; Lavigne, M.B. Aerial image texture information in the estimation of northern deciduous and mixed wood forest leaf area index (LAI). Remote Sens. Environ. 1998, 64, 64–76. [Google Scholar] [CrossRef]
  52. Wolter, P.T.; Mladenoff, P.T.; Host, G.E.; Crow, T.R. Improved forest classification in the northern lake states using multi-temporal Landsat imagery. Photogramm. Eng. Remote Sens. 1995, 61, 1129–1143. [Google Scholar]
  53. Gerylo, G.; Hall, R.; Franklin, S.; Smith, L. Empirical relations between Landsat TM spectral response and forest stands near Fort Simpson, Northwest Territories, Canada. Can. J. Remote Sens. 2002, 68–79. [Google Scholar] [CrossRef]
  54. Moskal, L.M.; Franklin, S.E. Multilayer forest stand discrimination with spatial co-occurrence texture analysis of high spatial detail airborne imagery. Geocarto Int. 2002, 17, 55–68. [Google Scholar] [CrossRef]
  55. Benz, U.C.; Hofmann, P.; Willhauck, G.; Lingenfelder, I.; Heynen, M. Multi-resolution, object-oriented fuzzy analysis of remote sensing data for GIS-ready information. ISPRS J. Photogrammetry Remote Sens. 2004, 58, 239–258. [Google Scholar] [CrossRef]
  56. Qin, Y.; Niu, Z.; Chen, F.; Li, B.; Ban, Y. Object-based land cover change detection for cross-sensor images. Int. J. Remote Sens. 2013, 34, 6723–6737. [Google Scholar] [CrossRef]
  57. Van Wagner, C.E. Age-class distribution and the forest fire cycle. Can. J. For. Res. 1978, 8, 220–227. [Google Scholar] [CrossRef]
  58. Heinselman, M.L. Fire and succession in the conifer forests of northern North America. In Forest Succession: Concepts and Application; West, D.C., Shugart, H.H., Eds.; Springer-Verlag: New York, NY, USA, 1981; pp. 374–405. [Google Scholar]
  59. Pickett, S.T.A.; White, P.S. Natural disturbance and patch dynamics: An introduction. In The Ecology of Natural Disturbance and Patch Dynamics; Pickett, S.T.A., White, P.S., Eds.; Academic Press: Orlando, FL, USA, 1985; pp. 3–13. [Google Scholar]
  60. Madoui, A.; Leduc, A.; Gauthier, S.; Bergeron, Y. Spatial pattern analyses of post-fire residual stands in the black spruce boreal forest of western Quebec. Int. J. Wildland Fire 2010, 19, 1110–1126. [Google Scholar] [CrossRef]
  61. Gauthier, S.; De Grandpré, L.; Bergeron, Y. Differences in forest composition in two boreal forest ecoregions of Quebec. J. Veg. Sci. 2000, 11, 781–790. [Google Scholar] [CrossRef]
  62. Chen, H.Y.H.; Popadiouk, R.V. Dynamics of North American mixedwood forests. Environ. Rev. 2002, 10, 137–166. [Google Scholar] [CrossRef]
  63. Harper, K.A.; Bergeron, Y.; Gauthier, S.; Drapeau, P. Post-fire development of canopy structure and composition in black spruce forests of Abitibi, Québec: A landscape scale study. Silva. Fenn. 2002, 36, 249–263. [Google Scholar] [CrossRef]
  64. Harvey, B.D. Possibilités d'application de la classification écologique pour l'aménagement forestier dans le canton d’Hébécourt, Abitibi. Master’s Thesis, Université du Québec à Montréal, Montreal, Québec, QC, Canada, 1987; p. 68. [Google Scholar]
  65. Nguyen-Xuan, T.; Bergeron, Y.; Simard, D.; Fyles, J.W.; Paré, D. The importance of forest floor disturbance in the early regeneration patterns of the boreal forest of western and central Quebec: A wildfire versus logging comparison. Can. J. For. Res. 2000, 30, 1353–1364. [Google Scholar] [CrossRef]
  66. Carleton, T.J.; Maycock, P.F. Dynamics of the boreal forest south of James Bay. Can. J. Bot. 1978, 56, 1157–1173. [Google Scholar] [CrossRef]
  67. Ahlgren, C.E. Effects of fires on temperate forests: North Central United States. In Fire and Ecosystems; Kozlowski, T.T., Ed.; Academic Press: New York, NY, USA, 1972; pp. 195–223. [Google Scholar]

