Article

Growth and Nutrient Status of Foliage as Affected by Tree Species and Fertilization in a Fire-Disturbed Urban Forest

1
Department of Forest Resources, Gyeongnam National University of Science and Technology, Jinju 660-758, Korea
2
Centre for Environmental Risk Assessment and Remediation, University of South Australia, Adelaide, SA 5095, Australia
3
Department of Forest Environmental Resources, Gyeongsang National University, Jinju 660-701, Korea
*
Author to whom correspondence should be addressed.
Forests 2015, 6(6), 2199-2213; https://doi.org/10.3390/f6062199
Submission received: 11 May 2015 / Revised: 14 June 2015 / Accepted: 15 June 2015 / Published: 19 June 2015
(This article belongs to the Special Issue Nitrogen and Phosphorus Nutrition of Trees and Forests)

Abstract

:
The aim of the present study was to evaluate the growth and macronutrient (C, N, P, K) status in the foliage of four tree species (LT: Liriodendron tulipifera L.; PY: Prunus yedoensis Matsumura; QA: Quercus acutissima Carruth; PT: Pinus thunbergii Parl.) in response to fertilization with different nutrient ratios in a fire-disturbed urban forest located in BongDaesan (Mt.), Korea. Two fertilizers (N3P8K1 = 113:300:37 kg·ha−1·year−1; N6P4K1 = 226:150:37 ha−1·year−1) in four planting sites were applied in April 2013 and March 2014. The growth and nutrient responses of the foliage were monitored six times for two years. Foliar growth and nutrient concentrations were not significantly different (p > 0.05) in response to different doses of N or P fertilizer, but the foliage showed increased N and P concentrations and content after fertilization compared with the control (N0P0K0). Foliar C and K concentrations were little affected by fertilization. Foliar nutrient concentrations and contents were significantly higher in PY and LT than in PT. The results suggest that the foliar N and P concentration could be used as a parameter to assess the nutrient environments of tree species restored in a fire-disturbed urban forest.

1. Introduction

Foliage analysis has received considerable research attention because the nutrient concentrations of foliage have been accepted as adequate indicators of growth and soil fertility at sites in forest stands [1,2,3]. Generally, the nutrient responses of foliage are commonly used as a tool to assess the nutrient requirements and deficiencies [4].
Urban forests play an important role in enhancing ecosystem service with many demands, such as recreational service, esthetics and biodiversity [5]. However, many urban forest ecosystems face challenging natural and anthropogenic influences, such as forest fire and air pollutions [6]. For example, soils disturbed through forest fire exhibit a myriad of nutritional problems, such as nitrogen (N) and phosphorus (P) deficiency through increased nutrient leaching, surface runoff, and soil erosion [7,8]. The loss of plant nutrients and destabilization of soils in fire-disturbed urban forests might inhibit the rooting and growth of newly planted tree species [9]. In addition, forest management practices, such as nutrient additions, are required to supply sufficient nutrients to optimize the growth of newly planted tree species in urban forests burned by forest fire.
Fertilization stimulates tree growth through positive effects on leaf area and foliar photosynthetic rate [10,11] with increased nutrient concentrations in the living components of trees [12]. However, the status of foliar nutrients was dependent on the type [13] and dose [14] of the fertilizer, tree species [12,15] and many environmental resource factors, such as soil properties and water supply [1,16]. Foliar growth and nutrient status might be important factors in determining responses to fertilization because foliar nutrient concentrations are sensitive to soil nutrient conditions, although the concentrations were much more dependent on species than on sites [1,13,14]. In addition, the application of a suitable fertilizer ratio after foliage analysis, considering the soil environmental conditions and tree growth characteristics, is one of the most effective ways to reduce cost and fertilizer waste.
Although several studies have investigated the changes in soil properties following fires in forest ecosystems in Korea [12,14], limited information is available on urban forest landscapes. In addition, the quantification of foliar nutrient status following fertilization is critical for the actual and potential vegetation restoration of a fire-disturbed urban forest. The aim of the present study was to examine the growth and nutrient responses of foliage based on the compound ratio of fertilizer from four tree species planted in a fire-disturbed urban forest. We hypothesized that the growth and nutrient concentrations of foliage may correspond to the fertilization with different nutrient ratios by tree species-related differences.

2. Experimental Section

2.1. Site

The study site was located in BongDaesan (Mt.) of the Ulsan Metropolitan city, located in southeastern Korea (Figure 1). This mountain was a frequent forest fire area (37 times from 2003 to 2011), primarily resulting from arson. The dominant forest soils are a slightly dry brown forest soil (mostly Entisols or Inceptisols, United States Soil Classification System) derived from granite parent rocks. The annual average precipitation and temperature in this area are 1277 mm·year−1 and 14.1 °C, respectively.
Figure 1. Location of tree planting sites in a fire-disturbed urban forest.
Forests 06 02199 g001

2.2. Methods

This study comprised a completely randomized design with 2 blocks involving total 24 plots (two fertilizer (N3P8K1 and N6P4K1) and one control (N0P0K0) treatments × four different tree planting species (Liriodendron tulipifera L. (LT); Prunus yedoensis Matsumura (PY); Quercus acutissima Carruth (QA); and Pinus thunbergii Parl. (PT)) × two blocks) in a fire-disturbed urban forest. The fire resulted from arson in the spring of 2008. In the spring of 2009, the two-year-old (1-1) seedlings of four tree species were planted under a similar site environmental condition on gentle slopes (5–15°) within a close situated distance among tree planting sites from burned forests (Figure 1). Experimental plots consisting of three deciduous hardwood (LT, PY, QA) and one evergreen coniferous plantations (PT) were located adjacent to each other (Figure 1), as sampling bias due to differing site components can be reduced by using a sampling scheme with identical designs for adjacent sites [17]. The stand characteristics and soil properties before the fertilization are shown in Table 1 and Table 2, respectively. The soil properties of the study site were similar to a severely burned forest soil in Korea [14].
Table 1. Stand characteristics before fertilization in the study site.
Tree SpeciesLocationElevation (m)Stand Density (trees·ha1)DBH (mm)Height (m)
Liriodendron tulipifera35°32′34.92″ N 129°26′22.92″ E1541666 (160)28.6 (2.8)2.87 (0.14)
Prunus yedoensis35°32′26.48″ N 129°26′16.22″ E1211267 (160)49.4 (2.3)4.10 (0.13)
Quercus acutissima35°32′26.77″ N 125°26′15.15″ E1181533 (66)26.4 (1.1)2.22 (0.10)
Pinus thunbergii35°32′16.36″ N 125°26′17.56″ E981600 (206)27.3 (3.7)2.31 (0.11)
Standard errors in parenthesis. DBH: diameter at breast height (1.2 m).
Table 2. Soil property before fertilization in the study site.
Tree SpeciesB.D. g·cm−3SandSiltClayCNP mg·kg−1K+Ca2+Mg2+
%cmolc·kg−1
Liriodendron tulipifera0.90 (0.01)49 (4.7)40 (4.0)10 (0.7)3.1 (0.50)0.15 (0.02)6.0 (2.0)0.16 (0.02)1.60 (0.28)0.50 (0.09)
Prunus yedoensis0.89 (0.01)47 (1.3)43 (0.7)10 (1.2)3.6 (0.70)0.17 (0.02)1.2 (0.5)0.29 (0.11)1.54 (0.39)0.56 (0.13)
Quercus acutissima0.88 (0.02)43 (1.8)47 (2.9)10 (1.2)1.9 (0.04)0.08 (0.01)9.9 (0.7)0.09 (0.01)0.43 (0.06)0.19 (0.02)
Pinus thunbergii0.91 (0.01)63 (8.7)28 (8.1)9 (0.7)1.9 (0.01)0.07 (0.01)6.5 (2.6)0.08 (0.02)0.38 (0.11)0.16 (0.03)
Standard errors in parenthesis. B.D.: bulk density.
Treatment plots (plot size = 5 × 5 m) of each tree species were randomly assigned with a 1 m buffer zone between each plot on the same facing slopes and aspects to minimize spatial variation in soil properties. The combination of fertilizer ratios (N3P8K1 (113 kg N ha−1·year−1, 300 kg P ha−1·year−1, 37 kg K ha−1·year−1) and N6P4K1 (226 kg N ha−1·year−1, 150 kg P ha−1·year−1, 37 kg K ha−1·year−1)) was based on the guideline of fertilization after forest fire in Korean forests [9]. Urea, fused superphosphate, and potassium chloride fertilizers were used as sources of N, P, and potassium (K), respectively. Fertilizers were applied for two years (in April 2013 and March 2014) by hand across each plot.
Fresh foliar (current-year-old) samples were collected at six times (27 June, 23 August, and 17 October, 2013 and 26 June, 22 August, and 18 October, 2014) for two years with pruners from the mid-crown of three trees per each treatment plot (Figure 2). The foliar samples, in plastic zipper bags, were transported to the laboratory and foliage was separated from twigs or small branches. For each treatment, three repetitions of 10 leaves were counted and weighted. Leaf area was measured by fresh foliar samples by using scanned leaf meter (CI-202 area meter CID, Inc., Camas, WA, USA). The specific leaf area of the foliage was determined as the leaf area (cm2) and dry weight (g) of the ratio [16]. The foliar samples were oven-dried at 65 °C for 48 h, and the dried samples were ground in a Wiley mill and passed through a 40-mesh stainless steel sieve. Foliar carbon (C) and N concentrations from the ground materials were determined using an elemental analyzer (Thermo Scientific, Flash 2000, Italy). Foliar P and K concentrations were determined through dry ashing 0.5 g of dry foliage at 470 °C for 4 h, digesting the ash with 3 mL of concentrated 5 M HCl, diluting the digest with 0.25 mL of concentrated HNO3 and 3 mL concentrated 5 M HCl, and measuring the concentrations via ICP (Perkin Elmer Optima 5300DV).
Figure 2. Morphological characteristics of foliage by fertilizer compound ratios of tree species collected on August 2014: (a) Liriodendron tulipifera L.; (b) Prunus yedoensis Matsumura; (c) Quercus acutissima Carruth; and (d) Pinus thunbergii Parl.
Forests 06 02199 g002

2.3. Statistical Analysis

All data were analyzed using the PROC MIXED procedure of SAS [18] to determine the significance of main fixed effects (tree species (S), fertilizer treatment (F), sampling month (M)) and their interactions (S × F, S × M, F × M, S × F × M), whereas the sampling years of foliage were considered a random effect. The following model was used to describe the data analysis (Equation (1)).
Yijk = u + Si + Fj + Mk + (SF)ij + (SM)ik + (FM)jk + (SFM)ijk + eijk
where u is the overall mean effect, S is the different tree species (i = 1, 2, 3, 4), F is the fertilizer treatment (j = 1, 2, 3), and M is the sampling month (k = 1, 2, 3). When significant differences were observed, the treatment means were compared using Tukey’s test at p < 0.05.

3. Results and Discussion

3.1. Results

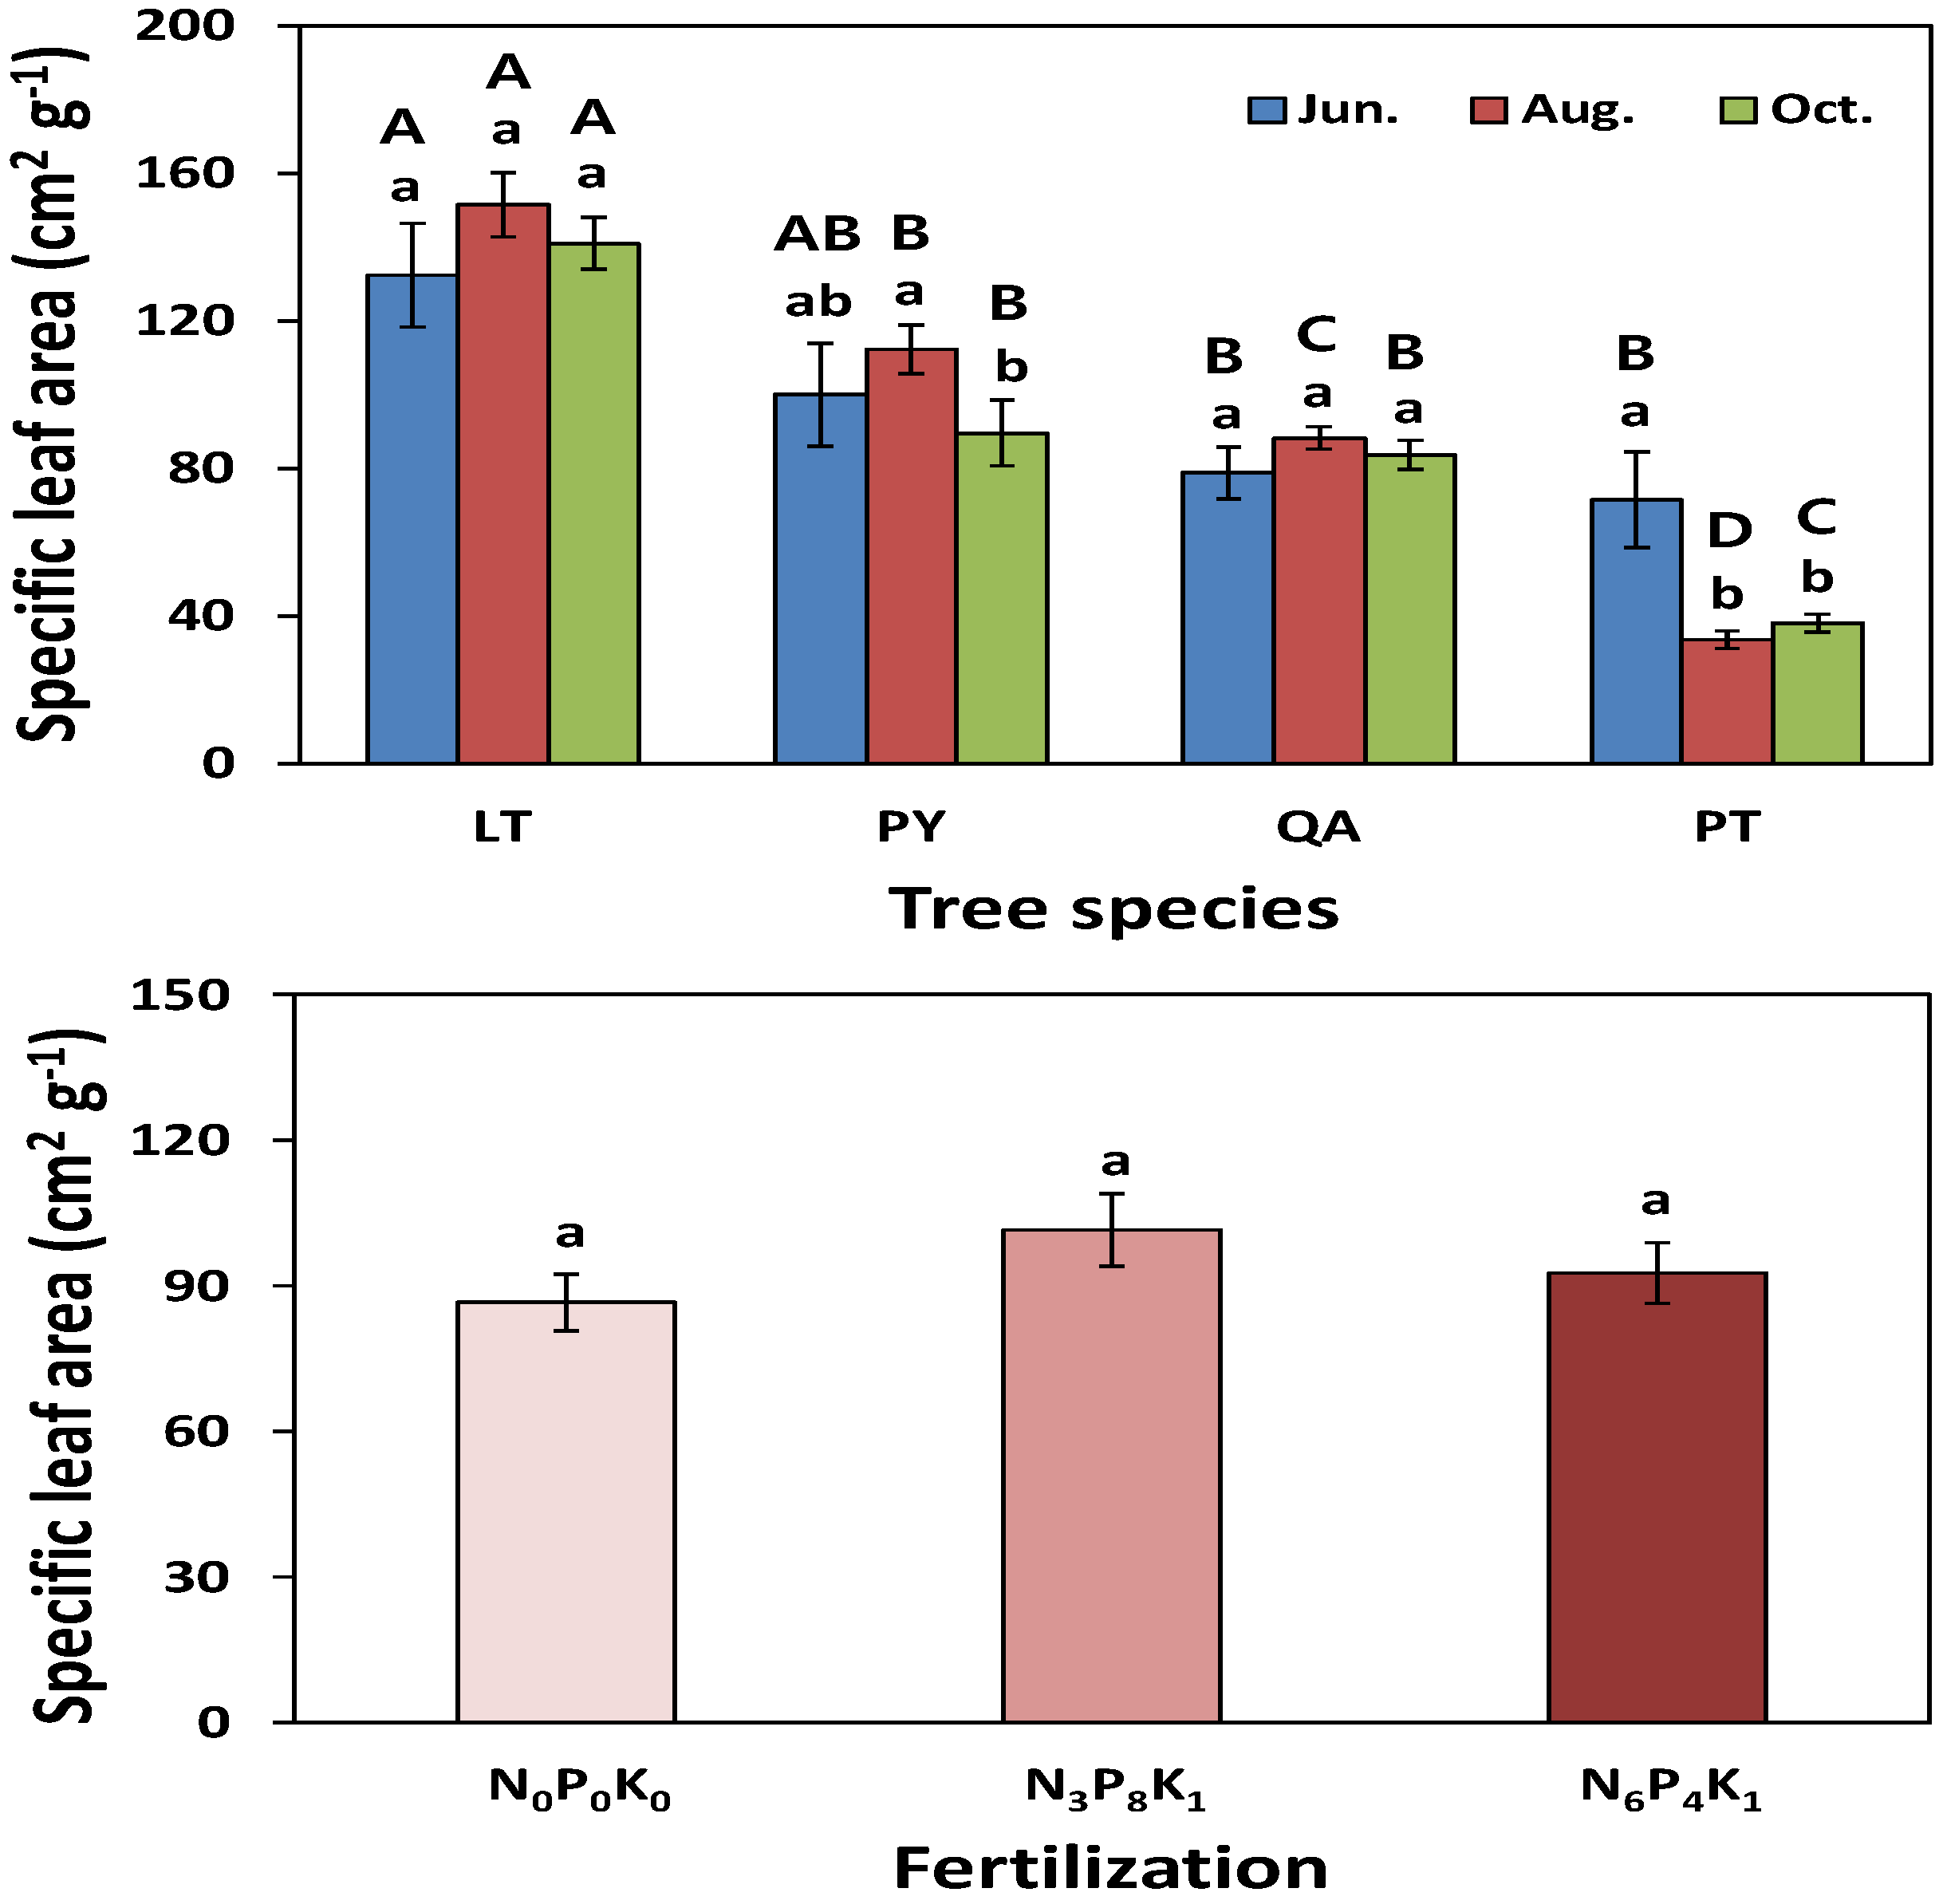
3.1.1. Growth Response
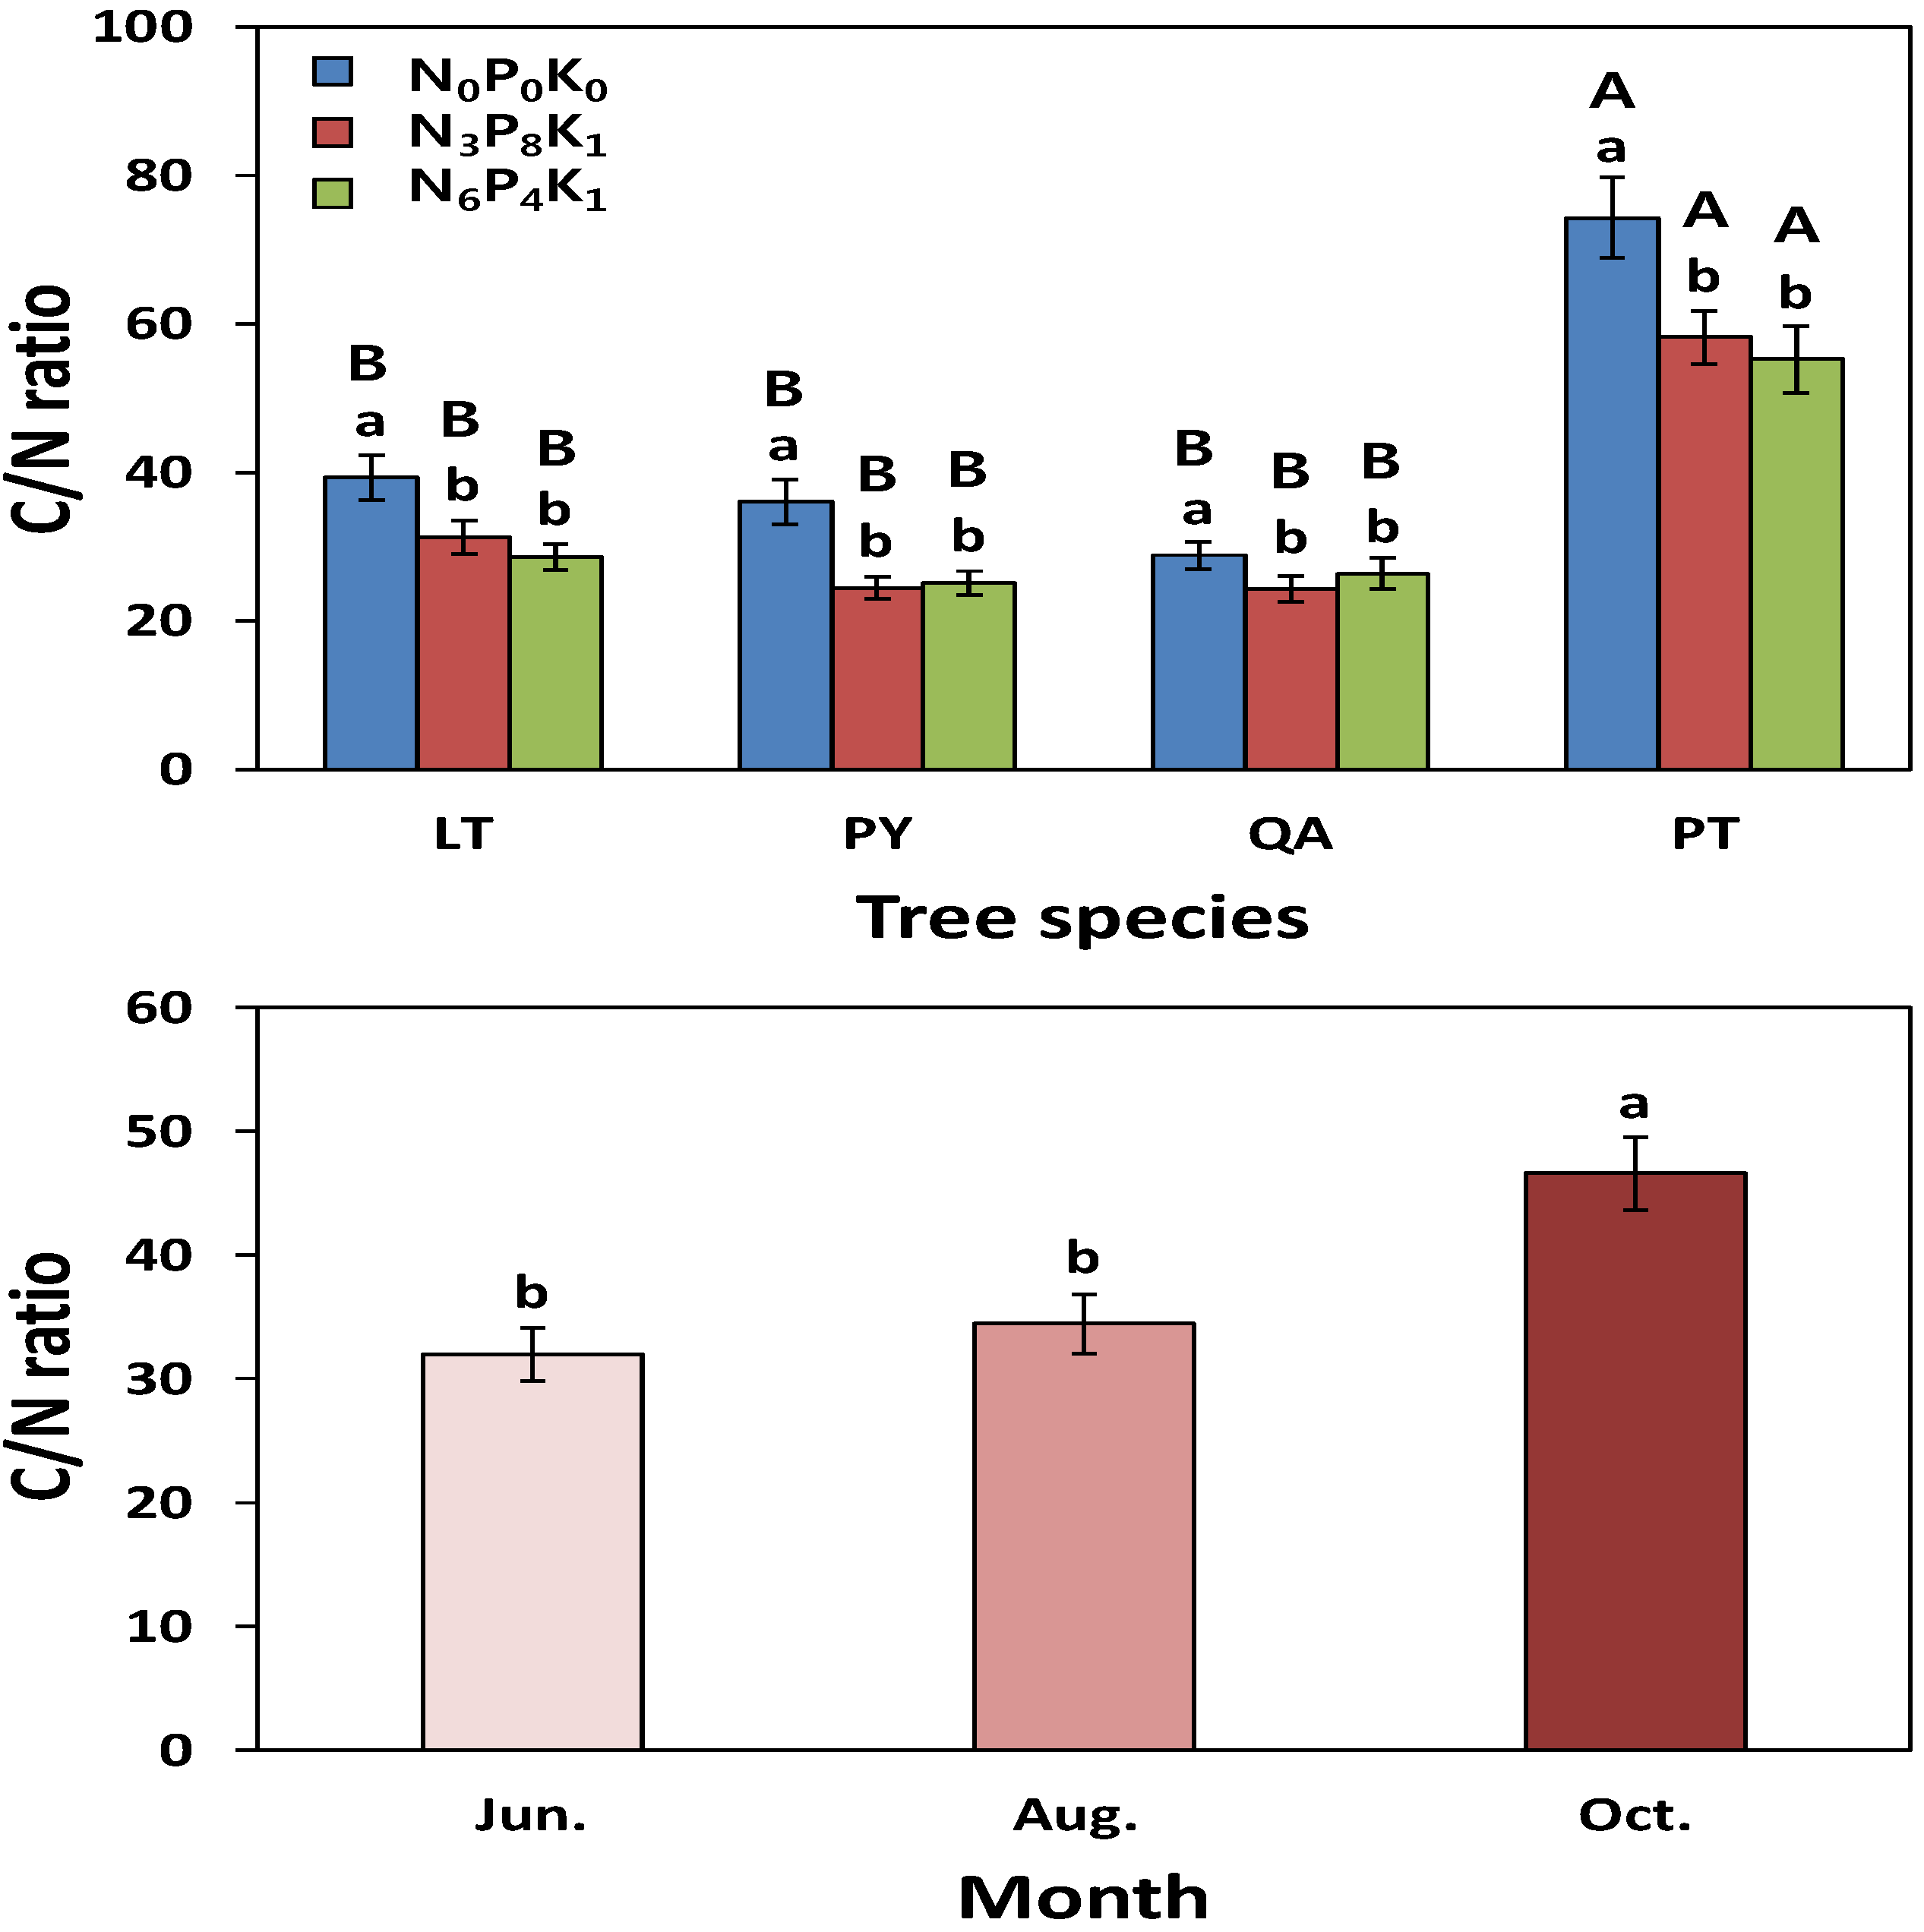
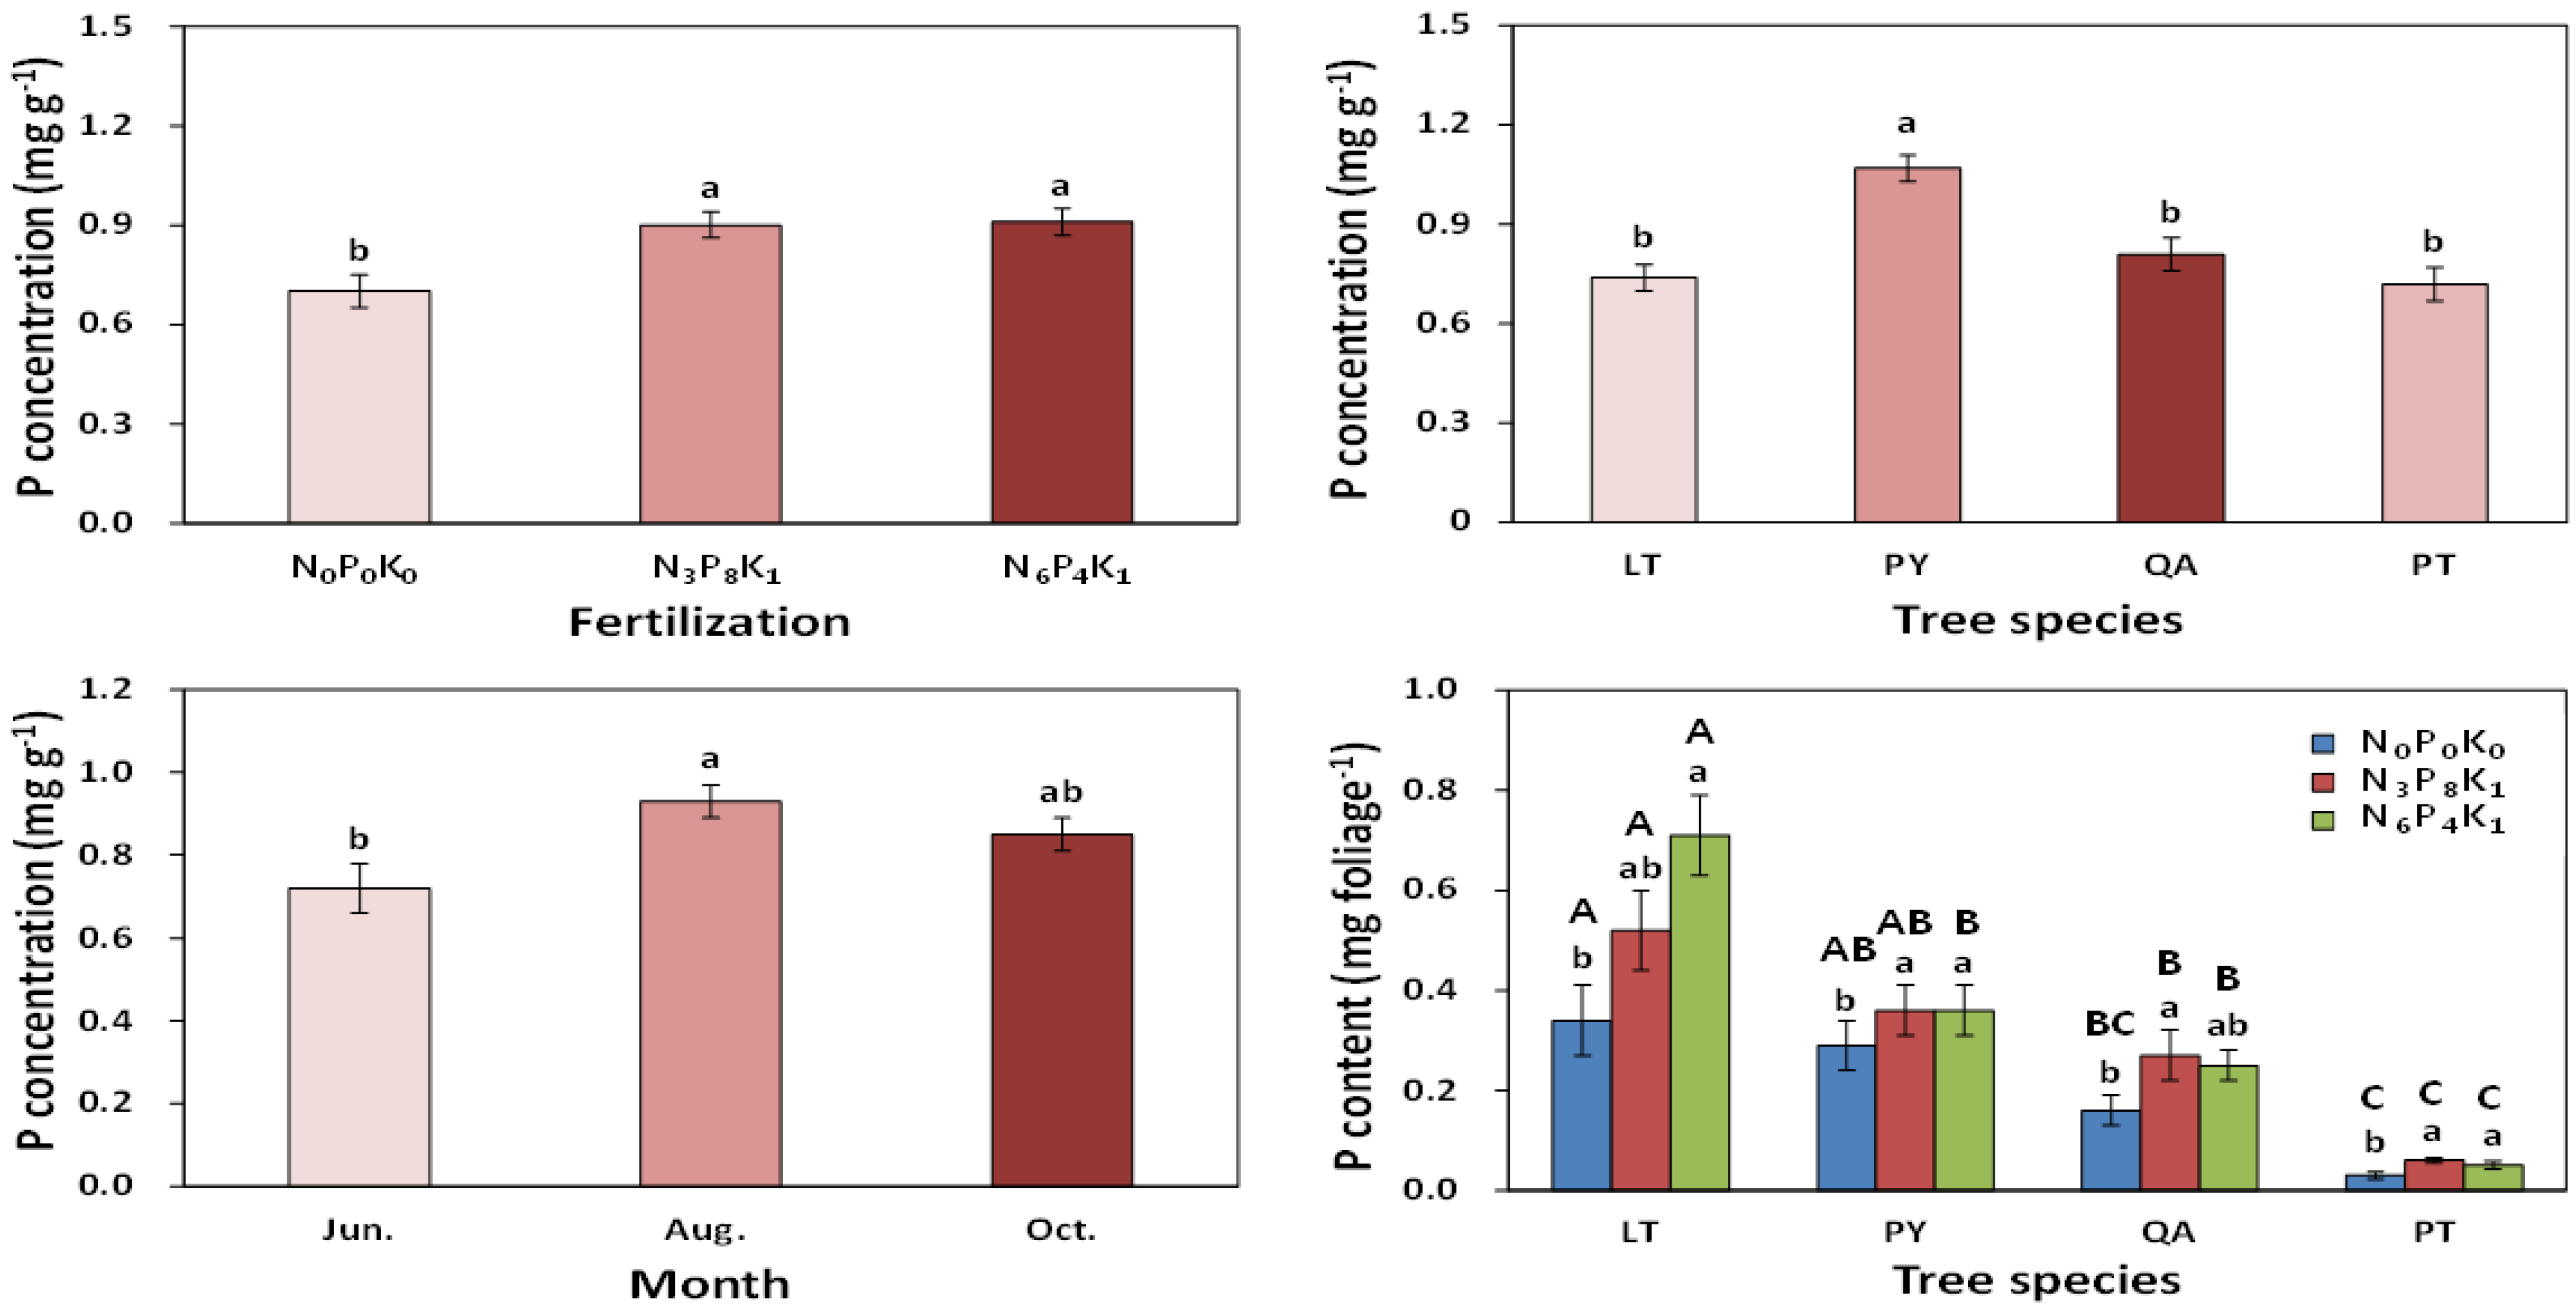
Foliar growth responses (leaf area, dry weight, and specific leaf area) were significantly (p < 0.05) affected by tree species and fertilization (Table 3). The foliar leaf area and dry weight showed a significant two-factor interaction between tree species and fertilization (Figure 3). The leaf area of LT, PY and PT increased after the fertilization, but the leaf area of QA was not affected by fertilization (Figure 3). The foliar dry weight of LT and QA was significantly higher in the N6P4K1 treatment than in the N0P0K0 treatment (Figure 3).
Table 3. P-value from results of three-way ANOVA on tree species, fertilization and sampling month on growth and nutrient responses of foliage from tree species planted in a fire-disturbed urban forest. Bold values denote significance at p < 0.05.
ComponentLeaf AreaSpecific Leaf AreaDry WeightNutrient ConcentrationC/N RatioNutrient Content
CNPKCNPK
Species (S)<0.001<0.001<0.001<0.001<0.001<0.001<0.001<0.001<0.001<0.001<0.001<0.001
Fertilizer (F)<0.0010.0490.0020.444<0.001<0.0010.666<0.0010.003<0.001<0.0010.158
Month (M)0.0030.309<0.001<0.001<0.001<0.001<0.001<0.001<0.0010.066<0.001<0.001
S × F0.0020.5450.0180.2310.0320.2640.9860.0370.0300.0070.0030.707
S × M0.2340.0120.269<0.0010.0160.7700.1260.4240.1870.2780.002<0.001
F × M0.8610.9810.9030.4190.6140.2750.6990.8340.9170.9450.8070.994
S × F × M0.9990.6850.6250.8300.9780.9990.8670.9400.6070.9500.6590.963
Figure 3. Leaf area and dry weight of foliage by tree species and sampling month in a fire-disturbed urban forest (mean ± standard error). Treatment means with the same lower case letter among fertilizer or sampling month treatments and treatment means with the same upper case letter among tree species are not significantly different at p < 0.05. LT: Liriodendron tulipifera L.; PY: Prunus yedoensis Matsumura; QA: Quercus acutissima Carruth; and PT: Pinus thunbergii Parl.
Forests 06 02199 g003
A significant main effect of the foliar leaf area and dry weight on the sampling month, which was lower in June than in August and October (Figure 3), was observed. The specific leaf area was marginally affected by fertilization (p = 0.049), with a significant two-factor interaction between tree species and sampling month (Figure 4).
Figure 4. Specific leaf area of foliage by tree species and fertilization in a fire-disturbed urban forest (mean ± standard error). Treatment means with the same lower case letter among sampling month or fertilizer treatments and treatment means with the same upper case letter among tree species are not significantly different at p < 0.05. LT: Liriodendron tulipifera L.; PY: Prunus yedoensis Matsumura; QA: Quercus acutissima Carruth; and PT: Pinus thunbergii Parl.
Forests 06 02199 g004

3.1.2. Nutrient Responses

There was no significant fertilization effect of the foliar C concentration, while the C concentration showed a two-factor interaction between tree species and sampling month (Table 3, Figure 5). The foliar C content among tree species was highest in LT, followed by PY, QA and PT, while the content of LT and QA was significantly higher in the N6P4K1 treatments compared with the N0P0K0 treatments. The foliar N concentration significantly differed with the sampling month (Figure 5). The foliar N concentration of four tree species was lower in October or in the N0P0K0 treatment than in June or in the fertilizer treatments (Figure 5), but the concentration did not significantly differ between the different N ratio of the fertilizer, such as the N3P8K1 and N6P4K1 treatments. The foliar N content was similar to foliage C content of the four tree species (Figure 5).
Figure 5. Carbon and nitrogen concentration and content of foliage by tree species and sampling month in a fire-disturbed urban forest (mean ± standard error). Treatment means with the same lower case letter among sampling month or fertilizer treatments and treatment means with the same upper case letter among tree species are not significantly different at p < 0.05. LT: Liriodendron tulipifera L.; PY: Prunus yedoensis Matsumura; QA: Quercus acutissima Carruth; and PT: Pinus thunbergii Parl.
Forests 06 02199 g005
A significant two-factor interaction between the tree species and fertilizer treatments on the C/N ratio of foliage was observed (Figure 6). The C/N ratio in all tree species was significantly lower in the fertilizer than in the N0P0K0 treatments, regardless of the compound ratio of fertilizer, while the C/N ratio was significantly higher in conifers (PT) than in broadleaf tree species (LT, PY, and QA). The C/N ratio was also highest in October, followed by August and June (Figure 6).
Figure 6. Carbon and nitrogen ratio of foliage by tree species and sampling month in a fire-disturbed urban forest (mean ± standard error). Treatment means with the same lower case letter among fertilizer or sampling month treatments and treatment means with the same upper case letter among tree species are not significantly different at p < 0.05. LT: Liriodendron tulipifera L.; PY: Prunus yedoensis Matsumura; QA: Quercus acutissima Carruth; and PT: Pinus thunbergii Parl.
Forests 06 02199 g006
The foliar P concentration was significantly affected by tree species, fertilization and sampling month with no two- or three-way interaction (Table 3, Figure 7). The foliar P concentration was significantly higher in PY than in other tree species. The foliage of PY showed a significantly high P concentration compared with the other three tree species (Figure 7). The foliar P concentration was highest in August, followed by October and June (Figure 7). There was a significant two-factor interaction between the tree species and fertilizer treatments or between the sampling month and tree species on foliar P content (Figure 7). In contrast to the foliar P concentrations, the foliar K concentration and content were little affected by fertilization (Table 3), while the concentration and content were higher in October than in June, except for PT. The foliar K concentration was significantly higher in PY than in the other three tree species (Figure 8).
Figure 7. Phosphorus concentration and content of foliage by fertilization, tree species, and sampling month in a fire-disturbed urban forest (mean ± standard error). Treatment means with the same lower case letter among fertilizer, tree species or sampling month treatments and treatment means with the same upper case letter among tree species are not significantly different at p < 0.05. LT: Liriodendron tulipifera L.; PY: Prunus yedoensis Matsumura; QA: Quercus acutissima Carruth; and PT: Pinus thunbergii Parl.
Forests 06 02199 g007
Figure 8. Potassium concentration and content of foliage by tree species, fertilization and sampling month in a fire-disturbed urban forest (mean ± standard error). Treatment means with the same lower case letter among fertilizer, tree species or sampling month treatments and treatment means with the same upper case letter among tree species are not significantly different at p < 0.05. LT: Liriodendron tulipifera L.; PY: Prunus yedoensis Matsumura; QA: Quercus acutissima Carruth; and PT: Pinus thunbergii Parl.
Forests 06 02199 g008

3.2. Discussion

3.2.1. Growth Responses

Because nutrient availability is generally considered the major resource factor limiting growth in many forest tree species [19], foliage growth after fertilization would have greater leaf area and dry weight than foliage grown without fertilization. Although there was a significant tree species effect on foliage growth because of the morphological difference among tree species (Figure 2), fertilization induced different growth responses among tree species planted in a fire-disturbed urban forest. Most tree species showed increased leaf area following fertilization, while the dry weight and specific leaf area were not affected by fertilization, except for the foliar dry weight in LT and QA. This result might reflect the different C allocation patterns during the growth and development of foliage in different tree species [20]. For example, N fertilization increased the foliage biomass, rather than the dry weight of the foliage in eucalyptus plantations [21]. However, the lack of a significant fertilizer compound ratio on the morphological growth responses of foliage might reflect other micronutrient imbalances resulting from increased N fertilization [11] or multi-factorial influences that occur during the leaf life-span, such as light environment, nutrients, temperature and water supply [22]. Seasonal patterns of foliar leaf area and dry weight could be attributed to foliage maturation or resource allocation between woody (roots, stem wood, and branches) and photosynthetic compounds [20]. The high leaf area and dry weight in August and October could reflect the maturation of foliage, whereas the low leaf area in June indicated that the foliage in the four tree species was not fully elongated during this season.

3.2.2. Nutrient Responses

The foliar C concentration was a poor indicator of the fertilizer response in a fire-disturbed urban forest (p = 0.444). Similarly, other studies reported that the inter- and intra-specific variations of the C concentration in tree species were determined through genetic and environmental factors [23,24], rather than resource factors, such as nutrient availability [25]. For example, genetic differences among tree species might result in different C concentration of foliage, which was significantly higher in PT than in LT (Figure 5). In addition, the foliage C concentration was generally increased in the heavy litter fall season (October) compared with the growing season (June–August) because of low mineral concentrations of foliage by nutrient resorption (Figure 5). The foliar C content reflected differences in the foliar dry weight induced after fertilization rather than the foliar C concentration among tree species and reflected differences in foliage maturation associated with the translocation of carbohydrates and other cellular materials to active growing tissues [15].
As expected, the foliar N concentration and content among tree species were lower in conifers (PT) than in broadleaf tree species (LT, PY, and QA). The foliar N concentration and content of the four tree species increased following fertilization, while insignificant increases in foliage N concentration occurred with different doses of N fertilizer (N3P8K1 and N6P4K1). A high foliar N concentration and content with fertilization likely reflects the increased uptake of available N in soil depths [15,19], as tree species with high N availability in mineral soil produce high foliage N concentration [26]. The low foliar N concentration and content observed under N0P0K0 treatment suggested the N deficiency and limited tree growth in a fire-disturbed urban forest. However, a similar foliar N concentration of the fertilizer compound ratio might result from luxury N consumption from a high dose of N fertilizer (N6P4K1) compared with N3P8K1 fertilizer, although the foliar N concentration after fertilization was regulated through factors, such as the combined effect of the available soil N status, tree growth, and climate factors. The foliar N concentration and content were affected by sampling months because of the resorption of foliar N in October or the dilution effect due to the increased relative accumulation of carbohydrates with increasing dry weight [4]. Similarly, the high C/N ratio in October reflected foliar N resorption before heavy litter fall [27]. Also, C/N ratio was higher under nutrient deficient conditions (N0P0K0) compared with trees grown under improved nutrient conditions (N6P4K1 and N3P8K1).
The foliar P concentration and content of the four tree species were increased after fertilization, suggesting that the four tree species were P deficient in the fire-disturbed urban forest. Similarly, the foliage of eucalypt forests showed an increased P concentration following P fertilizer application [28], reflecting enhanced uptake and mineralization in the rhizosphere. However, the foliar P concentration was not responsible for the increased dose of the P in the fertilizer (N6P4K1 and N3P8K1), indicating that much of the P uptake at a high dose might be associated with luxury consumption. The difference of foliage P content among tree species is similar to those observed in dry weight of foliage.
The K fertilizer had minor effects on the foliar K concentration and content of the tree species except of PY, suggesting that this nutrient might not play an important role in limiting growth with N or P applications. Similar foliar K concentrations following fertilization could be affected through a diluting effect via increased foliar dry weight with N or P supply levels compared with the N0P0K0 treatment. Additionally, the K in foliage could be increasingly leached after rain from the tree canopy in the different fertilizer treatments because higher fluxes of K from throughfall were observed at more fertile sites compared with sites with a poorer nutrient status [27]. However, the significant high K concentration and content of foliage in PY could be influenced by high soil K availability (0.29 cmolc·kg−1) compared with other tree planting sites of 0.08–0.16 cmolc·kg−1 (Table 2). This result supports that the K concentration in sweetgum (Liquidambar styraciflua L.) foliage was associated with the inherent soil chemical properties rather than fertilization [29].

4. Conclusions

The growth characteristics, such as leaf area, dry weight and specific leaf area in foliage, were not affected by fertilizer compound ratios, whereas fertilization produced high foliar N or P concentrations of four tree species planted in a fire-disturbed urban forest. In contrast to N and P, foliar C and K concentrations and contents in tree species were little affected by fertilization. The foliar N, P, and K concentrations substantially decreased during senescence (October) compared with the growing season (June, August), except for the increased foliar C concentration. There was no clear effect on the foliar nutrient status from different compound ratios (e.g., N3P8K1 and N6P4K1) of fertilizer on different tree species because of the luxury consumption at high N and P doses. These results suggest that a new compound ratio of fertilizer is needed to optimize the vegetation growth of trees planted in fire-disturbed urban forests because of tree species differences on foliage N and P concentration and content following fertilization.

Acknowledgments

This study was carried out with the support of “Forest Science & Technology Projects (Project No. S211212L030320)” provided by Korea Forest Service.

Author Contributions

Choonsig Kim led the writing; Jaeyeob Jeong performed the experiments; and Jae-Hyun Park and Ho-Seob Ma analyzed the data.

Conflicts of Interest

The authors declare no conflict of interest.

References

  1. Weetman, G.F.; Wells, C.G. Plant analyses as an aid in fertilizing forests. In Soil Testing and Plant Analysis, 3rd ed.; Westerman, R.L., Ed.; Soil Science Society of America: Madison, WI, USA, 1990; pp. 659–690. [Google Scholar]
  2. Barron-Gafford, G.A.; Will, R.E.; Burkes, C.; Shiver, B.; Teskey, R.O. Nutrient concentrations and content, their relation to stem growth, of intensively managed Pinus taeda and Pinus elliottii stands of different planting densities. For. Sci. 2003, 49, 291–300. [Google Scholar]
  3. Tausz, M.; Trummer, W.; Wonisch, A.; Goessler, W.; Grill, D.; Jiménez, M.S.; Morales, D. A survey of foliar mineral nutrient concentrations of Pinus canariensis at field plots in Tenerife. For. Ecol. Manag. 2004, 189, 49–55. [Google Scholar] [CrossRef]
  4. Silfverberg, K.; Moilanen, M. Long-term nutrient status of PK fertilized Scots pine stands on drained peatlands in North-Central Finland. Suo 2008, 59, 71–88. [Google Scholar]
  5. Pakaki, D.E.; Carreir, M.M.; Cherrier, J.; Grulke, N.E.; Jennings, V.; Princetl, S.; Pouyat, R.V.; Whitlow, T.H.; Zipperer, W.C. Coupling biogeochemical cycles in urban environments: Ecosystem services, green solutions, and misconceptions. Front. Ecol. Environ. 2011, 9, 27–36. [Google Scholar]
  6. Escobedo, F.J.; Nowak, D.J. Spatial heterogeneity and air pollution removal by an urban forest. Landsc. Urban Plan. 2009, 90, 102–110. [Google Scholar] [CrossRef]
  7. Kim, C.; Koo, K.S.; Byun, J.K.; Jeong, J.H. Post-fire effects on soil properties in red pine (Pinus densiflora) stands. Forest Sci. Tech. 2005, 1, 1–7. [Google Scholar] [CrossRef]
  8. Xue, L.; Li, Q.; Chen, H. Effects of a wildfire on selected physical, chemical and biochemical soil properties in a Pinus massoniana forest in south China. Forests 2014, 5, 2947–2966. [Google Scholar] [CrossRef]
  9. Kim, Y.S.; Byun, J.K.; Kim, C.; Park, B.B.; Kim, Y.K.; Bae, S.W. Growth response of Pinus densiflora seedlings to different fertilizer compound ratios in a recently burned area in the eastern coast of Korea. Landsc. Ecol. Eng. 2014, 10, 241–247. [Google Scholar] [CrossRef]
  10. Garrison, M.T.; Moore, J.A.; Shaw, T.M.; Mika, P.G. Foliar nutrient and tree growth response of mixed-conifer stands to three fertilization treatments in northeast Oregon and north central Washington. For. Ecol. Manag. 2000, 132, 183–198. [Google Scholar] [CrossRef]
  11. Amponsah, I.G.; Comeau, P.G.; Brockley, R.P.; Lieffers, V.J. Effects of repeated fertilization on needle longevity, foliar nutrition, effective leaf area index, and growth characteristics of lodgepole pine in interior British Columbia, Canada. Can. J. For. Res. 2005, 35, 440–451. [Google Scholar] [CrossRef]
  12. Miller, J.H.; Allen, H.L.; Zutter, B.R.; Zedaker, S.M.; Newbold, R.A. Soil and pine foliage nutrient responses 15 years after competing-vegetation control and their correlation with growth for 13 loblolly pine plantations in the southern United States. Can. J. For. Res. 2006, 36, 2412–2425. [Google Scholar] [CrossRef]
  13. Kim, C.; Ju, N.K.; Lee, H.Y.; Lee, K.S. Effects of growth, carbon and nitrogen response of foliage in a red pine stand. Korean J. Soil Sci. Fertil. 2013, 46, 9–15. [Google Scholar] [CrossRef]
  14. Kim, C.; Byun, J.K.; Park, J.H.; Ma, H.S. Litter fall and nutrient status of green leaves and leaf litter at various compound ratios of fertilizer in sawtooth oak stands, Korea. Ann. For. Res. 2013, 56, 339–350. [Google Scholar]
  15. Mugasha, A.G.; Pluth, D.J.; Macdonald, S.E. Effects of fertilization on seasonal patterns of foliar mass and nutrients of tamarack and black spruce on undrained and drained minerotrophic peatland sites. For. Ecol. Manag. 1999, 116, 13–31. [Google Scholar] [CrossRef]
  16. Bauer, G.; Schulze, E.-D.; Mund, M. Nutrient contents and concentrations in relation to growth of Picea abies and Fagus sylvatica along a European transect. Tree Physiol. 1997, 17, 777–786. [Google Scholar] [CrossRef] [PubMed]
  17. Oksanen, L. Logic of experiments in ecology: Is pseudoreplication a pseudoissue? Oikos 2002, 94, 27–38. [Google Scholar] [CrossRef]
  18. SAS Institute Inc. SAS/STAT Statistical Software; Version 9.1; SAS Institute Inc.: Cary, NC, USA, 2003. [Google Scholar]
  19. Binkley, D.; Fisher, R. Nutrient management. In Ecology and Management of Forest Soils, 4th ed.; Wiley-Blackwell: Hoboken, NJ, USA, 2013; pp. 254–275. [Google Scholar]
  20. Gough, C.M.; Seiler, J.R.; Maier, C.A. Short-term effects of fertilization on loblolly pine (Pinus taeda L.) physiology. Plant Cell Environ. 2004, 27, 876–886. [Google Scholar] [CrossRef]
  21. Laclau, J.P.; Almeida, J.S.R.; Gonçalves, J.L.M.; Saint-André, L.; Ventura, M.; Ranger, R.; Moreira, R.M.; Nouvellon, Y. Influence of nitrogen and potassium fertilization on leaf lifespan and allocation of above-ground growth in Eucalyptus plantations. Tree Physio. 2009, 29, 114–124. [Google Scholar] [CrossRef] [PubMed]
  22. Wilson, P.J.; Thompson, K.; Hodgson, J.G. Specific leaf area and leaf dry matter content as alternative predictors of plant strategies. New Phytol. 1999, 143, 155–162. [Google Scholar] [CrossRef]
  23. Bert, D.; Danjon, D. Carbon concentration variations in the roots, stem and crown of mature Pinus pinaster (Ait.). For. Ecol. Manag. 2006, 222, 279–295. [Google Scholar] [CrossRef]
  24. Zhang, Q.; Wang, C.; Wang, X.; Quan, X. Carbon concentration variability of 10 Chinese temperate tree species. For. Ecol. Manag. 2009, 258, 722–727. [Google Scholar] [CrossRef]
  25. Jeong, J.; Park, J.-H.; Kim, J.-I.; Lim, J.-T.; Lee, S.-R.; Kim, C. Effects of container volumes and fertilization on red (Pinus densiflora) and black pine (Pinus thunbergii) seedlings growth. Forest Sci. Tech. 2010, 6, 80–86. [Google Scholar] [CrossRef]
  26. Sariyildiz, T.; Anderson, J.M. Variation in the chemical composition of green leaves and leaf litters from three deciduous tree species growing on different soil types. For. Ecol. Manag. 2005, 210, 303–319. [Google Scholar] [CrossRef]
  27. Hagon-Thorn, A.; Varnagiryte, I.; Nihlgard, B.; Armolaitis, K. Autumn nutrient resorption and losses in four deciduous forest tree species. For. Ecol. Manag. 2006, 228, 33–39. [Google Scholar] [CrossRef]
  28. O’connell, A.M.; Grove, T.S. Influence of nitrogen and phosphorus fertilizers on amount and nutrient content of litterfall in a regrowth eucalypt forest. New For. 1993, 7, 33–47. [Google Scholar] [CrossRef]
  29. Scott, A.; Burger, J.A.; Kaczmarek, D.J.; Kane, M.B. Growth and nutrition response of young sweetgum plantations to repeated nitrogen fertilizer on two site types. Biomass Bioenerg. 2004, 27, 313–325. [Google Scholar] [CrossRef]

