1. Introduction
Nitrogen (N) is commonly limiting to conifer forests in much of the Pacific Northwest, USA [
1] as well as the central interior of BC, Canada [
2]. Biological N
2-fixing species have been shown to contribute and mediate important inputs of N to these forests [
3]. In central British Columbia, mature spruce and fir forests, particularly in the wetter ecological zones, can have well-developed and vertically stratified communities of lichen epiphyte, with N
2-fixing cyanolichens predominating (when present) in the lower canopy branches [
4,
5]. This stratification and interaction between upper and lower canopy zones can be further altered by vertical gradients in lichen epiphyte guild to create significant variation in N content [
4] and δ
15N [
6] across a vertical profile of a host tree. Although the presence and guild of epiphytic lichens have been shown to enhance certain aspects of N-cycling, empirical evidence for their forest level significance has been equivocal. For example, the removal of lichens from an oak forest system had no effect on tree growth [
7]. Thus, while atmospheric N contributions from cyanolichens are observed in sub-boreal spruce and fir ecosystems [
8], it is difficult to predict the nature of combined cyanolichen and host conifer tree ecological interactions (
i.e., mutualistic to competitive) over tree to forest spatial and as well as temporal scales.
Stable isotopes have been used experimentally to infer many properties about elemental cycles of important nutrients (most notably C and N) at a variety of temporal and spatial scales and ecological contexts. The ratio of the heavier less common stable isotope to that of the lighter abundant isotope (e.g.,
15N:
14N and
13C:
12C) can be expressed as atom %, but are typically represented in delta (δ) notation, which is not the absolute isotope ratio, but the difference between the sample measurement and an internationally accepted reference standard [
9] in parts per thousand or per mil (‰) [
10]. In theory, natural abundances of isotopes can be used to make inferences about the contributions of N
2-fixing species to forest trees by exploiting the naturally occurring differences in
15N:
14N ratios between plant-available mineral N sources in the soil and that of atmospheric N
2 utilized by N
2-fixing species [
11]. Non-N
2-fixing plants receive their entire N supply from soil N pools and can be expected to be isotopically heavier or lighter than N
2-fixing plants and lichens in concordance with the soil δ
15N. In either case, natural abundances of stable N isotopes have frequently been used to estimate direct or indirect contributions of N
2-fixation to plant N content [
12].
Most terrestrial materials have δ
15N compositions ranging between −20‰ and +30‰ [
13], but lichens have a more restricted range of
15N compositions (−21.5‰ [
14]) to (+18‰ [
15]), and plants even moreso (e.g., −5‰ to +2.9‰ [
16]). The natural abundances and ratios of stable isotope compositions are potentially useful to the researchers quantifying these processes in that they can shift due to isotopic fractionation.
Isotopic fractionation can occur from a variety of processes. For example, N
2-fixation in organisms such as epiphytic cyanolichens does not discriminate between the
15N and
14N and therefore would normally represent N isotope ratios close to the atmospheric δ
15N standard of 0‰. By contrast, non-N
2-fixing elements and processes of forest systems such as ectomycorrhizae (ECM), mineralization of organic nitrogen, nitrification, microbial assimilation of inorganic N, and denitrification can fractionate stable isotopes of N belowground. Nutrient uptake in temperate and boreal trees is predominantly dependent on ECM hyphae growing into the soil from the mycorrhizal root tips [
17]. Högberg
et al. [
18] found that ECM roots of Norway spruce (
Picea abies) and beech (
Fagus sylvatica) were 2‰ enriched in
15N relative to non-mycorrhizal roots. The study also found ECM fungi were enriched in
15N compared to their host plants, further suggesting that
15N ECM discrimination was fungal in origin. ECM fungi were also more enriched in
13C relative to total soil C [
19], demonstrating
13C ECM discrimination. Biologically mediated reactions that control elemental dynamics in soils can result in
15N and
13C enrichment or depletion, making inferences on forest ecosystem N- and C-cycling based on natural abundances of stable isotopes challenging.
Bulk soil δ
15N values are generally higher than atmospheric N (positive, ~5–10‰), a result of faster losses of the lighter isotope in soil N during decomposition [
20], usually with increasing (more positive) deltas with increasing depth of organic (‘L’, ‘F’, and ‘H’) and mineral horizons [
21]. Thus, fractionation of isotopes during litter decomposition in forests causes surface soils to have lower δ
15N values than deeper soil horizons [
22]. Even slight fractionations occurring over decades of transfers of N from mineral soil to forest biomass can be sufficient enough to increase δ
15N of soil organic matter by ~6–8‰ [
23]. Surface soils located beneath trees have also been found to have lower δ
15N values than those in open areas as a result of litter deposition [
24], making decomposing epiphytic lichens an important factor influencing soil N isotope composition.
Nitrogen-fixing plants in western North American forest systems typically have more positive δ
15N values than non-N
2-fixing plants, and/or are closer to the of atmospheric N
2 [
25,
26]. The differences between these plant δ
15N values provide the basis of the
15N natural abundance technique for estimating fixed-N contributions to terrestrial ecosystems [
24]. However, attempting to trace fixed-N through ecosystems can be complicated by a myriad of fractionations, which are caused by numerous and often serial pathways of mineralization, nitrification, immobilization, and denitrification within the soil, plant root and mycorrhizal fungus mediation of soil N uptake [
27].
Nutrient cycling processes in the soil are known to vary with plant community composition [
28]. The processes associated with litter decomposition and enzymatic transformations of organic substrates in particular can vary because of differences in a variety of factors such as chemistry of the litter material, soil biota and soil chemistry associated with different plant species [
29]. Both litter accumulation and stem flow can deliver N to epiphytes from various N pools [
6], making the abundance and branch position of lichens on a tree significant. Lichens may play an important role in nutrient cycling in forest ecosystems, but the relative impact of lichens compared to other ecosystem components is not well understood. The effect of lichens on forest N-cycling could range from large in ecosystems where epiphytic lichens, especially cyanolichens are abundant, to insignificant where lichens are only present in low amounts [
30].
In this study, we examine the importance of the vertical distributions of arboreal lichen biomasses [
5] to the N-status of wet sub-boreal spruce and fir forest ecosystems of the central interior of BC, Canada. To do this, we measured the
15N:
14N, %N of host tree (
i.e., conifer) foliage, host tree epiphytic lichen functional groups and organic and mineral soil horizons under the tree crowns at sites containing variable amounts of cyanolichen tripartite (
i.e.,
L. pulmonaria) and bipartite lichens from relatively low to high levels. We hypothesized that sub-boreal forest trees with high cyanolichen abundance should have higher needle %N reflecting the greater inputs of biologically fixed-N into these systems [
8,
31]. Knowledge obtained from this study should provide valuable information on the functional importance of epiphytic (N
2-fixing) cyanolichens to the N-status of wet sub-boreal conifer ecosystems of central BC.
2. Experimental Section
2.1. Study Area
The study area was described previously by Kobylinski and Fredeen [
5]. In brief, this field study was carried out on the north side of the Fraser River near the town of Upper Fraser, BC, located approximately 70 km NE of Prince George, BC. All study sites were characterized by having relatively cool and moist summers and cold, snowy winters. Four mature sub-boreal forest sites were chosen based on having trees with predominantly high (High Cyano) or low (Low Cyano) epiphytic cyanolichen abundance and diversity, denoted as ‘Upper Fraser’ and ‘Herrick’ in previous work [
5,
32], respectively.
The two dominant tree species representing the vast majority of the canopy trees at all four sites were interior hybrid spruce (
Picea engelmannii Parry ex Engelm. x
glauca (Moench)) and subalpine fir (
Abies lasiocarpa (Hook.) Nutt.) High Cyano sites were in “sub-boreal spruce” (SBS) ‘wk1’ and the ‘vk’ subzones (BC Biogeoclimatic Ecosystem Classification scheme) with a mean elevation of 680 m above sea level (a.s.l.), mean summer temperature of 11.8 ± 5.3 °C and relative humidity of 78% [
8]. Low Cyano sites had lower average cyanolichen abundances and diversities and were located within 10–20 km of the High Cyano sites at a slightly higher mean elevation of 850 m a.s.l. and similar mean summer temperature and relative humidity of 10.8 ± 5.3 °C and 78%, respectively [
8]. Soils at all sites were Orthic Humo-Ferric Podzols formed from sandy-colluvial materials at the High Cyano sites and from sandy–skeletal glaciofluvial materials at the Low Cyano sites. Average precipitation in the ecotonal study area is approximately 897 mm per year [
8].
2.2. Canopy Access and Biomass Sampling
Sample tree selection, canopy access and biomass sampling procedures were previously described in Kobylinski and Fredeen [
5]. In brief, trees were selected randomly from High Cyano and Low Cyano sites, with the exception of the fact that trees adjacent to Sitka alder (
Alnus viridis) were excluded from the study given that annual N-inputs from Sitka alder can be substantial [
26] and could have confounded
15N natural abundance interpretation. All study trees were canopy trees and in excess of 22 m in height and 20 cm in DBH. Needles and lichens were sampled from each canopy height zone at the highest accessible point of each of the 32 study trees. Access into canopies was achieved through a single rope technique [
33,
34]. Selected trees were rigged, climbed and assessed vertically for epiphytic lichen biomass.
Lichen and needle sampling was described previously [
5]. Briefly, epiphytic lichen functional group or species and host tree needle samples were collected over two summers: June to August 2008 and May to September 2009 at various heights within sample tree canopies. All cyanolichens in these mature forest tree sites were almost exclusively arboreal and on branches, with negligible cyanolichen occurring on the forest floor [
35]. Bryophytes were essentially absent from all canopies, as is normal for these forest types [
35]. Lichen biomasses were separated into five primary categories or functional groups based on biomass dominance by single species or functional group properties within different vertical canopy zones:
Alectoria sarmentosa (Ach.) Ach.,
Bryoria Brodo & D. Hawksw. species, foliose chlorolichens, bipartite cyanolichens, and
Lobaria pulmonaria (L.) Hoffm., the only tripartite cyanolichen at the site. The needle cohort was taken exclusively from the previous year’s foliage to keep the age of the sampled needles constant. A processed and homogeneous sample for each functional group or needle was sent for isotopic analysis from the upper, middle and lower canopy height zones provided they were present in that zone.
2.3. Composite Soil Sampling
Soil samples were collected from the base of each sample tree between June and August 2009. We extracted soil cores using a soil auger (7.5 cm in diameter) by rotating the auger while applying downward force and lifting out the full blades. Soil core samples were extracted from a 1-m radius around each sample tree base in each of the cardinal directions. Samples were separated into three distinct layers: F-folic layer composed of organic matter rich in mycelia (~5 cm ± 2 cm deep), Ae-grayish surface soil layer (~2–10 cm thick); and Bf—yellowish brown to reddish brown subsoil layer (~10–20 cm). All layers were distinct and could be easily separated from each other; the soil auger was cleaned between cores. The three layers of the four subsamples were air dried for two days at room temperature (~22–25 °C), roots were removed and soil sieved through a 2-mm sieve. The F-layer samples were separated twice more (0.85 mm and 0.3 mm sieves) to remove small pieces of woody debris before composite samples were prepared. Composite samples were also made from the four Ae and Bf subsamples from each site. A dry weight of 2 g from each of the three layers of the four samples was mixed into one composite sample per soil layer (8 g dry weight), for a total of 96 soil samples.
2.4. Stable Isotope Analyses
Sample preparation of lichen, needle and soil samples took place at the University of Northern British Columbia (UNBC) before samples were shipped to the Stable Isotope lab at the University of Saskatchewan (U of S) in Saskatoon, Canada for analysis. Lichen and needle samples were oven dried for three days at 55 °C in paper bags. Samples were ball-milled (Retsch MM301, Hann, Germany) to a particle size of less than 250 µm and any fibrous matter or visible granules removed to improve precision of isotopic analysis. Ball-mill chambers were cleaned with deionized water and dried between samples. Samples (2 ± 0.2 mg) were stored in scintillation vials and encapsulated in 8 × 5-mm tin capsules (Catalog # D1008, Elemental Microanalysis Limited, Okehampton, UK) before combustion.
Soil, needle and lichen samples were analyzed using an elemental analyzer (Costech ECS4010, Valencia, CA, USA) coupled to a Delta V Advantage isotope ratio mass spectrometer with continuous flow (Conflo IV, Thermoscientific, Waltham, MA, USA) interface. The continuous flow gas isotope ratio mass spectrometer was used to measure % N, % C and the relative abundance of stable isotopes (15N, 14N, 13C, and 12C) in needle, lichen, and soil samples. Isotope ratio calibrations were performed with IAEA-N1, IAEA-N2, IAEA-NO-3, IAEA-CH6, and USGS-24 standards (International Atomic Energy Agency, 1995).
2.5. Natural Abundance Method
The δ values for
15N and
13C were calculated using equations 1 and 2, respectively.
The value
R is the ratio of heavy isotope (
15N and
13C) to their lighter more abundant isotope.
2.6. Statistical Analyses
Data were analyzed using Sigma Plot 11 (Systat Software Inc., San Jose, CA, USA). Ordinary least square (OLS) multiple linear regression analyses were performed to address whether there were statistically significant differences in: (1) δ15N and δ13C between lichen functional groups and needles controlling for tree branch height, tree species, and lichen abundance; (2) δ15N and δ13C by tree branch height controlling for lichen functional groups and needles; (3) δ15N and δ13C between High and Low Cyano sites controlling for lichen functional groups, needles and soil; (4) δ15N and δ13C between tree species (spruce and fir) controlling for the lichen functional groups, needles and soil; and (5) foliar (needle) %N at sites with higher abundances of cyanolichen. The unstandardized coefficient (B) for OLS linear regression analyses provide an estimate of the change in the dependent variable associated with a one-unit change in the identified independent variable controlling for all other independent variables.
Six OLS regression models were created to predict: (i) δ15N in lichen functional groups; (ii) δ15N in needles; (iii) δ13C in lichen functional groups; iv) δ13C in needles; (v) δ15N in soil; and (vi) δ13C in soil. Correlation analyses were conducted between all the variables in each model to check for potential collinearity. Additional correlations were also conducted to look at the relationships between needle δ15N and cyanolichen abundance, % N and cyanolichen abundance, and soil δ15N and cyanolichen abundance.
Kolmogorov-Smirnov and Shapiro-Wilk tests were used to determine normality of data. Both tests showed lichen and needle δ15N (KS = 0.191, p < 0.001 and W = 0.886, p < 0.001) and δ13C (KS = 0.122, p < 0.001 and W = 0.949, p < 0.001) were not normally distributed. However, because of bimodal distributions of the dependent variable, data transformations were not used. The distribution of lichen and needle δ15N and δ13C (but not soil) showed some signs of heteroscedasticity and non-linearity across all independent variables.
3. Results
Nitrogen contents varied by over six-fold among lichen epiphytes sampled. At the extremes,
Alectoria sarmentosa had the lowest % N (0.50 ± 0.13) and bipartite cyanolichens had the greatest %N (3.24 ± 0.52) on a dry weight basis (
Figure 1).
Bryoria spp. and foliose chlorolichens had very similar %N contents of 0.77 ± 0.18 and 0.73 ± 0.19, respectively. Needles had a higher %N content (1.11 ± 0.14) than hair lichens and foliose chlorolichens but not as high as
L. pulmonaria (2.26 ± 0.30). The differences in mean %N between functional groups were significant (F
5,404 = 950.3,
p < 0.001: Tukey test) except for
Bryoria spp. and foliose chlorolichens (
Figure 1).
Figure 1.
Mean %N (± SD) of lichen biomass in functional groups of lichen and foliage (needle) from 32 spruce and fir study trees with varying amounts of tree-level cyanolichen abundance. Different letters above error bars indicate significant (p < 0.001) differences between lichen functional groups (Tukey multiple mean comparison test).
All lichen functional groups or species and conifer foliage (needle) had mostly unique δ
15N signatures relative to their %N (
Figure 2).
Bryoria spp. hair lichens at the top of the canopy had the lowest δ
15N, while the hair lichen
Alectoria sarmentosa found lower in the canopy had slightly lower %N and higher δ
15N than
Bryoria. Host tree needles and foliose chlorolichens had δ
15N values that were intermediate between hair lichens and cyanolichens but similar %N. While
L. pulmonaria and bipartite cyanolichens both had δ
15N values close to atmospheric N
2 (δ
15N = 0),
L. pulmonaria had 1.5-times less N on average (
Figure 2). Mean δ
15N isotope values were slightly higher at Low Cyano sites for all lichen functional groups and host tree needles, but there was no significant difference in the δ
15N values or %N of lichens or needles on trees from High Cyano (black symbols)
versus Low Cyano (white symbols) sites (
Figure 2).
Figure 2.
Mean (± SD) % N and δ15N signatures of five epiphytic lichen and host tree foliage (needle) biomasses across four sites and two host tree species from sub-boreal spruce and fir forests in central interior BC. Half of the host trees were from high (High Cyano: black symbols) and the other half from low (Low Cyano: white symbols) cyanolichen abundance sites.
When we compared δ
15N of living conifer foliage (needle) on each of the 32 study trees to their actual cyanolichen abundance, there was a small, but ultimately not significant (
r = −0.16,
p = 0.121) negative correlation between mean needle δ
15N and increasing cyanolichen abundance (
Figure 3a). Host tree foliage (needles) %N showed a significant but weak positive correlation to actual tree-level cyanolichen abundance (
r = 0.24,
p = 0.019;
Figure 3b).
When lichen species, tree branch height, and tree species were controlled for, cyanolichen abundance in the canopy was a statistically significant but ineffective predictor of δ
15N (B < 0.001,
p < 0.001,
Table 1). The regression coefficients of the dependent variable δ
15N suggest that lichen species and cyanolichen abundance, but not tree species or tree branch height, were significant predictors of δ
15N in lichen functional groups. The regression analyses also show that
A. sarmentosa (B = −3.657,
p < 0.001),
Bryoria spp. (B = −4.838,
p < 0.001) and foliose chlorolichen (B = −0.482,
p = 0.002) tree-level abundances were all negatively related to their δ
15N signatures. Conversely, bipartite cyanolichens (B = 0.561,
p < 0.001) and
L. pulmonaria (B = 1.608,
p < 0.001) tree-level abundances were positively related to their δ
15N signatures. Both tree species (B = −0.166,
p = 0.095) and tree branch height (B = 0.010,
p =0.238) were not significantly related to δ
15N levels in lichen functional groups (data not shown) and insignificant or with a very small coefficient for δ
15N in needles (B = 0.028,
p = 0.002). Similarly, tree species (B = −0.146,
p = 0.267) and cyanolichen abundance (data not shown) were not significant predictors of δ
15N in lichen or host-tree foliage.
Figure 3.
Mean(a) δ15N and (b) %N of host tree foliage (needle) from low to high tree-level cyanolichen abundance (total g tree−1).
Figure 3.
Mean(a) δ15N and (b) %N of host tree foliage (needle) from low to high tree-level cyanolichen abundance (total g tree−1).
Table 1.
Linear regression (OLS) coefficients with standard error for the regression model predicting δ15N of lichen functional groups (F = 220.501, p < 0.001, R2 = 0.817) and host tree needles (F = 4.363, p = 0.006, R2 = 0.126) based on tree species (spruce and fir), cyanolichen abundance, tree branch height, and lichen species or functional group.
| | Lichen Functional Groups (Model i) | Needles (Model ii) |
|---|
| | Unstandardized coefficient (B) | Std Error | Unstandardized coefficient (B) | Std Error |
| Intercept | −1.126 *** | 0.165 | −1.499 *** | 0.171 |
| Tree species (Spruce) | –0.166 | 0.099 | −0.146 | 0.131 |
| Tree branch height | 0.010 | 0.008 | 0.028 ** | 0.009 |
| Alectoria sarmentosa | −3.657 *** | 0.168 | | |
| Bryoria spp. | −4.838 *** | 0.183 | | |
| Foliose chlorolichen | −0.482 ** | 0.156 | | |
| Bipartite cyanolichen | 0.561 *** | 0.137 | | |
| Lobaria pulmonaria | 1.608 *** | 0.165 | | |
Soil horizon (F, Ae and Bf) δ
15N values were consistently higher at Low Cyano (means: F = 1.340, Ae = 5.130, Bf = 6.262) than at High Cyano (F = 0.782, Ae = 4.765, Bf = 5.383) sites, and decreased with increasing cyanolichen abundance in all three horizons (
Figure 4A–4C), respectively. The abundances of cyanolichens and δ
15N were negatively correlated in all three soil horizons, with correlations being nearly significant for the uppermost horizons (F:
r = −0.341,
p = 0.056; Ae:
r = −0.263,
p = 0.146), and significant for the Bf horizon (
r = −0.356,
p = 0.045). Total %N in the F-horizon decreased with increasing tree-level cyanolichen abundance (
Figure 4D), but was relatively unaffected in Ae and Bf horizons (
Figure 4E and 4F).
Figure 4.
Mean δ15N and %N of (A and B) the surface organic F horizons, (B and E) upper-most mineral (Ae) horizons and (C and F) lower mineral (Bf) horizons, respectively, beneath host trees with varying levels of cyanolichen abundance (total g tree−1).
Figure 4.
Mean δ15N and %N of (A and B) the surface organic F horizons, (B and E) upper-most mineral (Ae) horizons and (C and F) lower mineral (Bf) horizons, respectively, beneath host trees with varying levels of cyanolichen abundance (total g tree−1).
Tree species and both upper mineral soil horizons were all significant predictors and all contributed to the overall relationship of both soil δ
15N and δ
13C (
Table 2). Cyanolichen abundance was a significant predictor for both soil δ
15N and δ
13C, but coefficients were <0.01 and therefore not relevant (data not shown). There was also a statistically significant difference in soil δ
15N (B = −0.525,
p < 0.001) and soil δ
13C (B = −0.221,
p = 0.009) between host tree species (spruce and fir).
Table 2.
Linear regression (OLS) coefficients with standard error for the regression model predicting δ15N (F = 314.044, p < 0.001, R2 = 0.932) and δ13C (F = 117.897, p < 0.001, R2 = 0.838) of soil based on tree species, and Ae and Bf soil horizons.
Table 2.
Linear regression (OLS) coefficients with standard error for the regression model predicting δ15N (F = 314.044, p < 0.001, R2 = 0.932) and δ13C (F = 117.897, p < 0.001, R2 = 0.838) of soil based on tree species, and Ae and Bf soil horizons.
| | δ15N | δ13C |
|---|
| | Unstandardized coefficient (B) | Std. Error | Unstandardized coefficient (B) | Std. Error |
| Intercept | 1.586 *** | 0.140 | −26.923 *** | 0.094 |
| Tree species | −0.525 *** | 0.123 | −0.221 ** | 0.062 |
| Mineral surface soil (Ae) | 3.887 *** | 0.145 | 1.523 *** | 0.097 |
| Mineral subsoil (Bf) | 4.777 *** | 0.145 | 1.961 *** | 0.097 |
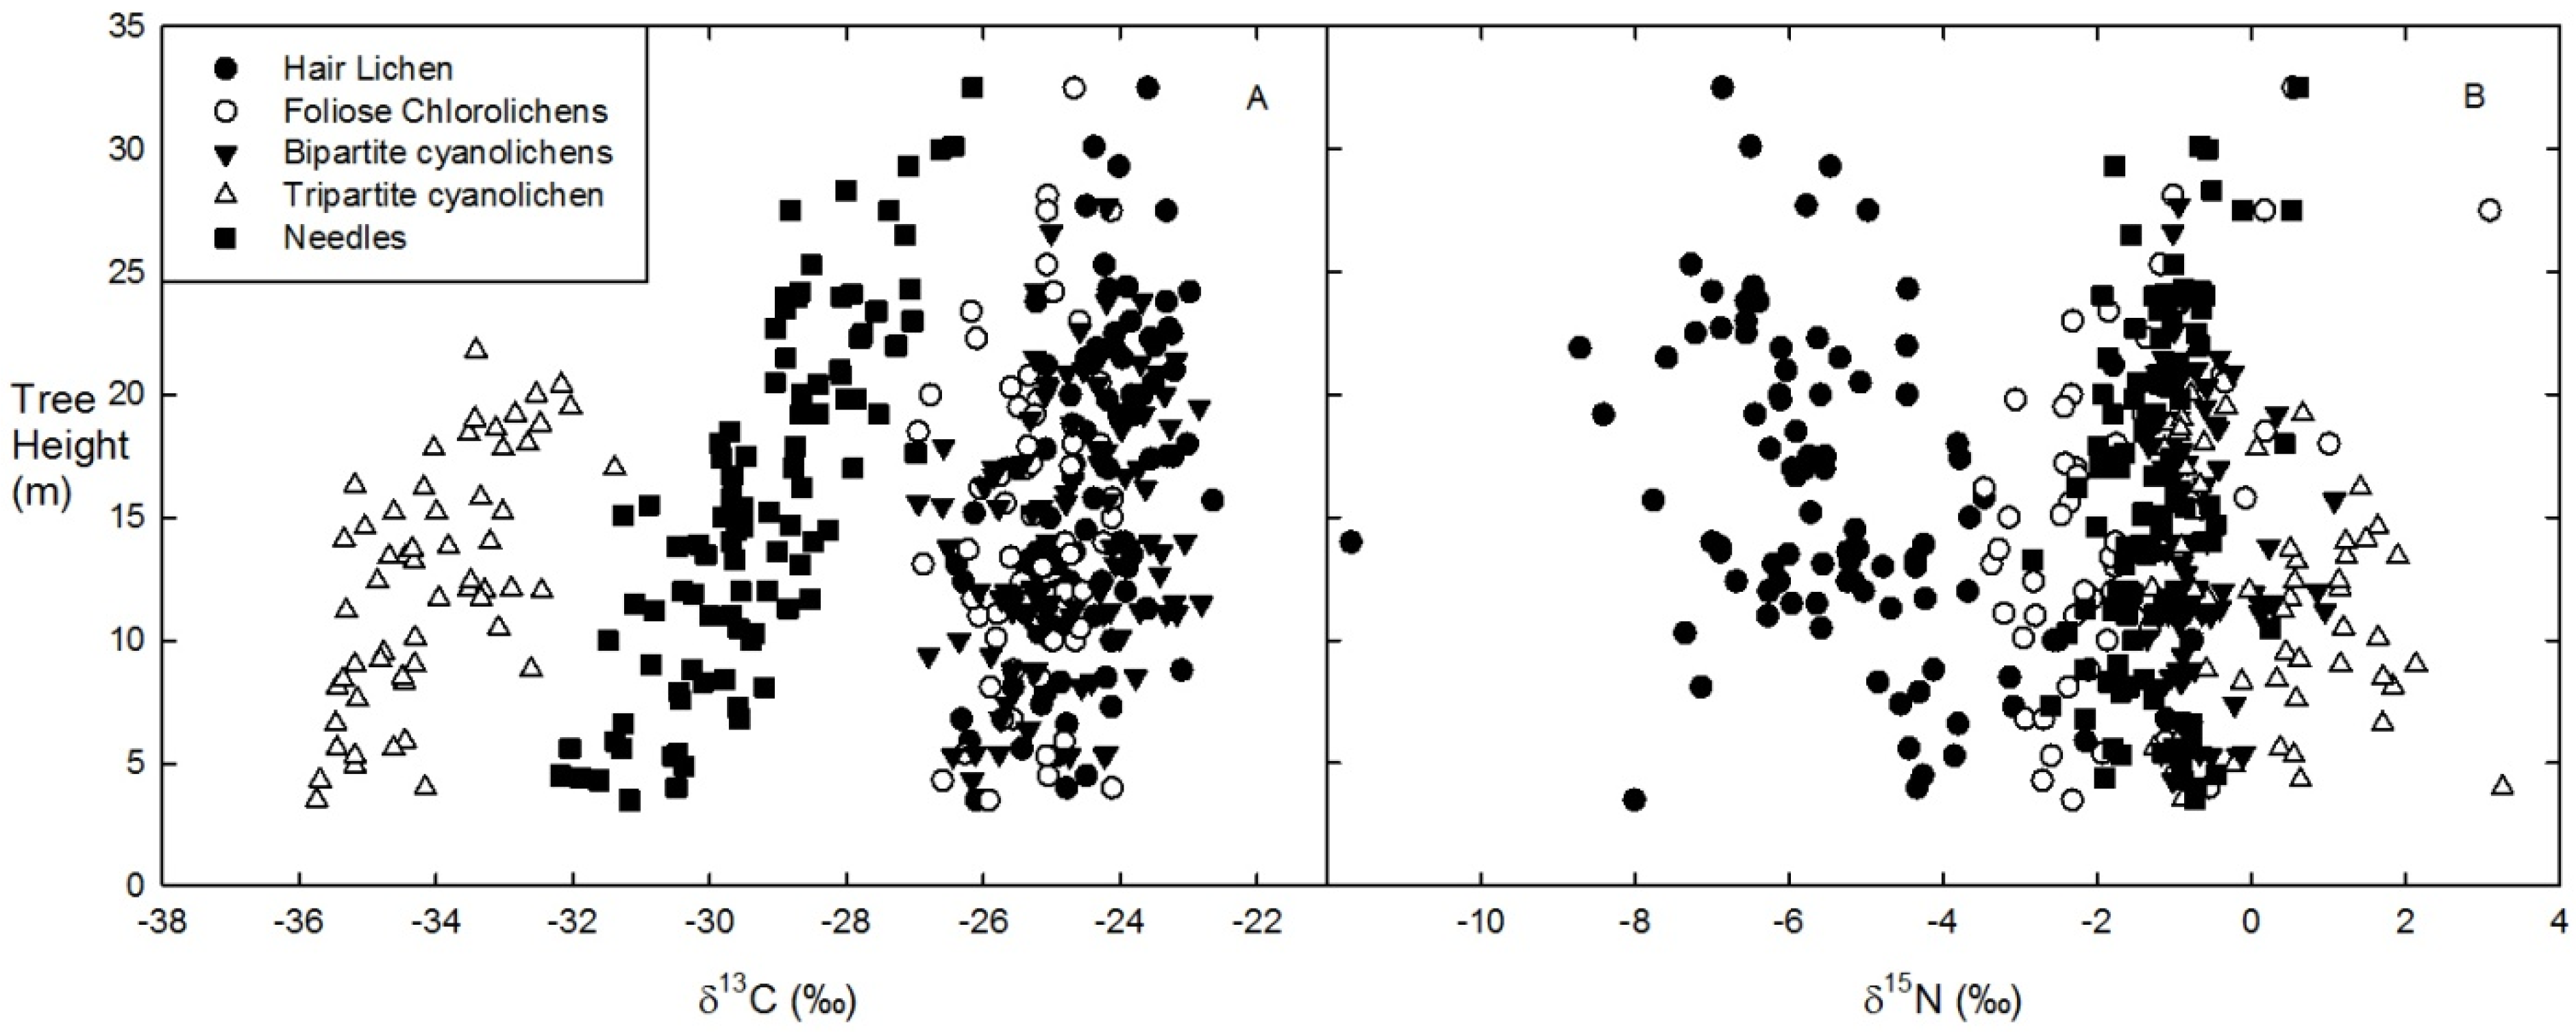
When controlling for all independent variables, tree species and branch height were significant predictors of δ
13C of host-tree foliage (needles) and to lesser extents for lichen epiphytes (
Table 3 and
Figure 5A). Trends of increasing (less negative) δ
13C values with increasing branch height were evident for both
L. pulmonaria and tree foliage (
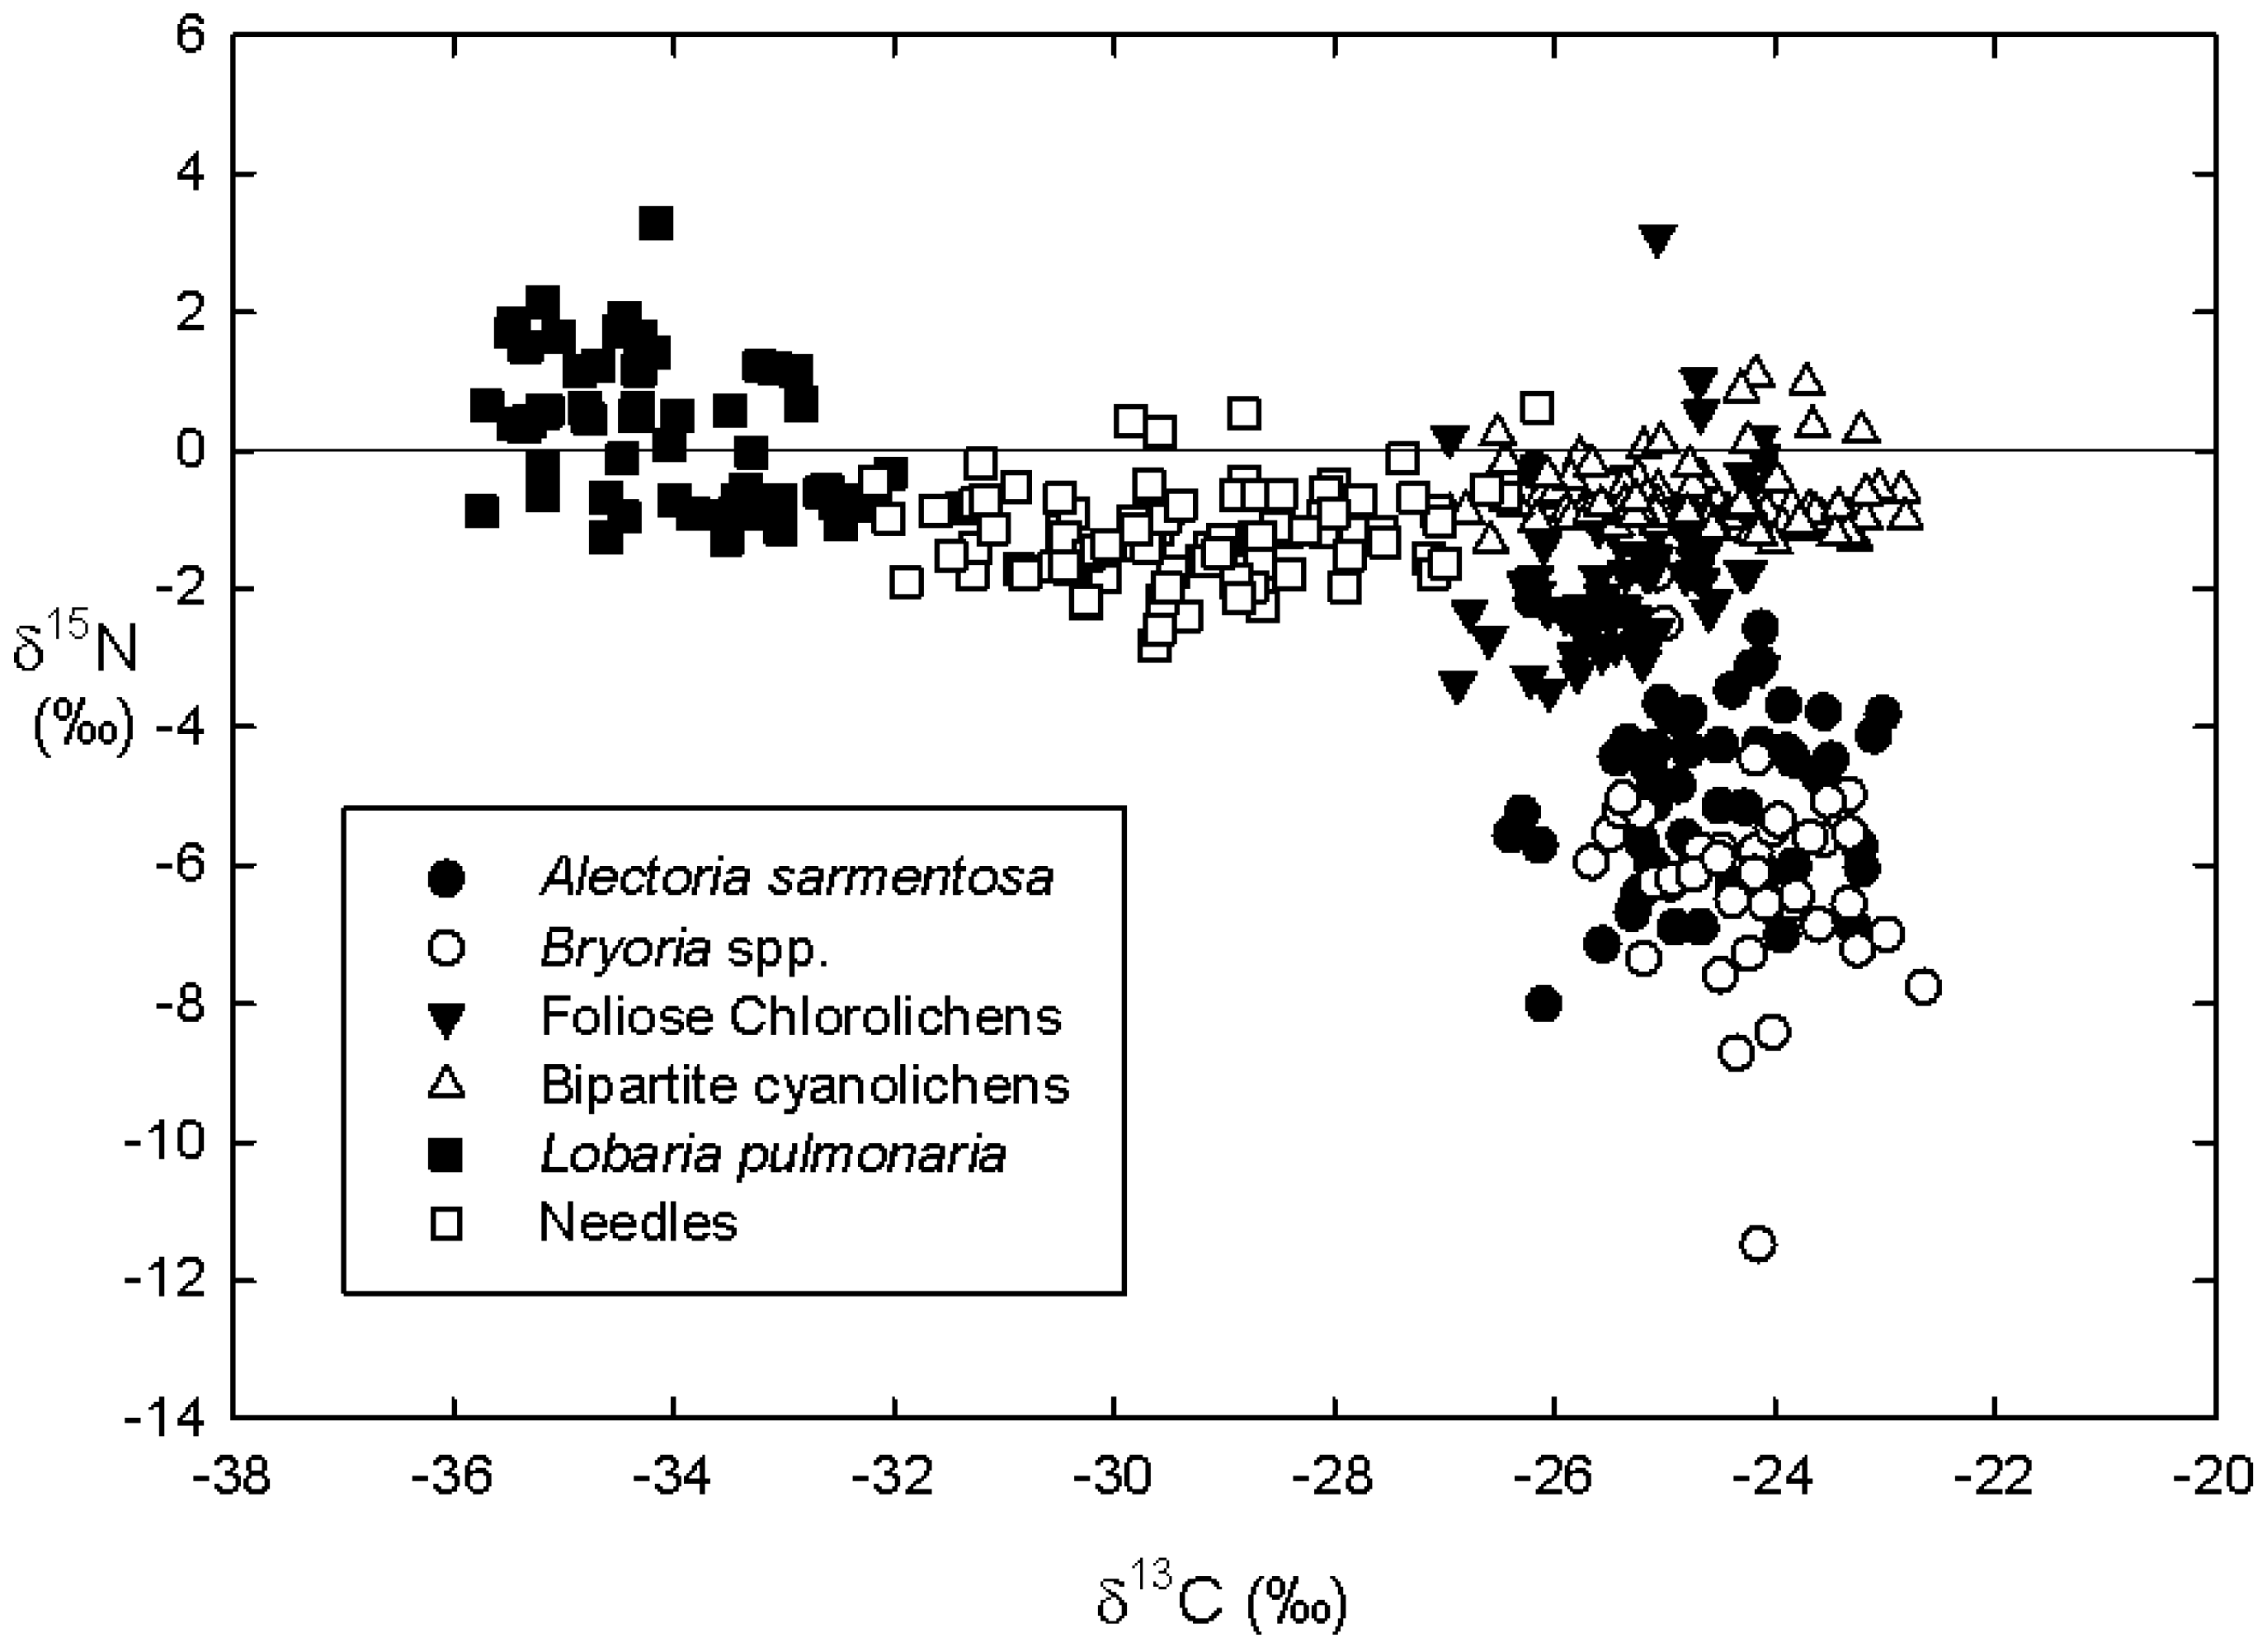
Figure 5A). There was evident clumping of δ
13C into three distinct groups (
Figure 5A and
Figure 6). Specifically, δ
13C values of the lone tripartite cyanolichen (
L. pulmonaria) were lower than host tree needles, which were in turn lower than hair lichens (
A. sarmentosa and
Bryoria spp.), bipartite cyanolichens and foliose chlorolichens.
Figure 5.
Variation in the natural abundances of (A) δ13C and (B) δ15N of five epiphytic lichen functional group and host tree foliage (needle) biomasses according to tree branch height for all sites.
Figure 5.
Variation in the natural abundances of (A) δ13C and (B) δ15N of five epiphytic lichen functional group and host tree foliage (needle) biomasses according to tree branch height for all sites.
Table 3.
Linear regression (OLS) coefficients with standard error for the regression model predicting δ13C in lichen functional groups (F = 711.517, p < 0.001, R2 = 0.942) and needles (F = 79.545, p < 0.001, R2 = 0.724) based on tree species (spruce), tree branch height and lichen functional groups.
| | Lichen Functional Groups
(Model iii) | Needles
(Model iv) |
|---|
| | Unstandardized coefficient (B) | Std. Error | Unstandardized coefficient (B) | Std. Error |
| Intercept | −30.523 *** | 0.154 | −31.868 *** | 0.204 |
| Tree species (Spruce) | 0.048 | 0.089 | 0.622 *** | 0.156 |
| Tree branch height | 0.093 *** | 0.008 | 0.148 *** | 0.011 |
| Alectoria sarmentosa | 4.899 *** | 0.151 | | |
| Bryoria spp. | 4.513 *** | 0.164 | | |
| Foliose chlorolichen | 3.969 *** | 0.140 | | |
| Bipartite cyanolichen | 4.324 *** | 0.166 | | |
| Lobaria pulmonaria | −4.358 *** | 0.149 | | |
Hair lichens
A. sarmentosa and
Bryoria spp. had uniformly negative δ
15N values that were also more negative than all other functional groups (
Figure 5B), and trending lower with increase in branch height. The δ
15N of other lichen functional groups and host-tree foliage did not appear to be influenced by branch height.
Host tree needles had δ
13C values intermediate to
L. pulmonaria and all other lichen functional groups (
Figure 6), but at distinctly higher C concentrations than all lichen groups (
Figure 7). Lichen functional groups, cyanolichen abundance, tree branch height, and the interaction between cyanolichens and site cyanolichen abundance (but not tree species) were significant predictors of δ
13C in lichen functional groups. The regression analyses showed that
A. sarmentosa (B = 4.899,
p < 0.001),
Bryoria spp. (B = 4.513,
p < 0.001), foliose chlorolichens (B = 3.969,
p < 0.001), and bipartite cyanolichens (B = 4.324,
p < 0.001) were positively related to δ
13C levels in lichen functional groups (
Table 2). Conversely,
L. pulmonaria (B = −4.358,
p < 0.001) was negatively related to δ
13C levels in lichen functional groups. Both cyanolichen abundance (B = −0.001,
p < 0.001) and tree branch height (B = 0.093,
p < 0.001) were significantly related to δ
13C levels in lichen functional groups. There was also a statistically significant interaction between cyanolichens and site cyanolichen abundance and δ
13C increased slightly as site-level cyanolichen abundance increased (B = 0.001,
p = 0.005,
Table 2). There was no significant difference in δ
13C between sample tree species spruce and fir in lichen functional groups (B = 0.048,
p = 0.594,
Table 2). Alternatively, both tree species (B = 0.622,
p < 0.001) and tree branch height (B = 0.148,
p < 0.001), but not cyanolichen abundance (B < 0.001,
p = 0.942), were significant predictors of δ
13C in needles (B = 0.028,
p = 0.002).
Figure 6.
Dual natural abundance isotope plot of δ15N versus δ13C of the five epiphytic lichen functional group and host tree foliage (needle) biomasses across four sites and two host tree species.
Figure 6.
Dual natural abundance isotope plot of δ15N versus δ13C of the five epiphytic lichen functional group and host tree foliage (needle) biomasses across four sites and two host tree species.
Figure 7.
Mean (± SD) C concentrations versus δ13C signals of five epiphytic lichen functional group and host tree foliage (needle) biomasses across four sites and two host tree species.
Figure 7.
Mean (± SD) C concentrations versus δ13C signals of five epiphytic lichen functional group and host tree foliage (needle) biomasses across four sites and two host tree species.
4. Discussion
Nitrogen-fixing cyanolichen epiphytes can be both diverse and abundant in conifer forests of central BC, and have been conjectured to be an important component of the N-cycle in these forest locations [
4,
8,
32,
36]. Although lichen N pool sizes and decomposition rates in these studies were indicative of enhanced mineral N flux rates, as observed in other forests types [
7], direct links between cyanolichen abundance and improved host tree N status have been elusive. In our study, gradients in cyanolichen abundance across host trees (interior hybrid spruce and subalpine fir) in two generally high cyanolichen abundance sites and two generally low cyanolichen abundance sites [
8,
32] provided us with an opportunity to examine the potential for enhanced cyanolichen N-inputs into these forests in central BC. We hypothesized that foliar (needle) N contents would be positively correlated with cyanolichen abundance, and in fact this was found to be the case, albeit the relationship was not strong (
Figure 3b). We further sought to more directly link increased host tree foliar N with cyanolichen N using the natural abundances of
15N and
14N of forest tree, lichen and soil components of these systems.
Our results corroborate previous findings of δ
15N values in lichen functional groups and or species. It is already known that cyanolichens that fix N
2 typically have δ
15N values close to atmospheric N
2,
i.e., 0‰ [
37,
38]. We also found δ
15N values close to 0‰ for both bipartite and tripartite (
L. pulmonaria) cyanolichens in our study. By contrast, other non-N
2-fixing arboreal macrolichens (hair and chlorolichen) as well as host-tree foliage all had δ
15N values that were negative and less enriched in
15N than either cyanolichen functional group. Hair lichens had the lowest δ
15N, while chlorolichens and host tree foliage were intermediate. Interestingly,
A. sarmentosa, occurring lower in the canopy than
Bryoria spp., and therefore overlapping with cyanolichen canopy zones [
5], had δ
15N closer to atmospheric δ
15N (
i.e., 0) (
Figure 2). This is consistent with
A. sarmentosa receiving more leached-N from cyanolichens than
Bryoria spp., and supported by the fact that an increase in the δ
15N of
A. sarmentosa was observed in High Cyano sites, while relatively little change in δ
15N was observed for
Bryoria spp. In both hair lichens, relatively low N contents and low δ
15N (~–6 ‰ in Low Cyano sites) were consistent with low atmospheric N inputs in central BC [
39] and the negative δ
15N of precipitation N measured in other studies [
31].
Although biological N
2-fixation may represent a significant N input into ecosystems, both via leaching (less well documented) and decomposition, it may be difficult to identify because of its small relative isotopic effect against the background of ecosystem component δ
15N signatures [
12]. Nitrogen isotope signatures of epiphytes varied across functional groups and with canopy position, but the reason for lichen δ
15N variability with canopy position in most studies remains unexplained. The δ
15N of hair lichens, with single sources of N (
i.e., atmospheric fixed-N), are relatively easy to explain relative to other lichens (cyanolichen and chlorolichen) lower in the canopy where inputs and outputs are more complex. At least 10 processes have been identified that can alter δ
15N values, none of which can currently be separated out in field studies [
9]. Key explanations for δ
15N variability in lichens are: (i) a preference for uptake of the lighter
14N isotope which can then lead to δ
15N enrichment of outputs [
40]; (ii) fractionation of N isotopes in gaseous phase ammonia is greater than in the liquid phase of nitrate; and (iii) transfer of organic N which can result in increased
15N depletion of the photobiont and less depletion in the mycobiont [
41]. In general, our results were in agreement with previous work showing that lichens with a green alga as their photobiont (all lichens except bipartite cyanolichens) showed greater relative
15N depletion [
42] (
Figure 1).
Soil δ
15N values increased with soil depth in our study, consistent with results of Gebauer and Schulze [
43]. In keeping with our expectations, we also observed decreasing trends in δ
15N with increasing cyanolichen abundance in all soil horizons (
Figure 4A–4E) equating to less positive soil horizon δ
15N values, more proximal to the δ
15N of cyanolichen biomasses which were uniformly close to zero. There are many reasons why soil δ
15N wouldn’t necessarily be closely correlated with tree δ
15N. First, measured δ
15N of soil pools may not represent the true isotopic composition of N available to plant roots, since most of the N in soils is bound in forms that are not immediately available to plants [
25,
44]. Second, only a few % of total soil N becomes available in a year [
18], and symbiotic fungi (mycorrhizae) can alter the δ
15N of the N transferred from soil to host plant. Nevertheless, a similar downward trend in tree foliage δ
15N at our sites with increasing abundance of cyanolichen (
Figure 3) was consistent with the downward trend in soil δ
15N (
Figure 4A–4C). Explaining the increase in %N of host tree foliage with increased cyanolichen abundance is difficult to reconcile with total soil N. If greater cyanolichen inputs of N increased soil N concentrations, then a straightforward mass action of greater plant N uptake could have explained enhanced foliar %N. However, soil N decreased in all soil horizons, though not significantly, with higher cyanolichen abundance (
Figure 4D–4F). Since total soil N does not in any way equate with amounts and forms of available inorganic N, it is possible that more readily available N fractions were more available at high abundance cyanolichen sites, even though total %N was not. Further work on soil N at these sites would be required to test this hypothesis.
Foliar (needle) δ
15N values in our host trees ranged between 0.6 and −2.8‰ and did not differ significantly between High and Low Cyano sites or tree branch height. However, there was a trend of decreasing foliar δ
15N with increasing cyanolichen abundance (
Figure 3a). Gebauer and Schulze [
43] reported lower, but overlapping, δ
15N values for conifer needles (between −2.5 and −4.1‰), which varied according to stand and age, with foliage from the healthiest site having the lowest δ
15N. It is unclear why the range of δ
15N values observed by Gebauer & Schulze were more negative than ours, but one possibility would be the presumed greater atmospheric N inputs in these European forests when compared to the N-limited forests of central BC. Gebauer and Schulze [
43] also reported a similar trend of δ
13C values of needles, which ranged between −26.2 and −32.2‰ and did not differ between lichen abundance sites but did change with canopy height. Similar to our study, needle δ
l3C values were not significantly different between abundance sites (
Table 3), were more negative in the lower canopy and increasing with branch height (
Figure 5).
Lichen δ
13C values were previously found to vary widely over a large range of habitats and species [
45]. Our lichen functional groups and tree foliage (needles) fell into three distinct groups with respect to δ
l3C values: the tripartite (and only cephalodic) cyanolichen
L. pulmonaria with the lowest δ
l3C values (−36 to −31), host tree foliage with intermediate δ
l3C values (−33 to −26), and all other lichens including bipartite cyanolichens, hair lichens and chlorolichens with the least negative δ
l3C values (−28 to −23). Our values are entirely consistent with those of Maguas
et al. [
46], namely that tripartite lichen associations typically have the lowest and bipartite lichens the highest δ
l3C. Carbon isotope discrimination in lichens [
42] has been attributed to the species of photobiont present. Carbon concentrations also clearly distinguished between conifer foliage (mean %C of ~50.5%) and all lichen functional groups (means of %C ranging from ~42%–45%). This range of values are in close agreement with %C values observed previously for epiphytic lichens in sub-boreal BC [
8] and conifer foliage [
47], respectively.
Interestingly, we observed positive relationships between tree branch height and δ
l3C values for both
L. pulmonaria and foliage. Possible causes that may be responsible for the observed height-specific differences in these δ
l3C values are CO
2 source, light level and factors influencing diffusion resistance such as water availability. Carbon dioxide source influences the δ
l3C value of lichens [
48,
49], and lichens growing in the canopy close to the forest floor (
i.e.,
L. pulmonaria) would more readily assimilate CO
2 enriched by soil respiration [
46,
50,
51]. Light levels also influence photosynthesis and can alter the CO
2 gradient inside the lichen thallus. Inorganic carbon acquisition by lichen photobionts fluctuate greatly with moisture and light availability [
52], and lichen hydration is known to affect δ
l3C values. Increased δ
l3C values have been reported for lichens in drier habitats [
45] and on thinner branches, both being directly and indirectly associated with desiccation stress, respectively [
53]. Water stress would be expected to increase with branch height. Therefore, differences in δ
l3C likely exist due to biological traits (e.g., foliage (stomatal)
versus lichen, cephalodic
versus non-cephalodic lichen), different microclimatic conditions in the canopy and/or the uptake of isotopically different CO
2 sources. Irrespective of mechanism and ecological significance, the δ
l3C—in concert with the δ
15N—are clearly useful in chemically distinguishing among epiphyte functional group and host tree foliage.


