Article

Biomass Accumulation and Net Primary Production during the Early Stage of Secondary Succession after a Severe Forest Disturbance in Northern Japan

1
Research Faculty of Agriculture, Hokkaido University, Kita 9 Nishi 9, Kita-ku, Sapporo 060-8589, Japan
2
Institute of Fruit Tree and Tea Science, National Agriculture and Food Research Organization (NARO), 2769 Shishidoi, Kanaya, Shimada, Shizuoka 428-8501, Japan
*
Author to whom correspondence should be addressed.
Forests 2016, 7(11), 287; https://doi.org/10.3390/f7110287
Submission received: 6 September 2016 / Revised: 9 November 2016 / Accepted: 12 November 2016 / Published: 18 November 2016
(This article belongs to the Collection Forests Carbon Fluxes and Sequestration)

Abstract

:
Quantitative evaluations of biomass accumulation after disturbances in forests are crucially important for elucidating and predicting forest carbon dynamics in order to understand the carbon sink/source activities. During early secondary succession, understory vegetation often affects sapling growth. However, reports on biomass recovery in naturally-regenerating sites are limited in Japan. Therefore, we traced annual or biennial changes in plant species, biomass, and net primary production (NPP) in a naturally regenerating site in Japan after windthrow and salvage-logging plantation for nine years. The catastrophic disturbance depleted the aboveground biomass (AGB) from 90.6 to 2.7 Mg·ha−1, changing understory dominant species from Dryopteris spp. to Rubus idaeus. The mean understory AGB recovered to 4.7 Mg·ha−1 in seven years with the dominant species changing to invasive Solidago gigantea. Subsequently, patches of deciduous trees (mainly Betula spp.) recovered whereas the understory AGB decreased. Mean understory NPP increased to 272 g·C·m−2·year−1 within seven years after the disturbance, but decreased thereafter to 189 g·C·m−2·year−1. Total NPP stagnated despite increasing overstory NPP. The biomass accumulation is similar to that of naturally regenerating sites without increase of trees in boreal and temperate regions. Dense ground vegetation and low water and nutrient availability of the soil in the study site restrict the recovery of canopy-forming trees and eventually influence the biomass accumulation.

1. Introduction

Forest ecosystems have an important role as carbon sinks. The amount of CO2 uptake by forest ecosystems is known to be affected strongly by disturbances such as logging, fire, herbivory, and windthrow. Such disturbances most likely shift forests from a sink to a source of CO2 because the uptake of CO2 from the decreased gross primary production (GPP) is less than the corresponding losses of CO2 from plant respiration and the decomposition of detritus [1,2,3]. After disturbances, the net CO2 emissions decrease gradually as vegetation recovery progresses. Over time, these disturbed forests become a carbon sink because the increased GPP more than compensates for the corresponding losses of CO2 [1,3,4].
Of all the carbon balance components, the amount of plant biomass plays an important role in the ecosystem carbon cycle because it contributes greatly to the carbon stock [5,6] and because it affects ecosystem productivity [7]. Carbon sequestration not only occurs in plant biomass, but also in soil organic matter derived from this biomass through litter supply. Therefore, although plant biomass accumulation is part of the carbon dynamics in forest ecosystems because of the large contribution of soil carbon to forest carbon dynamics, elucidation of biomass accumulation and NPP change during early secondary succession is crucially important for the evaluation of carbon sink/source activities, and the prediction of carbon dynamics of the future [8].
Growing concerns exist about how forest carbon dynamics may be influenced by the acceleration of large-scale disturbances of forest ecosystems by global warming and human activities such as forest fires [9,10], as well as strong tropical storms [9,11,12], insect herbivory, and pathogen damage [13]. Elevated atmospheric concentrations of CO2 and the resultant climate warming can accelerate the recovery of ecosystem carbon uptake [14]. In addition, vegetation change caused by human-mediated invasive species can affect the ecosystem carbon pool size and carbon balance [15,16]. Strong interactions also occur between natural and anthropogenic environmental changes.
Quantitative evaluation of biomass change associated with the disturbance-recovery regime of forest ecosystems is crucially important to understanding and predicting ecosystem carbon dynamics on both local and global scales [6,17]. When a stand-replacing disturbance occurs, the environmental conditions of the forest floor change. Subsequently, ground vegetation (herb and shrub layers) contributes substantially to total biomass accumulation [18] before canopy closure. Furthermore, saplings of arboreal species face competition with the ground-covering species. Actually, understory vegetation often suppresses sapling growth through dense shading [19], competition for water and nutrients [20,21], and allelopathy [20,22], and influences the speed of forest recovery and biomass accumulation. In Japan, it is often reported that the undergrowth of Sasa (dwarf bamboo) expands after severe forest disturbances [3]. Previous reports showed that the dense shade of Sasa inhibits the growth of saplings [19,23], while, in sites without Sasa, sapling growth would not be as inhibited by shade and forest (biomass) recovery would be expected to be fast, if not inhibited by other factors. In Japan, there are no reports on the monitoring of biomass recovery in sites without Sasa. In fact, few studies have examined how biomass changes during the early stage of secondary succession for more than five consecutive years [24].
Long-term changes in biomass accumulation and carbon balance components after severe forest disturbance have been evaluated in temperate and boreal regions using a chronosequence approach, comparing biomass or carbon balances among sites with a different disturbance history [1,4,25,26,27,28,29]. This approach is effective for clarifying long-term changes of carbon dynamics. In contrast, repeated measurements of aboveground biomass are effective for clarifying short-term changes of carbon dynamics during the initial stage of secondary succession immediately after a severe forest disturbance, when the vegetation and microclimate are drastically different.
In Hokkaido, Japan’s northernmost main island, a severe forest disturbance occurred because of strong winds from Typhoon Songda in September 2004, where a 37,000 ha forest was damaged severely [30]. The Tomakomai Flux Research Site was also damaged severely with more than 90% of the site’s trees blown down. After the disturbance, the trunks of fallen tall trees were removed for commercial use. Since then, the site has been naturally regenerating.
To evaluate the biomass carbon accumulation dynamics of a naturally regenerating forest, the changes of species composition, biomass accumulation, and net primary production (NPP) were monitored annually or biennially for nine years after the disturbance. Observed changes in vegetation included alien species invasion, and the establishment of a patchy deciduous forest during the study period. As described herein, details of the processes of the early secondary succession of a cool-temperate forest are shown. Moreover, the effects of site conditions, undergrowth, and deciduous forest recovery on biomass accumulation and NPP are discussed.

2. Materials and Methods

2.1. Site Description

This study was conducted in an area of 1.4 ha within the former Tomakomai Flux Research Site (42°44′ N, 141°31′ E, 125 m a.s.l.) that was established in a plantation of Japanese larch (Larix kaempferi (Lamb.) Carriere) in southern Hokkaido [2,31,32]. The plantation had some deciduous broadleaf tree species such as birches (Betula platyphylla Sukaczev var. japonica (Miq.) H.Hara, and Betula ermanii Cham.), Japanese elm (Ulmus davidiana Planch var. japonica (Rehder) Nakai), and a few spruce trees (Picea jezoensis (Siebold et Zucc.) Carrière). Ferns (Dryopteris crassirhizoma Nakai, and Dryopteris expansa (C.Presl) Fraser-Jenk. et Jermy) and a dwarf shrub species of Pachysandra terminalis Siebold et Zucc. were dominant in the understory [32]. The site has regenerated naturally after the catastrophic windthrow disturbance in September 2004 [2,33]. Most standing trees at the site fell down. The trunks of fallen trees were removed by the summer of 2005. The soil surface was disturbed through logging work using heavy machinery. Many uprooted stumps, as well as coarse woody debris of branches and leaves, were left throughout the site.
Soil was classified as a pumiceous volcanogenous regosol with high water permeability and poor nutrients [31,34], with 1–2 cm of a fresh litter layer and 5–10 cm of a decomposed organic layer (A horizon). The A horizon and C horizon were stratified in order [34]; the B horizon was lacking. According to the record of Tomakomai Meteorological station (located 13 km south of the study site) for 1981–2010 [35], the annual mean air temperature was +7.6 °C, with monthly mean air temperatures of −3.8 °C (January) through +20.3 °C (August). Annual precipitation was 1198 mm with more than 70% of the precipitation occurring during the growing season (May–October).

2.2. Measurements

The species composition and biomass accumulation were monitored during the growing seasons of 2006–2014. We used species names following the nomenclature of the YList [36]. We used the data of the biomass and properties of the larch stand before disturbance, which were presented by [2,37,38,39].

2.2.1. Species and Biomass

Hereinafter, we refer to ground vegetation of herbs, grasses, ferns, shrubs, and saplings shorter than 0.5 m as the “understory” or “understory vegetation” irrespective of the presence or absence of canopy-forming trees. Moreover, we designate trees taller than 0.5 m as the “overstory” as a sense of overlying understory vegetation.
Aboveground biomass (AGB) of understory species was measured gravimetrically. In each year, a survey strip with 1 m × 100 m was installed in the study site to avoid harvesting a plot sampled in the past. Ten rectangular plots (1 m × 10 m) were located in the survey strip. Each plot was divided into 10 square subplots (1 m × 1 m), and aboveground parts of all understory vegetation were harvested in the peak growth season (from August through early September) of 2006, 2007, 2009, 2011, 2012, 2013, and 2014. Except for 2012 and 2013, harvesting was implemented monthly or bimonthly during the snow-free season (May–December). The harvest plot during each sampling time within a year was at the neighboring subplot. The harvest was divided by species and subdivided into leaf, stem/branch, and flower/fruit parts, which were weighed after oven drying at 80 °C for more than 48 h.
Belowground biomass (BGB) of understory species was calculated by multiplying the root/shoot ratio (RS ratio) to AGB. In late August of 2014, to determine the RS ratio, we collected all aboveground and belowground parts (including coarse and fine roots) of the plants from fifteen 0.3 m × 0.3 m quadrats (ten from Solidago gigantea Aiton subsp. serotina (Kuntze) McNeill community, and five from the Rubus idaeus L. subsp. melanolasius Focke community); the RS ratio was calculated from their oven-dried weights.
Some deciduous trees grew to a height of 1–2 m in 2010. Therefore, the overstory tree biomass was measured separately from 2010. The species, height (H), and stem diameters at the ground surface (DS0) and the breast height of 1.3 m (DBH) of overstory trees were recorded annually in three 20 m × 20 m permanent plots. Overstory tree biomass was separated into leaf, stem/branch, and coarse root parts. To form allometric equations for their parts, trees of 0.5, 1.0, 1.5, 2.0, 2.5, 3.0, 5.5, and 7.3 m height (14 trees) were uprooted and separated into each part. Then, dry weights of stem/branch, leaf, and coarse root parts (BSB, BL, and BCR, respectively) were determined (Table S1). The allometric equations were as follows.
ln ( BSB ) = 0.985 ln ( DS 0 2 × H ) + 11.7
ln ( BL ) = 0.708 ln ( DS 0 2 × H ) + 8.74
ln ( BCR ) = 0.816 ln ( DS 0 2 × H ) + 9.83
To correct the bias in log-transformed allometric equations [40], the biomass of each part was multiplied by the correction factor (CF). The CF was 1.04 for BSB, 1.10 for BL, and 1.14 for BCR. AGB was calculated as the sum of BSB, BL, and BCR.
The mortality of overstory trees was evaluated based on population and AGB from the ratio of the numbers of dead trees to all living trees, and the ratio of dead AGB to all living AGB, respectively.

2.2.2. Leaf Area Index

Leaf area indices (LAI, m2·m−2) of understory and overstory species were determined from total leaf area in units of ground area. Leaf area was estimated by multiplying the leaf dry weight (Table S2) by specific leaf area (SLA; ratio of leaf area to leaf dry weight in cm2·g−1) of each species. To estimate the understory LAI, the SLA of each understory species [2] was used (Table S3), and was totaled for each plot to determine LAI. To estimate the overstory LAI, the SLA of Betula platyphylla (the most abundant overstory species in the study site) was obtained as explained below: we sampled 100 leaves of Betula platyphylla in August 2014, measured their dry weight, and determined the leaf area using a scanner and leaf-area measuring software (Lia for Win32, ver. 0.376β1, Nagoya, Japan) [41]. Then SLA was calculated from the ratio of leaf area to leaf dry weight (Table S3).

2.2.3. Net Primary Production

Annual net primary production (NPP) was evaluated from biomass in the peak growth period (August through early September, as shown in the result). This study site, which is at the early secondary succession stage, has both herbaceous (non-woody plants including forb, grass, sedge, and rush) and woody plants. Therefore, the NPP was evaluated separately. For example, NPP of the herbaceous plants is estimated from the annual maximum biomass unless plants die more than one time per year [42]. In contrast, the NPP of the woody plants was estimated from the sum of the annual difference in all biomass and the total amount of loss, such as dead leaves, branches, and roots [43].
Because most understory plants are perennial species, we assumed that the belowground coarse roots survive overwinter. Assuming that the carbon losses attributable to herbivory, volatiles, and exudation are negligibly small, the NPP of woody species is expressed as shown below.
understory   woody   species   NPP = c ( Δ AGB + Δ BGB + BL i + TRFR × BFR i )
overstory   woody   species   NPP = c ( Δ AGB + Δ BGB + BL i + TRFR × BFR i + MT i )
In the above equations, constant c stands for the carbon content of the biomass (0.5), ΔAGB and ΔBGB respectively denote annual increments of AGB and BGB, BL and BFR respectively represent the biomass of leaves and fine roots, and TRFR is a fine root turnover rate. MT is the mortality of overstory trees. Suffix i represents the value in the previous year. If ∆AGB or ∆BGB are negative, they are set to zero. This equals to adding mortality.
For herbaceous species, annual NPP is the sum of AGB in the peak growth period (AGB), the increment of BGB (ΔBGB), and fine root production (TRFR × BFR) (Equation (6)).
herbaceous   species   NPP = c ( AGB j + Δ BGB + TRFR × BFR j )
Therein, suffix j denotes the current year. In 2008 and 2010, understory AGB was missing observations; for these years the AGB was estimated from the yearly interpolation. Understory and overstory BLi were respectively estimated from the harvested and allometric-estimated litter biomass. In this study site, all overstory species are deciduous. There is only one evergreen woody species in the undergrowth (Pachysandra terminalis). We calculated the NPP assuming that the life of the leaves is one year. Similar to the calculation of woody species NPP, ∆BGB are set to zero if it is negative.
Understory and overstory TRFR were set at 0.25 (temperate shrubs) and 0.65 (temperate trees), respectively, which are the mean values of the fine-root turnover rates of each ecosystem in a meta-analysis (Table S4) [44]. Fine root biomass (BFR) of understory vegetation was estimated from BGB by multiplying the ratio of BFR and BGB (BFR/BGB). The ratio (BFR/BGB) of understory vegetation was obtained from root sampling in August 2014 (0.332, Table S4). The overstory BFR/BGB was set at 0.231 from data measured in an adjacent deciduous forest (Table S4).

2.3. Statistical Analyses

We estimated the yearly change in mean and standard error (SE) of AGB and LAI. The total AGB and LAI values were obtained from 10 destructive harvest plots and 3 permanent survey plots. The SE was obtained from the law of error propagation as follows,
( M 1 ± SE 1 ) +   ( M 2 ± SE 2 ) =   ( M 1 + M 2 ) ± SE 1 2 + SE 2 2
where M1 and M2 are means, and SE1 and SE2 are SEs.
To determine whether there are any statistically significant differences among mean understory AGB or LAI of each year, one-way ANOVA was used. For estimating the RS ratio as a function of AGB, a simple linear regression analysis was tested between the RS ratio and understory ABG. All statistical analyses were conducted using a statistical software package (R, ver. 3.0.2; The R Foundation for Statistical Computing, Vienna, Austria).

3. Results

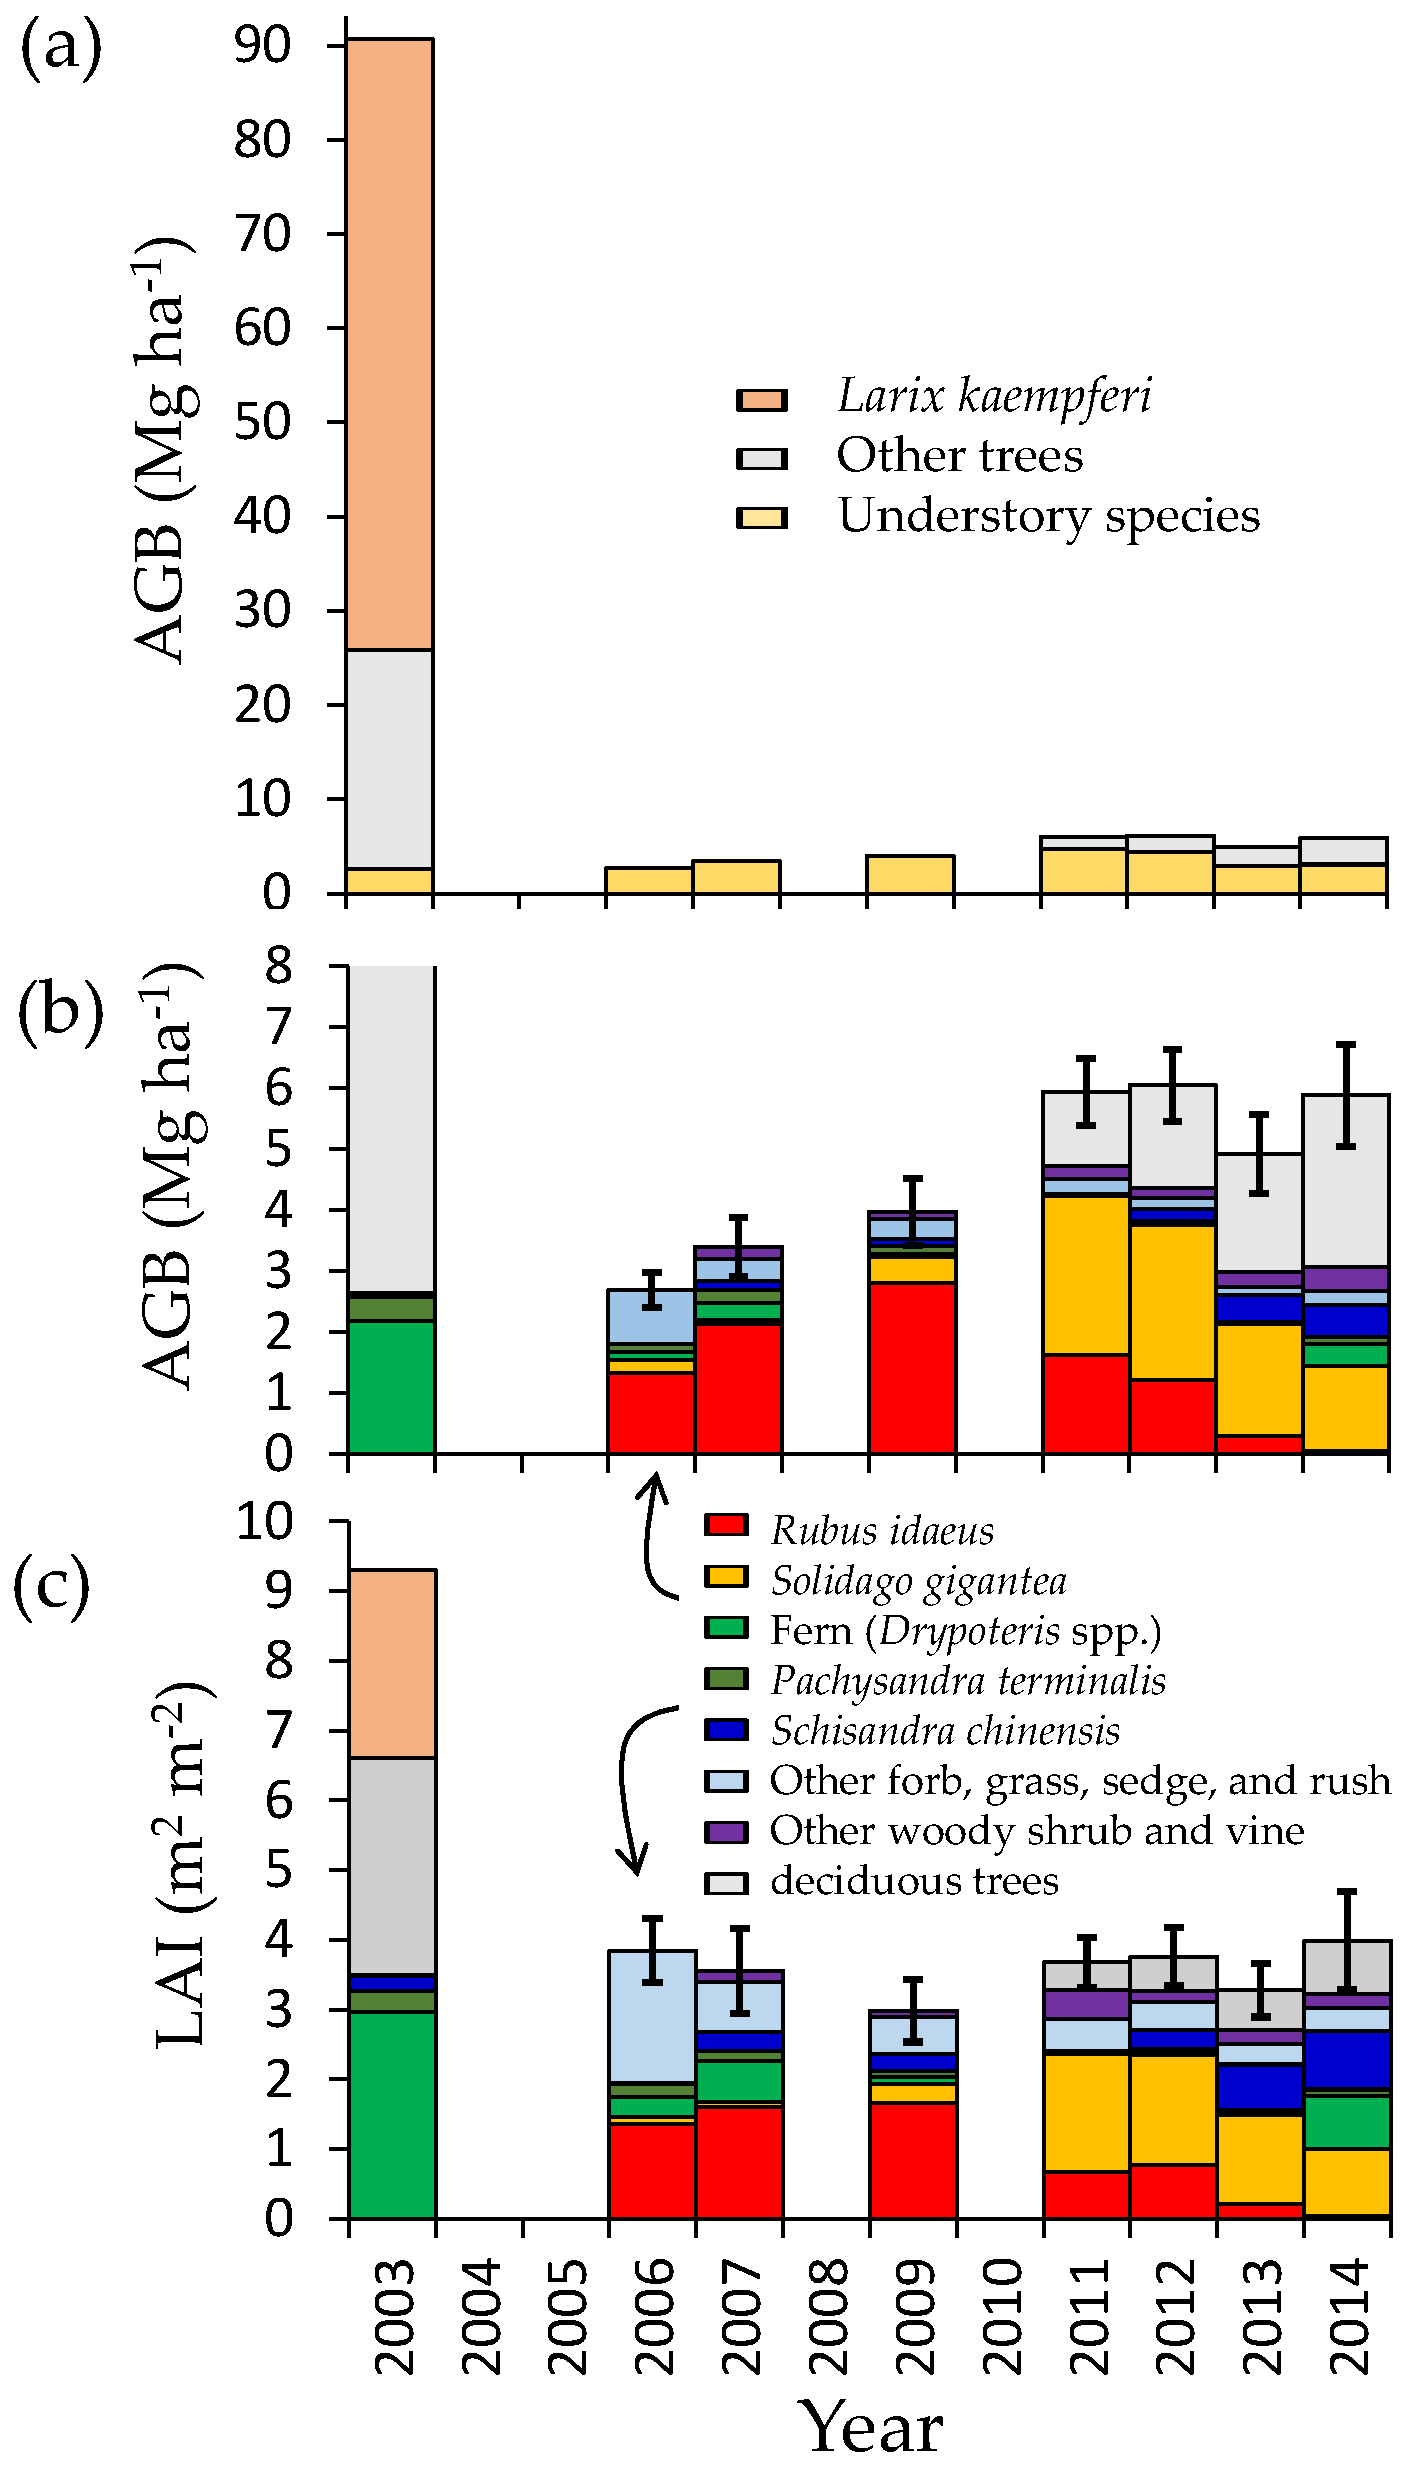
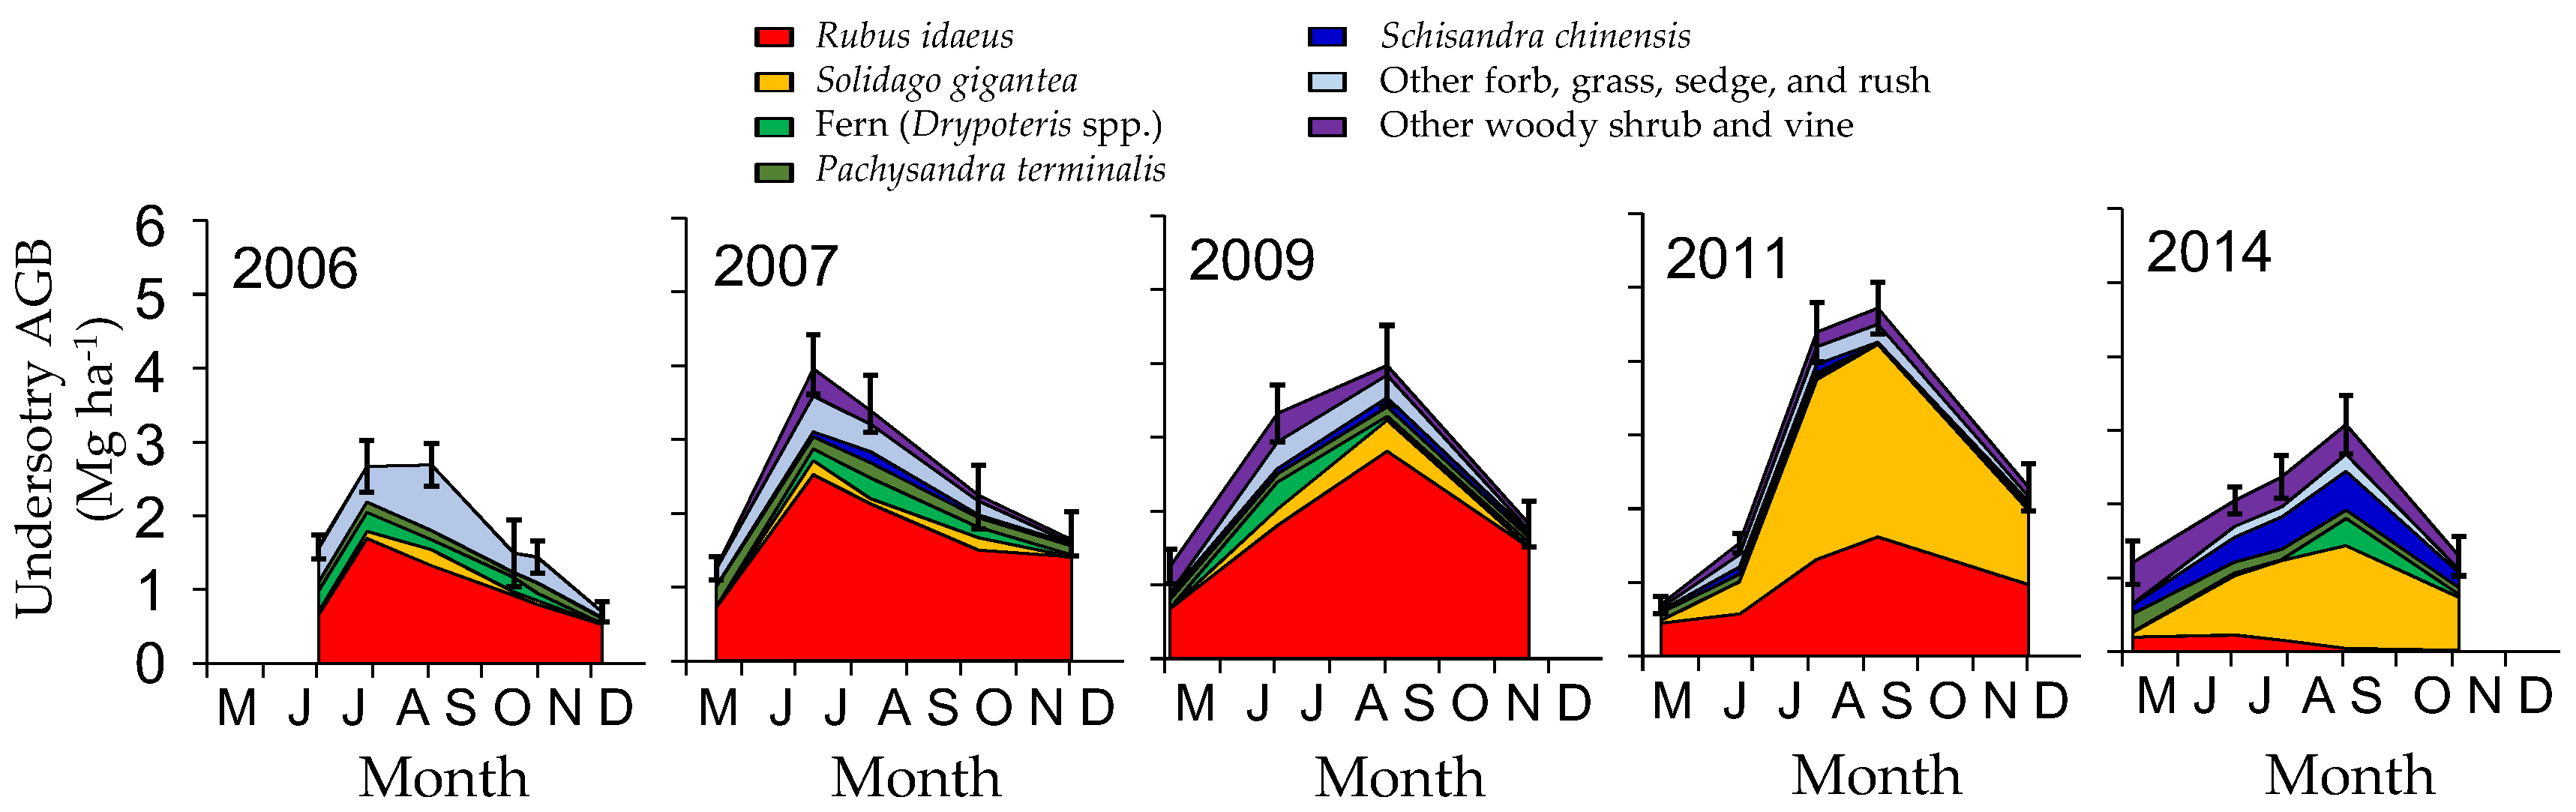
3.1. Change in Aboveground Biomass and Species Composition

Aboveground biomass (AGB) decreased drastically from 90.6 Mg·ha−1 in 2003 to 2.69 ± 0.29 Mg·ha−1 (mean ± 1 standard error (SE)) in 2006 by windthrow and subsequent salvage logging in 2004–2005 (Figure 1a). Japanese larch (Larix kaempferi), broadleaved deciduous trees, and evergreen conifer trees (Picea jezoensis) disappeared. In contrast, understory AGB did not change between before (2.6 Mg·ha−1 in 2003) and two years after (2.69 Mg·ha−1 in 2006) the disturbance (Figure 1b). After 2006, AGB composed of understory vegetation significantly changed yearly (p < 0.05, one-way ANOVA), and increased gradually until 2011 up to 4.72 ± 0.35 Mg·ha−1. Thereafter, deciduous trees grew taller than 0.5 m, increasing tree AGB from 1.22 ± 0.42 Mg·ha−1 in 2011 to 2.81 ± 0.74 Mg·ha−1 in 2014 (Figure 1). However, understory AGB decreased to 3.08 ± 0.40 Mg·ha−1 in 2014, offsetting the biomass increase so that the total biomass remained at 5–6 Mg·ha−1.
Disturbance and the following succession drastically altered the understory species composition (Figure 1b). Before disturbance, two fern species of Dryopteris crassirhizoma and Dryopteris expansa dominated, accounting for more than 80% of total AGB [38]. After canopy loss, Rubus idaeus took the place of the fern species, accounting for more than 60% in AGB until 2009. Thereafter, an invasive species, Solidago gigantea dominated instead of Rubus idaeus. After 2012, following the population increase of overstory species, the AGB of both Rubus idaeus and Solidago gigantea decreased considerably. In 2014, as a result, the AGB of Solidago gigantea became half of its peak, and Rubus idaeus almost disappeared. Dryopteris spp. and Schisandra chinensis (Turcz.) Baill., a deciduous woody vine species, increased corresponding with the increase in overstory biomass. The seasonality of understory AGB changed with elapsed time after the disturbance (Figure 2). Peak biomass was observed in July or August when Rubus idaeus dominated (2006–2007), but was observed in early September when Solidago gigantea dominated (after 2011) (Table S5).

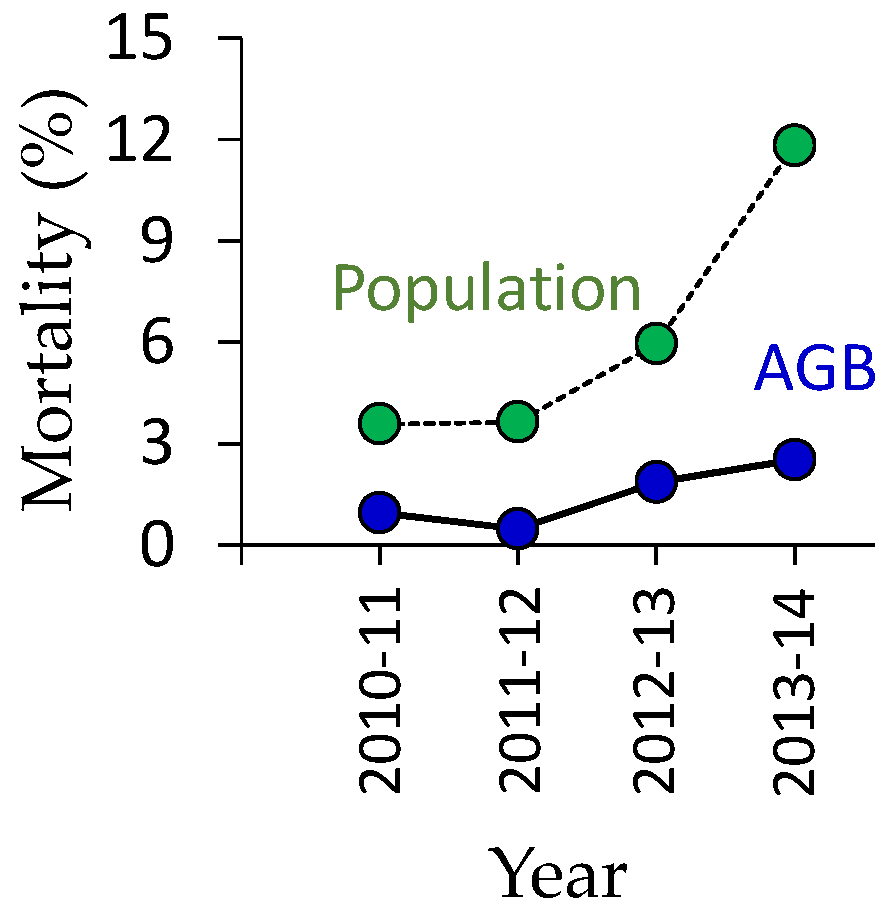
3.2. Regeneration of Deciduous Trees

In the study site, the canopy-forming trees were not established soon after the forest disturbance; they started to increase six years after the disturbance. After 2010, the population and biomass of deciduous trees (overstory species) increased remarkably (Table 1, Figure 1b, and Table S6). The contribution of overstory trees to total AGB sharply increased from 21% (2011) to 48% (2014) because of the increase in deciduous trees and the decrease in understory species. In 2014, the pioneer species of Betula platyphylla was the most abundant (1775 trees ha−1), followed by Betula ermanii (483 trees ha−1) (Table A1). These two Betula species accounted for 51% of the population and 78% of the biomass of overstory deciduous trees followed by Magnolia kobus DC. var. borealis Sarg. and Maackia amurensis Rupr. et Maxim. Saplings of Larix kaempferi, Ulmus davidiana, and Quercus crispula Blume, which were abundant species before the disturbance, were also found (Table A1). The yearly mortality of deciduous trees increased during 2011–2014, from 4% to 12% based on population and from 1% to 3% based on AGB (Figure 3, Table S6). The population-based mortality was higher than that based on AGB, indicating that small trees easily die.

3.3. Leaf Area Index

The disturbance remarkably decreased LAI because of the loss of overstory (Figure 1c). The total LAI before the disturbance was 9.3 m2·m−2, of which 2.7 m2·m−2 was for Larix kaempferi, 3.1 m2·m−2 was for other overstory trees including broadleaved deciduous trees and evergreen conifers (Picea jezoensis), and 3.5 m2·m−2 was for understory vegetation. Although the disturbance eliminated overstory LAI, understory LAI (mean ± 1 standard error (SE)) did not change much (3.85 ± 0.46 m2·m−2 in 2006). Subsequently, the understory LAI was almost stable: 2.71 ± 0.35 m2·m−2–3.55 ± 0.61 m2·m−2. Overstory LAI increased from 0.40 ± 0.14 m2·m−2 in 2010 to 0.76 ± 0.20 m2·m−2 in 2014, which remained small even 10 years after the disturbance.

3.4. Belowground Biomass

A significant (p < 0.01) linear relationship was found between the RS ratio and AGB of Rubus idaeus (n = 5) and Solidago gigantea (n = 10) communities (Figure 4). The regression line is expressed as:
RS   ratio   = 0.0935 × AGB + 1.37   ( R 2 = 0.728 )
Total BGB was 3.01–4.83 Mg·ha−1 for 2006–2014 (Table 2). Understory BGB increased until 2011. It then decreased as the overstory BGB increased. The contribution of understory BGB to total biomass accumulation (AGB + BGB) decreased according to forest recovery (Table 2). The proportion of fine root biomass to total BGB (BFR/BGB) of understory Rubus idaeus and Solidago gigantea communities (mean ± 1 standard error (SE)) was 0.332 ± 0.023 in August 2014 (Table S4).

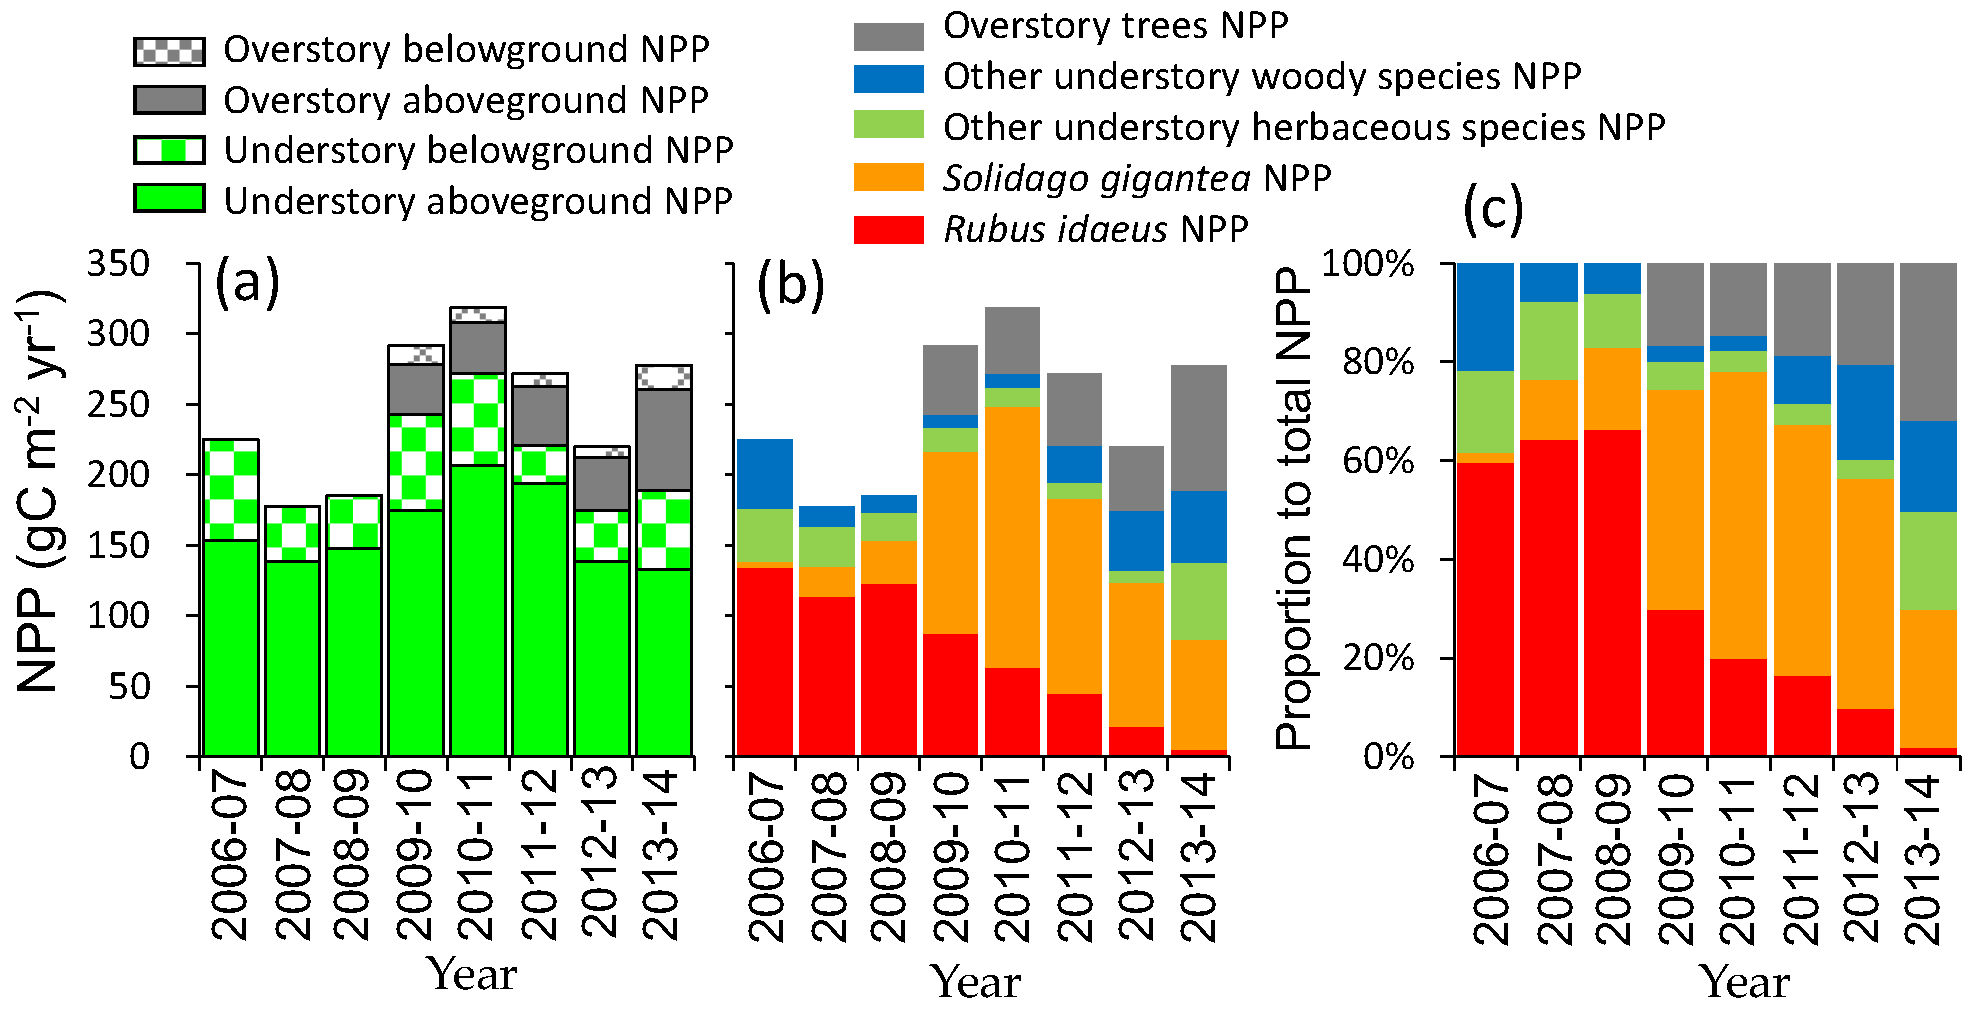
3.5. Net Primary Production

Annual net primary production (NPP) of understory species fluctuated around 200 g·C·m−2·year−1 until 2009; it then increased to 272 g·C·m−2·year−1 in 2010–2011 (Figure 5a). Although Rubus idaeus NPP was greatest by 2009, the NPP sharply decreased, and Solidago gigantea NPP increased (Figure 5b). Through the regeneration of deciduous trees, understory NPP (mainly Solidago gigantea) decreased to 189 g·C·m−2·year−1 in 2013–2014. In spite of the increase of overstory NPP from 48 g·C·m−2·year−1 in 2009–2010 to 90 g·C·m−2·year−1 in 2013–2014, total NPP did not increase after 2011 because of the sharp decrease of understory NPP. The contribution of the overstory to total NPP increased from 17% (2010–2011) to 32% (2013–2014) (Figure 5c). Total belowground NPP accounted for 14%–32% of the total NPP during the study period.

4. Discussion

4.1. Understory Species after Disturbance

A drastic change of species composition was observed at the study site. Rubus idaeus, a biennial caned Rosaceae species with ca. 1 m in height and the dominant species immediately after the disturbance, is known to become dominant after the disappearance of overstory species in boreal or cool-temperate forests in Europe and North America [50]. In northern Japan, this species similarly dominated after disturbance without undergrowth of Sasa spp. (dwarf bamboo) [51], which is a competing species against Rubus idaeus [51]. The expansion and dominance of Rubus idaeus are expected to be common features in severely disturbed boreal and cool-temperate forests. The Rubus biomass increases according to an increase in light intensity [52] and soil disturbance [53]. Sasa spp. also increases distribution according to an increase in light intensity by gap formation or forest disturbance [3,51,54], but the relation between Sasa distribution and site conditions, such as soil moisture or fertility, is unclear.
Later dominant species, Solidago gigantea, is an Asteraceae species with ca. 1 m in height. This species is native to North America and represents a common invasive species in central to northern Europe and eastern Asia, including Japan [55]. In Hokkaido Island, this species was introduced as an ornamental before the 1950s [56]. This species is light-demanding, grows in wide ranges of soil moisture and nutrient conditions, and is often found in open sites such as wetlands [55], the forest margin, and gaps including those at disturbed sites [57], abandoned farmland and grassland [58], and ski slopes [59]. At the study site, Solidago gigantea also formed dense and monospecific communities, accounting for about 70% of the understory biomass (Figure 1b), as reported by [55]. In previous studies, Rubus idaeus had been reported to dominate until trees began to form a canopy in Hokkaido (for 10–15 years) [51], and North America (for 10 years) [60]. At the site studied here, however, Rubus idaeus had dominated for only four years after the disturbance before being replaced by Solidago gigantea (Figure 1b). The expansion of Solidago gigantea during secondary forest succession has not been reported and might be a new phenomenon related to human activities, but the reasons are unclear and require further research
The earlier peak biomass of Rubus idaeus (Figure 2) is partly attributable to the phenology of this species. The aboveground part is biennial. The primocane (first-year stem) grows from spring through autumn, but the floricane (second-year stem) develops leaves in the spring and produces fruits and dies in the summer [61]. The early defoliation of floricane causes the peak biomass to be observed during the early summer [2]. In contrast, Solidago gigantea continued to grow until it bloomed [55] in August at the study site. The nutrient condition in the soil can also affect the timing of peak biomass. N deficiency accelerates senescence of leaves [62]. On the other hand, later peak biomass in 2009 during Rubus idaeus dominance is likely caused by the improvement of soil nutrient conditions, which as a result did not accelerate senescence.

4.2. Secondary Forest Recovery and Biomass Accumulation

Understory vegetation is influenced by the development of overstory trees through light and belowground competitions for water and nutrient resources [18]. The understory biomass temporarily increases with the canopy losses, but it reaches a peak [24] or decreases [18,25,28] with overstory recovery. In turn, overstory tree recovery is influenced by dense undergrowth through shading [19] and belowground competition [20,21], especially during the sapling stage. At this site, understory biomass increased for six years after the disturbance, but decreased from the eighth year after the disturbance with the recovery of overstory trees (Figure 1a).
Because of the large contribution of overstory biomass to total biomass [18], except for the initial stage of succession, the biomass accumulation rates in the whole forest ecosystems are greatly influenced by the recovery rate of overstory trees. Total AGBs in temperate or boreal forests without the recovery of canopy-forming trees within 12 years after disturbance were 2.3–5.9 Mg·ha−1 (Table 3; [20,45,46]). In contrast, biomass accumulations four to six years after clearcutting of hardwood forest ecosystems with rapid establishment of pioneer trees were 7.9–32.6 Mg·ha−1 of AGB [47] or up to 34.6 Mg·ha−1 of total biomass [24] (Table 3). At this site, where canopy-forming trees started to emerge six years after disturbance, AGB of 2.7–5.8 Mg·ha−1 and total biomass of 6.0–11.2 Mg·ha−1 was observed 2–10 years after the disturbance (Figure 1a), which was similar to the case without the establishment of canopy-forming trees (Table 1). The slow stand establishment is probably the result of dense cover by Rubus idaeus and Solidago gigantea, which compete with the saplings of canopy-forming trees.
The biomass accumulation rates of overstory trees are influenced by abiotic factors of temperature and belowground water and nutrient resource availability [42], as well as biotic factors of above-described competition. In this study site, the root zone thickness (A horizon) was only about 0.10 m. Below the layer, there was a root-impermeable layer of pumiceous volcanogenous regosols [31,34]. The soil is characterized by rapid drainage and low nutrient retention which is common with sandy soils. Forests on sandy soils, which have low water and nutrient holding capacity, tend to have low biomass accumulation rates [42]. The AGB in the study site 10 years after disturbance is similar to another Japanese site, but the BGB is about half that of the other Japanese site (Table 3). At the study site, the low water and nutrient availability is also responsible for the slow overstory recovery and overall biomass accumulation, but additional research is needed to confirm this effect.
Increasing mortality after 2013 (Figure 3) was probably caused by inter-specific and intra-specific competition (self-thinning), which can also result in slow biomass recovery of overstory trees. Wang et al. [29] reported that tree biomass decreased temporarily 15 years after disturbance in paper birch (Betula papyrifera) stands because of self-thinning in British Columbia.

4.3. Change in Productivity during Secondary Succession

For this study, we used root turnover ratios derived from previous literature for estimating belowground NPP. We analyzed the effects of the ratios on total NPP by adjusting the ratio by ±0.2. For understory herbs, grasses, and ferns, change in the turnover ratio altered NPP within ±8%. For trees, in contrast, the same change in the turnover ratio altered NPP only by <2%. These facts indicate that the calculated NPP is not highly sensitive to turnover ratios.
The NPP at this site during 10 years after disturbance (177–318 g·C·m−2·year−1: Figure 5) was much smaller than that (781 g·C·m−2·year−1) before the disturbance, which was estimated as the sum of net ecosystem production (NEP) using the eddy covariance technique [32] and soil heterotrophic respiration by the closed chamber method [63]. This indicates that the productivity of the ecosystem has not sufficiently recovered from the disturbance. The NPP in this site was similar to the NPP (72–447 g·C·m−2·year−1) of a regenerating boreal black spruce forest 3–12 years after disturbance [26], but smaller than the NPP (655–829 g·C·m−2·year−1, assuming that C content of a plant is 0.5) of a naturally regenerating temperate forest where the canopy-forming trees recovered within four to six years [47]). To examine the process of carbon accumulation after disturbance, many studies have used a chronosequence approach [25,27,28,29]. All these results showed a monotonical increase in NPP or biomass during the early stages of succession. In contrast, total NPP in this site started to decrease eight years after disturbance. This NPP decrease during the early secondary succession, which has never been reported, resulted from the sharp decrease of understory biomass and, as explained above, might be associated with the forest structure change of canopy formation. Therefore, continuous monitoring is needed to effectively detect the drastically changing productivity and biomass during the early stages of secondary succession.

4.4. Possible Effects of Invasive Species on Succession and Carbon Accumulation

No reports in the relevant literature have described the domination of invasive Solidago gigantea during secondary forest succession. Such invasive species can accelerate the biomass carbon accumulation in some ecosystems [15,16]. If a similar situation occurred, the invasion of Solidago gigantea enhances carbon accumulation during the early stages of forest recovery.
In contrast, invasion and expansion of Solidago gigantea can result in adverse effects on the carbon accumulation in the forest. A stand of Solidago spp. can inhibit the germination or growth of other species, including the ability of saplings of trees to form a canopy, because of dense shade [55] and allelopathy [22,64]. Therefore, Solidago gigantea potentially restricts the growth of saplings, and consequently suppresses the overstory biomass recovery. Tall tree biomass occupies the substantial part of the total carbon accumulated in a forest ecosystem. Therefore, the growth inhibition of tall trees reflects the restriction of carbon accumulation in the long run. Further research about the relationships between the number or size of canopy-forming trees (including saplings) and undergrowth (Rubus and Solidago) biomass are required to clarify the effects of invasive species on forest biomass recovery.

5. Conclusions

Few studies have traced species and biomass accumulation at one site during early stages of secondary succession in Japan. We monitored the annual or biennial changes of species and NPP to assess the role of these factors and the understory vegetation on biomass accumulation in a cool-temperate forest of Japan. After disturbance, biomass recovery occurs slowly. The growth of trees was probably inhibited by both biotic factors, such as dense undergrowth and invasive species, and abiotic factors, such as the low soil water and nutrient availability. Thus, ground vegetation including invasive species, as well as soil properties, can affect the speed of recovering canopy-forming trees and eventually influence the carbon sequestration.

Supplementary Materials

The following are available online at www.mdpi.com/1999-4907/7/11/287/s1, Table S1: Tree height, stem diameter, and biomass for the allometric equation of deciduous trees, Table S2: Mean leaf biomass classified by species in August–September. Table S3: Specific leaf area (cm2·g−1) by species used for this study, Table S4: Parameters related fine root for NPP estimation, Table S5: Aboveground biomass (g·m−2) of understory species, Table S6: Stand density, tree height, biomass, and dead biomass in the regenerated forest.

Acknowledgments

The authors would like to thank the Hokkaido Regional Office of the Forestry Agency for allowing the use of the site, Nobuko Saigusa, Ryuichi Hirata, and the staff of National Institute for Environmental Studies of Japan for managing the study site, Kazuo Yabe at Sapporo City University for identification of plant species, students of Hokkaido University for their assistance with field surveys. Constructive comments by the anonymous reviewers improved the manuscript. This study was supported by JSPS KAKENHI 17310017 and 25241002.

Author Contributions

T.H. and T.S. conceived and designed the experiments: T.Y, T.H., and T.S. performed the experiments, T.Y. analyzed the data: T.Y., T.H., and T.S. contributed reagents/materials/analysis tools: T.Y., T.H., and T.S. wrote the paper.

Conflicts of Interest

The authors declare no conflict of interest.

Appendix A

Table A1. Species composition of trees taller than 0.5 m and 2.0 m 10 years after disturbance.
SpeciesStand DensityAboveground Biomass
Taller Than 0.5 mTaller Than 2 mTaller Than 0.5 mTaller Than 2 m
(trees ha−1)(%)(trees ha−1)(%)(Mg·ha−1)(%)(Mg·ha−1)(%)
Betula platyphylla Sukaczev var. japonica (Miq.) H.Hara 177540%113367%1.73267%1.67172%
Betula ermanii Cham.48311%1177%0.28911%0.25511%
Magnolia kobus DC. var. borealis Sarg.3588%1006%0.1757%0.1486%
Maackia amurensis Rupr. et Maxim.2756%1338%0.0904%0.0643%
Cerasus maximowiczii (Rupr.) Kom.3508%674%0.0552%0.0362%
Quercus crispula Blume672%171%0.0452%0.0331%
Hydrangea paniculata Siebold2175%171%0.0392%0.0211%
Magnolia obovata Thunb.1253%171%0.0381%0.0321%
Syringa reticulata (Blume) H.Hara501%251%0.0211%0.0161%
Tilia japonica (Miq.) Simonk.80%80%0.0211%0.0211%
Aria alnifolia (Siebold et Zucc.) Decne.752%80%0.0151%0.0131%
Larix kaempferi (Lamb.) Carriere672%80%0.0131%0.0040%
Betula maximowicziana Regel581%171%0.0130%0.0090%
Fraxinus lanuginosa Koidz. f. serrata (Nakai) Murata922%251%0.0090%0.0060%
Ligustrum tschonoskii Decne.2335%00%0.0070%0.0000%
Crataegus chlorosarca Maxim.421%00%0.0030%0.0000%
Ulmus davidiana Planch var. japonica Nakai832%00%0.0030%0.0000%
Sorbaria sorbifolia (L.) A.Braun var. stellipila Maxim.170%00%0.0010%0.0000%
Aralia elata (Miq.) Seem.80%00%0.0000%0.0000%
Total4383100%1692100%2.570100%2.328100%

References

  1. Amiro, B.; Barr, A.; Barr, J.; Black, T.; Bracho, R.; Brown, M.; Chen, J.; Clark, K.; Davis, K.; Desai, A.; et al. Ecosystem carbon dioxide fluxes after disturbance in forests of North America. J. Geophys. Res. Biogeosci. 2010, 115. [Google Scholar] [CrossRef]
  2. Sano, T.; Hirano, T.; Liang, N.; Hirata, R.; Fujinuma, Y. Carbon dioxide exchange of a larch forest after a typhoon disturbance. For. Ecol. Manag. 2010, 260, 2214–2223. [Google Scholar] [CrossRef]
  3. Takagi, K.; Fukuzawa, K.; Liang, N.; Kayama, M.; Nomura, M.; Hojyo, H.; Sugata, S.; Shibata, H.; Fukazawa, T.; Takahashi, Y.; et al. Change in CO2 balance under a series of forestry activities in a cool-temperate mixed forest with dense undergrowth. Glob. Chang. Biol. 2009, 15, 1275–1288. [Google Scholar] [CrossRef]
  4. Goulden, M.; McMillan, A.; Winston, G.; Rocha, A.; Manies, K.; Harden, J.; Bond-Lamberty, B. Patterns of NPP, GPP, respiration, and NEP during boreal forest succession. Glob. Chang. Biol. 2011, 17, 855–871. [Google Scholar] [CrossRef]
  5. Myneni, R.; Dong, J.; Tucker, C.; Kaufmann, R.; Kauppi, P.; Liski, J.; Zhou, L.; Alexeyev, V.; Hughes, M. A large carbon sink in the woody biomass of northern forests. Proc. Natl. Acad. Sci. USA 2001, 98, 14784–14789. [Google Scholar] [CrossRef] [PubMed]
  6. Pan, Y.; Birdsey, R.; Fang, J.; Houghton, R.; Kauppi, P.; Kurz, W.; Phillips, O.; Shvidenko, A.; Lewis, S.; Canadell, J.; et al. A large and persistent carbon sink in the world’s forests. Science 2011, 333, 988–993. [Google Scholar] [CrossRef] [PubMed]
  7. Whittaker, R.; Likens, G. Carbon in the biota. In Carbon and the Biosphere, Proceedings of the 24th Brookhaven Symposium in Biology, Upton, NY, USA, 16–18 May 1972; Technical Information Center, US Atomic Energy Commission: Washington, DC, USA, 1973. [Google Scholar]
  8. Ooba, M.; Hayashi, K.; Machimura, T.; Matsui, T. Assessments of regional carbon circulation from multiple aspects by a biogeochemical model: A case study of forests in Toyota, Japan. J. Agric. Meteorol. 2014, 70, 41–54. [Google Scholar] [CrossRef]
  9. Dale, V.; Joyce, L.; McNulty, S.; Neilson, R.; Ayres, M.; Flannigan, M.; Hanson, P.; Irland, L.; Lugo, A.; Peterson, C.; et al. Climate change and forest disturbances. Bioscience 2001, 51, 723–734. [Google Scholar] [CrossRef]
  10. Running, S. Is global warming causing more, larger wildfires? Science 2006, 313, 927–928. [Google Scholar] [CrossRef] [PubMed]
  11. Chambers, J.; Fisher, J.; Zeng, H.; Chapman, E.; Baker, D.; Hurtt, G. Hurricane Katrina’s carbon footprint on U.S. Gulf Coast forests. Science 2007, 318, 1107. [Google Scholar] [CrossRef] [PubMed]
  12. IPCC. Climate Change 2007: The AR4 Synthesis Report; IPCC: Geneva, Switzerland, 2007; p. 104. [Google Scholar]
  13. Ayres, M.; Lombardero, M. Assessing the consequences of global change for forest disturbance from herbivores and pathogens. Sci. Total Environ. 2000, 262, 263–286. [Google Scholar] [CrossRef]
  14. Anderson-Teixeira, K.; Miller, A.; Mohan, J.; Hudiburg, T.; Duval, B.; DeLucia, E. Altered dynamics of forest recovery under a changing climate. Glob. Chang. Biol. 2013, 19, 2001–2021. [Google Scholar] [CrossRef] [PubMed]
  15. Ehrenfeld, J.; Futuyma, D.; Shafer, H.; Simberloff, D. Ecosystem consequences of biological invasions. Annu. Rev. Ecol. Evol. Syst. 2010, 41, 59–80. [Google Scholar] [CrossRef]
  16. Liao, C.; Peng, R.; Luo, Y.; Zhou, X.; Wu, X.; Fang, C.; Chen, J.; Li, B. Altered ecosystem carbon and nitrogen cycles by plant invasion: A meta-analysis. New Phytol. 2008, 177, 706–714. [Google Scholar] [CrossRef] [PubMed]
  17. Hirata, R.; Takagi, K.; Ito, A.; Hirano, T.; Saigusa, N. The impact of climate variation and disturbances on the carbon balance of forests in Hokkaido, Japan. Biogeosciences 2014, 11, 5139–5154. [Google Scholar] [CrossRef]
  18. MacLean, D.; Wein, R. Changes in understory vegetation with increasing stand age in New Brunswick forests: Species composition, cover, biomass, and nutrients. Can. J. Bot. 1977, 55, 2818–2831. [Google Scholar] [CrossRef]
  19. Nakashizuka, T.; Numata, M. Regeneration process of climax beech forest 1: Structure of a beech forest with the undergrowth of Sasa. Jpn. J. Ecol. 1982, 32, 57–67. [Google Scholar]
  20. Messier, C.; Kimmins, J. Above- and below-ground vegetation recovery in recently clearcut and burned sites dominated by Gaultheria shallon in coastal British Columbia. For. Ecol. Manag. 1991, 46, 275–294. [Google Scholar] [CrossRef]
  21. Wilson, A.; Shure, D. Plant competition and nutrient limitation during early succession in the southern Appalachian Mountains. Am. Midl. Nat. 1993, 129, 1–9. [Google Scholar] [CrossRef]
  22. Norby, R.; Kozlowski, T. Allelopathic potential of ground cover species on Pinus resinosa seedlings. Plant Soil 1980, 57, 363–374. [Google Scholar] [CrossRef]
  23. Alaback, P. Dynamics of understory biomass in Sitka spruce western hemlock forests of Southeast Alaska. Ecology 1982, 63, 1932–1948. [Google Scholar] [CrossRef]
  24. Bond-Lamberty, B.; Wang, C.; Gower, S. Net primary production and net ecosystem production of a boreal black spruce wildfire chronosequence. Glob. Chang. Biol. 2004, 10, 473–487. [Google Scholar] [CrossRef]
  25. Elliott, K.; Boring, L.; Swank, W. Aboveground biomass and nutrient accumulation 20 years after clear-cutting a southern Appalachian watershed. Can. J. For. Res. 2002, 32, 667–683. [Google Scholar] [CrossRef]
  26. Wang, J.; Zhong, A.; Comeau, P.; Tsze, M.; Kimmins, J. Aboveground biomass and nutrient accumulation in an age sequence of aspen (Populus tremuloides) stands in the boreal white and black spruce zone, British-Columbia. For. Ecol. Manag. 1995, 78, 127–138. [Google Scholar] [CrossRef]
  27. Wang, J.; Zhong, A.; Simard, S.; Kimmins, J. Aboveground biomass and nutrient accumulation in an age sequence of paper birch (Betula papyrifera) in the interior cedar hemlock zone, British Columbia. For. Ecol. Manag. 1996, 83, 27–38. [Google Scholar] [CrossRef]
  28. Hiura, T.; Sano, J.; Konno, Y. Age structure and response to fine scale disturbances of Abies sachalinensis, Picea jezoensis, Picea glehnii, and Betula ermanii growing under the influence of a dwarf bamboo understory in northern Japan. Can. J. For. Res. 1996, 26, 289–297. [Google Scholar] [CrossRef]
  29. Mou, P.; Fahey, T.; Hughes, J. Effects of soil disturbance on vegetation recovery and nutrient accumulation following whole-tree harvest of a northern hardwood ecosystem. J. Appl. Ecol. 1993, 30, 661–675. [Google Scholar] [CrossRef]
  30. Hokkaido Forestry Research Institute. Flash report on wind damage caused by typhoon No. 18 in 2004. Kohshunai Seas. Rep. 2004, 137, 1–12. [Google Scholar]
  31. Hirano, T.; Hirata, R.; Fujinuma, Y.; Saigusa, N.; Yamamoto, S.; Harazono, Y.; Takada, M.; Inukai, K.; Inoue, G. CO2 and water vapor exchange of a larch forest in northern Japan. Tellus Ser. B. 2003, 55, 244–257. [Google Scholar] [CrossRef]
  32. Hirata, R.; Hirano, T.; Saigusa, N.; Fujinuma, Y.; Inukai, K.; Kitamori, Y.; Takahashi, Y.; Yamamoto, S. Seasonal and interannual variations in carbon dioxide exchange of a temperate larch forest. Agric. For. Meteorol. 2007, 147, 110–124. [Google Scholar] [CrossRef]
  33. Hirano, T.; Suzuki, K.; Hirata, R. Energy balance and evapotranspiration changes in a larch forest caused by severe disturbance during an early secondary succession. Agric. For. Meteorol. 2017, 232, 457–468. [Google Scholar] [CrossRef]
  34. Sakai, Y.; Takahashi, M.; Tanaka, N. Root biomass and distribution of a Picea-Abies stand and a Larix-Betula stand in pumiceous Entisols in Japan. J. For. Res. 2007, 12, 120–125. [Google Scholar] [CrossRef]
  35. Japan Meteorological Agency. Meteorological Data. 2016. Available online: http://www.data.jma.go.jp/obd/stats/etrn/index.php (accessed on 1 May 2016). (In Japanese) [Google Scholar]
  36. Yonekura, K.; Kajita, T. BG Plants YList: An Online Service of Japanese Plant Names, Including a Nomenclature Index. 2003. Available online: http://ylist.info (accessed on 5 September 2016).
  37. Takeda, T.; Oguma, H.; Sano, T.; Yone, Y.; Fujinuma, Y. Estimating the plant area density of a Japanese larch (Larix kaempferi Sarg.) plantation using a ground-based laser scanner. Agric. For. Meteorol. 2008, 148, 428–438. [Google Scholar] [CrossRef]
  38. Sano, T. Effect of Typhoon Disturbance on the Exchange and Accumulation of Carbon in a Northern Forest Ecosystem. Ph.D. Thesis, Hokkaido University, Hokkaido, Japan, 2011; p. 107. [Google Scholar]
  39. Sano, T.; Hirano, T.; Takeda, T.; Fujinuma, Y. Performance of optical indirect methods to assess the change in leaf area index of a larch plantation through thinning. J. Agric. Meteorol. 2012, 68, 35–43. [Google Scholar] [CrossRef]
  40. Sprugel, D. Correcting for bias in log-transformed allometric equations. Ecology 1983, 64, 209–210. [Google Scholar] [CrossRef]
  41. Yamamoto, K. LIA32. 2003. Available online: http://www.agr.nagoya-u.ac.jp/~shinkan/lia32/index.html (accessed on 1 May 2016). (In Japanese)
  42. Johnson, C.; Zarin, D.; Johnson, A. Post-disturbance aboveground biomass accumulation in global secondary forests. Ecology 2000, 81, 1395–1401. [Google Scholar] [CrossRef]
  43. Clark, D.; Brown, S.; Kicklighter, D.; Chambers, J.; Thomlinson, J.; Ni, J. Measuring net primary production in forests: Concepts and field methods. Ecol. Appl. 2001, 11, 356–370. [Google Scholar] [CrossRef]
  44. Gill, R.; Jackson, R. Global patterns of root turnover for terrestrial ecosystems. New Phytol. 2000, 147, 13–31. [Google Scholar] [CrossRef]
  45. Palviainen, M.; Finer, L.; Mannerkoski, H.; Piirainen, S.; Starr, M. Responses of ground vegetation species to clear-cutting in a boreal forest: Aboveground biomass and nutrient contents during the first 7 years. Ecol. Res. 2005, 20, 652–660. [Google Scholar] [CrossRef]
  46. Yashiro, Y.; Shizu, Y.; Adachi, T.; Ohtsuka, T.; Lee, N.; Iimura, Y.; Koizumi, H. The effect of dense understory dwarf bamboo (Sasa senanensis) on soil respiration before and after clearcutting of cool temperate deciduous broad-leaved forest. Ecol. Res. 2012, 27, 577–586. [Google Scholar] [CrossRef]
  47. Marks, P. The role of pin cherry (Prunus pensylvanica L.) in the maintenance of stability in northern hardwood ecosystems. Ecol. Monogr. 1974, 44, 73–88. [Google Scholar] [CrossRef]
  48. Boring, L.; Swank, W. The role of black locust (Robinia pseudo-acacia) in forest succession. J. Ecol. 1984, 72, 749–766. [Google Scholar] [CrossRef]
  49. Hendrickson, O. Biomass and nutrients in regenerating woody vegetation following whole-tree and conventional harvest in a northern mixed forest. Can. J. For. Res. 1988, 18, 1427–1436. [Google Scholar] [CrossRef]
  50. Hughes, J.; Fahey, T. Colonization dynamics of herbs and shrubs in a disturbed northern hardwood forest. J. Ecol. 1991, 79, 605–616. [Google Scholar] [CrossRef]
  51. Toyooka, H.; Ishizuka, M.; Osawa, A.; Kushima, H.; Kanazawa, Y.; Sato, A. Forest succession over a thirty-four year period following a catastrophic windstorm in the headwaters of the river Ishikari, Hokkaido. Bull. For. For. Prod. Res. Inst. 1992, 363, 59–151. [Google Scholar]
  52. Ricard, J.; Messier, C. Abundance, growth and allometry of red raspberry (Rubus idaeus L.) along a natural light gradient in a northern hardwood forest. For. Ecol. Manag. 1996, 81, 153–160. [Google Scholar] [CrossRef]
  53. Jobidon, R. Short-term effect of three mechanical site preparation methods on species diversity. Tree Plant. Notes 1990, 41, 39–42. [Google Scholar]
  54. Noguchi, M.; Yoshida, T. Factors influencing the distribution of two co-occurring dwarf bamboo species (Sasa kurilensis and S. senanensis) in a conifer-broad leaved mixed stand in northern Hokkaido. Ecol. Res. 2005, 20, 25–30. [Google Scholar] [CrossRef]
  55. Weber, E.; Jakobs, G. Biological flora of central Europe: Solidago gigantea Aiton. Flora 2005, 200, 109–118. [Google Scholar] [CrossRef]
  56. Igarashi, H. Handbook of Naturalized Plant Species in Hokkaido 2000; Hokkaido Wildlife Laboratory: Sapporo, Japan, 2001. [Google Scholar]
  57. Morimoto, J.; Morimoto, M.; Nakamura, F. Initial vegetation recovery following a blowdown of a conifer plantation in monsoonal East Asia: Impacts of legacy retention, salvaging, site preparation, and weeding. For. Ecol. Manag. 2011, 261, 1353–1361. [Google Scholar] [CrossRef]
  58. Bartha, S.; Szentes, S.; Horvath, A.; Hazi, J.; Zimmermann, Z.; Molnar, C.; Dancza, I.; Margoczi, K.; Pal, R.; Purger, D.; et al. Impact of mid-successional dominant species on the diversity and progress of succession in regenerating temperate grasslands. Appl. Veg. Sci. 2014, 17, 201–213. [Google Scholar] [CrossRef] [Green Version]
  59. Tsuyuzaki, S. Vegetation development patterns on skislopes in lowland Hokkaido, northern Japan. Biol. Cons. 2002, 108, 239–246. [Google Scholar] [CrossRef]
  60. Archambault, L.; Morissette, J.; Bernier-Cardou, M. Forest succession over a 20-year period following clearcutting in balsam fir yellow birch ecosystems of eastern Quebec, Canada. For. Ecol. Manag. 1998, 102, 61–74. [Google Scholar] [CrossRef]
  61. Whitney, G. The productivity and carbohydrate economy of a developing stand of Rubus idaeus. Can. J. Bot. 1982, 60, 2697–2703. [Google Scholar] [CrossRef]
  62. Nord, E.; Lynch, J. Plant phenology: A critical controller of soil resource acquisition. J. Exp. Bot. 2009, 60, 1927–1937. [Google Scholar] [CrossRef] [PubMed]
  63. Liang, N.; Hirano, T.; Zheng, Z.; Tang, J.; Fujinuma, Y. Soil CO2 efflux of a larch forest in northern Japan. Biogeosciences 2010, 7, 3447–3457. [Google Scholar] [CrossRef]
  64. Del Fabbro, C.; Gusewell, S.; Prati, D. Allelopathic effects of three plant invaders on germination of native species: A field study. Biol. Invasions 2014, 16, 1035–1042. [Google Scholar] [CrossRef]
Figure 1. Annual changes in (a) aboveground biomass (AGB); (b) AGB classified by species; and (c) leaf area index (LAI) at peak-growth period classified by species before and after disturbance. Error bars in (b) and (c) represent 1 standard error of total understory AGB (solid, n = 10), total AGB (grey), or total LAI (grey). Data before disturbance were obtained from earlier studies [2,36,37,38]. Standard errors in total AGB and LAI were calculated by the law of error propagation.
Forests 07 00287 g001
Figure 2. Seasonal changes in understory AGB in 2006, 2007, 2009, 2011, and 2014. Error bars represent 1 standard error of total AGB (n = 10).
Forests 07 00287 g002
Figure 3. Annual change of the yearly mortality (ratio of dead and living trees) in population and biomass (AGB).
Forests 07 00287 g003
Figure 4. Relation between root/shoot ratio (RS ratio) and aboveground biomass. The broken line represents linear regression for both Rubus (n = 5) and Solidago (n = 10) species.
Forests 07 00287 g004
Figure 5. Annual net primary production (NPP) during September–August (a) by aboveground and belowground parts; (b) by species; and (c) the proportion by species.
Forests 07 00287 g005
Table 1. Characteristics of overstory trees before (2003) and after (2010 and 2014) the disturbance.
VariablesUnit2003 a20102014
Elapsed years after disturbanceyears–1 b+5+9
Populationtrees ha−11179 c3190 ± 1210 d4380 ± 2580 d
Mean heightm12.2 c1.492.02
Maximum heightmNo data4.106.10
Basal aream2·ha−129.70.19 ± 0.06 d1.12 ± 0.26 d
Dominant species Larix kaempferiBetula platyphylla
Ulmus davidianaBetula ermanii
a Data from earlier reports [2,37,38,39]; b One year before disturbance; c Mean value of trees with diameter at breast height (DBH) greater than 5 cm; d Mean ± 1 standard error for population, aboveground biomass, basal area, and leaf area index (n = 3).
Table 2. Belowground biomass (BGB) 1 and its contribution to total biomass.
YearUnderstory (Mg·ha−1)Overstory (Mg·ha−1)Total BGB (Mg·ha−1)Contribution to Total Biomass %
20063.01 ± 0.32 3.01 ± 0.3653
20073.57 ± 0.51 3.57 ± 0.5451
20093.97 ± 0.54 3.97 ± 0.5450
20114.38 ± 0.330.45 ± 0.154.83 ± 0.3445
20124.20 ± 0.390.59 ± 0.164.79 ± 0.4144
20133.25 ± 0.340.68 ± 0.193.94 ± 0.4244
20143.33 ± 0.430.96 ± 0.254.29 ± 0.5342
1 Values are the mean ± 1 standard error.
Table 3. Biomass accumulation in temperate and boreal sites after forest disturbance.
SiteYears Since DisturbanceAGBBGBTotal BiomassDisturbance 1Dominant SpeciesDominant Species Type 2Reference
(years)(Mg·ha−1)(Mg·ha−1)(Mg·ha−1)
Hokkaido, Japan22.693.015.70WSLRubus idaeusSThis study
53.973.977.94 Rubus idaeusS
75.944.8310.77 Solidago giganteaH
105.894.2910.17 Solidago gigantea and Betula spp.HT
British Columbia, Canada21.41.93.3CBGauletheria shallonS[20]
44.24.18.3 Gauletheria shallonS
85.611.417.0 Gauletheria shallonS
Eastern Finland72.3NANACVaccinium spp. and mossSM[45]
Gifu, central Japan9–125.914.019.9CSasa senanensisS[46]
New Hampshire, USA11.4NANACPrunus pensylvanicaT[47]
417.5NANA Prunus pensylvanicaT
632.6NANA Prunus pensylvanicaT
New Hampshire, USA1NANA1.5CBetula spp. and Prunus pensylvanicaT[24]
2NANA5.8 Prunus pensylvanicaT
3NANA14.2 Prunus pensylvanicaT
4NANA19.5 Prunus pensylvanicaT
5NANA31.3 Prunus pensylvanicaT
6NANA34.6 Prunus pensylvanicaT
North Carolina, USA421.910.732.6CRobinia pseudo-acaciaT[48]
Ontario, Canada47.9NANACPopulus spp.T[49]
Abbreviation: AGB, aboveground biomass; BGB, belowground biomass; NA, data not available; 1 Disturbance type: WSL, windthrow and salvage logging; CB, clearcut and burnt; C, clearcut; 2 Type of dominant species: S, woody shrub; M, moss; H, herb; T, tree.

