
Oak Group Planting Produces a Higher Number of Future Crop Trees, with Better Spatial Distribution than Row Planting


Abstract
:1. Introduction
- (1)
- Total density of potential future crop trees of oaks and other tree species in group planting stands is higher than their density in row planting stands, and
- (2)
- The distribution of future crop trees in group planting stands is spatially more homogeneous than in row plantings.
2. Materials and Methods
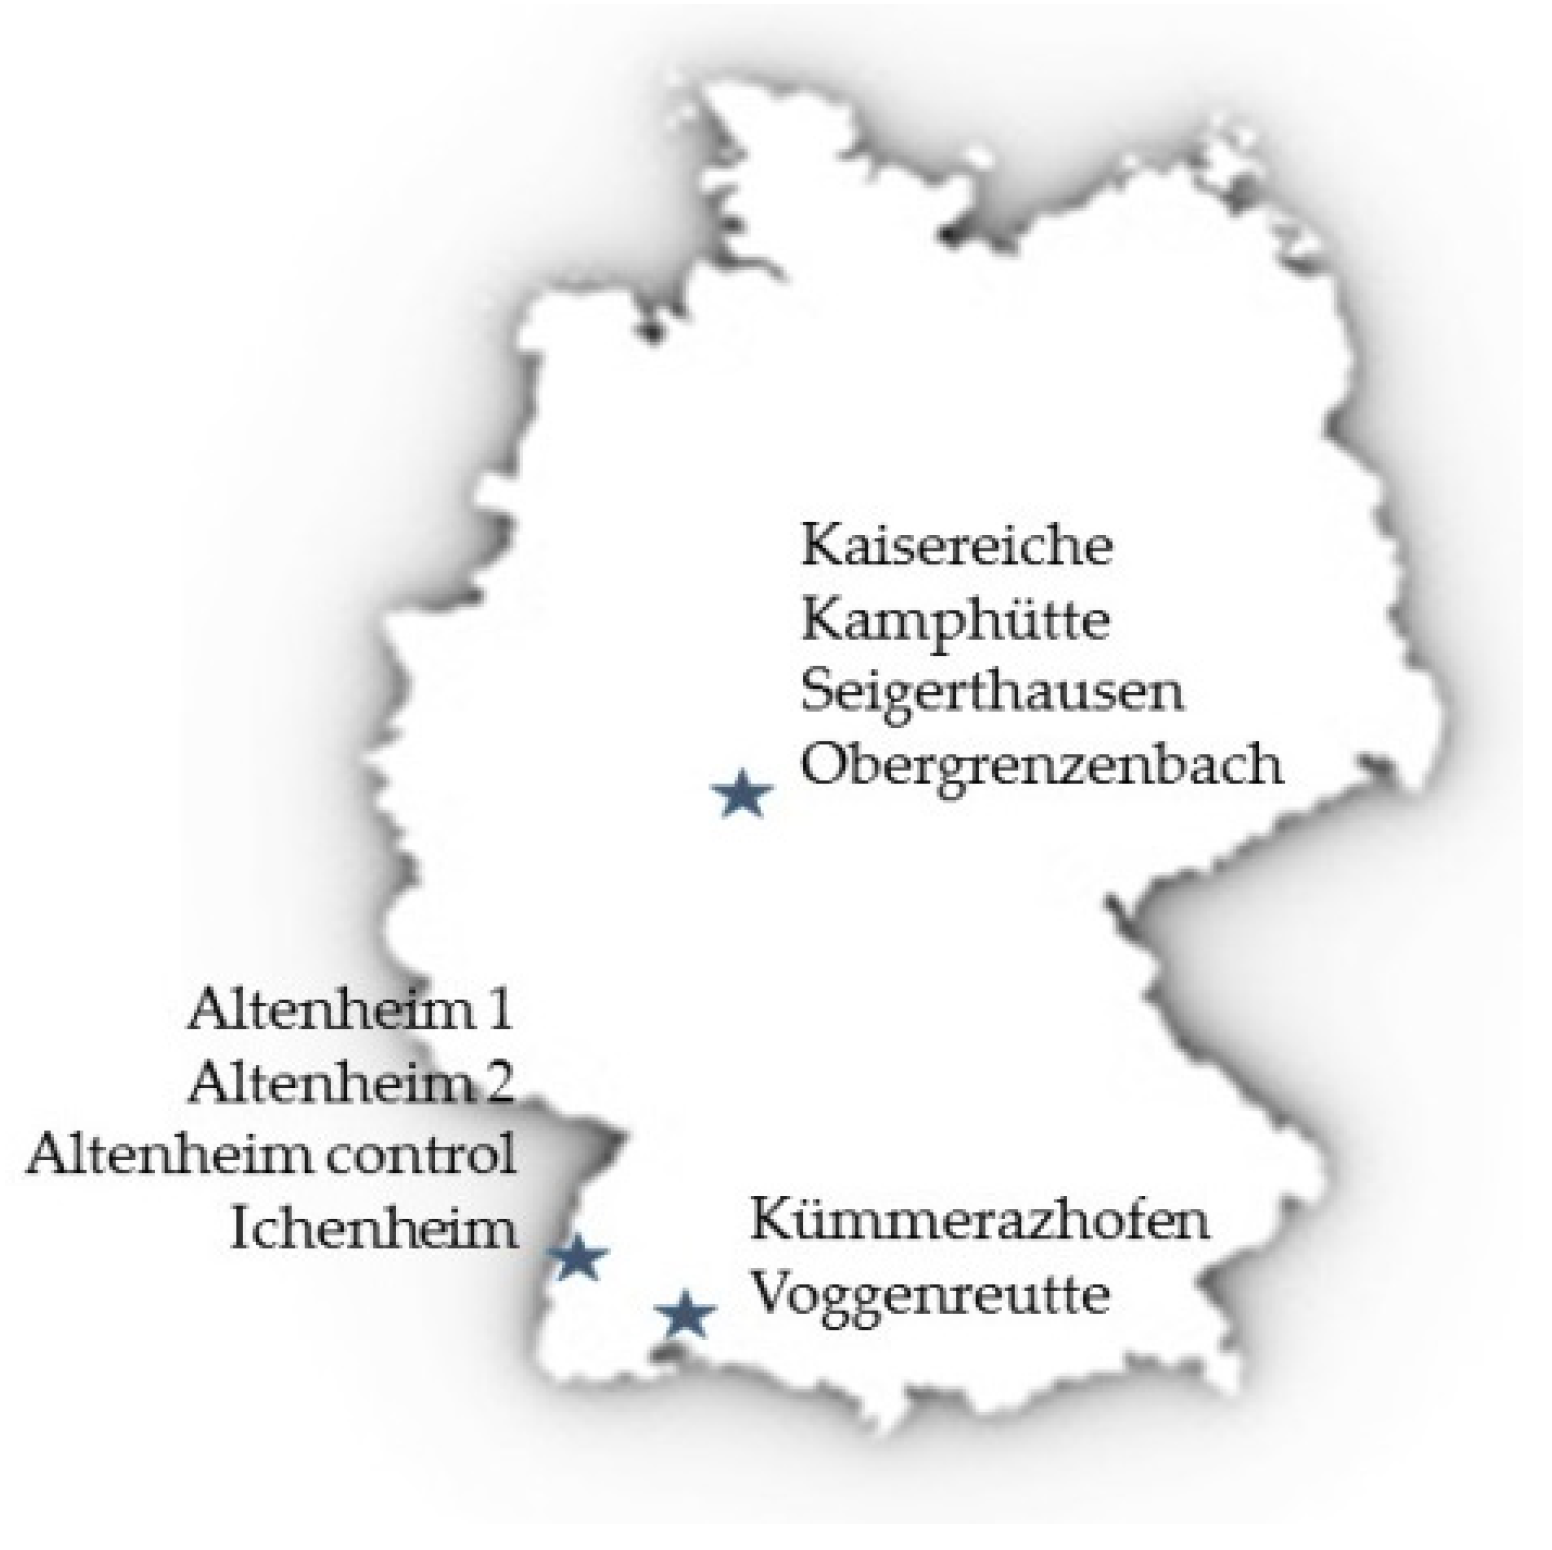
2.1. Study Area
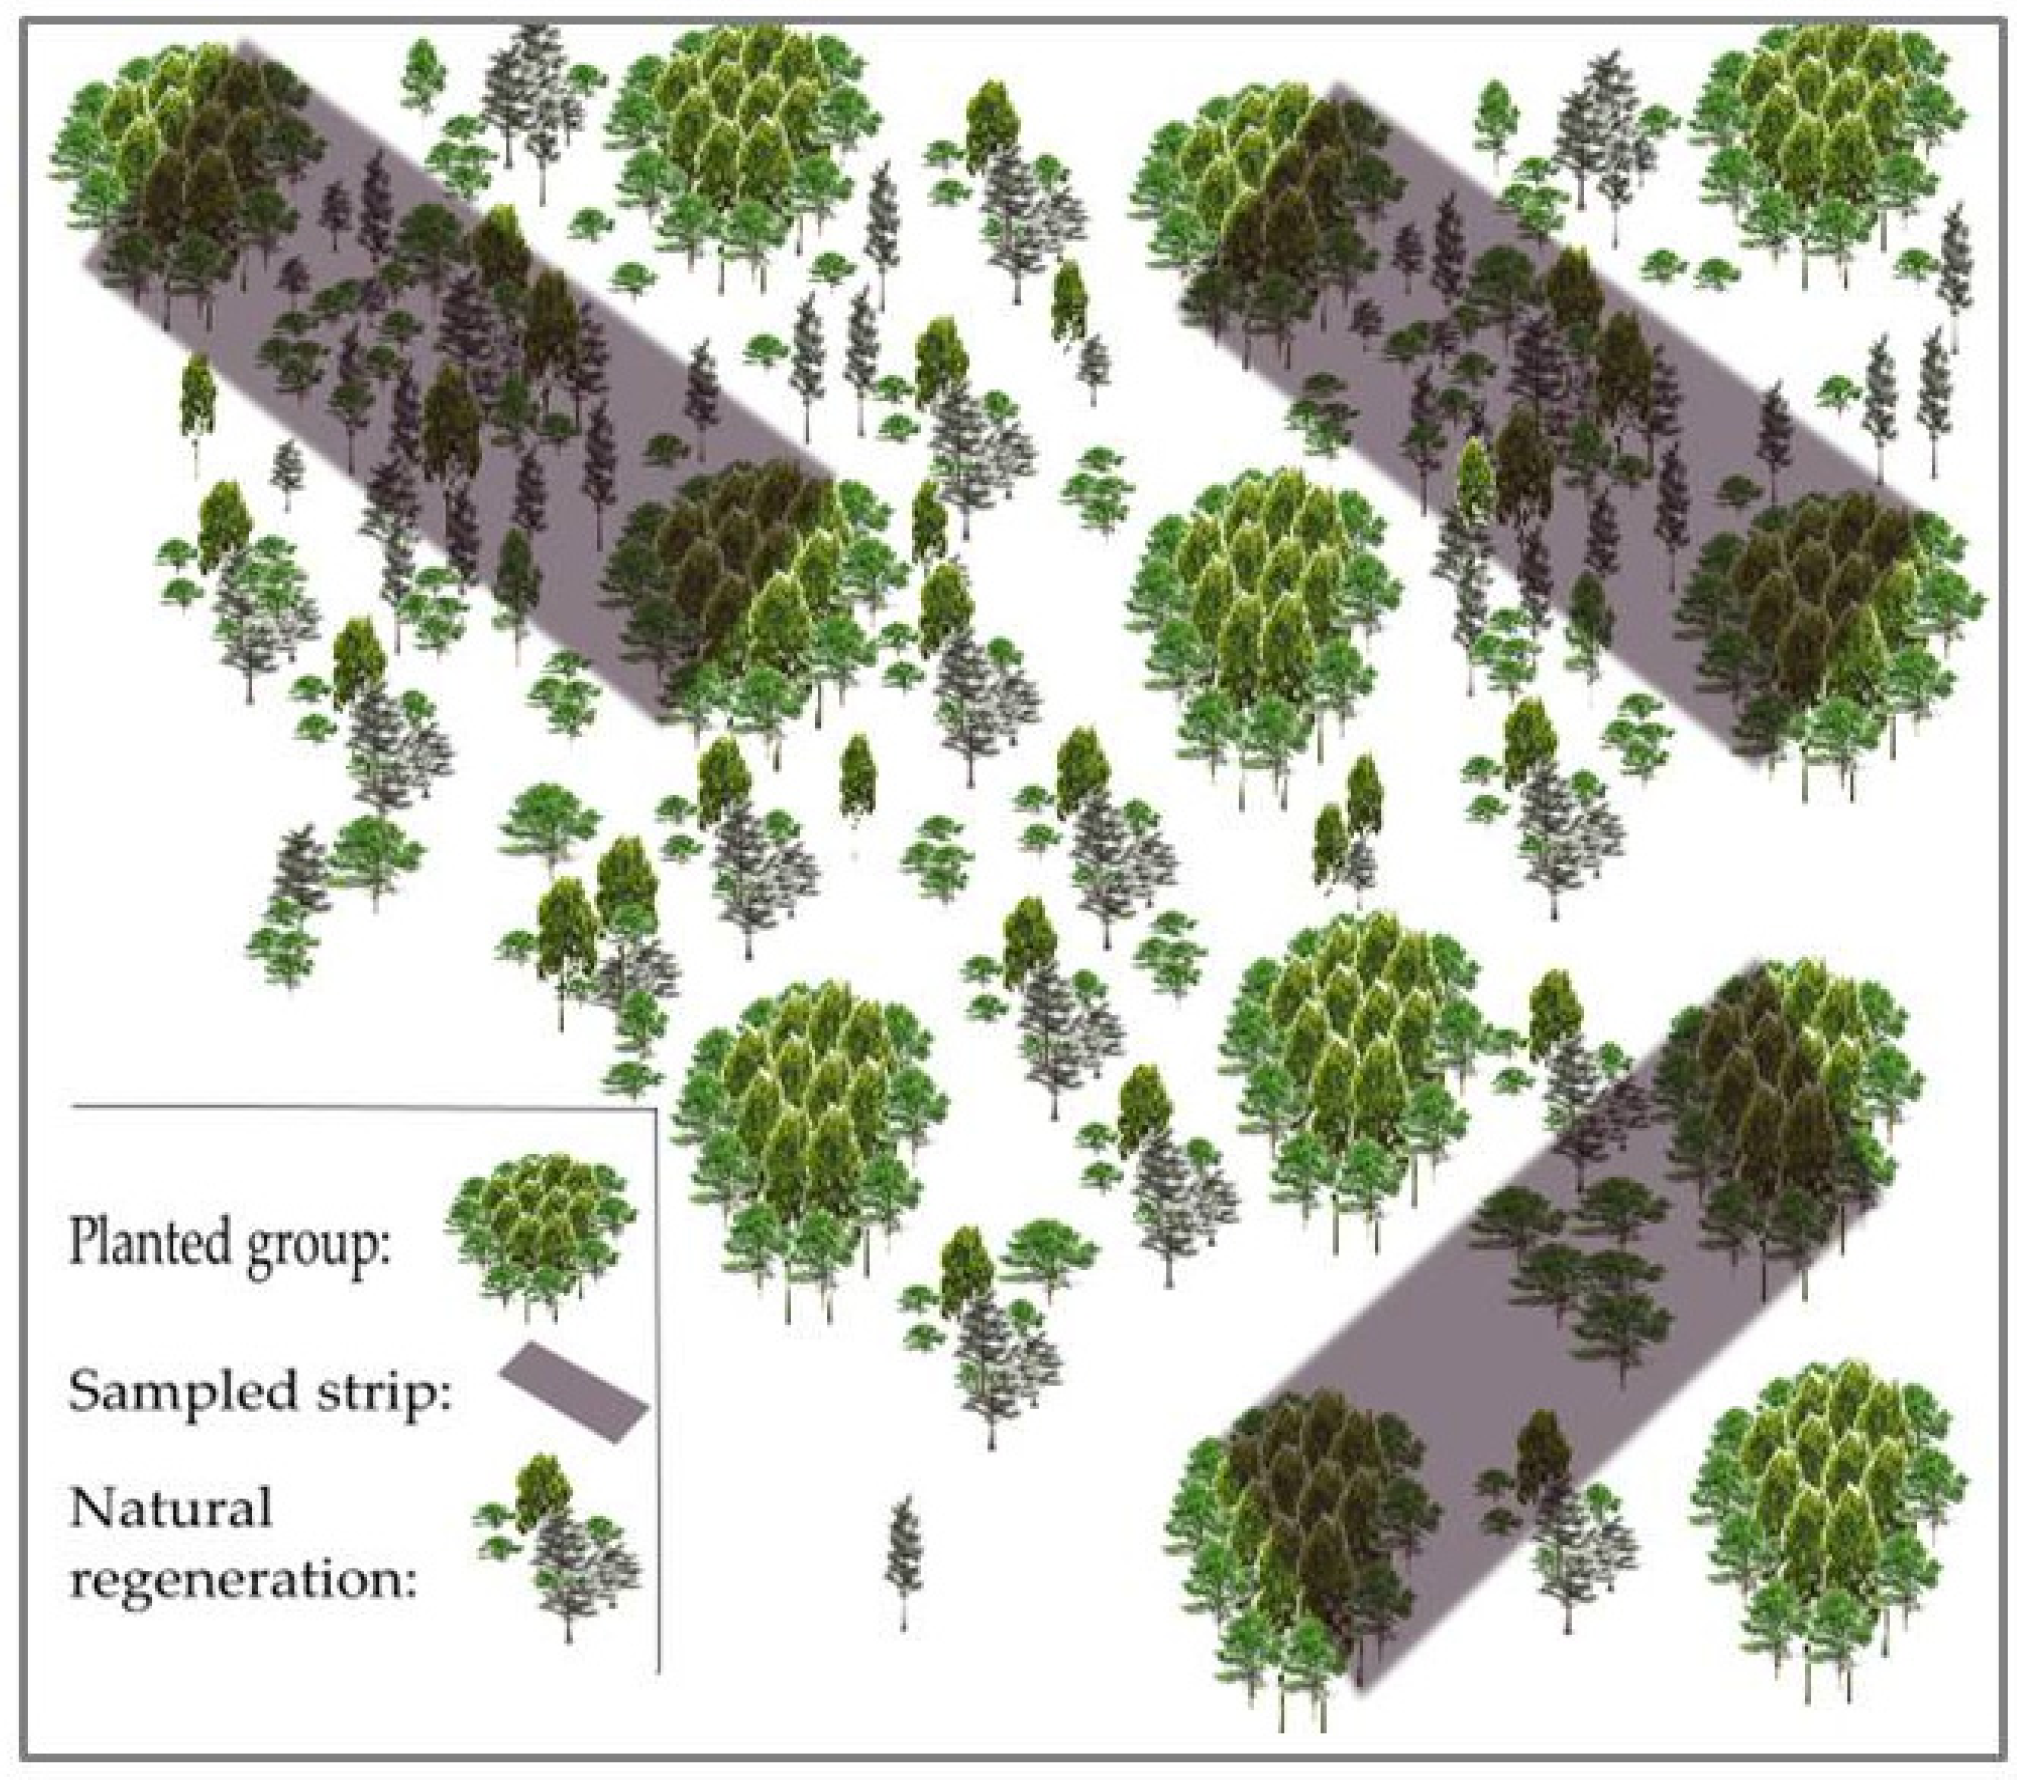
2.2. Sampling Design and Field Inventory
2.3. Data Analysis
3. Results
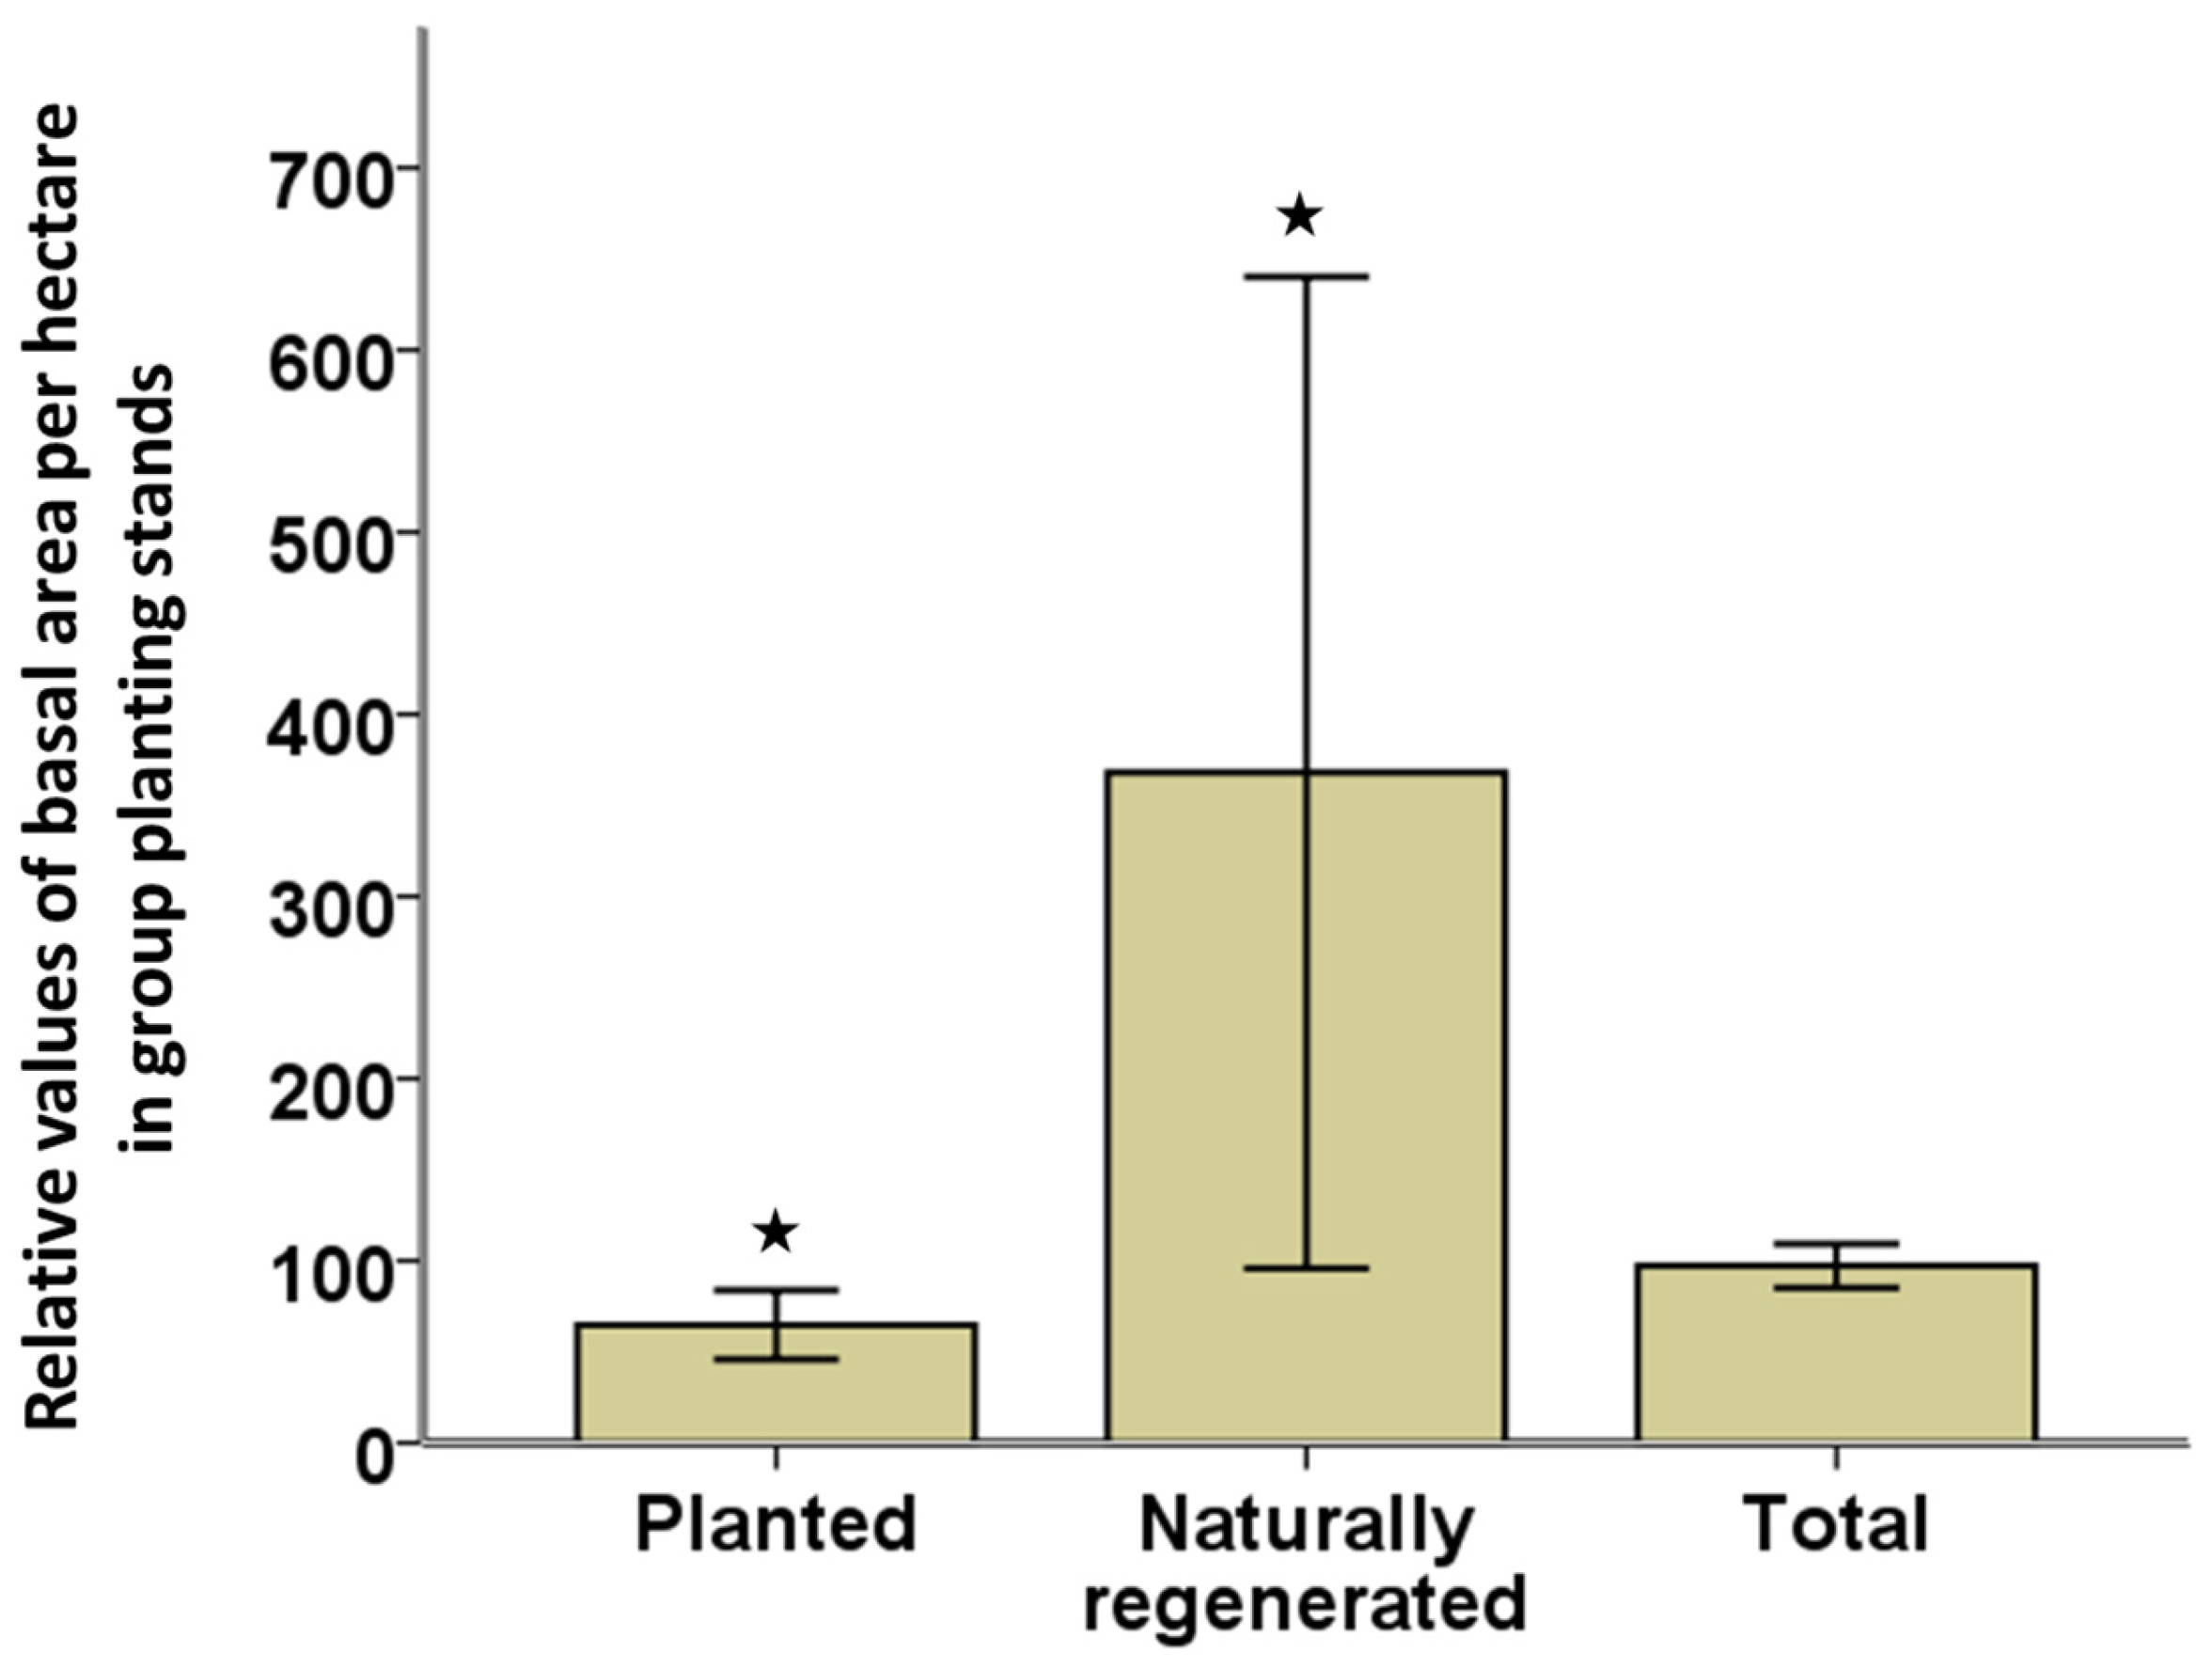
3.1. Basal Area
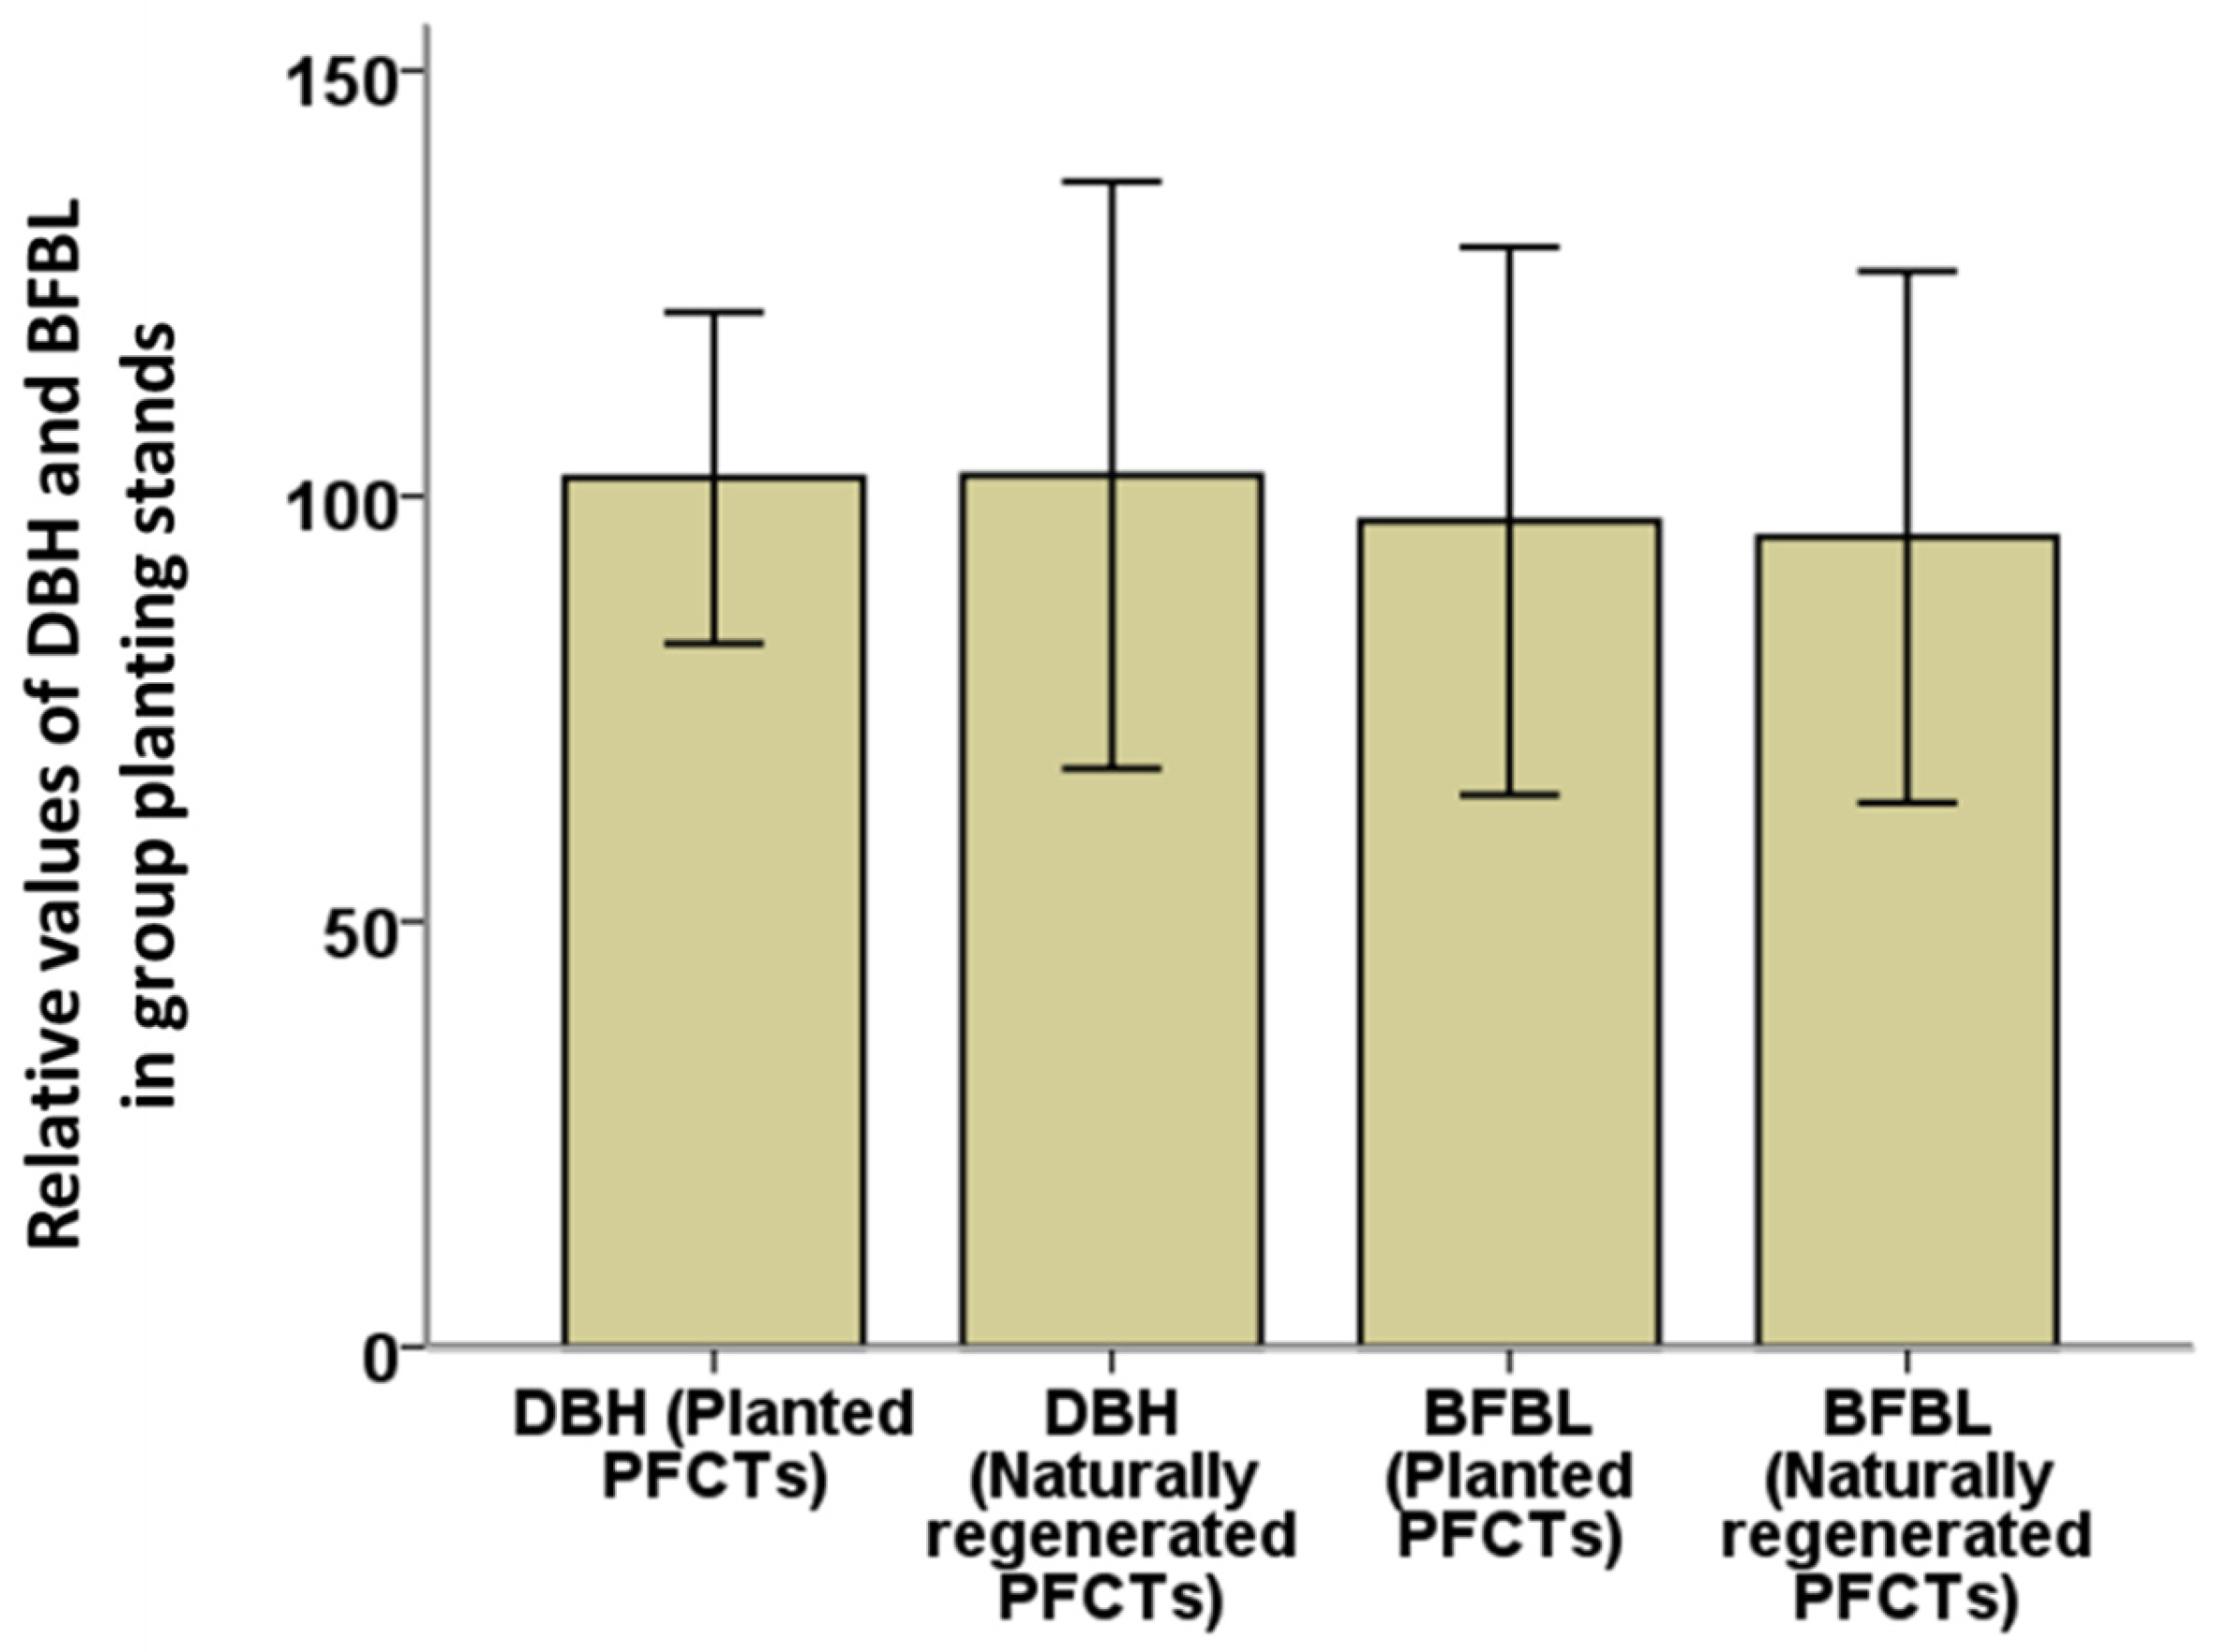
3.2. DBH and BFBL of the PFCTs
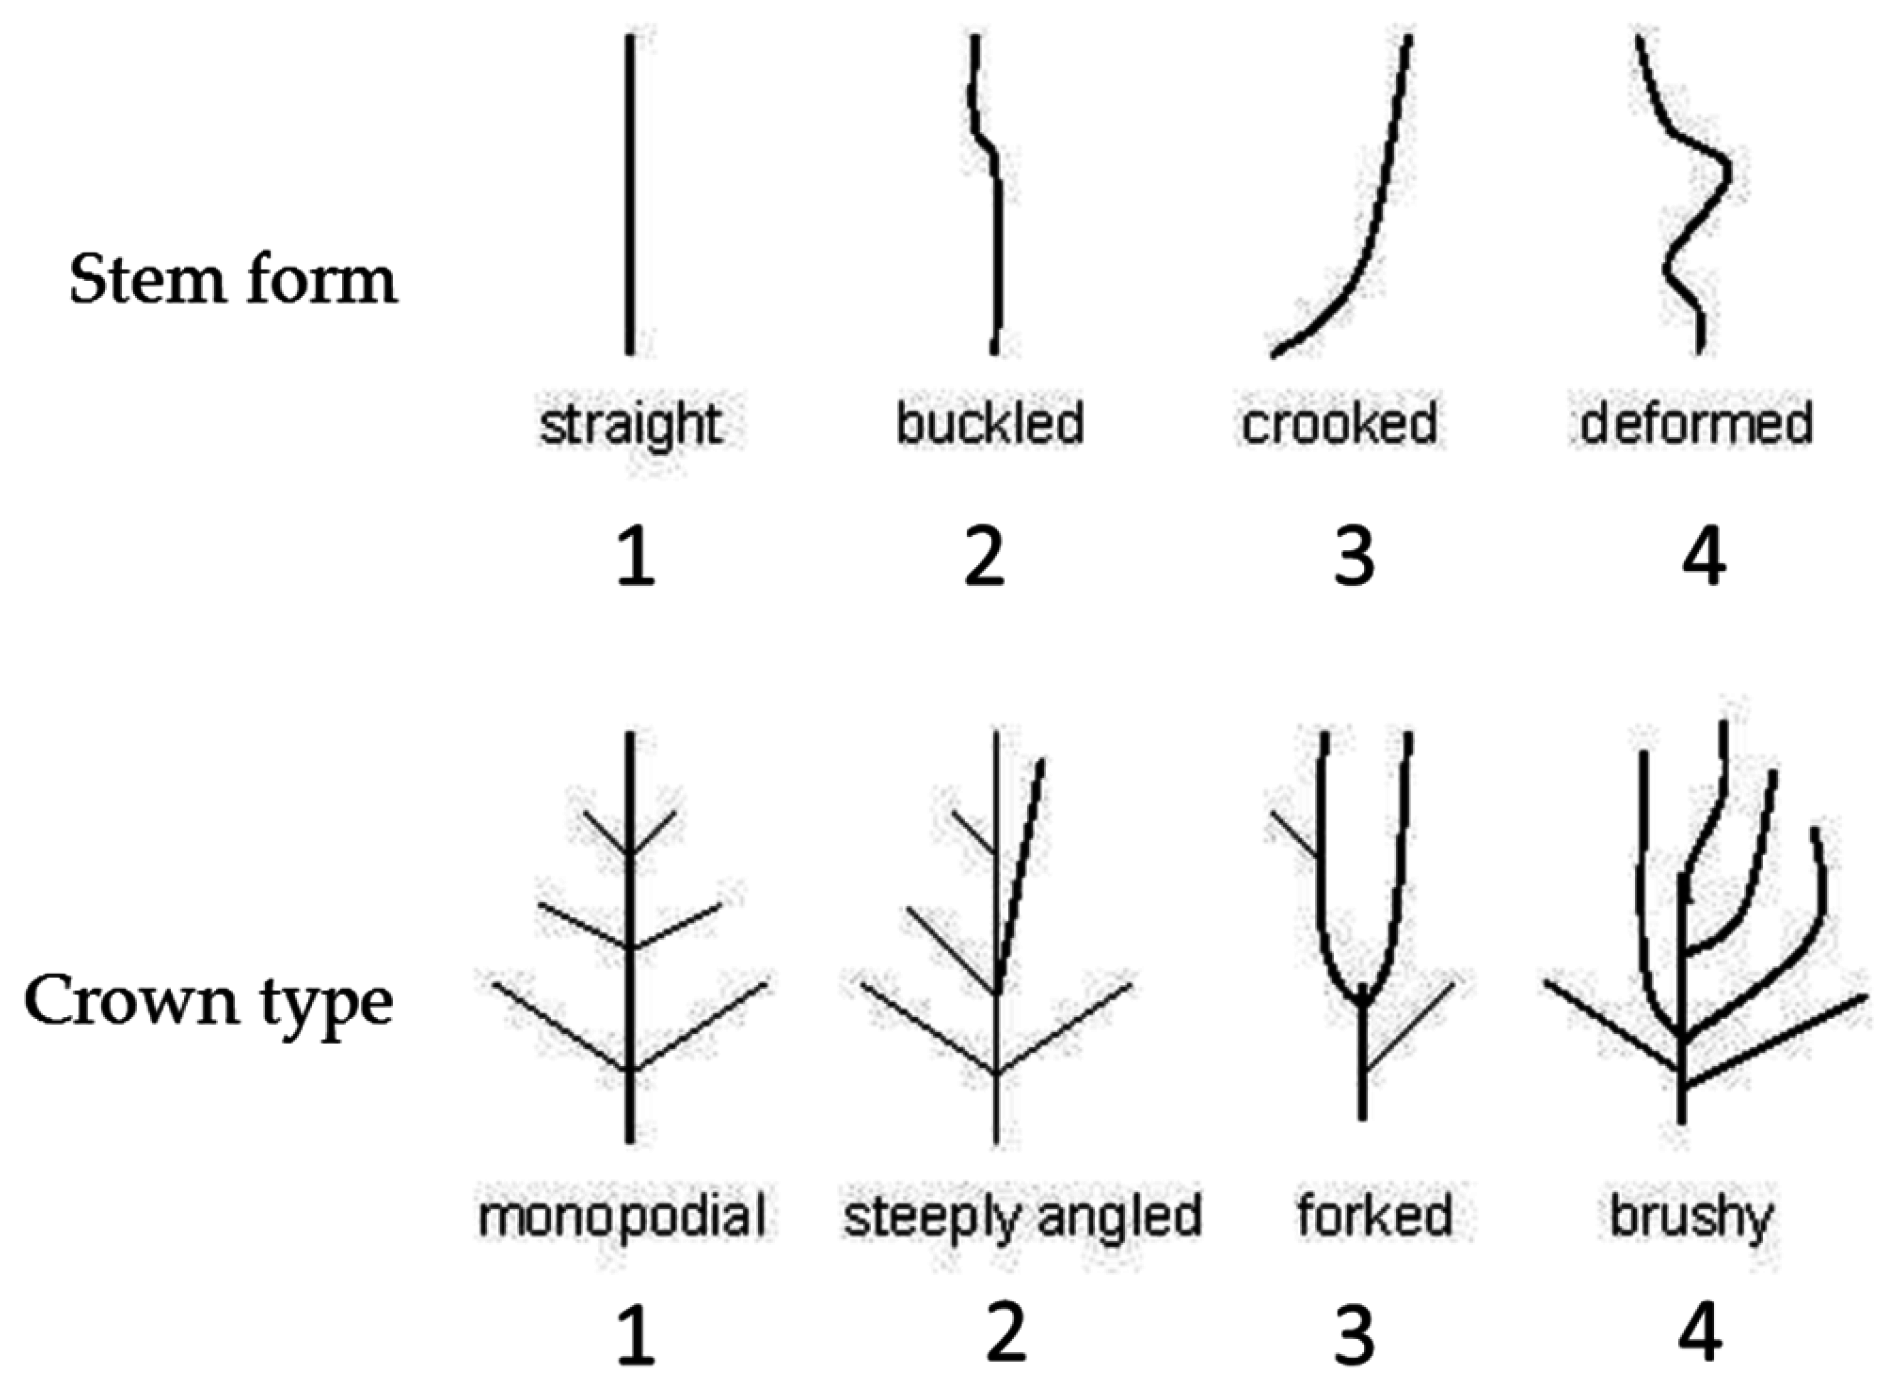
3.3. Stem Form and Crown Shape
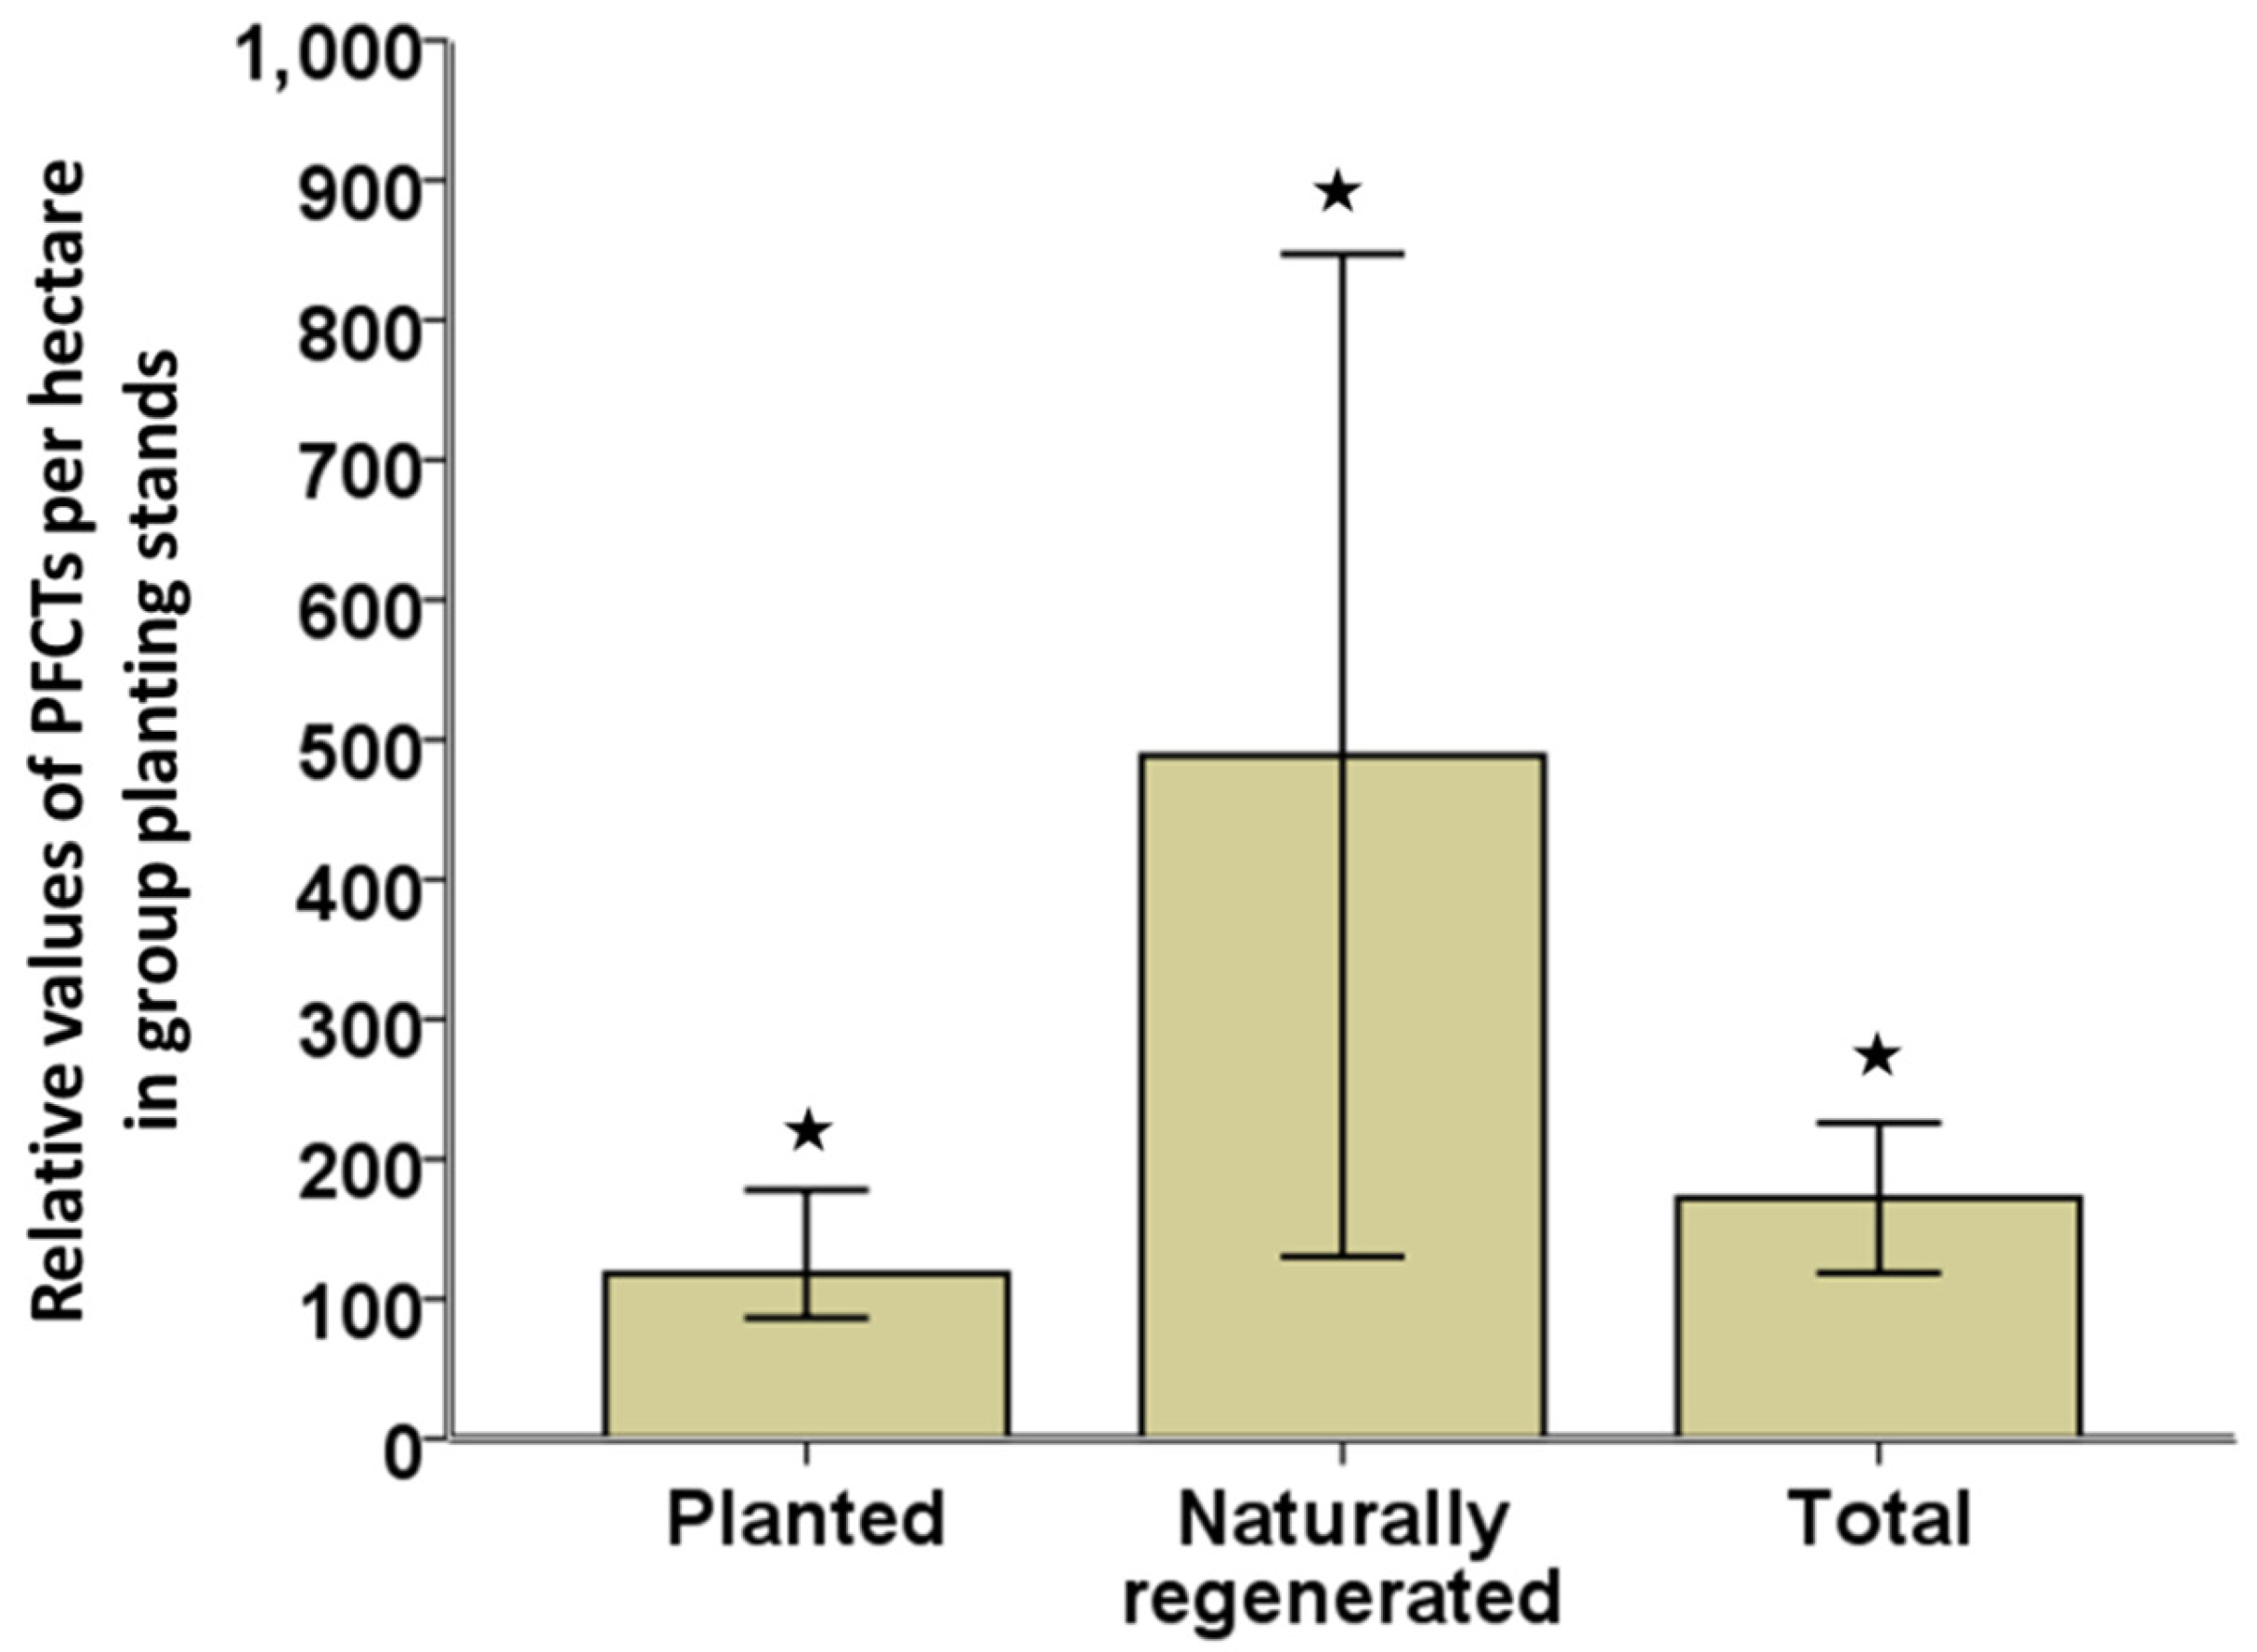
3.4. PFCTs in Group and Row Planting
3.5. Spatial Distribution of PFCTs
4. Discussion
4.1. Development of Basal Area and Tree Quality in Group Planting
4.2. Density of the PFCTs
4.3. Spatial Distribution of the PFCTs
5. Conclusions
Acknowledgments
Author Contributions
Conflicts of Interest
References
- Burschel, P.; Huss, J. Grundriss des Waldbaus: Ein Leitfaden für Studium und Praxis, 2nd ed.; Parey: Berlin, Germany, 1997; p. 487. [Google Scholar]
- Joyce, P.M.; Huss, J.; McCarthy, R.; Pfeifer, A.; Hendrick, E. Growing Broadleaves; COFORD: Dublin, Ireland, 1998; p. 144. [Google Scholar]
- Breda, N.; Huc, R.; Granier, A.; Dreyer, E. Temperate forest trees and stands under severe drought: A review of ecophysiological responses, adaptation processes and long-term consequences. Ann. For. Sci. 2006, 63, 625–644. [Google Scholar] [CrossRef]
- Johnson, P.S.; Shifley, S.R.; Rogers, R. The Ecology and Silviculture of Oaks; CABI Publishing: New York, NY, USA, 2002; p. 503. [Google Scholar]
- Kint, V.; Geudens, G.; Mohren, G.M.J.; Lust, N. Silvicultural interpretation of natural vegetation dynamics in ageing Scots pine stands for their conversion into mixed broadleaved stands. For. Ecol. Manag. 2006, 223, 363–370. [Google Scholar] [CrossRef]
- Götmark, F.; Kiffer, C. Regeneration of Oaks (Quercus robur/Q. Petraea) and Three Other Tree Species during Long-Term Succession after Catastrophic Disturbance (windthrow). Plant Ecol. 2014, 215, 1067–1080. [Google Scholar] [CrossRef]
- Frischbier, N.; Profft, I.; Arenhövel, W. Die Ausweisung klimawandelangepasster Bestandeszieltypen für Thüringen (Thuringian tree species recommendations for adaptation to climate change). Forst Holz 2010, 65, 28–35. [Google Scholar]
- Knoke, T.; Ammer, C.; Stimm, B.; Mosandl, R. Admixing broadleaved to coniferous tree species: A review on yield, ecological stability and economics. Eur. J. For. Res. 2008, 127, 89–101. [Google Scholar] [CrossRef]
- Kenk, G.K. New perspectives in German oak silviculture. Ann. Sci. For. 1993, 50, 563–570. [Google Scholar] [CrossRef]
- Gotmark, F.G.; Berglund, A.; Wiklander, K. Browsing damage on broadleaved trees in semi-natural temperate forest in Sweden, with a focus on oak regeneration. Scand. J. For. Res. 2005, 20, 223–234. [Google Scholar] [CrossRef]
- Lof, M.; Rydberg, D.; Bolte, A. Mounding site preparation for forest restoration: Survival and short term growth response in Quercus robur L. seedlings. For. Ecol. Manag. 2006, 232, 19–25. [Google Scholar] [CrossRef]
- Polley, H.; Henning, P.; Kroiher, F. Baumarten, Altersstruktur und Totholz in Deutschland: Ergebnisse einer Kohlenstoffinventur auf Bundeswaldinventur-Basis. AFZ/Der Wald 2009, 64, 1074–1075. [Google Scholar]
- Birkedal, M.; Löf, M.; Olsson, G.E.; Bergsten, U. Effects of Granivorous Rodents on Direct Seeding of Oak and Beech in Relation to Site Preparation and Sowing Date. For. Ecol. Manag. 2010, 259, 2382–2389. [Google Scholar] [CrossRef]
- Ehring, A.; Keller, O. Eichen-Trupp-Pflanzung in Baden-Württemberg. AFZ/Der Wald 2006, 9, 491–494. [Google Scholar]
- Harari, O.; Brang, P. Trupppflanzungs-Experimente mit Stieleiche und Bergahorn in der Schweiz. Ergebnisse der Erhebungen 2007; Eidg. Forschungsanstalt für Wald, Schnee und Landschaft (WSL): Zurich, Switzerland, 2008; p. 24. [Google Scholar]
- Saha, S.; Kuehne, C.; Bauhus, J. Tree Species Richness and Stand Productivity in Low-Density Cluster Plantings with Oaks (Quercus robur L. and Q. petraea (Mattuschka) Liebl.). Forests 2013, 4, 650–665. [Google Scholar] [CrossRef]
- Rock, J.; Gockel, H.; Schulte, A. Vegetationsdiversität in Eichen-Jungwüchsen aus unterschiedlichen Pflanzschemata. Beitr. Forstwirtsch. Landsch. Ökol. 2003, 37, 11–17. [Google Scholar]
- Saha, S. Development of Tree Quality, Productivity, and Diversity in Oak (Quercus robur and Q. petraea) Stands Established by Cluster Planting. Ph.D. Thesis, Institute of Silviculture, University of Freiburg, Freiburg, Germany, 2012; p. 130. [Google Scholar]
- Saha, S.; Kuehne, C.; Bauhus, J. Lessons learned fromoak cluster planting trials in central Europe. Can. J. For. Res. 2017, 47, 139–148. [Google Scholar] [CrossRef]
- Spiecker, H. Controlling the diameter growth and the natural pruning of Sessile and Pedunculate oaks (Quercus petraea (MATT.) LIEBL. and Quercus robur L.). Schriftenreihe Landesforstverwaltung Baden-Württemberg 1991, 72, 1–135. [Google Scholar]
- Von Lüpke, B. Silvicultural methods of oak regeneration with special respect to shade tolerant mixed species. For. Ecol. Manag. 1998, 106, 19–26. [Google Scholar] [CrossRef]
- Börner, M.; Guericke, M.; Leder, B.; Nutto, L.; Stähr, F. Weinreich A Erhebung qualitätsrelevanter Parameter am Einzelbaum—Aufnahmestandards für junge bis mittelalte Laubhölzer als Grundlage für wissenschaftliche Untersuchungen. Forstarchiv 2003, 74, 275–282. [Google Scholar]
- Gockel, H.; Rock, J.; Schulte, A. Aufforsten mit Eichen-Trupppflanzungen. AFZ/Der Wald 2001, 5, 223–226. [Google Scholar]
- Saha, S.; Kuehne, C.; Kohnle, U.; Brang, P.; Ehring, A.; Geisel, J.; Leder, B.; Muth, M.; Petersen, R.; Peter, J.; et al. Growth and quality of young oaks (Quercus robur and Q. petraea) grown in cluster plantings in central Europe: A weighted meta-analysis. For. Ecol. Manag. 2012, 283, 106–118. [Google Scholar] [CrossRef]
- Nicolini, E.; Chanson, B.; Bonne, F. Stem growth and epicormic branch formation in understorey beech trees (Fagus sylvatica L.). Ann. Bot. 2001, 87, 737–750. [Google Scholar] [CrossRef]
- USDA Forest Service. Field Guides, Methods and Procedures. In Phase 3 Field Guide—Crowns: Measurements and Sampling; version 5.1; USDA Forest Service: Washington, DC, USA, 2011; p. 22. [Google Scholar]
- Liebetrau, A.M. Measures of association. In Quantitative Applications in the Social Sciences; Sage Publications: Newbury Park, CA, USA, 1983; pp. 15–16. [Google Scholar]
- IBM. SPSS® Statistics, version 20; IBM: Somers, NY, USA, 2012.
- Environmental Systems Research Institute (ESRI). ArcGIS Desktop: Release 10; Environmental Systems Research Institute: Redlands, CA, USA, 2011. [Google Scholar]
- Mitchell, A. The ESRI Guide to GIS Analysis; ESRI Press: Redlands, CA, USA, 2005; Volume 2. [Google Scholar]
- IB Geography. Nearest Neighbour Index. Available online: http://www.geoib.com/nearest-neighbor-index.html (accessed on 14 November 2016).
- Clark, P.J.; Evans, F.C. Distance to nearest neighbor as a measure of spatial relationships in populations. Ecology 1954, 35, 445–453. [Google Scholar] [CrossRef]
- University of Michigan. Distance Analysis I and II; University of Michigan: Ann Arbor, MI, USA, 2016; p. 42. Available online: https://www.icpsr.umich.edu/CrimeStat/files/CrimeStatChapter.5.pdf (accessed on 14 November 2016).
- ESRI. What Is a Z Score? Available online: http://edndoc.esri.com/arcobjects/9.2/NET/shared/geoprocessing/spatial_statistics_toolbox/what_is_a_z_score_qst_.htm (accessed on 14 November 2016).
- Petersen, R. Eichen-Trupp-Pflanzung—Erste Ergebnisse einer Versuchsfläche im NFA Neuhaus. Forst Holz 2007, 62, 19–25. [Google Scholar]
- Rock, J. Zur Entwicklung der Astdurchmesser junger Eichen in Trupppflanzungsbeständen. Forstarchiv 2004, 75, 143–149. [Google Scholar]
- Gaul, T.; Stüber, V. Der Eichen-Nelder-Verbandsversuch Göhrde. Forst Holz 1996, 51, 70–75. [Google Scholar]
- Schmaltz, J.; Fröhlich, A.; Gebhardt, M. Die Qualitätsentwicklung in jungen Traubeneichenbeständen im Hessischen Spessart. Forstarchiv 1997, 68, 3–10. [Google Scholar]
- Kuehne, C.; Kublin, E.; Pyttel, P.; Bauhus, J. Growth and form of Quercus robur and Fraxinus excelsior respond distinctly different to initial growing space: Results from 24-year-old Nelder experiments. J. For. Res. 2013, 24, 1–14. [Google Scholar] [CrossRef]
- Rock, J.; Puettmann, K.J.; Gockel, H.A.; Schulte, A. Spatial aspects of the influence of silver birch (Betula pendula L.) on growth and quality of young oaks (Quercus spp.) in central Germany. Forestry 2004, 77, 235–247. [Google Scholar] [CrossRef]
- Koch, R.; Brang, P. Extensive Verjüngungsverfahren nach Lothar; Schlussbericht zuhanden der Eidg. Forstdirektion des BUWAL. Eidg. Forschungsanstalt für Wald, Schnee und Landschaft (WSL): Zurich, Switzerland, 2005; p. 90. [Google Scholar]
- Spellmann, H.; Baderschneider, A. Erste Auswertung eines Traubeneichen-Pflanzverbands-und Sortimentsversuches im Forstamt Hardegsen/Solling. Forst Holz 1988, 19, 447–450. [Google Scholar]
- Malinauskas, A. Influence of initial density of oak (Quercus robur L.) plantations on stem quality. Balt. For. 2007, 13, 83–88. [Google Scholar]
- Spellmann, H.; von Diest, W. Entwicklung von Z-Baum-Kollektiven in langfristig beobachteten Eichen-Versuchsflächen. Forst Holz 1990, 45, 573–580. [Google Scholar]
- Saha, S.; Kuehne, C.; Bauhus, J. Intra- and interspecific competition differently influence growth and stem quality of young oaks (Quercus robur L. and Quercus petraea (Mattuschka) Liebl.). Ann. For. Sci. 2014, 71, 381–393. [Google Scholar] [CrossRef]
- Anderson, M.L. A New System of Planting. Scott. For. J. 1930, 44, 78–89. [Google Scholar]
- Szymanski, S. Application of Ogijevski’s nest method of artificial regeneration of oak on fertile sites. Sylwan 1977, 121, 43–55. (In Polish) [Google Scholar]
- Gockel, H. Soziale und Qualitative Entwicklungen Sowie Z-Baumhäufigkeiten in Eichenjungbeständen. Die Entwicklung eines Neuen Pflanzschemas “Die Trupppflanzung”. Ph.D. Thesis, Georg-August-Universität Göttingen, Göttingen, Germany, 1994; p. 168. [Google Scholar]
- Gockel, H. Die Trupp-Pflanzung, Ein neues Pflanzschema zur Begründung von Eichenbeständen. Forst Holz 1995, 50, 570–575. [Google Scholar]
- Saha, S.; Kühne, C.; Kohnle, U.; Bauhus, J. Eignung von Nester- und Trupppfl anzungen für die Begründung von Eichenbeständen. AFZ/Der Wald 2013, 2, 39–41. [Google Scholar]


| Stands’ Name | Geographical Area | Size (ha) | Elevation (m) | Mean Annual Temperature °C | Mean Annual Rainfall (mm) | Neighbouring Stands | Soil Type | Mean Annual Increment of the Oaks (m³·ha−1·year−1) |
|---|---|---|---|---|---|---|---|---|
| Group planting | ||||||||
| Altenheim 1 | Upper Rhine valley | 2 | 143 | 10.2 | 832 | BLM | Gleyic cambisols | 8.5 |
| Altenheim 2 | Upper Rhine valley | 2.7 | 143 | 10.2 | 832 | BLM | Gleyic cambisols | 8.5 |
| Kümmerazhofen | Southwest German Alpine Foreland | 0.5 | 550 | 7.7 | 851 | BLM. C | Stagnogleyic cambisols | 8 |
| Kaisereiche | North-eastern Hessian Mountains | 1.2 | 487 | 6.5 | 800 | BLM. C | Stagnogleyic cambisols | 7.5 |
| Kamphütte | North-eastern Hessian Mountains | 1.1 | 447 | 6.5 | 800 | BLM. C | Stagnogleyic cambisols | 7.5 |
| Row planting controls | ||||||||
| Altenheim | Upper Rhine valley | 0.9 | 143 | 10.2 | 832 | BLM | Gleyic cambisols | 8.5 |
| Ichenheim | Upper Rhine valley | 0.5 | 152 | 10.2 | 832 | BLM | Gleyic cambisols | 8.5 |
| Voggenreutte | Southwest German Alpine Foreland | 0.5 | 568 | 7.7 | 851 | BLM | Stagnogleyic cambisols | 7 |
| Obergrenzebach | North-eastern Hessian Mountains | 14.7 | 361 | 6.5 | 800 | BLM. C | Stagnogleyic cambisols | 7.5 |
| Seigerthausen | North-eastern Hessian Mountains | 14.7 | 361 | 6.5 | 800 | BLM. C | Stagnogleyic cambisols | 7.5 |
| Stands’ Name | Altenheim 1 | Altenheim 2 | Kümmerazhofen | Kaisereiche | Kamphütte |
|---|---|---|---|---|---|
| Oak species planted | Q. robur | Q. robur | Q. robur | Q. petraea | Q. petraea |
| Stand age (in years) | 14 | 14 | 15 | 22 | 21 |
| Spacing between oaks within clusters (m) | 1 | 1 | 1 | 1 | 1 |
| Clusters per ha | 70 | 70 | 60 | 100 | 100 |
| Oaks per cluster | 19 | 19 | 19 | 27 | 27 |
| Trainers trees per cluster | 12 | 12 | 10 to 11 | 15 | 15 |
| Trainer tree species | Tilia cordata, Carpinus betulus | Carpinus betulus | Tilia cordata, Carpinus betulus | Fagus sylvatica | Fagus sylvatica |
| Fence/Protection | Yes | Yes | No | Yes | Yes |
| DBH of oaks | 6.02 (0.40, 137) | 6.28 (0.29, 135) | 5.41 (0.27, 167) | 7.06 (0.32, 198) | 7.02 (0.27, 231) |
| DBH of trainer trees | 6.48 (0.43, 92) | 7.85 (0.27, 130) | 5.29 (0.30, 82) | 2.75 (0.37, 75) | 2.77 (0.31, 123) |
| DBH of naturally regenerated trees | 3.49 (0.13, 411) | 3.75 (0.10, 520) | 3.92 (0.12, 485) | 2.70 (0.17, 1102) | 7.05 (0.36, 176) |
| Stands’ Name | Altenheim | Ichenheim | Voggenreutte | Obergrenzebach | Seigerthausen |
|---|---|---|---|---|---|
| Oak species planted | Q. robur | Q. robur | Q. robur | Q. petraea | Q. petraea |
| Stand age (in years) | 14 | 14 | 15 | 24 | 24 |
| Spacing between trees in rows (m) | 2 × 1 | 2 × 1 | 2 × 1 | 2 × 1 | 2 × 1 |
| Planted oak trees per ha | 3500 | 3500 | 3500 | 4000 | 4000 |
| Planted trainer trees per ha (approximately) | 1500 | 1500 | 1000 | 1000 | 1000 |
| Trainer tree species | Tilia cordata Carpinus betulus | Carpinus betulus | Tilia cordata Carpinus betulus | Carpinus betulus | Carpinus betulus |
| Fence/Protection | Yes | Yes | No | Yes | Yes |
| DBH of oaks | 6.79 (0.33, 165) | 6.34 (0.24, 158) | 6.49 (0.21, 243) | 7.18 (0.22, 433) | 6.69 (0.20, 413) |
| DBH of trainer trees | 7.55 (0.33, 155) | 8.44 (0.25, 184) | 3.32 (0.40, 43) | 4.8 (0.60, 28) | 4.96 (0.13, 96) |
| DBH of naturally regenerated trees | 4.32 (0.23, 144) | 3.88 (0.24, 85) | 2.18 (0.18, 233) | 6.74 (0.39, 215) | 6.96 (0.32, 234) |
| Crown Shape Class | Planted Oak Trees (%) | Naturally Regenerated Trees (%) | Stem Form Class | Planted Oak Trees (%) | Naturally Regenerated Trees (%) | |
|---|---|---|---|---|---|---|
| Group planting | 1 | 6 | 11 | 1 | 22 | 18 |
| 2 | 40 | 51 | 2 | 47 | 35 | |
| 3 | 45 | 30 | 3 | 26 | 36 | |
| 4 | 9 | 8 | 4 | 5 | 11 | |
| Row planting | 1 | 3 | 12 | 1 | 20 | 12 |
| 2 | 35 | 42 | 2 | 39 | 39 | |
| 3 | 51 | 38 | 3 | 35 | 43 | |
| 4 | 11 | 8 | 4 | 6 | 6 |
| Planting Type | Observed Mean Distance (m) | Expected Mean Distance (m) | Nearest Neighbor Ratio | Z-Score | p Value |
|---|---|---|---|---|---|
| Group planting | |||||
| All PFCTs | 5.48 | 2.65 | 2.06 | 22.64 | <0.01 |
| Oak PFCTs | 8.3 | 3.49 | 2.37 | 22.19 | <0.01 |
| Row planting | |||||
| All PFCTs | 5.05 | 2.6 | 1.94 | 17.37 | <0.01 |
| Oak PFCTs | 6.24 | 2.9 | 2.15 | 19.08 | <0.01 |
| All PFCTs | Oak PFCTs | |||||||||
|---|---|---|---|---|---|---|---|---|---|---|
| Stands’ Name | Observed Mean Distance (m) | Expected Mean Distance (m) | Nearest Neighbor Ratio | Z-Score | p Value | Observed Mean Distance (m) | Expected Mean Distance (m) | Nearest Neighbor Ratio | Z-Score | p Value |
| Altenheim 1 | 6.78 | 3.10 | 2.18 | 9.85 | <0.01 | 8.87 | 3.91 | 2.26 | 8.4 | <0.01 |
| Altenheim 2 | 10.51 | 4.20 | 2.49 | 10.71 | <0.01 | 12.61 | 4.54 | 2.77 | 11.75 | <0.01 |
| Kümmerazhofen | 5.28 | 2.31 | 2.28 | 13.02 | <0.01 | 19.76 | 6.11 | 3.23 | 8.54 | <0.01 |
| Kaisereiche | 4.03 | 2.38 | 2.69 | 7.00 | <0.01 | 8.30 | 1.49 | 5.53 | 73.15 | <0.01 |
| Kamphütte | 4.09 | 1.91 | 2.11 | 12.41 | <0.01 | 7.30 | 2.56 | 2.85 | 15.42 | <0.01 |
© 2016 by the authors; licensee MDPI, Basel, Switzerland. This article is an open access article distributed under the terms and conditions of the Creative Commons Attribution (CC-BY) license (http://creativecommons.org/licenses/by/4.0/).
Share and Cite
Skiadaresis, G.; Saha, S.; Bauhus, J. Oak Group Planting Produces a Higher Number of Future Crop Trees, with Better Spatial Distribution than Row Planting. Forests 2016, 7, 289. https://doi.org/10.3390/f7110289
Skiadaresis G, Saha S, Bauhus J. Oak Group Planting Produces a Higher Number of Future Crop Trees, with Better Spatial Distribution than Row Planting. Forests. 2016; 7(11):289. https://doi.org/10.3390/f7110289
Chicago/Turabian StyleSkiadaresis, Georgios, Somidh Saha, and Jürgen Bauhus. 2016. "Oak Group Planting Produces a Higher Number of Future Crop Trees, with Better Spatial Distribution than Row Planting" Forests 7, no. 11: 289. https://doi.org/10.3390/f7110289