Article

Foliage Chemistry of Pinus baksiana in the Athabasca Oil Sands Region, Alberta, Canada

by
Bernadette C. Proemse
1,*,
Doug G. Maynard
2 and
Bernhard Mayer
3
1
School of Biological Sciences, University of Tasmania, Hobart, TAS 7001, Australia
2
Canadian Forest Service, Natural Resources Canada, Victoria, BC V8Z 1M5, Canada
3
Department of Geoscience, University of Calgary, Calgary, AB T2N 1N4, Canada
*
Author to whom correspondence should be addressed.
Forests 2016, 7(12), 312; https://doi.org/10.3390/f7120312
Submission received: 14 October 2016 / Revised: 30 November 2016 / Accepted: 2 December 2016 / Published: 8 December 2016
(This article belongs to the Special Issue Forest Growth Response to Environmental Stress)

Abstract

:
Industrial emissions in the Athabasca Oil Sands Region (AOSR), Alberta, Canada, have caused concerns about the effect of oil sands operations on the surrounding terrestrial environments, including jack pine (Pinus banksiana Lamb.) stands. We collected jack pine needles from 19 sites in the AOSR (13–128 km from main operations) for foliar chemical analyses to investigate the environmental impact on jack pine. Pine needles from three age classes, the current annual growth (CAG, 2011), one year and two year old pine needles, were collected. Samples were analyzed for total carbon (TC), nitrogen (TN), and sulfur (TS), inorganic S (SO4-S), base cations (Ca, Mg, Na), and other elements (B, Cu, Fe, Mn, P, Zn); CAG needles were also analyzed for their nitrogen and carbon isotopic compositions. Only TN, TS, Ca, B, Zn, and Fe contents showed weak but significant increases with proximity to the major oil sands operations. C and N isotopic compositions showed no trend with distance or TC and TN contents. Total S contents in CAG of pine foliage increased significantly with proximity to the main industrial operation while foliar inorganic S to organic S ratios (SO4-S/Sorg) ranged consistently between 0.13 and 0.32, indicating low to moderately high S loading. Hence, this study suggests some evidence of uptake of S emissions in close proximity to anthropogenic sources, although the reported values have not reached a level of environmental concern.

1. Introduction

The Athabasca Oil Sands Region (AOSR) in northeastern Alberta, Canada, is an enormous unconventional oil resource that constitutes the third largest oil reserve in the world. This oil resource has experienced an unprecedented expansion of mining projects (open pit mining) and in-situ operations (e.g., steam-assisted gravity drainage) over the last decades that has resulted in an increase in industrial emissions [1]. Mining, bitumen upgrading, vehicle exhaust from heavy haulers operating in the open pit mines and other off- and on-road vehicles, are accompanied by significant industrial nitrogen (N) and sulfur (S) emissions. While earlier air quality monitoring in the AOSR focused on sulfur oxide (SOx) emissions, current monitoring and modeling also includes nitrogen oxide (NOx) emissions, base cations, and various other air quality parameters [1]. Potential consequences of elevated S and N emissions include acid deposition and soil acidification [2,3], which are of particular concern in the boreal forest ecosystems of the AOSR and the adjacent province Saskatchewan [4,5,6,7,8,9,10]. Jack pine forests growing on sandy soils with low base cation weathering rates were identified as most sensitive to acidic deposition in the AOSR [9,11]. However, base cation deposition (Ca2+, Mg2+, Na+) can mitigate impacts of acid deposition, and high base cation deposition from fugitive mine dust sources have been recently reported for the AOSR [12,13]. Hence, the chemical analysis of jack pine foliage including main pollutants indicative of acid deposition as well as base cation deposition may serve as an effective indicator for the extent of environmental effects related to increased industrial emissions and deposition in the AOSR.
In addition to the determination of the contents of total nitrogen (TN) and carbon (TC) in pine needles, the nitrogen and carbon stable isotopic composition (δ15N, δ13C) may provide information about N and C sources and environmental or climatic stress conditions, and have been previously used in dendro-ecological investigations [14,15,16,17]. Globally, δ15N values in atmospheric nitrogen deposition (e.g., NO3, NH4+) may range from −15‰ to +15‰ [18], but particulate matter and dry deposition are typically enriched in 15N compared to δ15N values of dissolved N compounds in rainfall [19,20,21,22]. Indeed, elevated δ15N values of up to 17.9‰ for δ15N-NO3 and up to 20.1‰ for δ15N-NH4 were found in stack fine particulate matter (PM2.5) emissions and in atmospheric deposition in the vicinity of industrial developments in the AOSR [23], whereas nitrogen in bulk deposition at distant background sites revealed low δ15N values [22]. Proemse et al. (2013) [22] showed that background atmospheric nitrate deposition (i.e., NO3-N deposition rates <0.1 kg·N·ha−1) were associated with an average δ15N-NO3 value of −3.2‰ ± 1.5‰ during summer and 0.3‰ ± 1.7‰ during winter. δ15N-NH4 in bulk deposition from background sites (NH4-N deposition rates <0.5 kg·N·ha−1) was characterized by average values of −3.6‰ ± 0.9‰ during summer and of −3.2‰ ± 2.2‰ during winter. δ15N values in bio-indicators such as lichens in the AOSR were also proven to be a useful qualitative indicator of N uptake within 3 km distance from industrial emissions [24].
Forest ecosystems are particularly sensitive to sulfur dioxide (SO2), which is absorbed by trees through the stomata [25]. Although both atmospheric and pedospheric sources have to be considered, sulfur concentrations in leaves tend to be more influenced by direct uptake of ambient SO2 as opposed to sulfate (SO4) uptake by roots [26]. Total sulfur concentrations in pine needles were found to be a good indicator of SO2 concentrations in ambient air [27]. Conifers absorb gaseous SO2 or take up SO4 via roots, and both compounds are subsequently reduced to organic S forms (Sorg), with the remainder being stored as sulfate [28,29]. In either case, an over-supply of S may cause an accumulation of SO4 in the plant tissue because the tree is unable to convert all SO2 or SO4 into Sorg. Hence, the ratio of total inorganic sulfur (SO4-S) to Sorg in pine needles has been suggested as an effective indicator for S loading and S stress [30].
Trace elements boron (B), copper (Cu), iron (Fe), manganese (Mn), and zinc (Zn) have been associated with the large number of sources and processes (natural and anthropogenic) in the AOSR and are being used as indicators of air pollutants [31]. Copper and Zn are also on the US Environmental Protection Agency (EPA) list of priority pollutants. Phosphorus (P) is an essential nutrient for plant growth and P limitations in the boreal forest may be more widespread than previously thought and has been shown to increase with N additions. Thus, changes in P may affect forest health and in particular tree growth.
In 1998, a forest health monitoring program was established in the AOSR by the Wood Buffalo Environmental Association (WBEA), complementing the Terrestrial Environmental Effects Monitoring (TEEM) program, in order to identify air pollution effects on forest ecosystem health [31]. As part of this framework, foliar samples were collected from jack pine trees (Pinus banksiana Lamb.) at 19 different sites in the AOSR in 2011, spanning distances from 13 to 128 km to the major oil sands developments. The objectives were: (1) to identify differences in foliar chemistry for the main pollutants (C, N, S), base cations (Ca, Mg, Na), trace metal pollutants (Cu, Fe, Mn, Zn), and other essential nutrients (B, P), and if differences exist, to determine whether the differences are attributed to oil sands development that potentially modified the ecosystem health of jack pine forests; (2) to investigate differences in the nitrogen and carbon isotopic signatures in pine needles, and if they provide information of N and C sources; and (3) to investigate S stress in jack pine trees using the SO4-S to Sorg ratio.

2. Materials and Methods

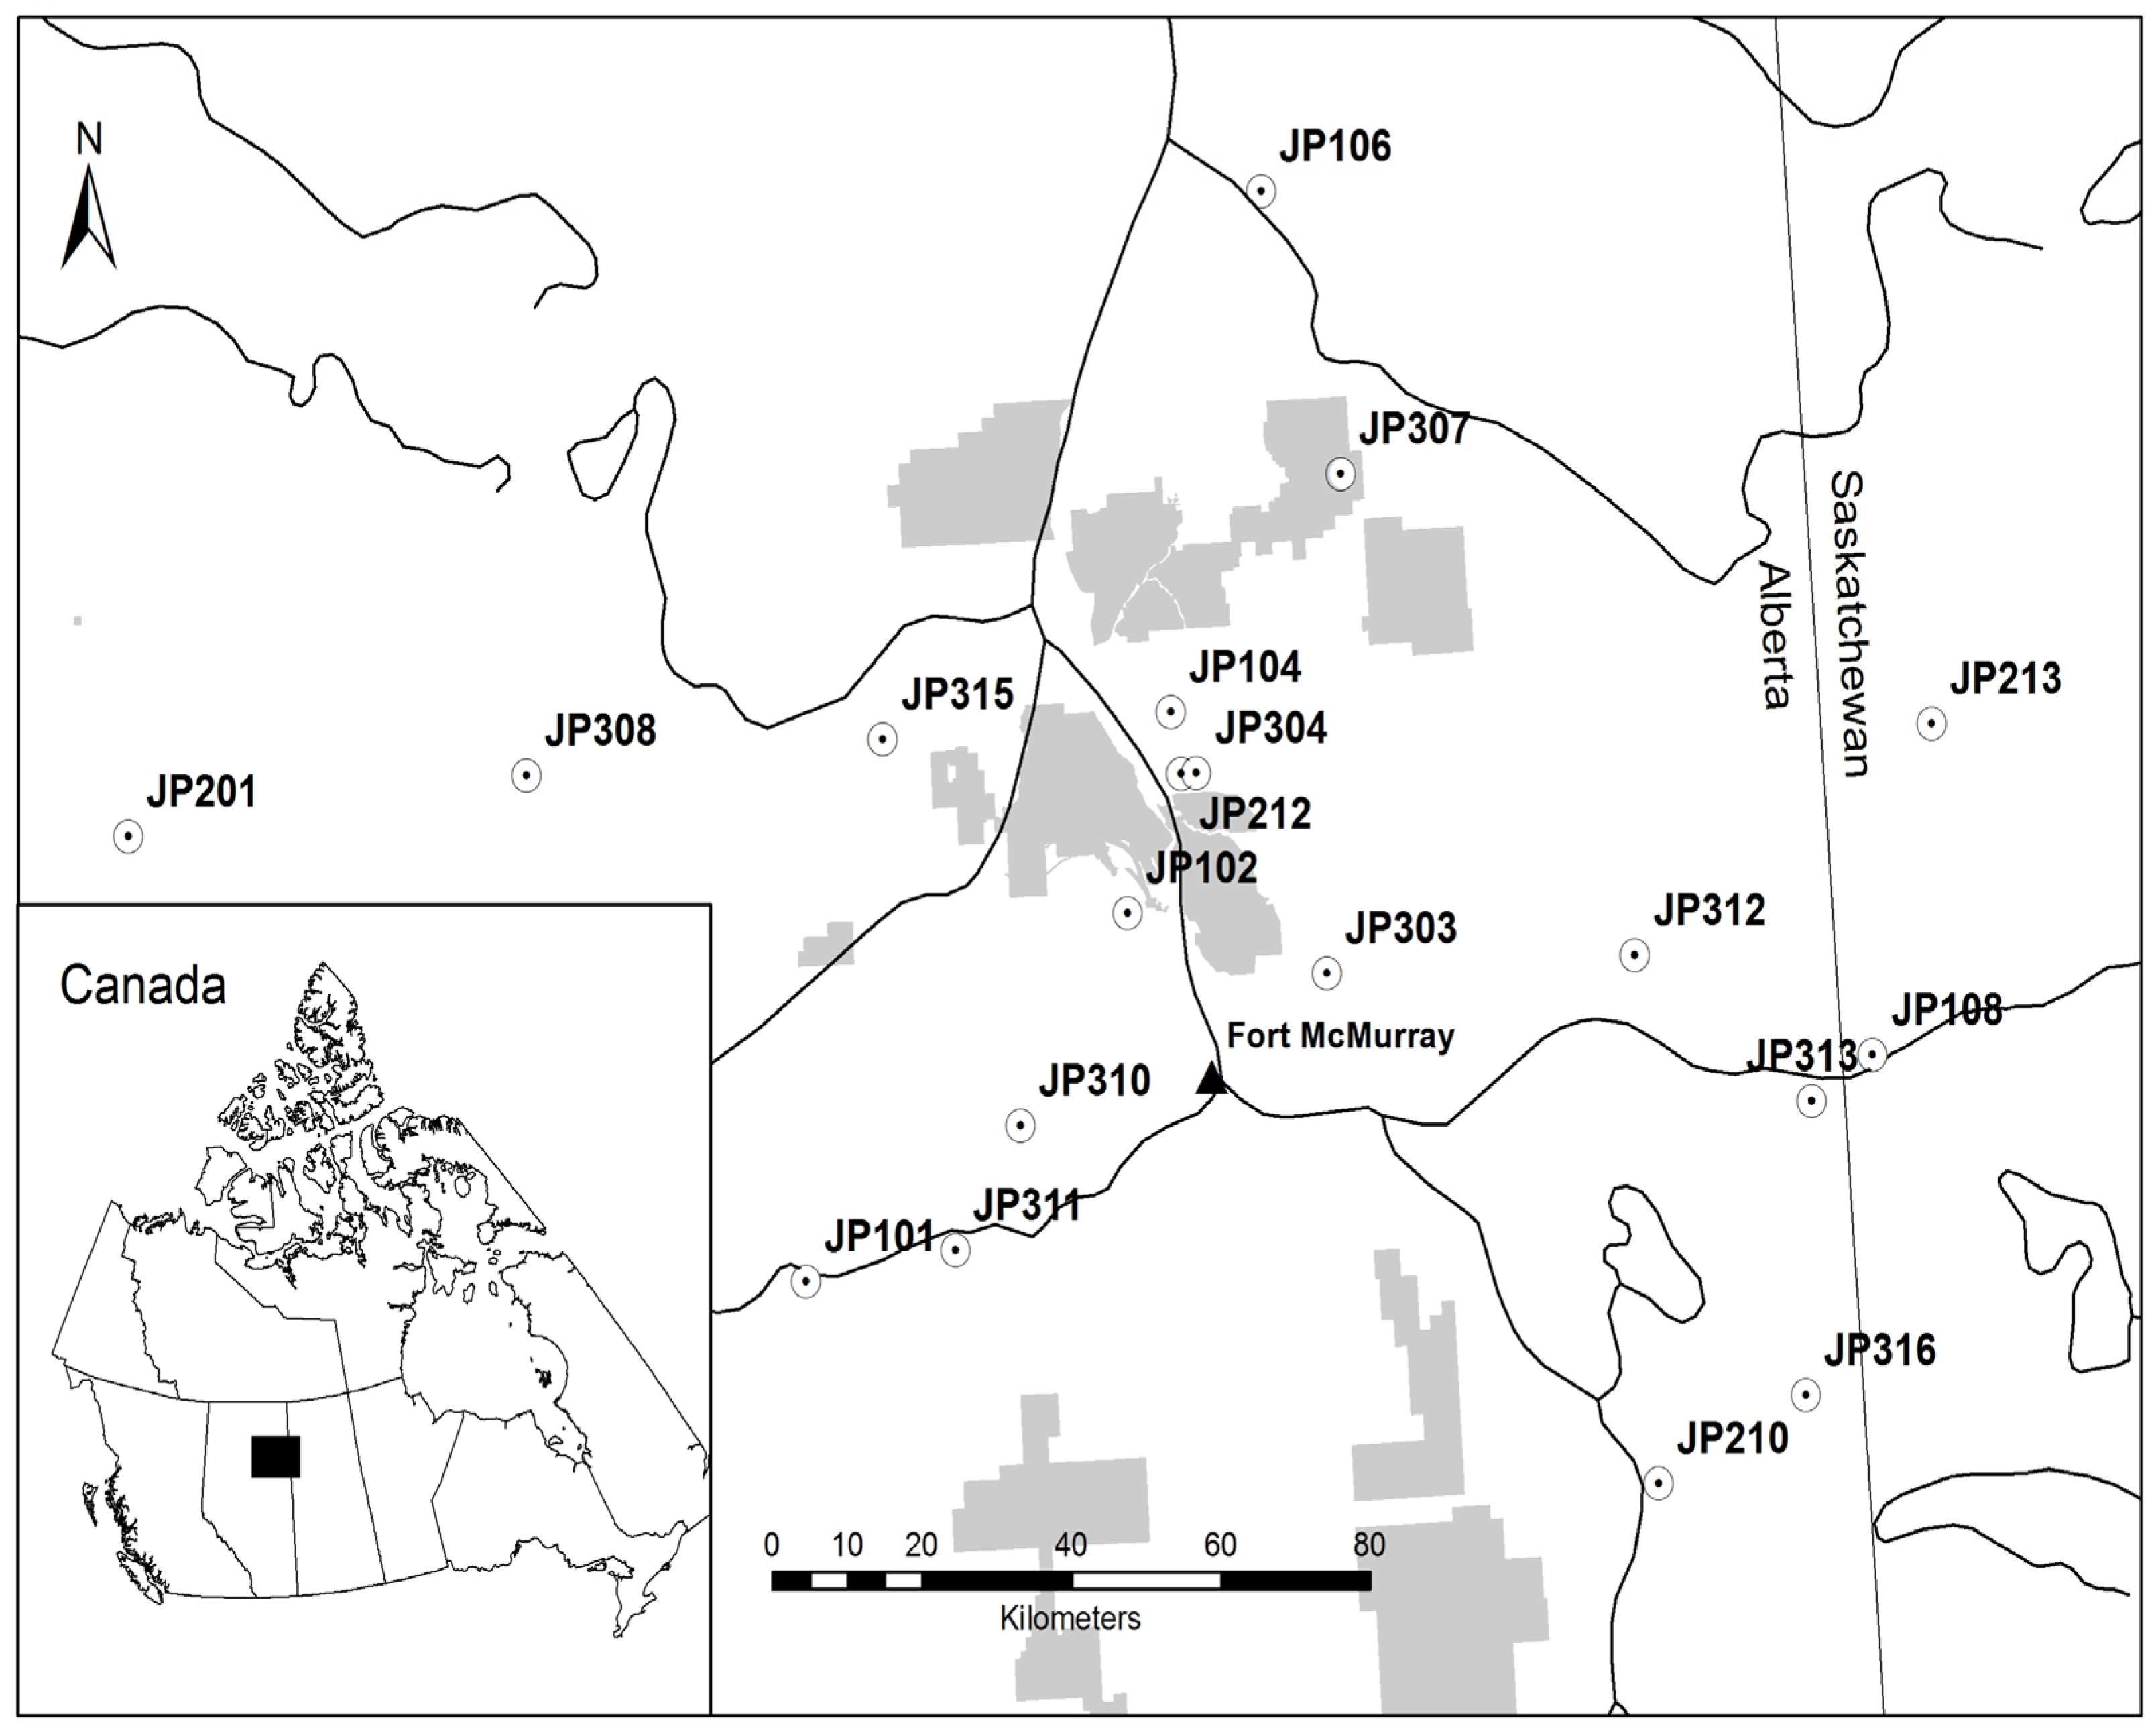
2.1. Site Selection and Foliage Sampling

The TEEM program established a rigorous sampling and site selection criteria protocol that identified ecological analogues with same soil, vegetation community, and orientation of sampling plot [32]. In 2011, the sampling design was updated resulting in a total of 25 sites suitable for foliage sampling [31,33]. Unfortunately, six sites burnt down during forest fires in summer 2011, leaving 19 sites for foliage collection for this study [34].
Foliar (needle) samples were collected in August/September 2011 before physiological changes due to autumn conditions occurred to allow for year-to-year comparison. Samples were collected at 19 sites (Figure 1) from five jack pine trees per plot resulting in five replicate samples for each of the three age classes and a total of 15 needle samples per sites. In addition, a duplicate set for each age class was obtained per site. Branches were clipped from the upper third of the canopy facing the regional emission sources and needles were identified for the current annual growth (CAG), year 1 (2010), and year 2 (2009) age classes. Distances between sampling sites and one of the major emission stacks nearest to site JP212 [35] ranged from 13 to 128 km. Prevailing winds in this region are from the West and Northwest [36]. The most distant site JP201 (128 km) and site JP106 (74 km) were therefore located upwind of the operations, whereas JP316 (119 km) and JP213 (113 km) represent the most distant sampling sites downwind of the operations (Figure 1).

2.2. Chemical and Isotopic Analyses

Samples were dried at 70 °C for 24 h and ground in a zirconium ball mill. Total carbon (TC), and nitrogen (TN), and sulfur (TS) were analyzed by dry combustion with a precision of 2%; (TN and TC by Costech 4010 elemental analyzer (Costech Analytical Technologies Inc., Valencia, CA 91355 – USA), and TS by Eltra Helios S analyzer (ELTRA GmbH, Haan, Germany). Other elements were analyzed by inductively coupled plasma optical emission spectrometry (ICP-OES) following microwave digestion with concentrated nitric acid at the Pacific Forest Centre Chemical Services Laboratory, Canada. These elements with their minimum quantification limits (MQL) in needles (mg·kg−1) were B (0.26), Ca (1.4), Cu (0.46), Fe (0.18), Mg (0.2), Mn (0.03), Na (1.5), P (2.1), S (2.8), and Zn (0.19). Foliar inorganic sulfur (as SO4-S) was determined by hydriodic acid digestion [37]. Organic S was determined by calculating the difference between TS and SO4-S.
Isotope abundance ratios are reported in the internationally accepted δ notation defined as
δsample(‰) = [(Rsample/Rstandard) − 1] × 1000,
where R is the 15N/14N or 13C/12C ratio of the sample and a standard respectively. The N isotopic composition (δ15N) of total nitrogen (TN) and the C isotopic composition (δ13C) of total carbon (TC) of the most recent (CAG, n = 109) foliage samples were determined using an elemental analyzer (EA, Costech 4010) interfaced with an isotope ratio mass spectrometer (IRMS, Finnigan MAT Delta + XL) at the Isotope Science Laboratory, University of Calgary, Canada. Samples loaded in tin cups were flash-combusted with an oxygen pulse in a column held at 1020 °C followed by purification on the generated measurement gases N2 and CO2 via gas chromatography (GC) and subsequent IRMS. The δ15N values are reported in per mille (‰) relative to atmospheric N2 (AIR), and δ13C values are reported in per mille (‰) relative to Vienna Pee Dee Belemnite (V-PDB). Accuracies and precisions of δ15N and δ13C values were ensured using the reference material USGS-40, USGS-41, NBS-22, USGS-32, and USGS-43. Precision and accuracy as 1 sigma of laboratory standards are ±0.2‰ for both δ15N and δ13C values.

2.3. Statistical Analysis and Predicted N and S Deposition Rates

Statistical analysis was performed using the free software R, and the presence of relationships was determined according to the Pearson correlation coefficient. Site averages and standard deviations were calculated for each element and needle year at each site, except for δ15N and δ13C values that were only determined for CAG needles. Correlation analysis was performed between individual elemental contents and needle age, but site averaged data was compared to distance and modeled N and S deposition rates to investigate the potential effect of industrial operations on a given site. Total N, S, and base cation (Ca2+, Mg2+, Na+) deposition data for each site were available from predictions of the CALMET/CALPUFF dispersion model for the Lower Athabasca Region. This model is an ambient air quality model that has been applied to the AOSR in order to assess the magnitude and spatial distribution of atmospheric deposition [1,34]. Measured deposition data in bulk deposition and throughfall (bulk deposition beneath the tree canopy) deposition has recently been published [13] but were not available for each sampling site, hence model predictions were used for comparison to foliar data.

3. Results

3.1. Elemental Composition of Pine Needles

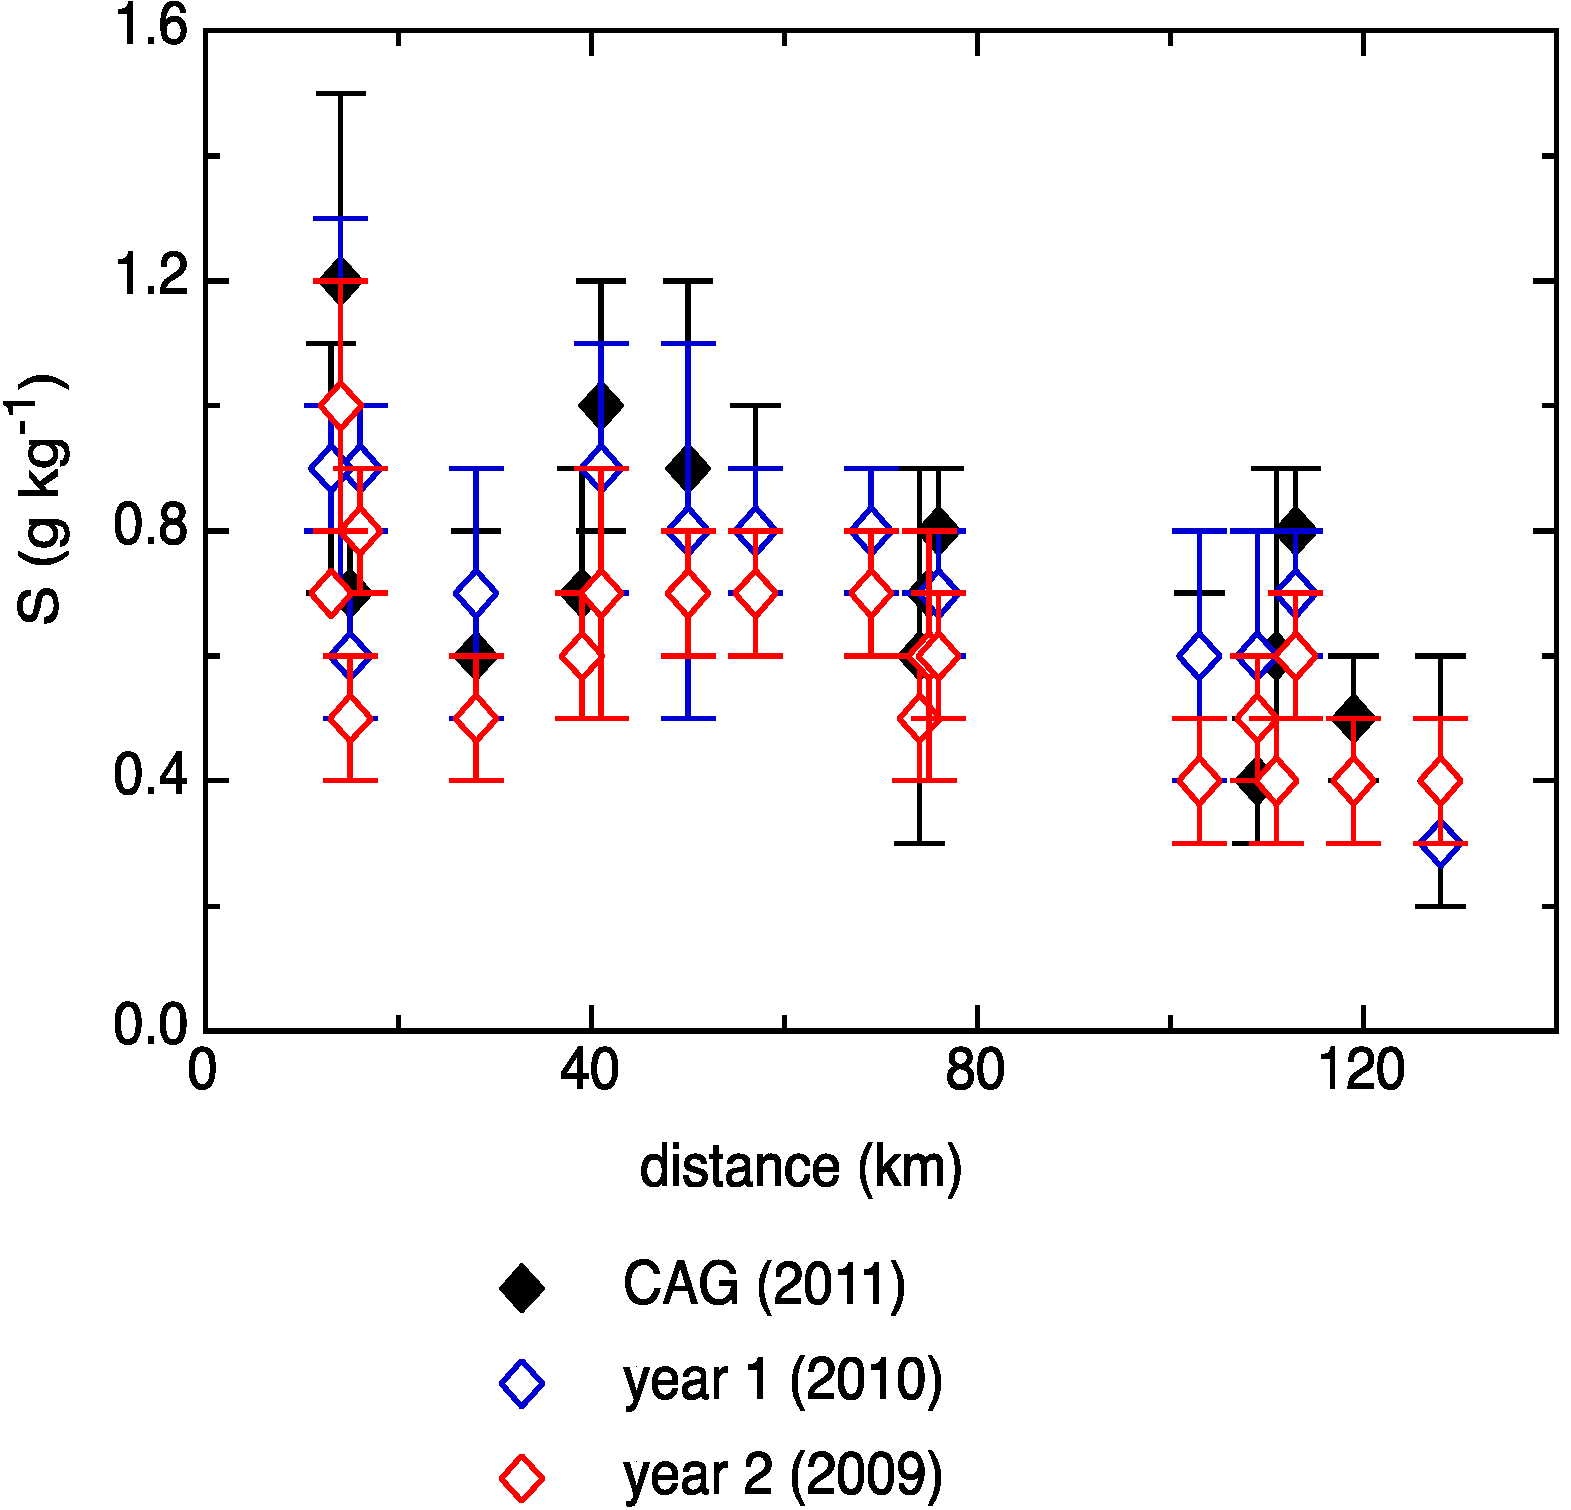
3.1.1. Carbon, Nitrogen, and Sulfur

Overall, carbon contents in pine needles ranged from 492 to 574 g·kg−1, with mean values of 527 ± 12 g·kg−1, 543 ± 13 g·kg−1, and 544 ± 11 g·kg−1, for CAG, year 1, and year 2 needles, respectively. There is a weak but significant trend towards higher TC values in year 2 needles (r = 0.48, p < 0.05). Site averaged C contents did not correlate with distance to the major industrial developments for any needle year. Only site averaged C contents for CAG needles showed a weak correlation with CALPUFF prediction N deposition rates (r = 0.47; p < 0.05), but not with S deposition rates. Total nitrogen contents varied between 7 and 18 g·kg−1 and showed only a weak negative correlation (r = −0.3; p < 0.05) with increasing needle age (mean values of 12 ± 2 g·kg−1, 12 ± 1 g·kg−1, and 11 ± 1 g·kg−1 for CAG, year 1, and year 2 needles, respectively). Site averaged N contents correlated significantly with predicted CALPUFF N deposition rates for all needles ages (r = 0.49, 0.61, and 0.50 for CAG, year 1, and year 2 needles, respectively; p < 0.05) and decreased significantly with distance to the major oil sands operations (r = −0.50, −0.66, and −0.67 for CAG, year 1, and year 2 needles, respectively; p < 0.05). Sulfur contents ranged from 0.1 g·kg−1 to 1.7 g·kg−1 without significant differences between needle ages (0.7 ± 0.0 g·kg−1, 0.7 ± 0.2 g·kg−1, and 0.6 ± 0.2 g·kg−1, respectively). Site averaged S contents correlated significantly with predicted CALPUFF S deposition rates for the Lower Athabasca Region (r = 0.58, 0.58, and 0.55 for CAG, year 1, and year 2 needles, respectively; p < 0.05), and decreased with distance to the main oil sands operations (r = −0.69, −0.74, −0.68 for CAG, year 1, and year 2 needles, respectively; p < 0.05, Figure 2).

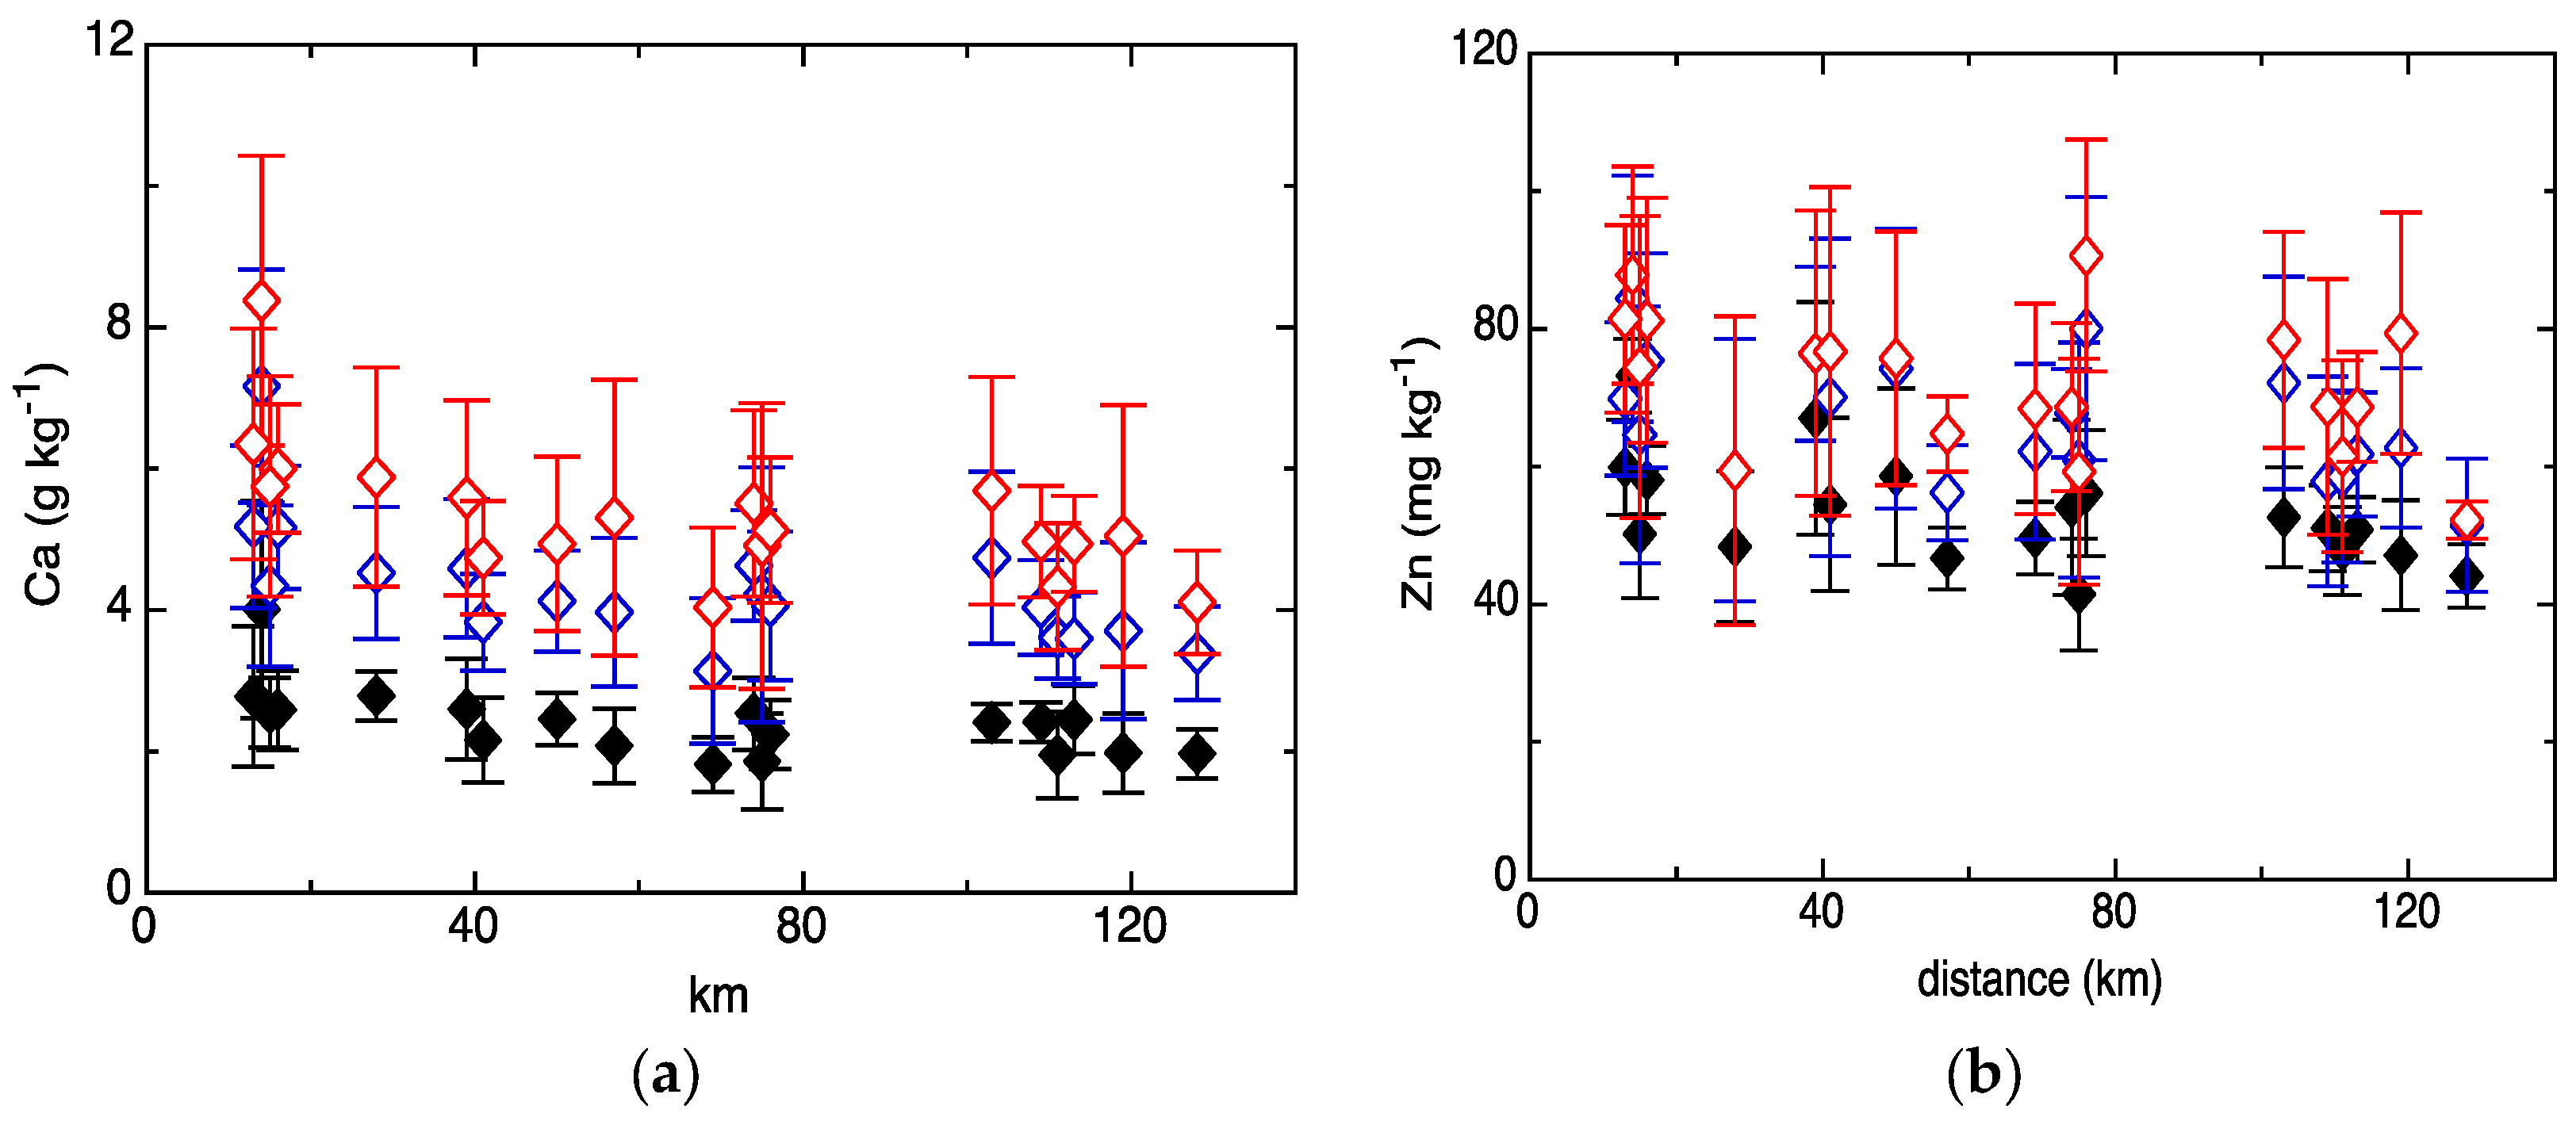
3.1.2. Base Cations (Ca, Mg, Na)

Considering all sampling sites, calcium concentrations increased with needle age from 2.40 ± 0.73 g·kg−1 (CAG), 4.35 ± 1.31 g·kg−1 (year 1), to 5.38 ± 1.58 g·kg−1 for year 2 needles (r = 0.69, but p = 0.06). Site averaged Ca concentrations decreased with distance (r = −0.59, r = −0.62, r = −0.64 for CAG, year 1, and year 2 needles; p < 0.05, Figure 3a). The highest site average of 4.01 ± 1.54 g·kg−1 was measured at JP104 (14 km), the lowest (1.82 ± 0.39 g·kg−1) at JP101 (69 km).
Magnesium concentrations decreased slightly with needle age (r = −0.27, p < 0.05), from 0.89 ± 0.16 g·kg−1 for CAG needles, 0.84 ± 0.19 g·kg−1 for year 1 needles, to 0.77 ± 0.19 g·kg−1 in year 2 needles. The highest site averaged CAG value was measured at JP212 (1.05 ± 0.17 g·kg−1, 13 km), and the lowest at JP308 (0.71 ± 0.12 g·kg−1, 75 km), but there was no significant correlation with distance.
Sodium concentrations did not correlate with needle age, averaging 9.6 ± 7.7 mg·kg−1, 12.3 ± 11.0 mg·kg−1, and 11.1 ± 8.4 mg·kg−1 for CAG, year 1, and year 2 needles, respectively. Site averaged Na contents did not correlate with distance for any of the needle ages.

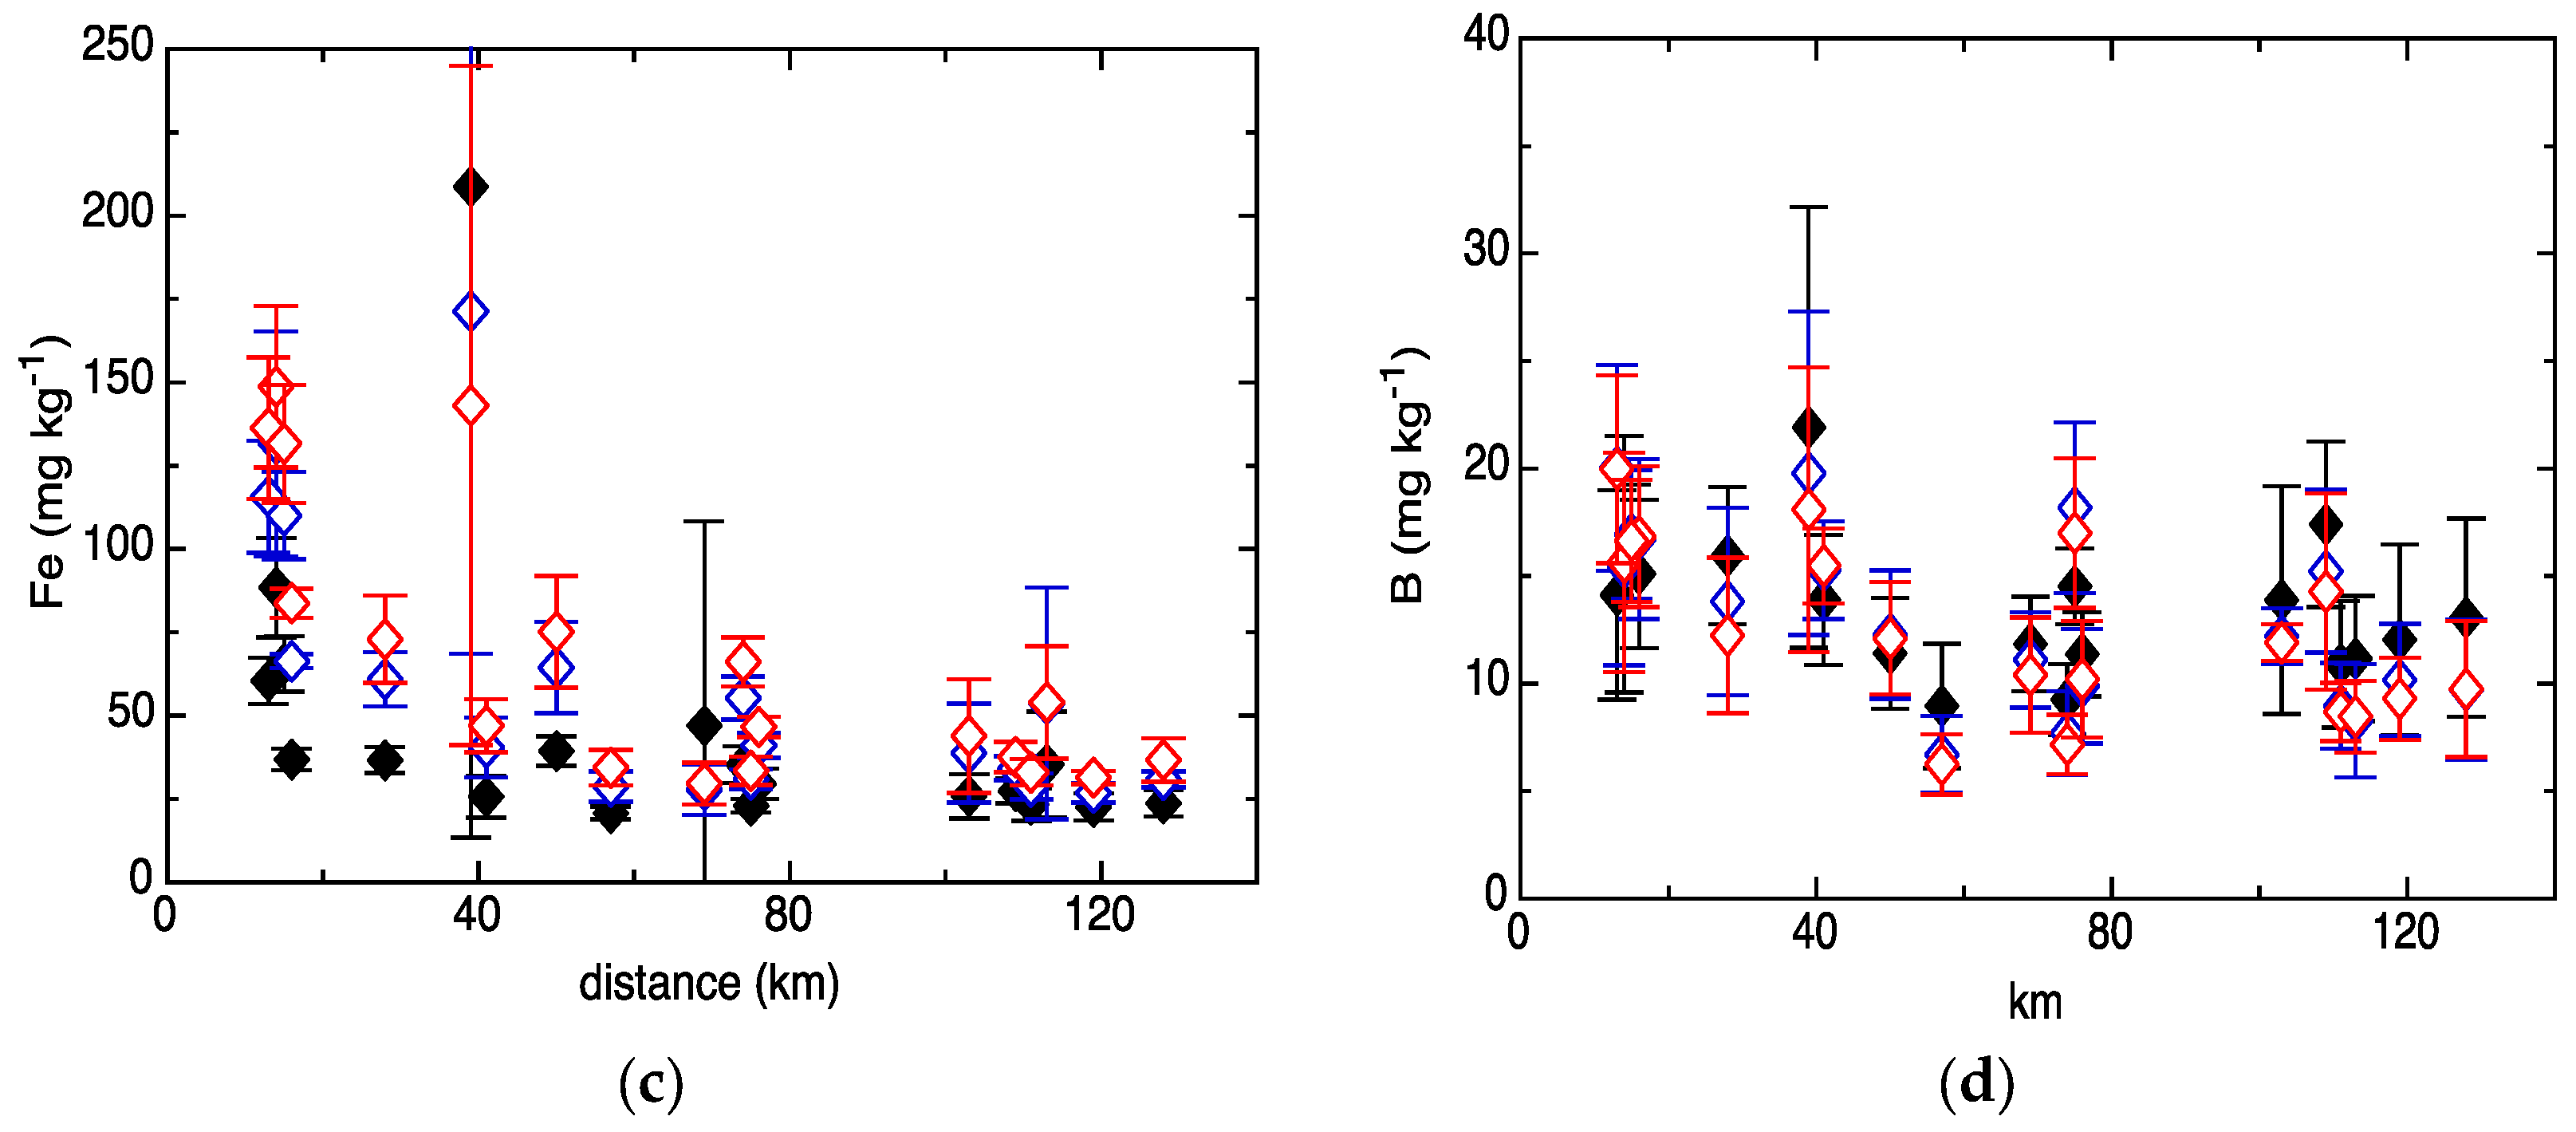
3.1.3. Other Elements (B, Cu, Fe, Mn, P, Zn)

Overall, elemental contents of boron, copper, iron, manganese, phosphorus, and zinc followed the order of P > Mn > Zn > Fe > B > Cu. Phosphorus contents did not vary significantly between needle age (1.2 ± 0.1 g·kg−1, 1.0 ± 0.1 g·kg−1, and 0.9 ± 0.1 g·kg−1 for CAG, year 1, and year 2, respectively) and did not correlate with distance to the oil sands operations. Manganese also did not correlate with distance, but increased with needle age from 631 ± 252 mg·kg−1 for CAG, 1127 ± 470 mg·kg−1 for year 1, to 1359 ± 544 mg·kg−1 for year 2 needles. Zinc contents averaged 53.2 ± 11.0 mg·kg−1 for CAG, 67.5 ± 16.5 mg·kg−1 for year 1, and 73.1 ± 17.7 mg·kg−1 for year 2 needles. Site averaged Zn contents decreased significantly with increasing distance for CAG and year 1 needles (r = −0.57 and −0.54; p < 0.05; Figure 3b). Iron concentrations increased with needle age from 45.1 ± 55.8 mg·kg−1 (CAG), to 60.3 ± 45.9 mg·kg−1 (year 1) to 67.8 ± 46.8 mg·kg−1 (year 2). Site averaged year 1 and year 2 Fe contents correlated significantly with distance (r = −0.67 and −0.75; p < 0.05; Figure 3c).
Boron contents ranged from 4.1 to 40.2 mg·kg−1 with the highest value reported for CAG needles. Boron contents averaged 13.5 ± 4.7 mg·kg−1 for CAG, 12.9 ± 5.1 mg·kg−1 for year 1, and 12.5 ± 4.9 mg·kg−1 for year 2 needles. Similar to Fe, only year 1 and year 2 needles correlated significantly with distance, with r = −0.62 and −0.64, respectively (p < 0.05; Figure 3d).
Copper contents were low among all needle ages: 5.7 ± 6.7 mg·kg−1 (CAG), 4.3 ± 4.4 mg·kg−1 (year 1), and 4.4 ± 4.8 mg·kg−1 (year 2). Site averaged Cu contents did not correlate with distance for any of the needles ages.

3.2. N and C Isotopic Compositions of Pine Needles

The nitrogen isotopic composition (δ15N) of CAG pine needles ranged from −5.9‰ to 1.3‰ (Figure 4a,b). Plotting isotopic compositions versus the inverse concentration data reveals whether isotopic compositions can be explained by mixing of two or more sources. However, there was no trend of δ15N values with the inverse TN content (Figure 4a), nor with distance to the main industrial emission sources (Figure 4b) The carbon isotopic composition (δ13C) of CAG needles ranged from −29.8‰ to −26.7‰ (Figure 4c,d). Again, no significant trend was observed between δ13C values and the inverse TC content or distance (Figure 4c,d). Neither δ15N nor δ13C values of CAG needles correlated with CALPUFF predicted atmospheric deposition of N and S for the Lower Athabasca Region.

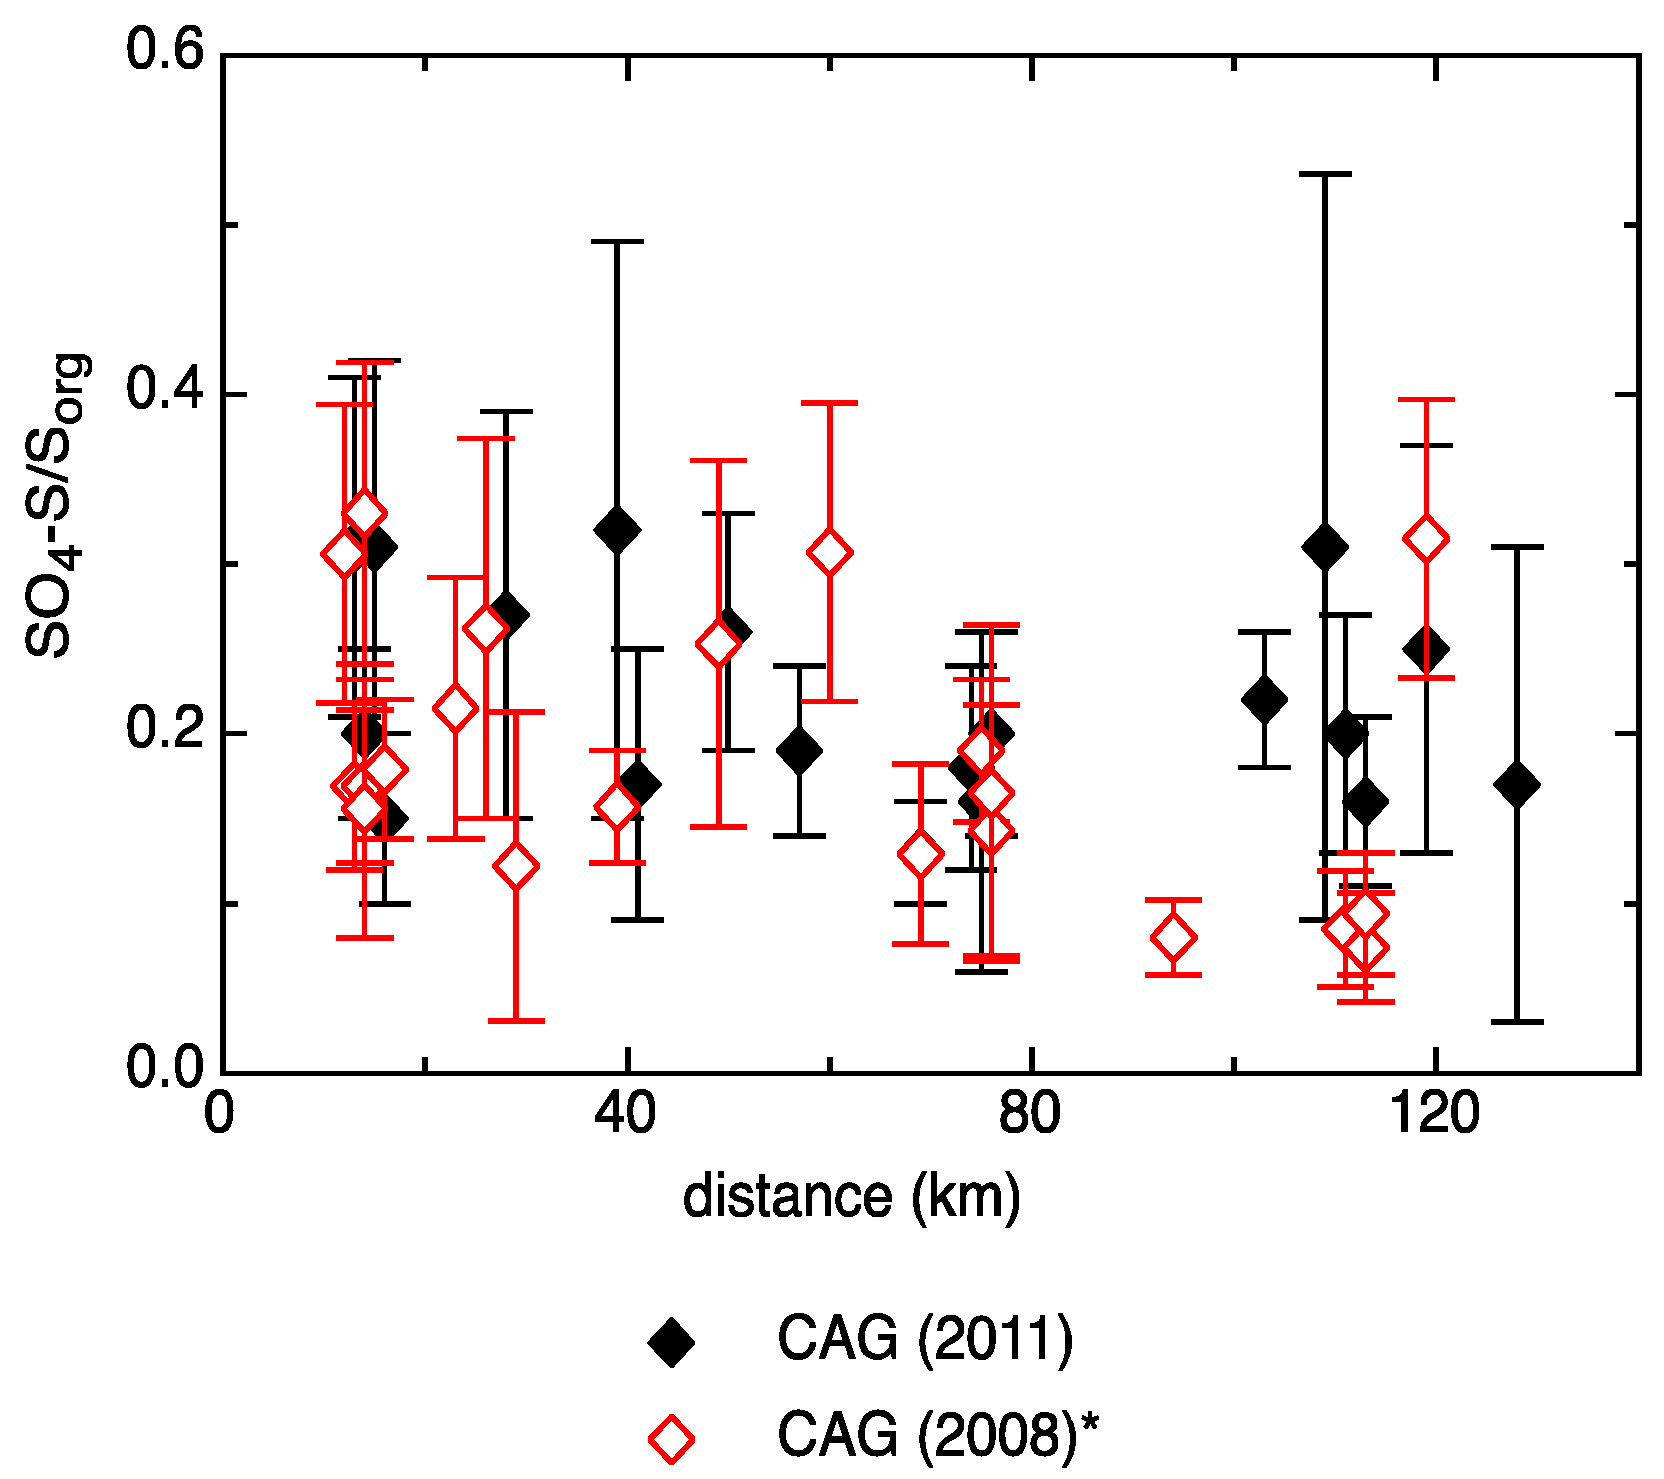
3.3. SO4-S/Sorg Ratios in Pine Needles

Site averaged ratios of SO4-S over Sorg in jack pine samples ranged from 0.13 ± 0.03 to 0.32 ± 0.17, 0.09 ± 0.06 to 0.30 ± 0.22, and 0.06 ± 0.03 to 0.18 ± 0.05 for CAG, year 1, and year 2 needles, respectively. The highest site averaged SO4-S/Sorg ratios were observed in CAG needles at JP303 (0.32 ± 0.17, 39 km). Site averaged SO4-S/Sorg ratios for each needle year did not correlate significantly with CALPUFF predicted S deposition rates for the Lower Athabasca Region. Site averaged ratios for all three needle ages did also not correlate significantly with distance (Figure 5).

4. Discussion

Carbon contents in jack pine needles in the vicinity of the Athabasca oil sands operations ranged from 492 to 574 g·kg−1, and are similar to C contents reported for conifers [38]. The lowest site averaged CAG C content was measured at JP310 (508 g·kg−1), which is 41 km south-west of the oil sands operations and Fort McMurray. The highest average CAG C content (548 g·kg−1) was measured at JP102 in direct proximity (16 km) of the main operators. The carbon isotopic composition in tree rings and foliage samples has been suggested as an indicator of the regional extent of pollution [16,17]. However, neither C nor δ13C values correlated strongly with distance to the major industrial developments or with CALPUFF predicted S and N deposition rates. The carbon cycling in jack pine needles therefore appears to be unaffected by any potential environmental impacts of industrial emissions.
Total N contents increased from 10.2 g·kg−1 (CAG) at the most distant site (JP201, 128 km) towards higher values with decreasing distance to the oil sand operations (to 14.0 g·kg−1 at JP104, 14 km) and correlated with modeled N deposition data, suggesting that N contents in pine foliage is affected by oil sands emissions. δ15N values in CAG needles are similar to those previously reported for the AOSR (Table 1) and did not show a trend with distance or total N content (Figure 4a,b). There was no evidence for high δ15N values of foliar TN as observed for nitrate or ammonium of PM2.5 and atmospheric nitrate and ammonium deposition in close proximity to the oil sands operations as an indicator of industrial emissions [22,23], or as previously demonstrated for the lichen Evernia mesomorpha in close proximity (3 km) to one of the emission stacks [24]. δ15N values of summer atmospheric nitrate and ammonium deposition in the AOSR at background deposition levels were −3.2‰ ± 1.5‰ and −3.6‰ ± 0.9‰, respectively [22], similar to δ15N values observed in total nitrogen of CAG needles. This suggests that these jack pine stands are N-limited and all available N is taken up by vegetation, allowing little or no room for N isotope fractionation [39]. However, no δ15N values of gaseous NOx emissions (including vehicle emissions) are known for the AOSR, but may constitute a major source of nitrogen for conifer needles [40].
The total sulfur contents in jack pine needles were similar to total S contents in spruce and pine needles observed in northern conifer stands in Finland [40]. Younger leaves are more sensitive to atmospheric SO2 concentrations compared to older ones [25], as reflected by slightly higher (SO4-S)/(Sorg) ratios in younger pine needles (Table 2). Jaques and Legge [33] determined the following (SO4-S)/(Sorg) ratios indicative for certain sulfur loading levels in the AOSR: <0.12: background levels; 0.12–0.19: low levels; 0.19–0.25: moderate levels; 0.25–0.35: moderately high levels; 0.35–0.45: high levels; and >0.45: very high levels of S loading. According to this classification, none of the sites are indicative of high levels or very high levels, but also none of the CAG needles were representative of what is considered background levels for S loading. Seven of the sites show moderately high levels, six sites moderate levels and the remainder are indicative of low levels of S loading (Table 2). Although none of the sites show (SO4-S)/(Sorg) ratios of environmental concern, the increase of TS towards the emission sources demonstrates that industrial S is taken up by jack pine stands. (SO4-S)/(Sorg) ratios reported for 2008 CAG jack pine needles [24] were in the same range as the 2011 CAG ratios found in this study (Figure 5), demonstrating no recent changes. We conclude that the investigated jack pine stands in the AOSR show currently no significant signs of sulfur stress resulting from elevated sulfur loadings and deposition rates as demonstrated by generally low to moderate (SO4-S)/(Sorg) ratios, but that further monitoring is warranted.
Calcium concentrations in the CAG jack pine foliage increased with decreasing distance to the oil sands operations for all needle ages (r = −0.59, r = −0.62, r = −0.64 for CAG, year 1, and year 2 needles; p < 0.05). There was a linear correlation to the CALPUFF predicted base cation throughfall deposition [34] (CAG: r = 0.66, p < 0.05); however, concentrations were still within the natural range of variation for Ca CAG jack pine foliage in western Canada (Table 3). Magnesium and Na concentrations did not vary with distance from the oil sands operation and were within the range of natural variation found in jack pine foliage in western Canada (Table 3). Watmough et al. [12] found that base cation deposition was dominated by Ca, likely from fugitive dust sources from mining sites, and suggested that effects of acid inputs (N and S) may have been offset by relatively high base cation deposition at the sites within 20 km of the oil sands operation.
Other elemental concentrations in jack pine foliage decreased following the trend P > Mn > Zn > Fe > B > Cu. Lynam et al. (2015) reported elevated crustal element concentrations of Mn, Fe, and Mg in rainfall for Air Monitoring Station (AMS) “6” at 30 km to the nearest upgrading facility in the AOSR [42]. However, only iron showed elevated levels (>50 mg·kg−1) in CAG needles at sites <15 km (JP212, JP104, JP304) and JP303 at 39 km downwind of the main oil sand operations. Cu contents are significantly lower compared to jack pine needles from smelter contaminated sites in Ontario [43], but slightly higher than at two control sites (unpolluted) from the same study (3.1 and 3.4 mg·kg−1, Table 3). In general, Cu contents were lower or near the deficiency threshold of 4 mg·kg−1 used for current foliage [44]. However, the two sites closest to the oil sands operations, JP104 and JP212, showed Cu contents >16 mg·kg−1. Fe contents in jack pine needles from the same study [43] are significantly higher, including control sites, however, Mn and Zn contents in jack pine foliage in the AOSR were typically higher compared to their study (Table 3). The significant increase in B concentrations with proximity to the oil sands operations suggests a higher availability of B, however, no B emission or deposition data is available for the AOSR.
In general, elemental concentrations measured in jack pine foliage at sites >15 km distance to the oil sands operations were within the natural range of variability for jack pine foliage in western Canada (Table 3). Only sites <15 km appeared to be affected by industrial emissions, particularly site JP104 that had the highest levels of acid and base cation deposition (CALPUFF). Current foliage had elevated (highest concentration) of Cu, Mn, and Zn at JP104. This site was 14 km from the two main oil sands operations and also had the highest TN and TS contents in CAG foliage (14.0 ± 2.2 g·kg−1 and 1.2 ± 0.3 g·kg−1 respectively), which is in agreement with the highest CALPUFF level of acid input of the monitored sites. This indicates that atmospheric deposition from the oil sands operations affect jack pine foliar chemistry at this site.

5. Conclusions

This study investigates the elemental composition of three needle ages of jack pine foliage in the Athabasca Oil Sands Region. Of all elements analyzed, TS, TN, Ca, B, Zn, and Fe contents showed significant increases with proximity to the major oil sands operations. TN and TS correlate with CALPUFF N and S deposition rates for the Lower Athabasca Region, demonstrating that TN and TS in jack pine foliage reflect increases in N and S deposition rates near the oil sands operations. Increases in Ca contents in jack pine foliage is likely derived from fugitive dust sources from open pit mining operations. Year-to-year comparison of jack pine needles did not reveal remarkable increases in any pollutant from the year 2009 to 2011.
Neither δ15N nor δ13C, despite their widespread use in tree ring studies to identify atmospheric changes, showed any evidence of impact of industrial emissions at any of the sites. (SO4-S)/(Sorg) ratios were not indicative of high or very high S loadings, but were also not at background levels across the study area. Our results are in agreement with other studies that investigated the effect of emissions by oil sands operations in the AOSR [4,22,47]. However, these studies typically lack sites within 10 km distance to the main oil sands operators, and we therefore suggest that future studies on foliage chemistry in the AOSR include sites in close proximity to the emitters.

Acknowledgments

This study was funded by the Wood Buffalo Environmental Association (WBEA), the Natural Sciences and Engineering Research Council of Canada (NSERC CRDPJ 372151-08), and the Canada School for Energy and the Environment (CSEE). We thank the staff of WBEA for the assistance in project coordination and obtaining samples. We also thank Stephen Taylor and the staff from the Isotope Science Laboratory (ISL) at the University of Calgary for their help with δ15N and δ13C analyses, and Dave Dunn, Rebecca Dixon, and Grace Ross of the Pacific Forestry Centre for foliar chemical analysis.

Author Contributions

D.G.M., B.M., and B.C.P. conceived and designed the experiments; D.G.M. and B.C.P. performed the experiments and analyses; all authors analyzed the data and contributed to writing the paper.

Conflicts of Interest

The authors declare no conflict of interest. The Wood Buffalo Environmental Association (WBEA) funded this study and coordinated field work, study design, and sample collection.

References

  1. Davies, M.J.E. Air quality modeling in the Athabasca Oil Sands Region. In Alberta Oil Sands: Energy, Industry and the Environment; Percy, K.E., Ed.; Elsevier: Amsterdam, The Netherlands, 2013; pp. 267–309. [Google Scholar]
  2. Galloway, J.; Townsend, A.; Erisman, J.; Bekunda, M.; Cai, Z.; Freney, J.; Martinelli, L.; Seitzinger, S.; Sutton, M. Transformation of the nitrogen cycle: Recent trends, questions, and potential solutions. Science 2008, 320, 889–892. [Google Scholar] [CrossRef] [PubMed]
  3. Gruber, N.; Galloway, J.N. An Earth-system perspective of the global nitrogen cycle. Nature 2008, 451, 293–296. [Google Scholar] [CrossRef] [PubMed]
  4. Laxton, D.L.; Watmough, S.A.; Aherne, J. Nitrogen cycling in Pinus banksiana and Populus tremuloides stands in the Athabasca oil sands region, Alberta, Canada. Water Air Soil Pollut. 2012, 223, 1–13. [Google Scholar] [CrossRef]
  5. Jung, K.; Chang, S.X. Four years of simulated N and S depositions did not cause N saturation in a mixedwood boreal forest ecosystem in the oil sands region in northern Alberta, Canada. For. Ecol. Manag. 2012, 280, 62–70. [Google Scholar] [CrossRef]
  6. Jung, K.; Chang, S.X.; Arshad, M.A.C. Effects of canopy-deposition interaction on H+ supply to soils in Pinus banksiana and Populus tremuloides ecosystems in the Athabasca oil sands region in Alberta, Canada. Environ. Pollut. 2011, 159, 1327–1333. [Google Scholar] [CrossRef] [PubMed]
  7. Cheng, Y.; Cai, Z.-C.; Zhang, J.-B.; Chang, S.X. Gross N transformations were little affected by 4 years of simulated N and S depositions in an aspen-white spruce dominated boreal forest in Alberta, Canada. For. Ecol. Manag. 2011, 262, 571–578. [Google Scholar] [CrossRef]
  8. Ok, Y.; Chang, S.X.; Feng, Y.S. Sensitivity to acidification of forest soils in two watersheds with contrasting hydrological regimes in the oil sands region of Alberta. Pedosphere 2007, 17, 747–757. [Google Scholar] [CrossRef]
  9. Whitfield, C.; Aherne, J.; Watmough, S. Modeling soil acidification in the Athabasca oil sands region, Alberta, Canada. Environ. Sci. Technol. 2009, 43, 5844–5850. [Google Scholar] [CrossRef] [PubMed]
  10. Wieder, R.; Vitt, D.; Burke-Scoll, M.; Scott, K.; House, M.; Vile, M. Nitrogen and sulphur deposition and the growth of Sphagnum fuscum in bogs of the Athabasca Oil Sands Region, Alberta. J. Limnol. 2010, 69, 161–170. [Google Scholar] [CrossRef]
  11. Whitfield, C.; Aherne, J.; Watmough, S.; McDonald, M. Estimating the sensitivity of forest soils to acid deposition in the Athabasca Oil Sands Region, Alberta. J. Limnol. 2010, 69, 201–208. [Google Scholar] [CrossRef]
  12. Watmough, S.A.; Whitfield, C.J.; Fenn, M.E. The importance of atmospheric base cation deposition for preventing soil acidification in the Athabasca Oil Sands Region of Canada. Sci. Total Environ. 2014, 493, 1–11. [Google Scholar] [CrossRef] [PubMed]
  13. Fenn, M.E.; Bytnerowicz, A.; Schilling, S.L.; Ross, C.S. Atmospheric deposition of nitrogen, sulfur and base cations in jack pine stands in the Athabasca Oil Sands Region, Alberta, Canada. Environ. Pollut. 2015, 196, 497–510. [Google Scholar] [CrossRef] [PubMed]
  14. Ammann, M.; Siegwolf, R.; Pichlmayer, F.; Suter, M.; Saurer, M.; Brunold, C. Estimating the uptake of traffic-derived NO2 from 15N abundance in Norway spruce needles. Oecologia 1999, 118, 124–131. [Google Scholar] [CrossRef]
  15. Poulson, S.R.; Chamberlain, C.P.; Friedland, A.J. Nitrogen isotope variation of tree rings as a potential indicator of environmental change. Chem. Geol. 1995, 125, 307–315. [Google Scholar] [CrossRef]
  16. Savard, M.M. Tree-ring stable isotopes and historical perspectives on pollution—An overview. Environ. Pollut. 2010, 158, 2007–2013. [Google Scholar] [CrossRef] [PubMed]
  17. Bukata, A.R.; Kyser, T.K. Carbon and nitrogen isotope variations in tree-rings as records of perturbations in regional carbon and nitrogen cycles. Environ. Sci. Technol. 2007, 41, 1331–1338. [Google Scholar] [CrossRef] [PubMed]
  18. Kendall, C. Tracing nitrogen sources and cycling in catchments. In Isotope Tracers in Catchment Hydrology; Kendall, C., McDonnell, J., Eds.; Elsevier: Amsterdam, The Netherlands, 1998; pp. 519–576. [Google Scholar]
  19. Moore, H. The isotopic composition of ammonia, nitrogen dioxide and nitrate in the atmosphere. Atmos. Environ. 1977, 11, 1239–1243. [Google Scholar] [CrossRef]
  20. Garten, C.T., Jr. Nitrogen isotope composition of ammonium and nitrate in bulk precipitation and forest throughfall. Int. J. Environ. Anal. Chem. 1992, 47, 33–45. [Google Scholar] [CrossRef]
  21. Heaton, T. 15N/14N ratios of NOx from vehicle engines and coal-fired power stations. Tellus 1990, 42, 304–307. [Google Scholar] [CrossRef]
  22. Proemse, B.C.; Mayer, B.; Fenn, M.E.; Ross, C.S. A multi-isotope approach for estimating industrial contributions to atmospheric nitrogen deposition in the Athabasca oil sands region in Alberta, Canada. Environ. Pollut. 2013, 182, 80–91. [Google Scholar] [CrossRef] [PubMed]
  23. Proemse, B.C.; Mayer, B.; Chow, J.C.; Watson, J.G. Isotopic characterization of nitrate, ammonium and sulfate in stack PM2.5 emissions in the Athabasca oil sands region, Alberta, Canada. Atmos. Environ. 2012, 60, 555–563. [Google Scholar] [CrossRef]
  24. Proemse, B.C.; Mayer, B. Tracing industrial nitrogen and sulfur emissions in the Athabasca Oil Sands Region using stable isotopes. In Alberta Oil Sands: Energy, Industry and the Environment; Percy, K.E., Ed.; Elsevier: Amsterdam, The Netherlands, 2013; pp. 243–266. [Google Scholar]
  25. Kozlowski, T. Impacts of air pollution on forest ecosystems. BioScience 1980, 30, 88–93. [Google Scholar] [CrossRef]
  26. Cape, J. Plants as accumulators of atmospheric emissions. In Air Quality and Ecological Impacts: Relating Sources to Effects; Legge, A., Ed.; Elsevier: Amsterdam, The Netherlands, 2009; pp. 61–98. [Google Scholar]
  27. Manninen, S.; Huttunen, S.; Torvela, H. Needle and lichen sulphur analyses on two industrial gradients. Water Air Soil Pollut. 1991, 59, 153–163. [Google Scholar] [CrossRef]
  28. Kaiser, W.; Dittrich, A.; Heber, U. Sulfate concentrations in Norway spruce needles in relation to atmospheric SO2: A comparison of trees from various forests in Germany with trees fumigated with SO2 in growth chambers. Tree Physiol. 1993, 12, 1–13. [Google Scholar] [CrossRef] [PubMed]
  29. Tausz, M. Sulfur in Forest Ecosystems. In Sulfur in Plants. An Ecological Perspective; Hawkesford, M., De Kok, L., Eds.; Springer: Berlin/Heidelberg, Germany, 2007; Volume 6, pp. 59–75. [Google Scholar]
  30. Legge, A.; Bogner, J.; Krupa, S. Foliar Sulphur Species in Pine: A New Indicator of a Forest Ecosystem under Air Pollution Stress. Environ. Pollut. 1988, 55, 15–27. [Google Scholar] [CrossRef]
  31. Percy, K.E.; Maynard, D.G.; Legge, A.H. Applying the forest health approach to monitoring boreal ecosystems in the Athabasca Oil Sands Region. In Alberta Oil Sands: Energy, Industry and the Environment; Percy, K.E., Ed.; Elsevier: Amsterdam, The Netherlands, 2013; Volume 11, pp. 193–217. [Google Scholar]
  32. Amec Foster Wheeler. Jack Pine Acid Deposition Monitoring Network Site Selection 2000; Wood Buffalo Environmental Association: Fort McMurray, AB, Canada, 2001; pp. 1–51. [Google Scholar]
  33. Jaques, D.R.; Legge, A.H. Ecological analogues for biomonitoring industrial sulfur emissions in the Athabasca Oil Sands Region, Alberta, Canada. In Alberta Oil Sands: Energy, Industry and the Environment; Percy, K.E., Ed.; Elsevier: Amsterdam, The Netherlands, 2013; Volume 11, pp. 219–241. [Google Scholar]
  34. Clair, T.A.; Percy, K.E. Assessing Forest Health in the Athabasca Oil Sands Region; WBEA Report # 2015-05-25; Wood Buffalo Environmental Association: Fort McMurray, AB, Canada, 2015; pp. 1–209. [Google Scholar]
  35. Proemse, B.C.; Mayer, B.; Fenn, M.E. Tracing industrial sulfur contributions to atmospheric sulfate deposition in the Athabasca oil sands region, Alberta, Canada. Appl. Geochem. 2012, 27, 2425–2434. [Google Scholar] [CrossRef]
  36. Sandhu, H.; Blower, L. Acid-forming emissions in Alberta, Canada. Environ. Manag. 1986, 10, 689–695. [Google Scholar] [CrossRef]
  37. Johnson, C.; Nishita, H. Microestimation of sulfur in plant materials, soils, and irrigation waters. Anal. Chem. 1952, 24, 736–742. [Google Scholar] [CrossRef]
  38. Thomas, S.C.; Martin, A.R. Carbon Content of Tree Tissues: A Synthesis. Forests 2012, 3, 332–352. [Google Scholar] [CrossRef]
  39. Högberg, P.; Högberg, M.N.; Quist, M.E.; Ekblad, A.; Näsholm, T. Nitrogen isotope fractionation during nitrogen uptake by ectomycorrhizal and non-mycorrhizal Pinus sylvestris. New Phytol. 1999, 142, 569–576. [Google Scholar] [CrossRef]
  40. Manninen, S.; Huttunen, S. Response of needle sulphur and nitrogen concentrations of Scots pine versus Norway spruce to SO2 and NO2. Environ. Pollut. 2000, 107, 421–436. [Google Scholar] [CrossRef]
  41. Laxton, D.; Watmough, S.; Aherne, J.; Straker, J. An assessment of nitrogen saturation in Pinus banksiana plots in the Athabasca Oil Sands Region, Alberta. J. Limnol. 2010, 69, 171–180. [Google Scholar] [CrossRef]
  42. Lynam, M.M.; Dvonch, J.T.; Barres, J.A.; Morishita, M.; Legge, A.; Percy, K. Oil sands development and its impact on atmospheric wet deposition of air pollutants to the Athabasca Oil Sands Region, Alberta, Canada. Environ. Pollut. 2015, 206, 469–478. [Google Scholar] [CrossRef] [PubMed]
  43. Gratton, W.S.; Nkongolo, K.K.; Spiers, G.A. Heavy metal accumulation in soil and jack pine (Pinus banksiana) needles in Sudbury, Ontario, Canada. Bull. Environ. Contam. Toxicol. 2000, 64, 550–557. [Google Scholar] [CrossRef] [PubMed]
  44. Ballard, T.M.; Carter, R.E. Evaluating Forest Stand Nutrient Status; BC Ministry of Forests: Victoria, BC, Canada, 1986.
  45. Kimmins, J.P.; Binkley, D.; Chatarpaul, L.; de Catanzaro, J. Biogeochemistry of Temperate Forest Ecosystems: Literature on Inventories and Dynamics of Biomass and Nutrients; Canadian Forestry Service, Petawawa National Forestry Institute: Chalk River, ON, Canada, 1985; p. 227. [Google Scholar]
  46. Maynard, D.G.; Fairbarns, M.D. Boreal Ecosystem Dynamics of ARNEWS Plots: Base Line Studies in the Prairie Provinces; Natural Resources Canada, Canadian Forest Service, Northwest Region: Edmonton, AB, Canada, 1994; pp. 1–60. [Google Scholar]
  47. Wieder, R.K.; Vile, M.A.; Albright, C.M.; Scott, K.D.; Vitt, D.H.; Quinn, J.C.; Burke-Scoll, M. Effects of altered atmospheric nutrient deposition from Alberta oil sands development on Sphagnum fuscum growth and C, N and S accumulation in peat. Biogeochemistry 2016, 129, 1–19. [Google Scholar] [CrossRef]
Figure 1. Map of study site location in northeastern Alberta, Canada, showing the 19 sampling sites where foliage samples were collected in 2011. The grey shaded areas represent active mining operations as of 2013. Main operations are centered near JP212 and JP102.
Forests 07 00312 g001
Figure 2. Site averaged total S contents in CAG, year 1, and year 2 needles versus distance to the main oil sands operations.
Forests 07 00312 g002
Figure 3. (a) Calcium; (b) zinc; (c) iron; and (d) boron versus distance to the major emission sources in the Athabasca Oil Sands Region (AOSR); black diamonds = current annual growth (CAG), blue diamonds = year 1, red diamonds = year 2 needles.
Forests 07 00312 g003aForests 07 00312 g003b
Figure 4. Nitrogen and carbon isotope results from the CAG pine needles. (a) δ15N values of total nitrogen (TN) versus the inverse TN (wt %) content; (b) site averaged δ15N values (black diamonds) and TN values (red diamonds) versus distance to the major emission sources in the AOSR; (c) δ13C values of total carbon (TC) versus the inverse TC (wt %) content; (d) site averaged δ13C values (black diamonds) and TC values (red diamonds) versus distance to the major emission sources in the AOSR.
Forests 07 00312 g004
Figure 5. Site averaged SO4-S to Sorg ratios for CAG needles (2011, this study) in comparison to 2008 CAG ratios of jack pine needles (* data from [24]) versus distance to the main oil sands operations.
Forests 07 00312 g005
Table 1. Average nitrogen contents and isotopic composition of jack pine needles in the AOSR.
Yearδ15N (‰)Reference
2002–2004−2.8[41]
2007−2.6[4]
2008−2.0[24]
2011−2.8this study
Table 2. (SO4-S)/(Sorg) ratios (site averages and standard deviations) of jack pine needles in the AOSR.
SiteDistance (km)CAGYear 1Year 2
JP212130.31 ± 0.100.18 ± 0.070.13 ± 0.03
JP104140.20 ± 0.050.15 ± 0.070.09 ± 0.05
JP304150.31 ± 0.110.22 ± 0.050.18 ± 0.05
JP102160.15 ± 0.050.16 ± 0.050.10 ± 0.03
JP315280.27 ± 0.120.17 ± 0.090.16 ± 0.18
JP303390.32 ± 0.170.30 ± 0.220.16 ± 0.09
JP310410.17 ± 0.080.10 ± 0.050.09 ± 0.05
JP307500.26 ± 0.070.18 ± 0.060.13 ± 0.04
JP311570.19 ± 0.050.11 ± 0.060.10 ± 0.07
JP101690.13 ± 0.030.09 ± 0.060.07 ± 0.04
JP106740.18 ± 0.060.11 ± 0.050.09 ± 0.04
JP308750.16 ± 0.100.14 ± 0.150.09 ± 0.05
JP312760.20 ± 0.060.14 ± 0.040.09 ± 0.03
JP3131030.22 ± 0.040.18 ± 0.150.09 ± 0.01
JP1081090.31 ± 0.220.10 ± 0.050.08 ± 0.02
JP2101110.20 ± 0.070.09 ± 0.030.06 ± 0.03
JP2131130.16 ± 0.050.20 ± 0.140.14 ± 0.07
JP3161190.25 ± 0.120.17 ± 0.110.09 ± 0.04
JP2011280.21 ± 0.120.13 ± 0.040.08 ± 0.05
Table 3. Range of nutrient concentrations of current jack pine foliage and comparison with other studies in Western Canada, Ontario and the US.
Study P (g·kg−1)Ca (g·kg−1)Mg (g·kg−1)Na (mg·kg−1)Mn (mg·kg−1)Cu (mg·kg−1)Fe (mg·kg−1)Zn (mg·kg−1)
WBEA sites 11.04–1.281.82–4.010.71–1.050.05–20.6322–12161.0–16.823–20941–73
ARNEWS 21.06–1.551.52–3.320.84–1.29na242–660na28–59na
Meadow Lake PP-site 9 31.16–2.111.69–7.760.82–1.08<1–57224–559na6–49na
US, Canada [45]1.1–2.02.6–3.10.60–1.30308601015344
Ontario, Canada 4 [43]nananana125–6453.1–3.4107–22243–67
1 CAG data—site means, this study; 2 Acid Rain National Early Warning Sites in the Prairie Provinces—site means [46]; 3 Maynard, D.G. Unpublished data from current jack pine foliage collected yearly from 1992 to 1996 in Meadow Lake Provincial Park, Saskatchewan, Canada (approx. 350 km southeast of Fort McMurray); 4 Control sites (unpolluted) from this study [43].

