Article

Aboveground Biomass and Carbon in a South African Mistbelt Forest and the Relationships with Tree Species Diversity and Forest Structures

1
Department of Forest and Wood Science, Stellenbosch University, Private Bag X1, Matieland 7602, South Africa
2
Laboratoire de Biomathématiques et d’Estimations Forestières, Faculté des Sciences Agronomiques, Université d’Abomey Calavi, Cotonou 03 BP 2819, Benin
3
South African National Biodiversity Institute, Kirstenbosch Research Centre, Private Bag X7, Claremont 7735, South Africa
4
Department of Conservation Ecology and Entomology, Stellenbosch University, Private Bag X1, Matieland 7602, South Africa
*
Author to whom correspondence should be addressed.
Forests 2016, 7(4), 79; https://doi.org/10.3390/f7040079
Submission received: 15 January 2016 / Revised: 25 March 2016 / Accepted: 29 March 2016 / Published: 8 April 2016

Abstract

:
Biomass and carbon stocks are key information criteria to understand the role of forests in regulating global climate. However, for a bio-rich continent like Africa, ground-based measurements for accurate estimation of carbon are scarce, and the variables affecting the forest carbon are not well understood. Here, we present the first biomass study conducted in South Africa Mistbelt forests. Using data from a non-destructive sampling of 59 trees of four species, we (1) evaluated the accuracy of multispecies aboveground biomass (AGB) models, using predictors such as diameter at breast height (DBH), total height (H) and wood density; (2) estimated the amount of biomass and carbon stored in the aboveground compartment of Mistbelt forests and (3) explored the variation of aboveground carbon (AGC) in relation to tree species diversity and structural variables. We found significant effects of species on wood density and AGB. Among the candidate models, the model that incorporated DBH and H as a compound variable (DBH2 × H) was the best fitting. AGB and AGC values were highly variable across all plots, with average values of 358.1 Mg·ha−1 and 179.0 Mg·C·ha−1, respectively. Few species contributed 80% of AGC stock, probably as a result of selection effect. Stand basal area, basal area of the ten most important species and basal area of the largest trees were the most influencing variables. Tree species richness was also positively correlated with AGC, but the basal area of smaller trees was not. These results enable insights into the role of biodiversity in maintaining carbon storage and the possibilities for sustainable strategies for timber harvesting without risk of significant biomass decline.

1. Introduction

Tropical forests harbour a considerable number of plant species that underpin ecosystem functioning [1,2,3], provide forage resources to insect pollinators [4,5,6], contribute to control biological invasion, and help alleviate the effects of climate change by storing atmospheric carbon [7,8]. As pointed out by Pan et al. [8], more than 40% of the global terrestrial carbon is contained in the living biomass of these forests. Assuming that most of these functions and services are vital for human beings, climate regulation services are particularly critical with regard to increasing anthropogenic greenhouse gas emissions in the atmosphere and its subsequent adverse effect on climate [8,9].
Carbon accounting and climate change mitigation activities are central topics in the landscape management debate [10], and as a result, accurate and reliable information on the contribution of land use to alleviate the effects of changing climate is needed. However, for much of Africa, there is still a lot of uncertainty about the amount of aboveground biomass (AGB), belowground biomass and carbon stocks in indigenous forest ecosystems and in particular, in the tropical and sub-tropical regions [11,12].
Indigenous forests in South Africa are not spatially significant (approximately 0.56% of the total land area of the country), but they support a high proportion of the country’s floral diversity [13] and contribute important ecosystem services to the local population. These indigenous forests have been intensely fragmented and exposed to illegal timber harvesting in the past [14]. The modification of fire regimes to protect the agricultural farms and plantations surrounding these forests has favoured a natural successional development that has contributed to the conversion of some degraded forest areas into forest vegetation [14]. Mistbelt forests are some of the indigenous forests that have recovered from the modification of fire regimes. In the Limpopo province of South Africa, these forests occur as fragmented patches in zones of low and highland, and with surrounding pine and eucalypt plantations and commercial farming areas, form a succession of widely distributed landscapes with a great potential to supply fibres and food.
With the large greenhouse gas emissions due to industrialisation, deforestation and forest degradation, care should be given to management policies aiming to balance the production of food, fibres and fuels with the protection of biodiversity and regulation of global climate change [15]. Accounting for the potential of biophysical units in a landscape to store atmospheric carbon is vital for policy and management decisions. More specifically, the clear understanding of the relative role of these forests in carbon sequestration and climate regulation would support the motives behind land relocation and landscape management schemes. To date, many studies have addressed the biomass and carbon stocks in common plantation genera such as Pinus, Eucalyptus and Acacia in South Africa [16,17,18], while comparatively very little attention has been given to native species and natural woody vegetation (see for example, the study by Colgan et al. [19], which is one of the rare biomass studies in natural woody vegetation in South Africa). This results in a lack of precise information about these forests, and appears as a drawback for accurate local and national carbon inventories. It is also a drawback for economic incentives and in particular, the implementation of carbon credit market mechanisms for the conserved forest areas [20].
From previous studies, the quantification of forest biomass relies on different methods, from remote sensing techniques to tree-based allometric approaches [11,21,22,23,24]. Multispecies allometric equations have extensively been studied and offer possibilities to accurately estimate forest biomass at smaller scales, and to elucidate the relationships of forest biomass with stand variables. Recent studies have shed light on the influence of forest stand variables and tree species diversity on the forest biomass and carbon stocks [25,26,27], and how these relationships can serve not only to suggest appropriate management strategies to increase carbon storage [20], but also to test niche complementarity and selection effect hypotheses [28,29]. The niche complementary hypothesis suggests that higher diversity in forest ecosystems would allow a greater variety of functional traits and provide opportunities for efficient resource utilisation, thereby increasing ecosystem functions (for example, carbon storage). The selection effect hypothesis assumes that a highly diversified ecosystem would allow higher probability of occurrence of dominant species or traits that would positively influence the ecosystem function. Both hypotheses have been subject to intense debate about the processes behind ecosystem functioning.
In this study, we aim to quantify the stand biomass and carbon stocks in a Mistbelt forest, a typical multi-storey, multispecies forest in South Africa, and to understand their variation in relation to the stand characteristics and biodiversity. To our knowledge, this is the first biomass study in these Mistbelt forests in South Africa. We based our method on forest inventory, tree sampling, laboratory processing and biomass modelling. Therefore, the objectives of this study were to:
(1)
Develop three multispecies AGB equations and compare their ability to accurately estimate AGB at the tree level; to do so, we first determined whether wood density and AGB varied among study species. We next tested whether the inclusion of tree height and wood density in biomass equations reduced the estimation error.
(2)
Estimate the total amount of biomass and carbon stored in the aboveground compartment in Mistbelt forests; we used the best multispecies AGB equation and the forest inventory data to upscale AGB from the tree to the stand level; we next applied the carbon fraction commonly used in natural forests.
(3)
Understand the aboveground carbon (AGC) variation in relation to the forest tree species diversity (richness) and stand characteristics. We assumed that selection effects and dominance patterns are the main drivers of carbon variation.

2. Materials and Methods

2.1. Study Area

This study was conducted in the northern Mistbelt forests of Limpopo Province in South Africa [13], classified as part of the Afromontane Archipelago in Africa [30]. These Mistbelt forests are found at the southern end of the Mpumalanga escarpment as small and fragmented patches, and along the northern escarpment as a large forest complex [14,31]. Most of these forests occur at an altitudinal belt spanning from 1050 to 1800 m above mean sea level. The area covered in this study (707 ha) is located in the Woodbush–De Hoek State Forest (23°50′ S, 29°59′ E), near Tzaneen in the Limpopo Province. Annual mean precipitation varies from 1800 mm at higher altitude to 600 mm at lower altitudes [14]. The vegetation in the Woodbush–De Hoek State Forest is dominated by species such as Xymalos monospora (Harv.) Baill., Podocarpus latifolius (Thunb.) R.Br. ex Mirb., Combretum kraussii Hochst., Syzygium gerrardii (Harv. ex Hook.f.) Burtt Davy, Cryptocarya transvaalensis Burtt Davy in the canopy and sub-canopy layers, and Oxyanthus speciosus DC., Peddiea Africana Harv., Oricia bachmannii (Engl.) I. Verd., Kraussia floribunda Harv. in the understorey vegetation, while the herb layer is made up of species genera such as Isoglossa, Plectranthus, Stachys, Galopina, etc. [13].

2.2. Forest Inventory and Biomass Data

The study area was stratified into compartments based on different classes of aspect, slope and elevation based on a digital elevation model. A first phase forest inventory was carried out using thirty replicates of a nested plot design, which consisted of a 0.025-ha (hectare) circular subplot inside a 0.05-ha larger circular plot. These plots were established based on a stratified random sampling design. Diameter at breast height (DBH) was measured with a diameter tape, inside each 0.025-ha plot for trees in the 5–10-cm DBH class, and inside the 0.05 ha plots for trees with DBH greater than 10 cm. Total height (H) was additionally measured where possible, using a Vertex hypsometer. In total, 50 species were enumerated, of which four species were selected, on the basis of their greater relative contribution to stand basal area, for further sampling and quantification of biomass. The four selected species, namely Combretum kraussii (Combretaceae), Croton sylvaticus Hochst. (Euphorbiaceae), Syzygium gerrardii (Myrtaceae) and Trichilia dregeana Sond. (Meliaceae) contributed 42% of the stand basal area. Among the species we did not consider, Xymalos monospora (Monimiaceae) and Cussonia sphaerocephala Strey (Araliaceae) were also dominant and covered 29% of the stand basal area. The remaining species (n = 44) contributed 29% of the total stand basal area.
For each species selected, fourteen to sixteen individual trees (a total of 59 trees; Table 1) were chosen across a wide range of DBH and measured for biomass quantification. Information on DBH and H, and wood core samples were collected from all selected trees. Wood core samples were taken at breast height level and crown base level (i.e., the level of insertion of the first branch of the living crown). Diameter was measured on standing stems at 2-m intervals up to the crown base with the help of a tree climber. On larger branches (basal diameter >15 cm), both thick- and thin-end diameters, at the base and the end of a branch, respectively, and the distance between these two points were determined. On smaller branches (basal diameter <15 cm), only the branch basal diameter was measured. In addition, two to four branches per tree were sampled at different height levels (distance from the ground) from eight individual trees for each species, for further determination of dry mass. As a result, 19, 18, 20 and 16 branches were sampled for C. kraussii, C. sylvaticus, S. gerrardii and T. dregeana, respectively. To obtain the dry mass, branch wood and leaf samples were oven-dried at 105 °C until weight equilibrium was reached [22]. Data on branch dry mass were used to establish the branch biomass equations based on branch basal diameter, which explained 94.5%, 93.6%, 94.2% and 95.3% of the variation of the branch dry mass for C. kraussii, C. sylvaticus, S. gerrardii and T. dregeana, respectively. Wood density was determined by dividing the oven-dried mass of each wood core sample by its green volume (obtained from the water displacement method [22]). The volume of the standing stem plus larger branch sections was calculated by applying Smalian’s formula [32], and the average values of wood density (based on the two wood core samples per tree) were used to calculate the wood biomass of the stem plus larger branches. The total AGB of each individual tree was then obtained by adding the biomass of the stem and larger branches to the branch biomass predicted from the branch biomass regression equations. Table 1 shows a descriptive summary of the sampled trees.

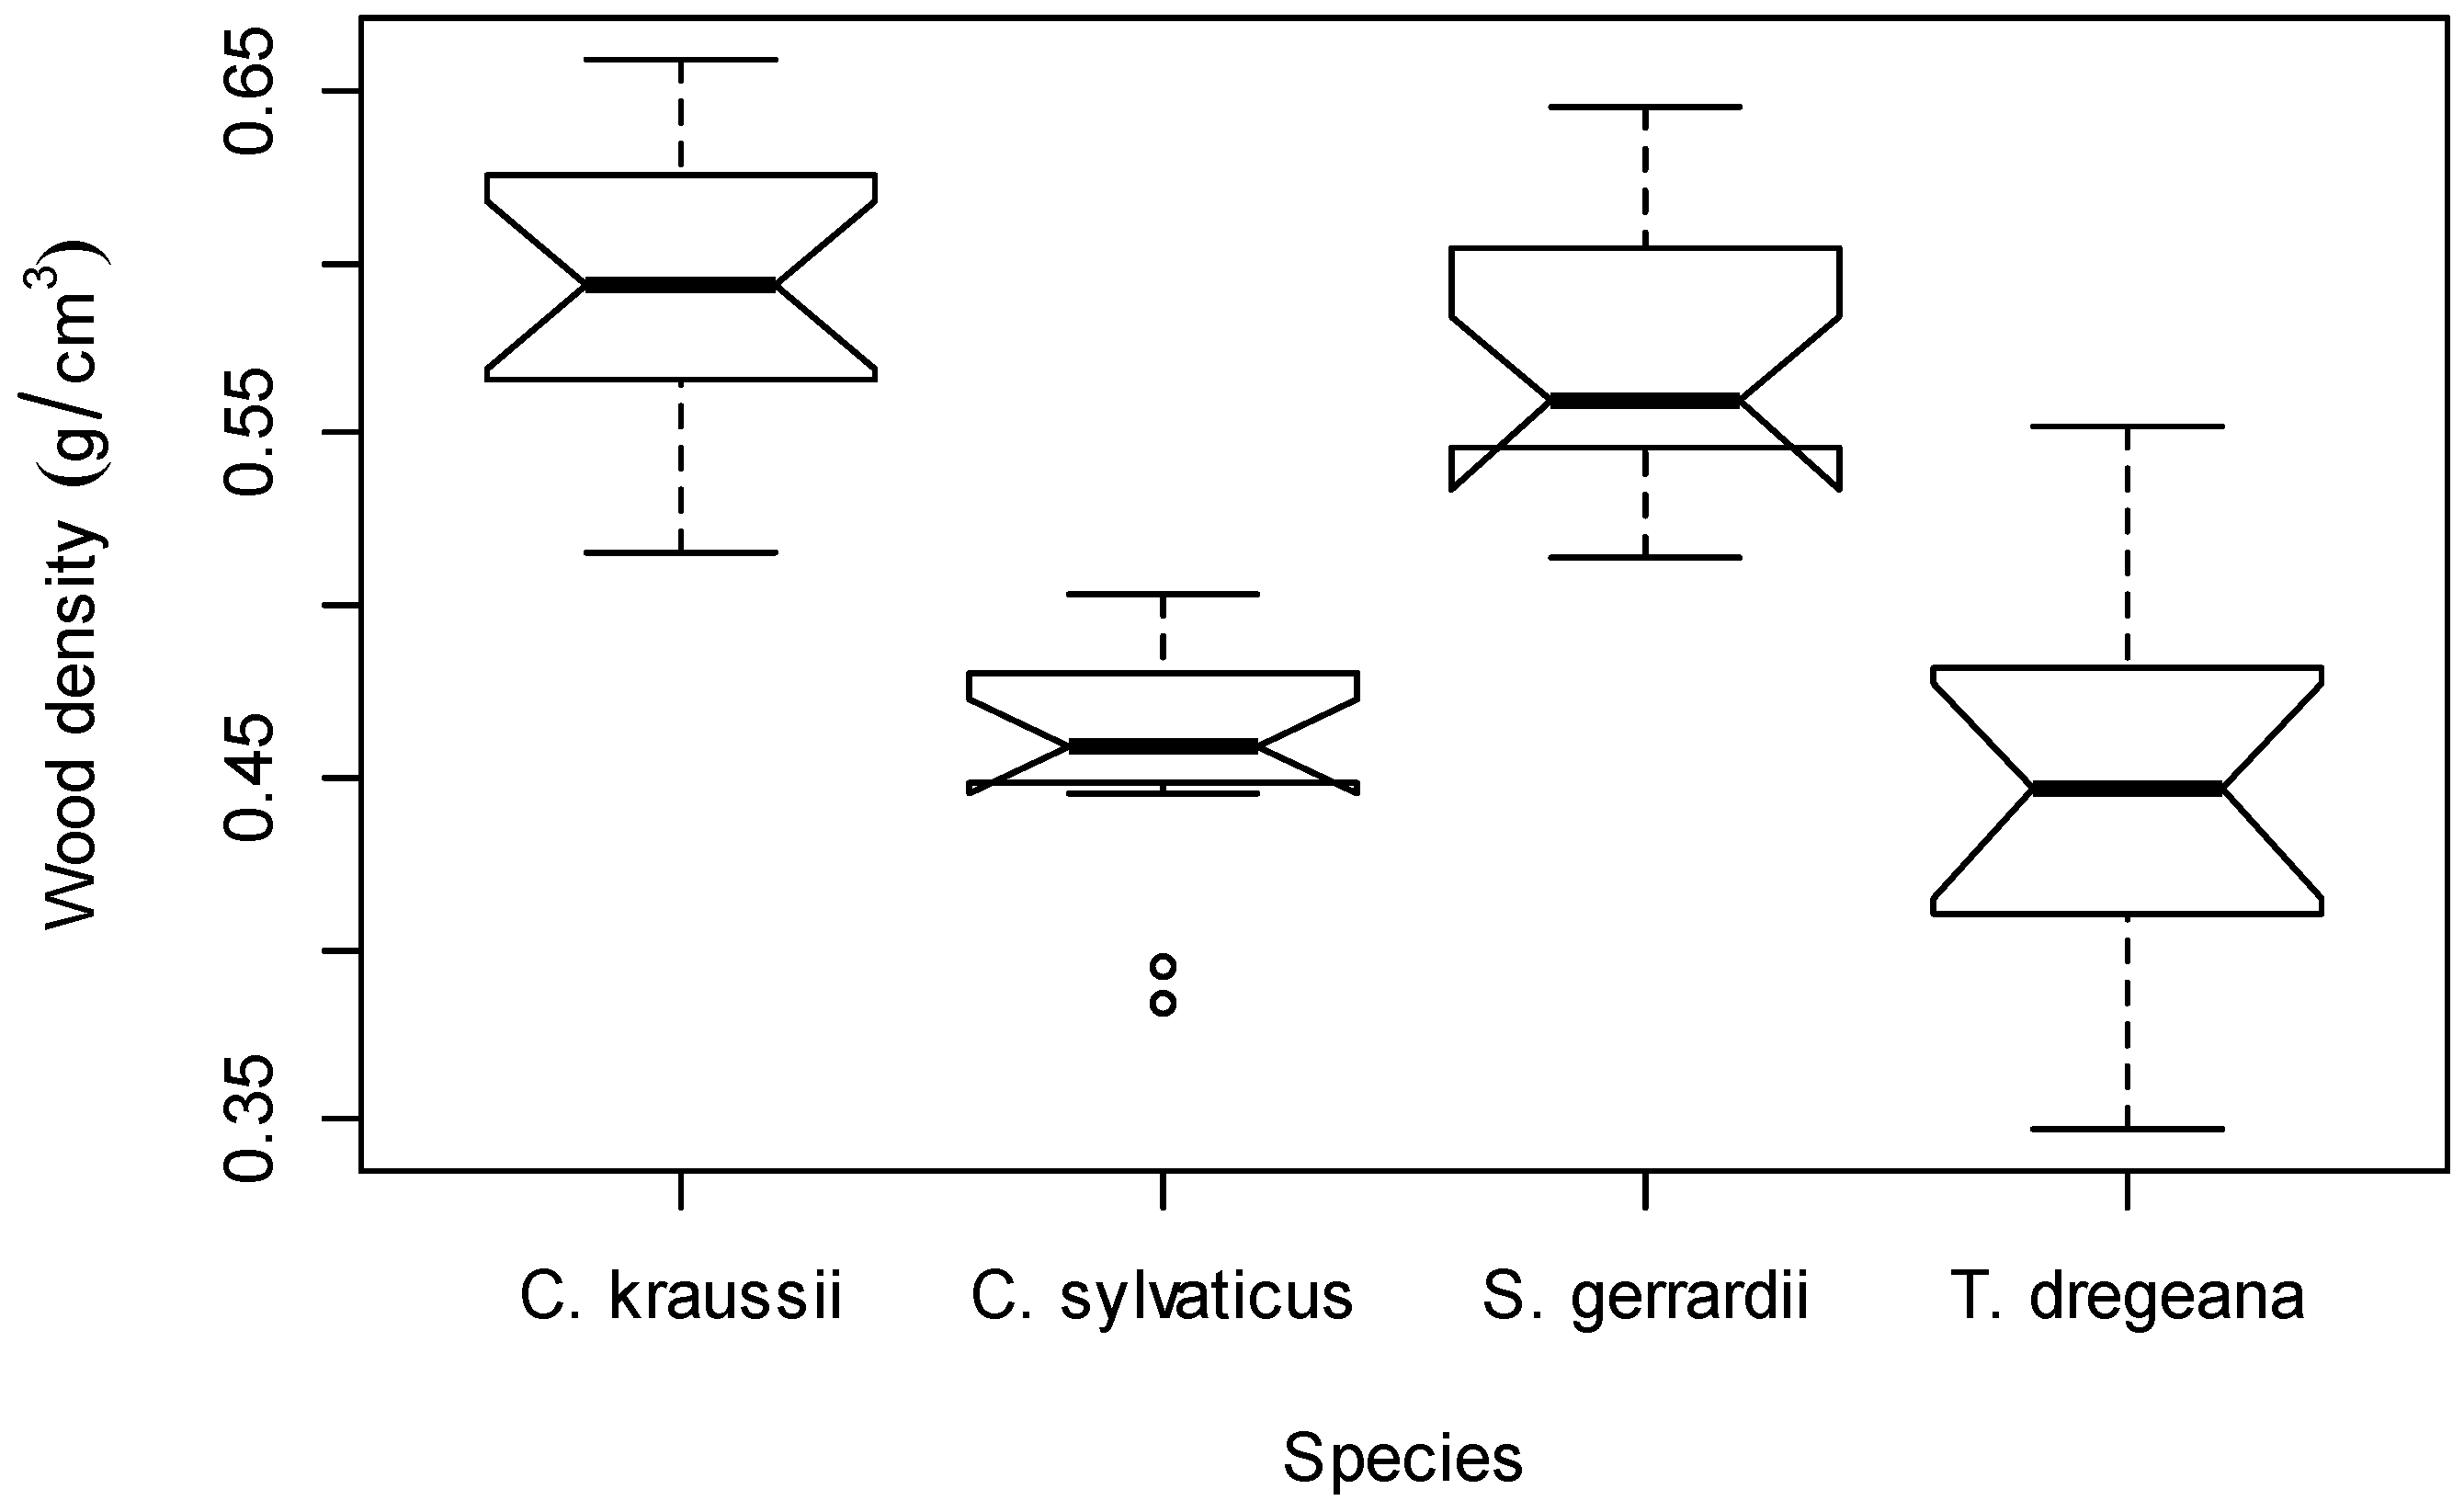
2.3. Assessing the Effect of Species on Wood Density and AGB

We tested for differences in wood density among species using one-way analysis of variance (species as factor). Shapiro Wilk’s statistic was used to test for the normality of the data. Because of the significant effect of species, Student-Newman-Keuls test was performed to classify the species according to their wood density values. We also assessed whether and how the biomass allocated to the aboveground compartment varied with species. Because biomass allocation is size dependent, we assessed the effects of species (categorical variable) and tree size (DBH, continuous variable) using a Generalised Linear Model [33]. Additionally, we tested for interaction effects between tree size and species to determine if the effects of tree size would vary by species.

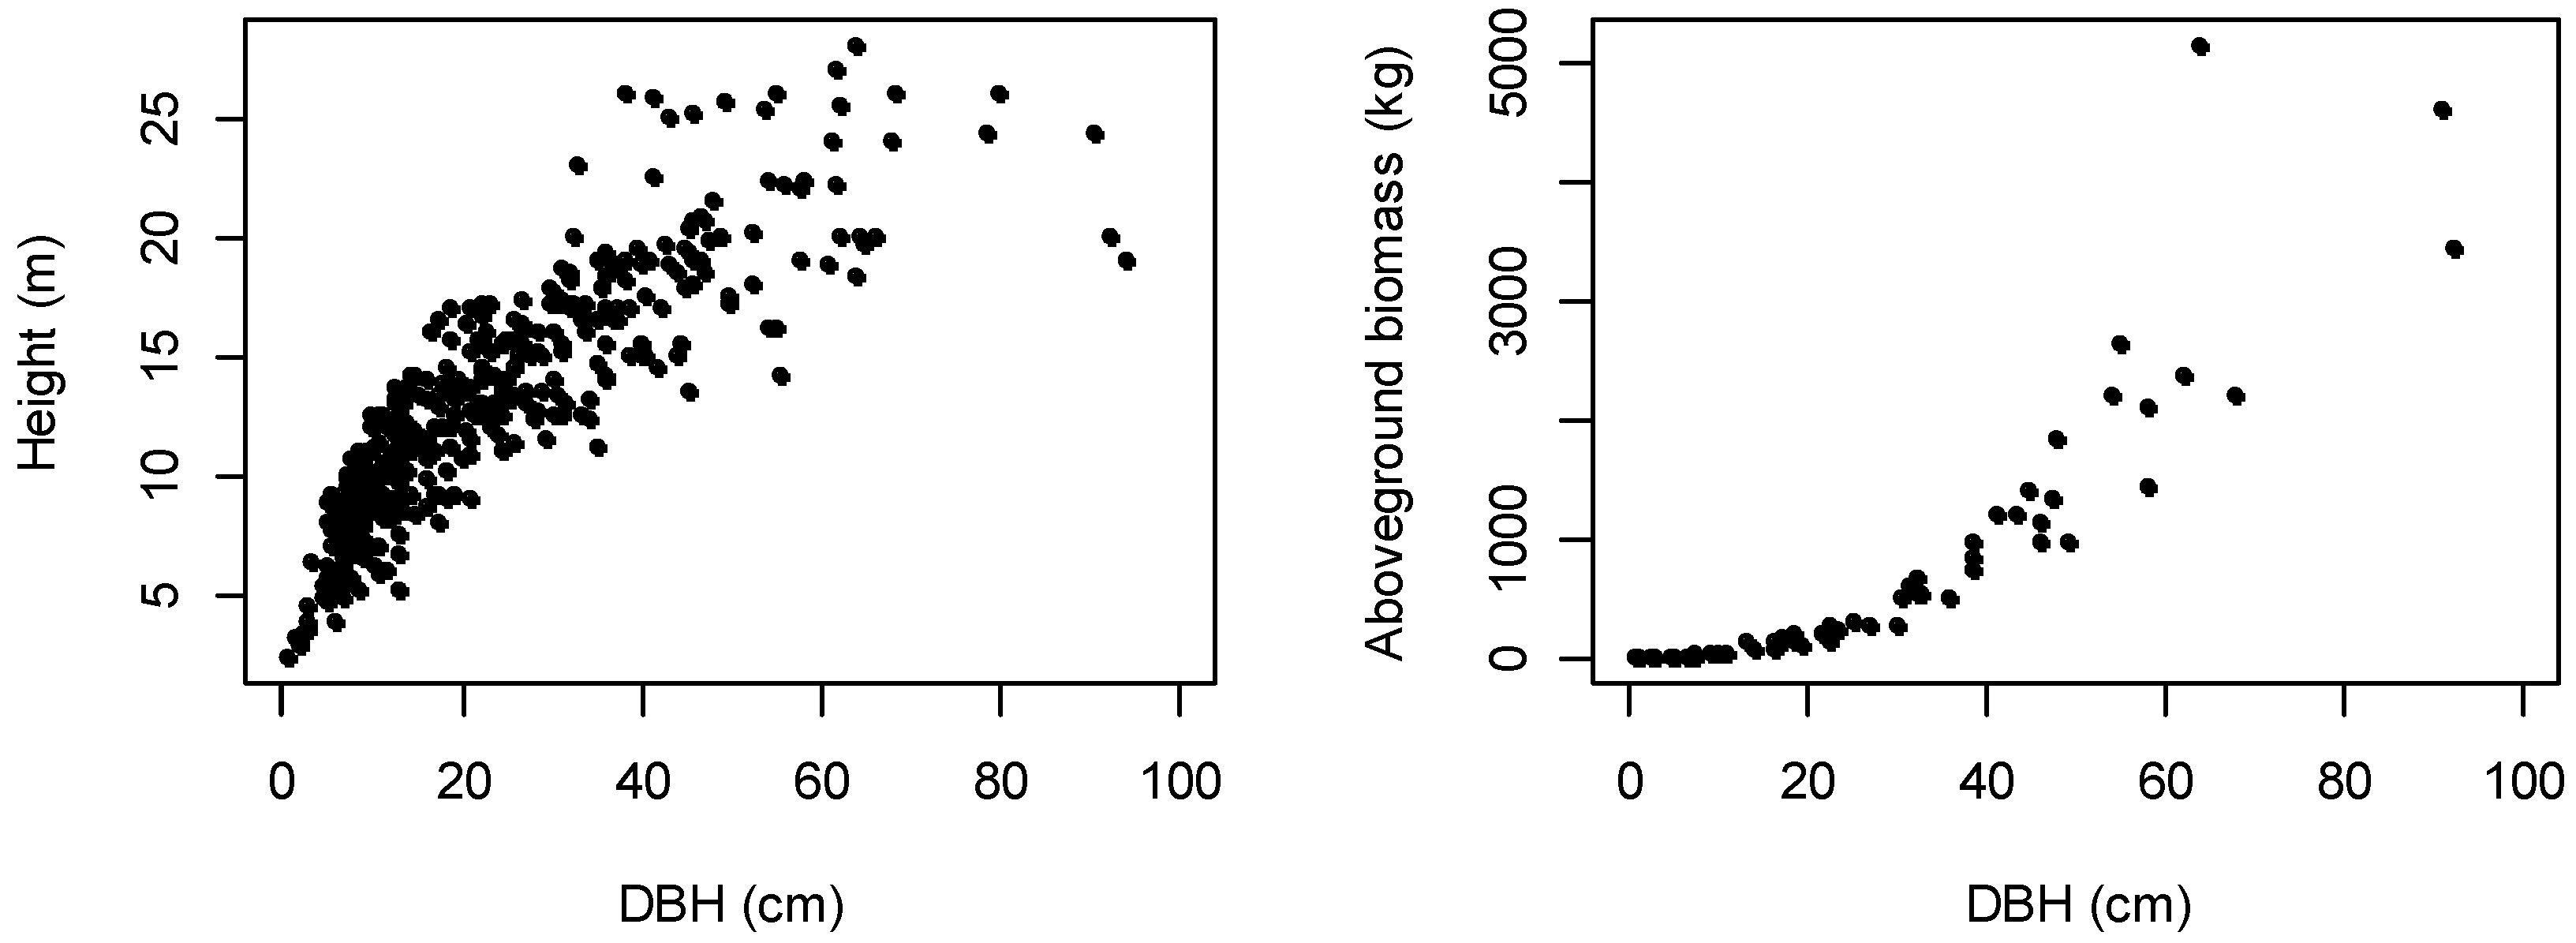
2.4. Multispecies DBH-Height and Biomass Allometric Models

As result of the forest inventory, total tree height was measured for 461 individual trees, accounting for 37 species. The tree diameter and height relationship was explored using scatter plots. Because the power function fitted well with the observed data, we developed the allometric relationship between tree DBH and height (H) for all species using the function in Equation (1):
H = β 0 · D B H β 1 · ε
where H is the response variable, DBH the predictor, and ε the random error. Equation (1) can be linearised by applying the natural logarithm to H and DBH to obtain its logarithmic form (Equation (2)) [32,34]:
ln H = ln β 0 + β 1 ln D B H + ε
Three allometric Equations (3)–(5) taking into account DBH (cm), H (m) and wood density ρ (g/cm3), were used to fit the multispecies biomass models:
ln A G B = ln β 0 + β 1 ln ρ + β 2 ln D B H + ε
ln A G B = ln β 0 + β 1 ln ρ + β 2 ln D B H + β 3 ln H + ε
ln A G B = ln β 0 + β 1 ln ρ + β 2 ln ( D B H 2 × H ) + ε
where β0, β1, β2 and β3 are the regression coefficients, and ε is the additive error. The selection of the best multispecies equation was based on the values of adjusted R2, root mean squared error (RMSE), Akaike information criterion (AIC), percent relative standard errors (PRSE, %) and mean absolute deviation (MAD, %), as suggested by Chave et al. [11], Sileshi [34] and Fayolle et al. [35]. PRSE is defined as follows:
P R S E = 100 × ( S E | θ | )
where SE is the standard error of model parameter (θ) [36]. Valued of PRSE greater than 20% indicate an unreliable parameter [37]. MAD is calculated using the deviation of the predicted vs. observed response variable [11], as defined below:
δ D = 100 × | y ¯ y | y
In Equation (7), y and y ¯ are the observed and predicted values, respectively, of the response variable. All deviations were averaged based on the total number of observations. The use of logarithmic transformation in Equations (2)–(5) induces a systematic bias in the final estimation of the response variable [11]. To account for that bias, the predicted values were back-transformed into the original values and corrected by applying the correction factor, as defined in Baskerville [38]:
C F = e ( R S E 2 2 )
where RSE is the Residual Standard Error of the regression.

2.5. Quantifying AGB and AGC at the Stand Level

The best multispecies biomass equation was used to predict AGB for the total pool of species, based on DBH, total height (predicted from DBH-height models), and wood density. Since wood density was determined only for the studied species, the values of wood density for the species not sampled were obtained from the global publicly available wood density database [39,40]. Average wood density was used when multiple values were available for a single species. When the wood density value was missing for a given species, the average genus wood density was used. Similarly, when genus data on wood density were missing, the mean wood density at the family level was used. In the case a family was missing, the average wood density of the plot was used as proposed by Stegen et al. [41].
To upscale from the tree level to the stand level, the predicted AGB was first calculated at the plot scale and averaged, based on the total number of plots. The AGB density (kg·ha−1) was upscaled to the stand level by applying the surface expansion factor (area of hectare/area of plot). Because a nested plots design was employed during the forest inventory (0.025-ha circular subplot within a 0.05-ha circular larger plot), the AGB was computed for each DBH size class, i.e., 5–10 cm DBH in small subplot and >10 cm DBH in the large subplot. The calculated values were summed to obtain the total AGB at the stand level. The AGC stock was then determined by applying the carbon fraction of 0.50 [20].

2.6. Assessing the Structural Variables Influencing AGC

Stand variables such as stem density, mean diameter and basal area have positive effects on carbon stocks, probably because these variables are the stand level attributes that reflect the structures of the plant communities. However, combined use of basal area, diameter and tree density can lead to double accounting of tree size, as the stand basal area already integrates population density and tree size. To determine the most important stand variables, we only focused on basal area and partitioned the plot level basal area based on the contribution of small trees (5–30 cm DBH), medium sized trees (30–60 cm) and large trees (>60 cm) [42,43]. The selection effect hypothesis assumes that dominance patterns drive ecosystem functioning. Thus, we additionally quantified the basal area of the 10 most important species in each plot. The ten most important species were identified on the basis of their importance value index IVI [44]. This index was determined for each species by summing the species relative frequency, relative density and relative dominance (basal area), as follows:
IVI = n i i = 1 s n i + f i i = 1 s f i + c i i = 1 s c i
where ni, fi and ci are the density, frequency and basal area, respectively, of the ith species. As a result, the stand basal area, basal area of smaller trees, basal area of medium sized trees, basal area of the largest trees, basal area of the 10 most important species, and species richness were considered as candidate variables influencing AGC at the plot level. We explored the bivariate relationships between AGC and these variables using scatter plots and by fitting regressions. We additionally combined the variables that significantly explained AGC storage in the bivariate analyses, in a multiple linear regression model and performed a stepwise model selection procedure to select the best predictors. All statistical analyses were performed using R statistical software.

3. Results

3.1. Effect of Species on Wood Density and AGB

Analysis of variance showed that wood density varied significantly among species (F = 40.34, p < 0.001), with 68.21% of the variation being explained. The highest values of wood density were observed for C. kraussii (0.593 g/cm3 ± 0.011) and S. gerrardii (0.571 g/cm3 ± 0.011) while the lowest mean wood density values (0.459 g/cm3 and 0.445 g/cm3) were observed for C. sylvaticus and T. dregeana (Figure 1). The results of the generalised linear model (Table 2) showed significant interaction effects between DBH and species. For a given tree size, C. sylvaticus had a scaling coefficient that was 0.31 ± 0.13, being significantly higher than the base line value (C. kraussii, Table 2). These results mean that, for the same values of DBH, C. sylvaticus would have significantly higher mean AGB at the tree level, as compared to C. kraussii, S. gerrardii and T. dregeana, which would have similar average AGB values at the tree level (p > 0.05).

3.2. Multispecies DBH-Height and AGB Allometric Models

DBH and height data fitted well with the power law model used (Figure 2 and Figure 3). The model coefficients, indicators for goodness of fit and correction factors of Equation (2) are summarised in Table 3. DBH explained 83.81% of the variation in total height, as shown by the adjusted R square value. Model coefficients were highly significant (p < 0.001), indicating that tree diameter was a significant predictor of tree height for all species.
The comparison of the three fitted equations (Equations (3)–(5) for estimating AGB is also shown in Table 3. Equation (3) produced the poorest fits (non-existent effect of wood density, lowest R square, highest AIC, and highest residual standard and root mean square errors), while Equations (4) and (5) provided the best fits (highest variance explained and lowest residual errors and AIC), with an additional significant effect of wood density (p < 0.05). Compared to Equation (5), Equation (4) proved less satisfactory because it showed high variance inflation factors (VIFs), especially for the correlated variables such as DBH (8.105) and height (8.086). High VIFs reflect collinearity between predictors and unreliable coefficients. Based on that, we considered that Equation (5) (incorporating DBH2 × H as a single predictor) provided the best multispecies model for estimating AGB. Taking that model into account, 98.45% of the variation in AGB was explained by positive and significant effects of wood density (p < 0.05) and DBH2 × H (p < 0.001), with an associated correction factor of 1.03. The scatter plot of the regression residuals vs. predicted values did not show any heteroscedastic behaviour for the selected model (Figure 4). In addition, the trend in the observed and estimated values of AGB showed a very good coincidence with the linear equation (y = x) (Figure 4).

3.3. AGB and AGC Stocks at the Stand Level

The total AGB, when pooling all enumerated species together, was estimated as 358.1 ± 31.9 Mg·ha−1 with a range of 98.2–952.2 Mg·ha−1. An approximate carbon stock of 179.0 ± 15.9 Mg·C·ha−1 was estimated for the aboveground compartment.
When assessing the contribution of species to the total pool of AGB and AGC, we found that few species (8 out of 50 species) contributed 80%. The main substantial contribution came from S. gerrardii (25.3%), Xymalos monospora (15.4%), T. dregeana (12.8%) and C. kraussii (5.5%). C. sylvaticus, which is one of the focus species in this study, contributed 4% of the total AGB and AGC stocks. The pattern, however, differed from that of the forest understory layer (5 ≤ DBH < 10 cm), where some new species such as Cassipourea malosana (Baker) Alston, Kraussia floribunda and Ochna arborea var. oconnorii (E. Phillips) Du Toit contributed 30.2% of the AGB and AGC stocks. Within that same layer, S. gerrardii and Xymalos monospora contributed 20.8%.

3.4. Factors Influencing AGC Stocks

AGC ranged from 49.1 Mg·C·ha−1 to 476.1 Mg·C·ha−1 across plots. Analyses of the bivariate relationships showed that stand basal area, basal area of the ten most important species and basal area of the largest trees (>60 cm DBH) were the most influencing stand variables, with 95%, 77% and 59% variation explained, respectively (Figure 5). The basal area of medium trees (30–60 cm DBH) and tree species richness were positively correlated with the AGC (R2 = 0.24, p = 0.006 and R2 = 0.13, p = 0.04, respectively Figure 5), but the basal area of smaller trees (5–30 cm DBH) was not (Figure 5).
When all the stand variables that were significantly correlated with AGC storage were combined in the multiple linear regression model, only stand basal area and the basal area of the largest trees (>60 cm DBH) were retained in the final model and best (and positively) predicted AGC, overruling the species richness effect.

4. Discussion

4.1. Effect of Species on Wood Density and AGB

The values of wood density found in this study are in the range of published values [40,45]. The between species variation of wood density indicates that this variable is a determinant for multiple species biomass assessments [45]. By examining the effects of species on AGB, our results showed that species with relatively lower wood density had higher mean average wood biomass. This is in part because species with lower wood density typically grow faster than species with higher wood density [46]. The significant effects of species on both wood density and AGB demonstrate that species perform differently in terms of resource acquisition and biomass production [47]. The fact that C. sylvaticus had higher biomass than C. kraussii, S. gerrardii and T. dregeana results from a greater foliage biomass production by C. sylvaticus, which seems to be consistent with the species leaf traits [48].

4.2. Uncertainties in the Multispecies AGB Equations

The AGB equations used in this study were based on a non-destructive sampling of 59 trees from four species. Commonly applied methods for accurate estimation of tree biomass rely on destructive tree sampling and measurement of sample weights in the field [19,22,23]. Accordingly, the non-destructive method used here might be a source of uncertainty in the allometric biomass prediction. However, in conserved natural forests (where tree felling is not authorised), this particular non-destructive method is the only available option.
Besides this, the representativeness of the selected species may be another source of uncertainty for the multispecies biomass equations. Indeed, four out of fifty species might not be sufficient enough to account for the variation in all species traits. Our methodological approach, which was based on branch biomass modelling in order to reconstruct the crown biomass, required an acceptable number and diameter range of branch samples; and due to the policy, time and resource constraints, it was relatively difficult to explore many species. Nevertheless, to quantify the biomass stocks at the stand level, we assumed that the inclusion of multiple predictors (e.g., diameter, height and wood density) in the biomass equations would help to catch some variability in the characteristics of the species that we could not sample in the field.
The actual sample size (59 trees) may not be entirely sufficient to account for the total variation of the species characteristics, and thus can also constitute a caveat for the reliability of our results. Larger sample data sets are often preferred, but are difficult to obtain especially for biomass studies in natural forests, because of their status and the amount of work that is required for measuring tree components [49]. For instance, Ebuy et al. [49], Deans et al. [50], Henry et al. [51] and Segura and Kanninen [52] used 12, 14, 42 and 19 trees, respectively, to establish biomass allometric models. Although our sample size is low, it is higher than most of the sample sizes that are used in tree biomass studies in natural forests, with some exceptions, however [35,53,54]. In addition, most of the larger data sets used in tree biomass studies in natural forests were obtained from a compilation of existing smaller data sets [12]. To our knowledge, the functions presented here are the first functions published for Mistbelt forests in South Africa.

4.3. Predictors for Multispecies AGB Equations

DBH, total height and wood density acted as potential predictors in the multispecies biomass equations, consistent with what is expected, and as also revealed in many recent studies [11,24,35,53]. DBH appeared to be commonly used because it is the most familiar and easily measured variable during national forest inventories. However, as pointed out by Fayolle et al. [35], tree diameter should not be considered solely as a predictor for AGB, especially when dealing with several species or a species that does not show a strong relationship between diameter and other tree characteristics (e.g., tree height). Contrary to DBH, the main reason why total height is often left out in evergreen tropical forests is because tree height is difficult to measure accurately within complex or closed canopy forests [35]. For that reason, and given the lower marginal variance that is often explained by the additional use of height, some authors advocate using DBH alone as a predictor of tree biomass [35,52].
In reality, if height is included in biomass models as an additional variable, then the implication is that any error in measuring height will propagate to the tree level and further to stand level estimates [55]. Even so, regarding the species-specific differences in DBH-height allometry, tree height is an important factor for biomass estimation [24,56]. The inclusion of height as an additional variable helps accounting for variation in AGB among trees with the same value of DBH [24], thus reducing the estimate errors [11]. For instance, in this study, we found that the additional use of height reduced the residual standard error by 19.73%. All being considered, for quantification of AGB stocks in multispecies forests, we recommend that DBH and total height be measured for a reasonable number of trees from different species in order to establish a multispecies DBH-height equation for estimation of total height for each individual tree, and account for it in AGB models.
While the use of both DBH and height is expected to improve the statistical fits of biomass equations, it is interesting to discuss how to allow for the simultaneous effects of DBH and height [24]. Depending on how diameter and height are correlated, models can give rise to collinearity [24,34], which deserves particular attention. In line with this, the model that incorporated DBH2 × H as a compound variable was the most parsimonious in that it helped accounting for within-species variation of height for the same value of DBH while solving the problem of collinearity. DBH2 × H is expected to be good predictor because it is directly proportional to the volume of a cylinder with diameter (DBH) and height (H). Chave et al. [11] also found DBH2 × H was a suitable predictor for tropical moist forest stand biomass. The results are also consistent with other recent studies that used DBH2 × H as a variable in biomass models [24,53].
Wood density was a good indicator of AGB, and thus for multispecies biomass equations [12]. The significant effect of wood density indicates that within- and between-species wood density patterns are important to explain biomass estimates. Between-species variation would, however, strongly influence AGB because wood density affects tree specific growth and survival rate [57]. Accordingly, it has been documented that lower wood density allows for faster growth in size [46,58], probably because trees grow faster when the conductive tissue is less expensive (in terms of carbon) to construct [45,59]. The use of wood density is not common, although it is known to result in substantial improvement. The availability of global and regional wood density data bases should help to promote the use of that variable. However, the biomass estimates obtained by applying the values of wood density of such data bases (as used in this study) are not exempt from uncertainty. Fayolle et al. [35] showed that using wood density from the global data base slightly increased the estimation errors. Therefore, the direct determination of wood density in the field is better for reliable biomass estimation, but is not practical due to the considerable amount of field and laboratory work, especially when dealing with several species.

4.4. AGB and AGC Stocks at the Stand Level

When pooling all enumerated species together, the total AGB and AGC values for a diameter range above 5 cm across all plots were estimated as 358.1 ± 31.9 Mg·ha−1 and 179.0 ± 15.9 Mg·C·ha−1, respectively. The average estimated AGB in the northern Mistbelt forests is higher than the biomass estimates provided by Lung and Espira [20] for an African tropical forest (279 ± 32.78 Mg·ha−1), but relatively lower than AGB values in Amazonian forests (312–464 Mg·ha−1) [60] and closed-canopy tropical forests (395.7 Mg·ha−1) [61]. Using the same diameter range, Fischer et al. [62] estimated the total AGB as 385 Mg·ha−1 for a tropical forest on Mt. Kilimanjaro. These comparisons showed that northern Mistbelt forests store substantially higher quantities of biomass and carbon stocks than some montane and sub-montane tropical forests [7,63]. A simple explanation for this is that across a wide range of their geological and altitudinal gradients [13], these northern Mistbelt forests not only support a high floral diversity but also a structurally diverse horizontal and vertical forest matrix [14,64]. As expected, the (taxonomic) diversity of trees and the stand structural variables such as basal area and percentage of large trees were found to explain a high variability of the estimated biomass and carbon density, as also reported in recent studies. More specifically, it was found that species richness was significantly and positively correlated with AGC. Indeed, it is a well-known pattern, especially at the global scale, that carbon stocks increase with increasing diversity [27,29,65]. The positive relationships between tree species diversity and carbon stocks in this study supports the idea that diversity-carbon patterns are also identifiable even at smaller spatial scales. In fact, tree species diversity correlates positively with carbon storage because higher species richness probably leads to higher stem density and higher forest productivity [66], i.e., basically, the more tree species that are present in a plot, the more biomass is produced. While this seems to agree with the niche complementarity hypothesis [67], the weak effect of tree species diversity on AGC suggests that dominance patterns are likely to be stronger.
Despite the higher biomass production of C. sylvaticus at the tree level, our results showed that S. gerrardii was ranked first in terms of the relative contribution to AGB and AGC stocks. In addition, few species (8 out of 50 species) proved to greatly contribute to the biomass and carbon stocks (80%). These results reinforce the importance of other factors (e.g., stand related factors) influencing the biomass partitioning among species. More specifically, we found an important contribution of stand basal area, basal area of the ten most important species and basal area of the largest trees, in this order. The greatest influence of dominant stems has been evidenced in some previous studies [68,69]. This information corroborates the fact that dominance patterns greatly influence the AGC stocks, thus supporting the selection effects hypothesis. In a recent study, Lung and Espira [20] showed that tree stems larger than 50 cm have the greatest impact on forest biomass, and less than 16% of the species pool accounted for over 62% of the AGB. Ruiz-Jaen and Potvin [28] and Cavanaugh et al. [29] also showed that selection effects hypothesis contributes greatly to the carbon stocks.

4.5. Implications for Landscape Management and Further Perspectives

The lack of site-specific biomass equations limits accurate assessment of the carbon stocks. Using the best predictive model, we found that the estimated values of AGB in the northern Mistbelt forests are comparable to values in other important tropical African forests, thus providing evidence of their great potential for sequestration of CO2. Due to the necessity for prioritization of CO2 mitigation actions, it is important to consider the carbon storage potential of these Mistbelt forests in landscape management planning. More specifically, the promotion of the conservation of Mistbelt forests will reduce the risk of loss of biodiversity while enhancing carbon stocks and mitigating the impact of global climate change, thus shedding light on the implications for REDD (Reducing Emissions from Deforestation and Degradation) schemes. However, as taxonomic diversity only cannot elucidate the mechanism behind biodiversity-carbon patterns, aspects of functional diversity and functional dominance must be investigated. Evidence on this will help to determine the level of biodiversity that is important for carbon storage. In addition, further research should regard how functional traits influence the patterns of biomass allocation between plant organs and how interspecific competition between trees for various resources [70] modifies the structure and hence ABG and AGC.
The highly variable biomass and carbon in the survey plots are supported by the strong role of structural variables in the biomass and carbon partitioning, which could also be used to design management and conservation plans. For instance, the conservation of dominant tree species or trees with larger size (in terms of height or diameter) could be a strategy to increase carbon storage. Further, the unexpected lack of significant influence of smaller trees on the AGC can be used to support the idea that optimal solutions exist for sustainable harvesting of stems in the Mistbelt forests without risk for significant carbon decline. Because conserved lager trees will die over time, an appropriate management strategy would consist of maintaining a balanced forest over time, by imposing a harvest regime that would target both smaller and larger trees. This, however, calls for more oriented research on long-term sustainability of stem and non-timber forest products harvesting, which can result in a win-win strategy whereby local populations would benefit while conserving the forests for biodiversity and their ecosystem services [71].
Few species principally contributed to the total AGB and AGC pool, probably as a result of selection effects. These species likely dominate the forest stands, as revealed by the positive relationship between dominant species and carbon stock. If protected from removal or conversion, such species could provide a better long-term guarantee of ecosystem services. As these Mistbelt forests are generally the most important natural components of the landscapes in the region, more research studies should endeavour to elucidate the role of these species in the provision of other ecosystem services. Due to the importance of pollination services for agricultural farms, particular aspects should regard the potential of these forests to supply nesting and forage resources to wild pollinators and managed honey bees.

Acknowledgments

This research was financially supported by the National Research Foundation of South Africa through the project “Catchman Letaba” in the RTF funding scheme and the African Forest Forum through the research grant on “Land Use, Land Use Change and Forestry linked to Climate Change” provided to Sylvanus Mensah. We acknowledge the contribution of the SHARE Intra-ACP project and the EU Marie Curie IRSES project “Climate Fit Forests”. We are grateful to the environmental authorities for permission to carry out this research, to Andrew Perkins for his assistance during the field work, and to the personnel of Komatiland forests and Hans Merensky Holdings for logistical support. We also thank the two anonymous reviewers and the academic editor for their valuable comments.

Author Contributions

S.M. and T.S. conceived and designed the experiment; S.M. collected and analyzed the data, and wrote the paper; R.G.K. advised and edited the text; T.S., R.V. and B.d.T. supervised the research project and edited the text.

Conflicts of Interest

The authors declare no conflict of interest.

Abbreviations

The following abbreviations are used in this manuscript:
AGB
Aboveground biomass
AGC
Aboveground carbon
DBH
Diameter at breast height
H
Total height

References

  1. Balvanera, P.; Kremen, C.; Martinez-Ramos, M. Applying community structure analysis to ecosystem function: Examples from pollination and carbon storage. Ecol. Appl. 2005, 15, 360–375. [Google Scholar] [CrossRef]
  2. Díaz, S.; Cabido, M. Vive la différence: Plant functional diversity matters to ecosystem processes. Trends Ecol. Evol. 2001, 16, 646–655. [Google Scholar] [CrossRef]
  3. Ruiz-Jaen, M.C.; Potvin, C. Tree diversity explains variation in ecosystem function in a neotropical forest in Panama. Biotropica 2010, 42, 638–646. [Google Scholar] [CrossRef]
  4. Goulson, D. Foraging strategies of insects for gathering nectar and pollen, and implications for plant ecology and evolution. Perspect. Plant Ecol. Evol. Syst. 1999, 2, 185–209. [Google Scholar] [CrossRef]
  5. Pywell, R.F.; Warman, E.A.; Carvell, C.; Sparks, T.H.; Dicks, L.V.; Bennett, D.; Wright, A.; Critchley, C.N.R.; Sherwood, A. Providing foraging resources for bumblebees in intensively farmed landscapes. Biol. Conserv. 2005, 121, 479–494. [Google Scholar] [CrossRef]
  6. Jha, S.; Kremen, C. Resource diversity and landscape-level homogeneity drive native bee foraging. Proc. Natl. Acad. Sci. USA 2013, 110, 555–558. [Google Scholar] [CrossRef] [PubMed]
  7. Saatchi, S.S.; Harris, N.L.; Brown, S.; Lefsky, M.; Mitchard, E.T.A.; Salas, W.; Zutta, B.R.; Buermann, W.; Lewis, S.L.; Hagen, S.; et al. Benchmark map of forest carbon stocks in tropical regions across three continents. Proc. Natl. Acad. Sci. USA 2011, 108, 9899–9904. [Google Scholar] [CrossRef] [PubMed]
  8. Pan, Y.; Birdsey, R.A.; Fang, J.; Houghton, R.; Kauppi, P.E.; Kurz, W.A.; Phillips, O.L.; Shvidenko, A.; Lewis, S.L.; Canadell, J.G.; et al. A large and persistent carbon sink in the world’s forests. Science 2011, 333, 988–994. [Google Scholar] [CrossRef] [PubMed]
  9. Beer, C.; Reichstein, M.; Tomelleri, E.; Ciais, P.; Jung, M.; Carvalhais, N.; Rödenbeck, C.; Arain, M.A.; Baldocchi, D.; Bonan, G.B.; et al. Terrestrial gross carbon dioxide Uptake: Global Distribution and Covariation with Climate. Science 2010, 329, 834–839. [Google Scholar] [CrossRef] [PubMed]
  10. MEA (Millenium Ecosystem Assessment). Ecosystems and Human Well-Being: Current State and Trends; Island Press: Washington, DC, USA, 2005; p. 47. [Google Scholar]
  11. Chave, J.; Andalo, C.; Brown, S.; Cairns, M.A.; Chambers, J.Q.; Eamus, D.; Fölster, H.; Fromard, F.; Higuchi, N.; Kira, T.; et al. Tree allometry and improved estimation of carbon stocks and balance in tropical forests. Oecologia 2005, 145, 87–99. [Google Scholar] [CrossRef] [PubMed]
  12. Chave, J.; Réjou-Méchain, M.; Búrquez, A.; Chidumayo, E.; Colgan, M.S.; Delitti, W.B.C.; Duque, A.; Eid, T.; Fearnside, P.M.; Goodman, R.C.; et al. Improved allometric models to estimate the aboveground biomass of tropical trees. Glob. Chang. Biol. 2014, 20, 3177–3190. [Google Scholar] [CrossRef] [PubMed]
  13. Mucina, L.; Rutherford, M.C. The Vegetation of South Africa, Lesotho and Swaziland; Mucina, L., Rutherford, M.C., Eds.; South African National Biodiversity Institute: Pretoria, South Africa, 2006. [Google Scholar]
  14. Geldenhuys, C.J. Tropical Secondary Forest Management in Africa: Reality and Perspectives; Food and Agriculture Organization: Rome, Italy, 2002. [Google Scholar]
  15. Jose, S.; Bardhan, S. Agroforestry for biomass production and carbon sequestration: An overview. Agrofor. Syst. 2012, 86, 105–111. [Google Scholar] [CrossRef]
  16. Dovey, S.B. Estimating biomass and macronutrient content of some commercially important plantation species in South Africa. South. For. 2009, 71, 245–251. [Google Scholar] [CrossRef]
  17. Phiri, D.; Ackerman, P.; Wessels, B.; du Toit, B.; Johansson, M.; Säll, H.; Lundqvist, S.-O.; Seifert, T. Biomass equations for selected drought-tolerant eucalypts in South Africa. South. For. 2015, 77, 255–262. [Google Scholar] [CrossRef]
  18. Du Toit, B. Effects of site management on growth, biomass partitioning and light use efficiency in a young stand of Eucalyptus grandis in South Africa. For. Ecol. Manag. 2008, 255, 2324–2336. [Google Scholar] [CrossRef]
  19. Colgan, M.S.; Asner, G.P.; Swemmer, T. Harvesting tree biomass at the stand level to assess the accuracy of field and airborne biomass estimation in savannas. Ecol. Appl. 2013, 23, 1170–1184. [Google Scholar] [CrossRef] [PubMed]
  20. Lung, M.; Espira, A. The influence of stand variables and human use on biomass and carbon stocks of a transitional African forest: Implications for forest carbon projects. For. Ecol. Manag. 2015, 351, 36–46. [Google Scholar] [CrossRef]
  21. Magalhães, T.M.; Seifert, T. Estimation of tree biomass, carbon stocks, and error propagation in Mecrusse Woodlands. Open J. For. 2015, 5, 471–488. [Google Scholar] [CrossRef]
  22. Seifert, T.; Seifert, S. Modelling and simulation of tree biomass. In Bioenergy from Wood; Seifert, T., Ed.; Springer Netherlands: Dordrecht, The Netherlands, 2014; pp. 43–65. [Google Scholar]
  23. Kunneke, A.; van Aardt, J.; Roberts, W.; Seifert, T. Localisation of biomass potentials. In Bioenergy from Wood; Seifert, T., Ed.; Springer Netherlands: Dordrecht, The Netherlands, 2014; pp. 11–41. [Google Scholar]
  24. Picard, N.; Rutishauser, E.; Ploton, P.; Ngomanda, A.; Henry, M. Should tree biomass allometry be restricted to power models? For. Ecol. Manag. 2015, 353, 156–163. [Google Scholar] [CrossRef]
  25. Day, M.; Baldauf, C.; Rutishauser, E.; Sunderland, T.C.H. Relationships between tree species diversity and above-ground biomass in Central African rainforests: Implications for REDD. Environ. Conserv. 2014, 41, 64–72. [Google Scholar] [CrossRef]
  26. Sharma, C.M.; Baduni, N.P.; Gairola, S.; Ghildiyal, S.K.; Suyal, S. Tree diversity and carbon stocks of some major forest types of Garhwal Himalaya, India. For. Ecol. Manag. 2010, 260, 2170–2179. [Google Scholar] [CrossRef]
  27. Poorter, L.; van der Sande, M.T.; Thompson, J.; Arets, E.J.M.M.; Alarcón, A.; Álvarez-Sánchez, J.; Ascarrunz, N.; Balvanera, P.; Barajas-Guzmán, G.; Boit, A.; et al. Diversity enhances carbon storage in tropical forests. Glob. Ecol. Biogeogr. 2015, 24, 1314–1328. [Google Scholar] [CrossRef]
  28. Ruiz-Jaen, M.C.; Potvin, C. Can we predict carbon stocks in tropical ecosystems from tree diversity? Comparing species and functional diversity in a plantation and a natural forest. New Phytol. 2011, 189, 978–987. [Google Scholar] [CrossRef] [PubMed]
  29. Cavanaugh, K.C.; Gosnell, J.S.; Davis, S.L.; Ahumada, J.; Boundja, P.; Clark, D.B.; Mugerwa, B.; Jansen, P.A.; O’Brien, T.G.; Rovero, F.; et al. Carbon storage in tropical forests correlates with taxonomic diversity and functional dominance on a global scale. Glob. Ecol. Biogeogr. 2014, 23, 563–573. [Google Scholar] [CrossRef]
  30. White, F. The Vegetation Map of Africa; Unesco: Paris, France, 1983. [Google Scholar]
  31. Cooper, K.H. The Conservation Status of Indigenous Forests in Transvaal, Natal, and O.F.S., South Africa; Wildlife Society of South Africa, Conservation Division: Durban, South Africa, 1985. [Google Scholar]
  32. Van Laar, A.; Akça, A. Forest Mensuration; Springer Netherlands: Dordrecht, The Netherlands, 2007. [Google Scholar]
  33. Zuur, A.F.; Ieno, E.N.; Walker, N.; Saveliev, A.A.; Smith, G.M. Mixed Effects Models and Extensions in Ecology with R; Springer New York: New York, NY, USA, 2009. [Google Scholar]
  34. Sileshi, G.W. A critical review of forest biomass estimation models, common mistakes and corrective measures. For. Ecol. Manag. 2014, 329, 237–254. [Google Scholar] [CrossRef]
  35. Fayolle, A.; Doucet, J.-L.; Gillet, J.-F.; Bourland, N.; Lejeune, P. Tree allometry in Central Africa: Testing the validity of pantropical multi-species allometric equations for estimating biomass and carbon stocks. For. Ecol. Manag. 2013, 305, 29–37. [Google Scholar] [CrossRef]
  36. Dumont, C.; Mentré, F.; Gaynor, C.; Brendel, K.; Gesson, C.; Chenel, M. Optimal sampling times for a drug and its metabolite using SIMCYP(®) simulations as prior information. Clin. Pharmacokinet. 2013, 52, 43–57. [Google Scholar] [CrossRef] [PubMed]
  37. McCune, B.; Grace, J. Analysis of Ecological Communities; MjM Software Design: Gleneden Beach, OR, USA, 2002. [Google Scholar]
  38. Baskerville, G.L. Use of logarithmic regression in the estimation of plant biomass. Can. J. For. Res. 1972, 2, 49–53. [Google Scholar] [CrossRef]
  39. Zanne, A.E.; Lopez-Gonzalez, G.; Coomes, D.A.; Ilic, J.; Jansen, S.; Lewis, S.L.; Miller, R.B.; Swenson, N.G.; Wiemann, M.C.; Chave, J. Data from: Towards a worldwide wood economics spectrum. Dryad Digit. Repos. 2009. [Google Scholar] [CrossRef]
  40. Chave, J.; Coomes, D.; Jansen, S.; Lewis, S.L.; Swenson, N.G.; Zanne, A.E. Towards a worldwide wood economics spectrum. Ecol. Lett. 2009, 12, 351–366. [Google Scholar] [CrossRef] [PubMed]
  41. Stegen, J.C.; Swenson, N.G.; Valencia, R.; Enquist, B.J.; Thompson, J. Above-ground forest biomass is not consistently related to wood density in tropical forests. Glob. Ecol Biogeogr. 2009, 18, 617–625. [Google Scholar] [CrossRef]
  42. Reque, J.; Bravo, F. Identifying forest structure types using National Forest Inventory Data: The case of sessile oak forest in the Cantabrian range. Investig. Agrar. Sist. Recur. For. 2008, 17, 105–113. [Google Scholar] [CrossRef]
  43. Mensah, S.; Houehanou, T.D.; Sogbohossou, E.A.; Assogbadjo, A.E.; Glèlè Kakaï, R. Effect of human disturbance and climatic variability on the population structure of Afzelia africana Sm. ex pers. (Fabaceae–Caesalpinioideae) at country broad-scale (Bénin, West Africa). S. Afr. J. Bot. 2014, 95, 165–173. [Google Scholar] [CrossRef]
  44. Curtis, J.T.; McIntosh, R.P. An upland forest continuum in the prairie-forest border region of Wisconsin. Ecology 1951, 32, 476–496. [Google Scholar] [CrossRef]
  45. Chave, J.; Muller-Landau, H.C.; Baker, T.R.; Easdale, T.A.; ter Steege, H.; Webb, C.O. Regional and phylogenetic variation of wood density across 2456 neotropical tree species. Ecol. Appl. 2006, 16, 2356–2367. [Google Scholar] [CrossRef]
  46. Wright, S.J.; Kitajima, K.; Kraft, N.J.B.; Reich, P.B.; Wright, I.J.; Bunker, D.E.; Condit, R.; Dalling, J.W.; Davies, S.J.; Díaz, S.; et al. Functional traits and the growth-mortality trade-off in tropical trees. Ecology 2010, 91, 3664–3674. [Google Scholar] [CrossRef] [PubMed]
  47. Poorter, H.; Niklas, K.J.; Reich, P.B.; Oleksyn, J.; Poot, P.; Mommer, L. Biomass allocation to leaves, stems and roots: Meta-analyses of interspecific variation and environmental control. New Phytol. 2012, 193, 30–50. [Google Scholar] [CrossRef] [PubMed]
  48. Mensah, S.; Glèlè Kakaï, R.; Seifert, T. Patterns of biomass allocation between foliage and woody structure: The effects of tree size and specific functional traits. Ann. For. Res. 2016, in press. [Google Scholar]
  49. Ebuy, J.; Lokombe, J.P.; Ponette, Q.; Sonwa, D.; Picard, N. Allometric equation for predicting aboveground biomass of three tree species. J. Trop. For. Sci. 2011, 23, 125–132. [Google Scholar]
  50. Deans, J.D.; Moran, J.; Grace, J. Biomass relationships for tree species in regenerating semi-deciduous tropical moist forest in Cameroon. For. Ecol. Manag. 1996, 88, 215–225. [Google Scholar] [CrossRef]
  51. Henry, M.; Besnard, A.; Asante, W.A.; Eshun, J.; Adu-Bredu, S.; Valentini, R.; Bernoux, M.; Saint-André, L. Wood density, phytomass variations within and among trees, and allometric equations in a tropical rainforest of Africa. For. Ecol. Manag. 2010, 260, 1375–1388. [Google Scholar] [CrossRef]
  52. Segura, M.; Kanninen, M. Allometric models for tree volume and total aboveground biomass in a tropical humid forest in Costa Rica. Biotropica 2005, 37, 2–8. [Google Scholar] [CrossRef]
  53. Ngomanda, A.; Engone Obiang, N.L.; Lebamba, J.; Moundounga Mavouroulou, Q.; Gomat, H.; Mankou, G.S.; Loumeto, J.; Midoko Iponga, D.; Kossi Ditsouga, F.; Zinga Koumba, R.; et al. Site-specific versus pantropical allometric equations: Which option to estimate the biomass of a moist central African forest? For. Ecol. Manag. 2014, 312, 1–9. [Google Scholar] [CrossRef]
  54. Henry, M.; Picard, N.; Trotta, C.; Manlay, R.J.; Valentini, R.; Bernoux, M.; Saint-André, L. Estimating tree biomass of sub-Saharan African forests: A review of available allometric equations. Silva Fenn. 2011, 45, 477–569. [Google Scholar] [CrossRef]
  55. Garber, S.M.; Temesgen, H.; Monleon, V.J.; Hann, D.W. Effects of height imputation strategies on stand volume estimation. Can. J. For. Res. 2009, 39, 681–690. [Google Scholar] [CrossRef]
  56. Temesgen, H.; Affleck, D.; Poudel, K.; Gray, A.; Sessions, J. A review of the challenges and opportunities in estimating above ground forest biomass using tree-level models. Scand. J. For. Res. 2015, 30, 326–335. [Google Scholar] [CrossRef]
  57. Falster, D.S. Sapling strength and safety: The importance of wood density in tropical forests. New Phytol. 2006, 171, 237–239. [Google Scholar] [CrossRef] [PubMed]
  58. Preece, N.D.; Lawes, M.J.; Rossman, A.K.; Curran, T.J.; van Oosterzee, P. Modelling the growth of young rainforest trees for biomass estimates and carbon sequestration accounting. For. Ecol. Manag. 2015, 351, 57–66. [Google Scholar] [CrossRef]
  59. Suzuki, E. Diversity in specific gravity and water content of wood among Bornean tropical rainforest trees. Ecol. Res. 1999, 14, 211–224. [Google Scholar] [CrossRef]
  60. Houghton, R.A.; Lawrence, K.T.; Hackler, J.L.; Brown, S. The spatial distribution of forest biomass in the Brazilian Amazon: A comparison of estimates. Glob. Chang. Biol. 2001, 7, 731–746. [Google Scholar] [CrossRef]
  61. Lewis, S.L.; Sonké, B.; Sunderland, T.; Begne, S.K.; Lopez-Gonzalez, G.; van der Heijden, G.M.F.; Phillips, O.L.; Affum-Baffoe, K.; Baker, T.R.; Banin, L.; et al. Above-ground biomass and structure of 260 African tropical forests. Philos. Trans. R. Soc. B 2013, 368. [Google Scholar] [CrossRef] [PubMed] [Green Version]
  62. Fischer, R.; Ensslin, A.; Rutten, G.; Fischer, M.; Schellenberger Costa, D.; Kleyer, M.; Hemp, A.; Paulick, S.; Huth, A. Simulating carbon stocks and fluxes of an African Tropical Montane Forest with an Individual-Based Forest Model. PLoS ONE 2015, 10, e0123300. [Google Scholar] [CrossRef] [PubMed]
  63. Baccini, A.; Laporte, N.; Goetz, S.J.; Sun, M.; Dong, H. A first map of tropical Africa’s above-ground biomass derived from satellite imagery. Environ. Res. Lett. 2008, 3. [Google Scholar] [CrossRef]
  64. Geldenhuys, C.J. Native forest regeneration in pine and eucalypt plantations in Northern Province, South Africa. For. Ecol. Manag. 1997, 99, 101–115. [Google Scholar] [CrossRef]
  65. Wu, X.; Wang, X.; Tang, Z.; Shen, Z.; Zheng, C.; Xia, X.; Fang, J. The relationship between species richness and biomass changes from boreal to subtropical forests in China. Ecography 2015, 38, 602–613. [Google Scholar] [CrossRef]
  66. Ruiz-Benito, P.; Gómez-Aparicio, L.; Paquette, A.; Messier, C.; Kattge, J.; Zavala, M.A. Diversity increases carbon storage and tree productivity in Spanish forests. Glob. Ecol. Biogeogr. 2014, 23, 311–322. [Google Scholar] [CrossRef]
  67. Tilman, D.; Knops, J.; Wedin, D.; Reich, P.; Ritchie, M.; Siemann, E. The influence of functional diversity and composition on ecosystem processes. Science 1997, 277, 1300–1302. [Google Scholar] [CrossRef]
  68. Chave, J.; Condit, R.; Lao, S.; Caspersen, J.P.; Foster, R.B.; Hubbell, S.P. Spatial and temporal variation of biomass in a tropical forest: Results from a large census plot in Panama. J. Ecol. 2003, 91, 240–252. [Google Scholar] [CrossRef]
  69. Slik, J.W.F.; Aiba, S.I.; Brearley, F.Q.; Cannon, C.H.; Forshed, O.; Kitayama, K.; Nagamasu, H.; Nilus, R.; Payne, J.; Paoli, G.; et al. Environmental correlates of tree biomass, basal area, wood specific gravity and stem density gradients in Borneo’s tropical forests. Glob. Ecol. Biogeogr. 2010, 19, 50–60. [Google Scholar] [CrossRef]
  70. Seifert, T.; Seifert, S.; Seydack, A.; Durheim, G.; von Gadow, K. Competition effects in an afrotemperate forest. For. Ecosyst. 2014, 1. [Google Scholar] [CrossRef]
  71. Hernández-Barrios, J.C.; Anten, N.P.R.; Martínez-Ramos, M. Sustainable harvesting of non-timber forest products based on ecological and economic criteria. J. Appl. Ecol. 2014, 52, 389–401. [Google Scholar] [CrossRef]
Figure 1. Variation of wood density (g/cm3) among study species.
Forests 07 00079 g001
Figure 2. Variation of height and aboveground biomass (AGB) according to tree diameter.
Forests 07 00079 g002
Figure 3. Residuals vs. predicted values and observed vs. predicted values of total height (Equation (2)). Original units are in metres.
Forests 07 00079 g003
Figure 4. Residuals vs. predicted values and observed vs. predicted values of aboveground biomass (AGB). Values are predicted from Equation (5). Original units are in kilograms of dry mass.
Forests 07 00079 g004
Figure 5. Bivariate relationships between aboveground carbon (AGC) and stand variables.
Forests 07 00079 g005
Table 1. Descriptive summary (minimum and maximum values) of characteristics of measured tree species.
SpeciesNumber of TreesDBH (cm)Height (m)Wood Density (g/cm3)AGB (Kg)
C. kraussii161.5–91.03.1–24.20.51–0.660.26–4590.19
C. sylvaticus144.8–64.05.4–28.00.38–0.504.17–5127.94
S. gerrardii150.7–92.52.3–22.10.51–0.650.17–3423.33
T. dregeana142.8–62.04.4–27.00.35–0.550.82–2357.97
Table 2. Results of the generalised linear models showing the effects of species and size on the aboveground biomass (AGB).
EstimateStd. Errort ValuePr(>|t|)
(Intercept)−1.9630.252−7.7910.000
Tree sizeln (DBH)2.3650.07930.036<0.001
SpeciesC. sylvaticus−0.9580.439−2.1830.034
S. gerrardii0.4030.3221.2540.215
T. dregeana−0.4650.402−1.1550.253
Tree size: Speciesln (DBH): C. sylvaticus0.3090.1352.2880.026
ln (DBH): S. gerrardii−0.1320.101−1.3050.198
ln (DBH): T. dregeana0.0810.1250.6440.523
Table 3. Multispecies DBH-height and aboveground biomass (AGB) equations with coefficient estimates and statistic fits. SE: Standard Error; R2: Adjusted R Square; VIF: Variance Inflation Factor; RSE: Residual Standard Error; RMSE: Root Mean Squared Error; MAD: Mean Absolute Deviation; AIC: Akaike Information Criterion and CF: Correction Factors.
Models PredictorsParameterEstimateSEpR2VIFRSERMSEMADAICCF
HeightEquation (2)Interceptln (β0)1.010.03<0.00183.81-0.181---1.016
DBHβ10.510.01<0.001
AGBEquation (3)Interceptln (β0)−1.890.25<0.00197.60-0.3040.2966.7830.4901.047
Wood densityβ10.370.260.159 1.005
DBHβ22.410.05<0.001 1.005
Equation (4)Interceptln (β0)−2.840.27<0.00198.44 0.2450.2364.757.2301.030
Wood densityβ10.750.220.001 1.115
DBHβ21.810.12<0.001 8.105
Heightβ31.140.21<0.001 8.086
Equation (5)Interceptln (β0)−2.690.21<0.00198.45 0.2440.2373.326.0741.030
Wood densityβ10.690.210.002 1.002
DBH2 × Heightβ20.950.02<0.001 1.002
Height (m); DBH (cm); Wood density (g/cm3) and AGB (kg).

