Article

Population Structure and Genetic Relationships of Melia Taxa in China Assayed with Sequence-Related Amplified Polymorphism (SRAP) Markers

1
College of Forestry and Landscape Architecture, South China Agricultural University, Guangzhou, Guangdong 510642, China
2
Guangdong Key Laboratory for Innovative Development and Utilization of Forest Plant Germplasm, Guangzhou, Guangdong 510642, China
3
State Key Laboratory for Conservation and Utilization of Subtropical Agro-Bioresources, Guangzhou, Guangdong 510642, China
*
Author to whom correspondence should be addressed.
Forests 2016, 7(4), 81; https://doi.org/10.3390/f7040081
Submission received: 21 January 2016 / Revised: 29 March 2016 / Accepted: 1 April 2016 / Published: 6 April 2016

Abstract

:
The uncertainty about whether, in China, the genus Melia (Meliaceae) consists of one species (M. azedarach Linnaeus) or two species (M. azedarach and M. toosendan Siebold & Zuccarini) remains to be clarified. Although the two putative species are morphologically distinguishable, genetic evidence supporting their taxonomic separation is lacking. Here, we investigated the genetic diversity and population structure of 31 Melia populations across the natural distribution range of the genus in China. We used sequence-related amplified polymorphism (SRAP) markers and obtained 257 clearly defined bands amplified by 20 primers from 461 individuals. The polymorphic loci (P) varied from 35.17% to 76.55%, with an overall mean of 58.24%. Nei’s gene diversity (H) ranged from 0.13 to 0.31, with an overall mean of 0.20. Shannon’s information index (I) ranged from 0.18 to 0.45, with an average of 0.30. The genetic diversity of the total population (Ht) and within populations (Hs) was 0.37 ± 0.01 and 0.20 ± 0.01, respectively. Population differentiation was substantial (Gst = 0.45), and gene flow was low. Of the total variation, 31.41% was explained by differences among putative species, 19.17% among populations within putative species, and 49.42% within populations. Our results support the division of genus Melia into two species, which is consistent with the classification based on the morphological differentiation.

1. Introduction

The genus Melia belongs to the order Rutales and family Meliaceae. Fossil evidence indicates that Melia could have evolved in Indochina during the Middle–Lower Miocene [1,2,3]. Melia is widely distributed in China and has a considerable economic value with respect to the development of botanical pesticides, timber, bioremediation in urban industrial districts, and a combination of forestry and agricultural uses [4,5,6,7,8,9,10,11]. However, classification of the species in Melia is still in dispute in the literature. Whether the genus Melia (Meliaceae) consists of one species (M. azedarach) or two species (M. azedarach and M. toosendan) in China is under debate. According to Flora Reipublicae Popularis Sinicae [12], both species can be morphologically distinguished. M. azedarach has 5–6 ovaries, small fruits of not more than 2 cm length, lobules with obtuse teeth, and an inflorescence length that is often similar to the leaf length. M. toosendan has 6–8 ovaries, has large fruit of not more than 3 cm, is lobular around almost the entire margin, has no obvious obtuse teeth, and has an inflorescence length of an approximately half leaf size [12]. Despite these differences, only M. azedarach was included in the Flora of China [13]. In a study of the phenological delineation of the Melia distribution area in China, all collected Melia plants were classified as M. azedarach [14]. Zhang reported that toosendanin contents in fruits of M. toosendan from China were higher than those of M. azedarach [15]. Li compared the high-performance liquid chromatography (HPLC) fingerprints of M. azedarach and M. toosendan stones and reported differences in the numbers of characteristic peaks, peak values (relative retention time), and peak areas among samples [16]. In a public letter to the editor of Toxicology, Wiart noted that M. toosendan did not exist in China and was not listed in the Flora of China, 2008 [17,18]. Therefore, a more comprehensive examination, using molecular working alongside the existing classification based on the morphological traits, is needed.
Apart from the uncertainty in species delineation, studies on population structure and genetic diversity in Melia in China have been limited due to the small sizes of local seedlots and the availability of only a few primers for DNA amplification in the species [19,20]. This could also limit the exploitation of Melia in genetics and breeding programs, as population structure and genetic diversity provide essential background information for assessing the preliminary provenance. M. azedarach is disseminated, and has become naturalized in several tropical and subtropical areas. Because of its widespread cultivation and adaptation to diverse habitats, its original distribution is to be determined [13]. M. azedarach L. is found at northern latitudes between 18° and 40° and at altitudes below 2100 m in China. It is typically distributed in mixed evergreen, broad-leaved, and deciduous forests and in sparse forests, field margins, and along roadsides [13]. Its geographic range extends from Baoding (Hebei), Yuncheng (Shanxi), and Longnan (Gansu) in the north to Ya county (Hainan) in the south, and from Taiwan and Chinese coastal provinces in the east to Chengdu (Sichuan) and Baoshan (Yunnan) in the west. Thus, it is native to about one-third of the land area of China [14]. M. azedarach is monoclinous, and the first flowers occur 2–3 years after germination. Pollination is realized via both animal agents and wind [21,22,23]. Seed dispersal is mediated by animals (e.g., birds) or by gravity [24]. Such reproductive ecology suggests that gene flow among natural populations may be limited. It is hypothesized that population differentiation in Melia will be expected to be much greater than that in conifer and oak tree species, where gene flow is primarily mediated by wind pollination.
In our genetic analysis, sequence-related amplified polymorphism (SRAP) was used to select markers because SRAP analysis is a relatively simple and highly reproducible DNA-based method. The method is used in linkage mapping and gene tagging in plants [25]. SRAP markers are PCR-based markers, with primers 17 or 18 nucleotides in length that are used to amplify open reading frames (the coding regions in genomes). It can disclose numerous co-dominant markers with a large number of polymorphic loci and allows easy isolation of bands for sequencing. These features could yield a pattern of genetic diversity and phylogenetic relationships among populations derived from mostly functional coding regions; these would differ from other molecular markers in which both coding and non-coding variations are mixed.
To clarify the taxonomic uncertainty and the population structure in Melia, we investigated populations covering the natural range of this genus in China. Thirty-one populations were sampled, including the putative species of both M. azedarach and M. toosendan. Analysis of population genetic diversity and differentiation from the coding regions (SRAP) was used to determine whether the two morphologically distinguished taxa exhibited significant population genetic divergence. The degree of population genetic diversity within each taxon was also assessed.

2. Materials and Methods

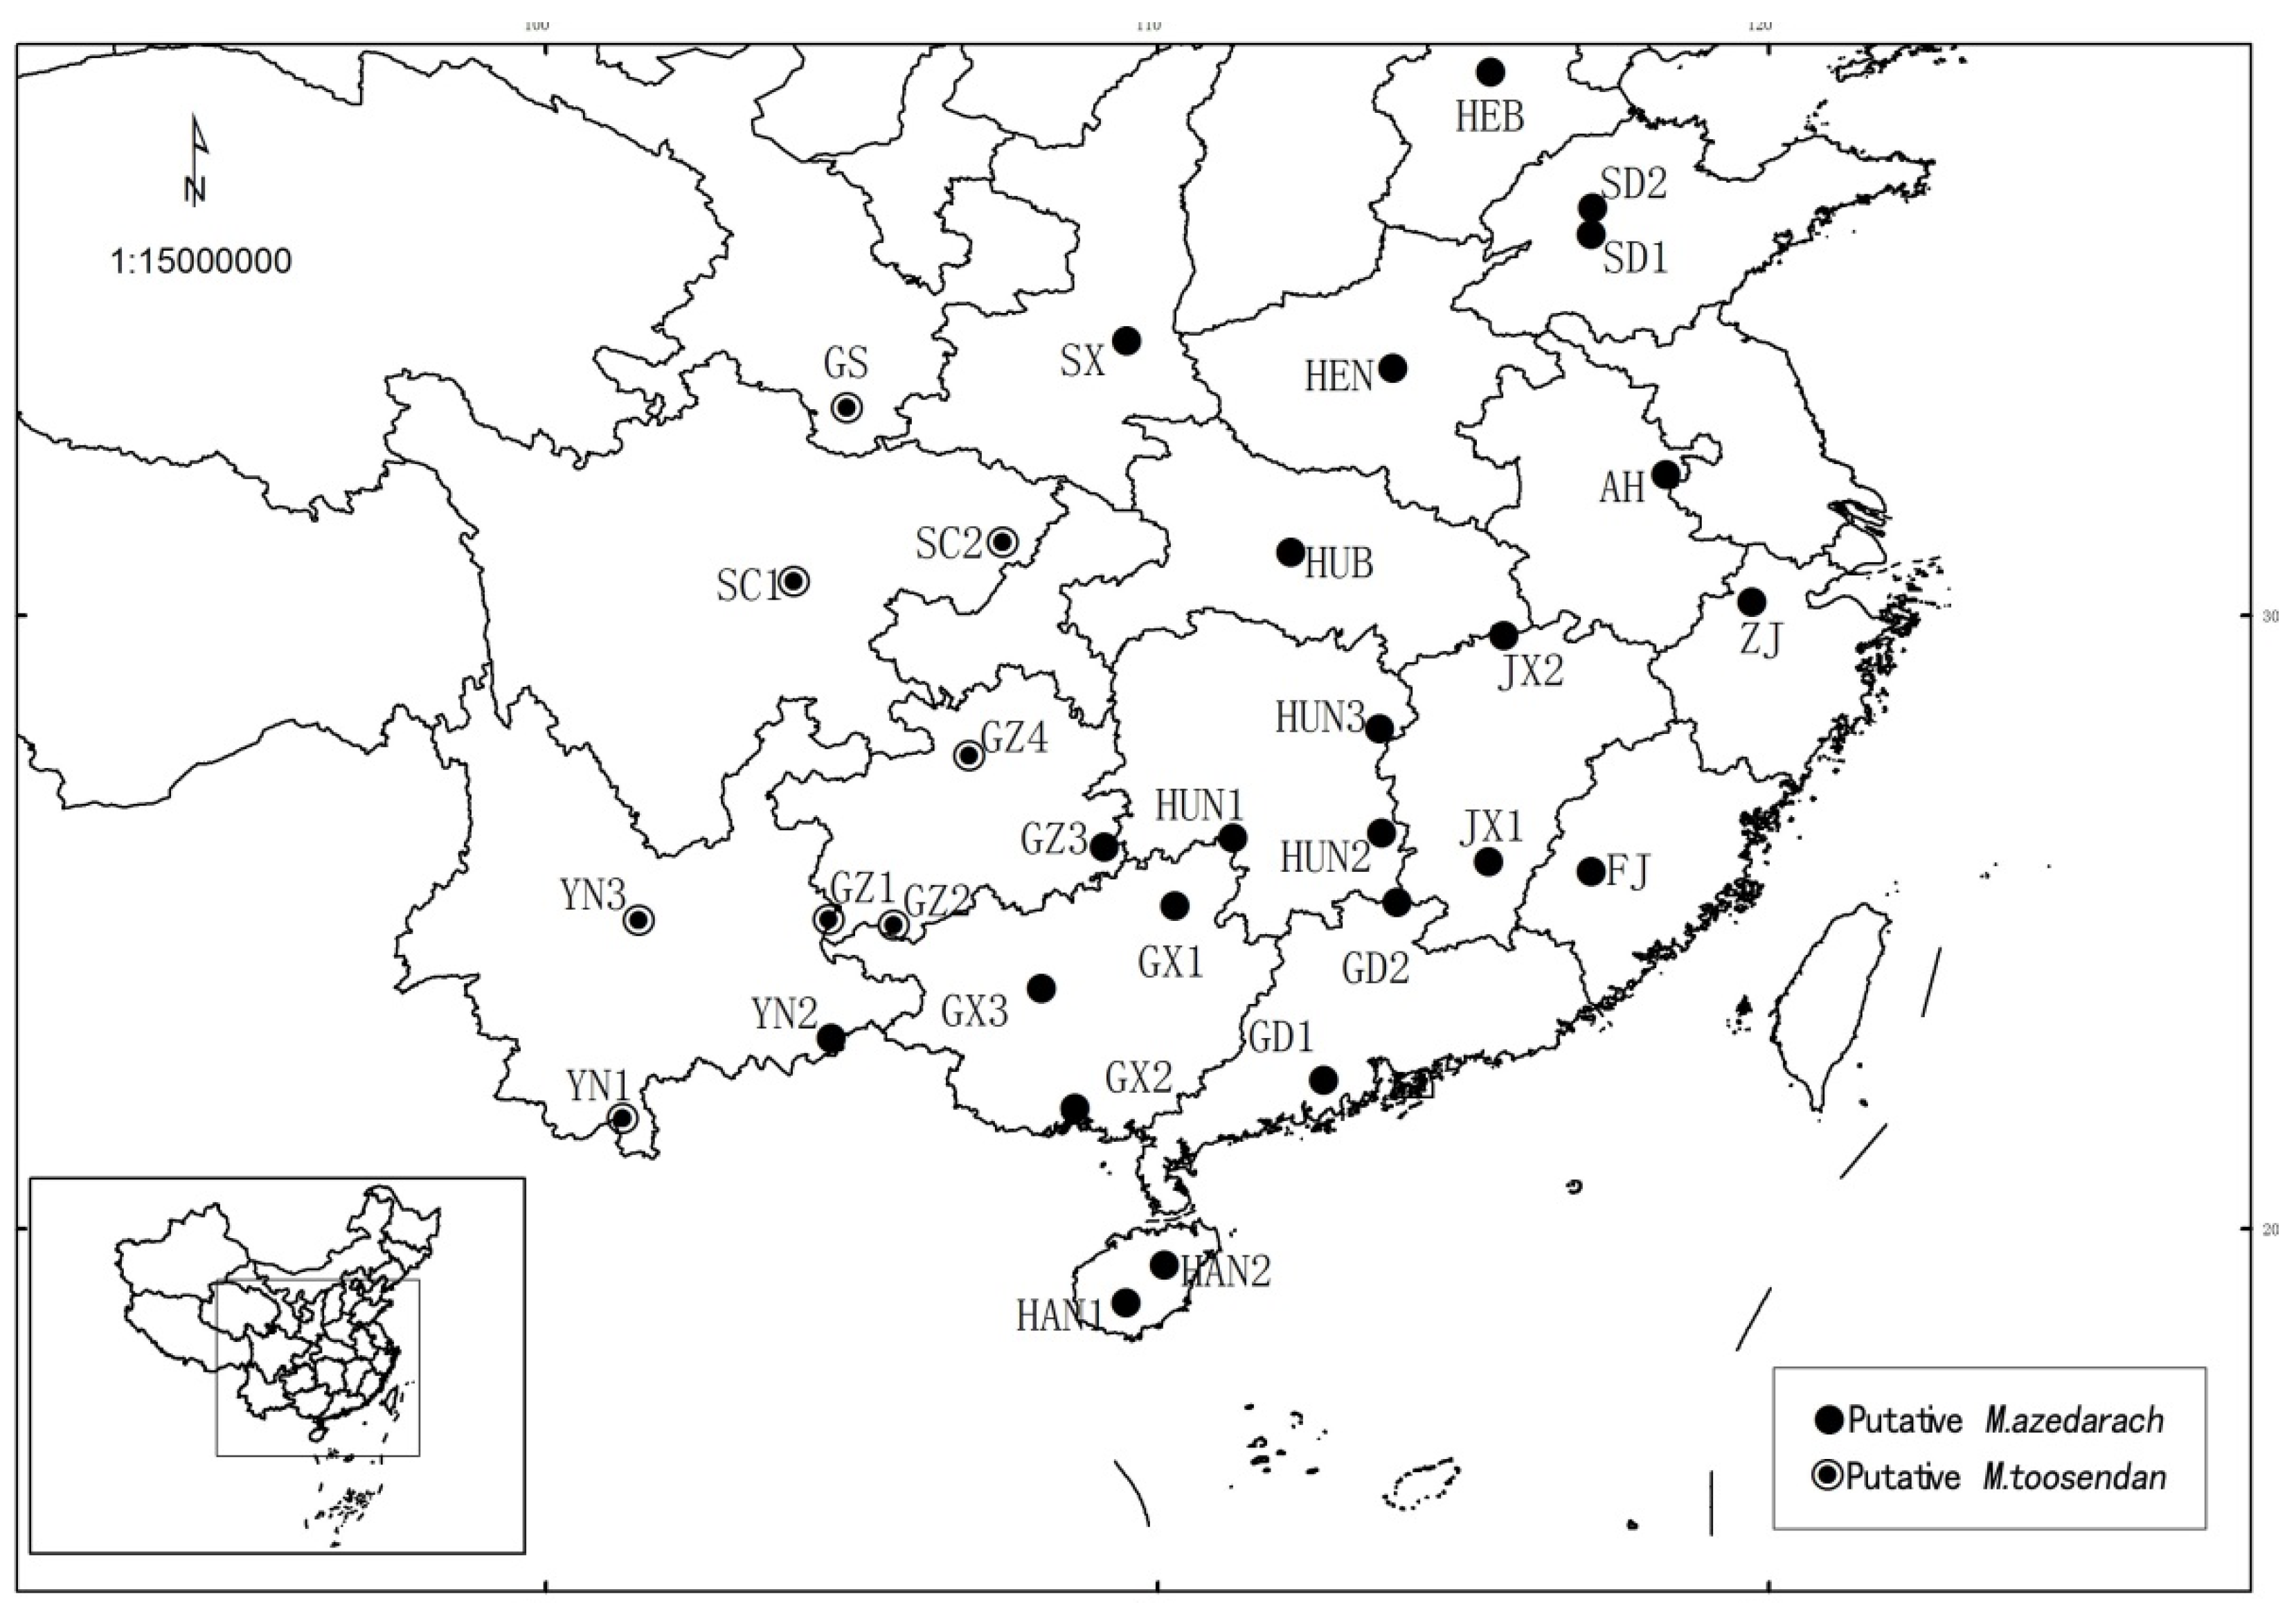
2.1. Plant Materials and DNA Extraction

Using the latitude and longitude grid sampling method, we collected seeds from 31 wild populations of Melia in 17 provinces in China. The seedlots were evenly located across the natural range of Melia in China; the population distributions are shown in Table 1. Figure 1 shows the geographic locations of the sampled populations. Within each population, sample trees were separated by at least 100 m to reduce the probability of collecting seeds derived from crosses between closely related individuals. Seeds were collected from 15 trees in each population (GS, HANI, HEN, and YN3 populations: 14 tree seeds). Seeds collected from 461 parent trees in total were coded with family numbers and were planted in 2014 at the nursery of South China Agricultural University (23.0905000 N, 113.2106000 E). One healthy plant (no diseases or insect pests) was selected randomly from each family of seedlings, and the selected 461 progeny seedlings were numbered according to their respective families. When the selected seedlings reached 40 cm in height, young leaves were collected from each plant and stored separately at −80 °C until DNA extraction.
DNA was extracted from 150 mg of leaves using the E.Z.N.A. high-performance DNA mini kit (Omega Bio-tek, Norcross, GA, USA) and separated by electrophoresis in a 1.0% agarose gel. DNA concentration was measured using a NanoDrop 1000 spectrophotometer (Thermo Fisher Scientific, Waltham, MA, USA), adjusted to 50 ng/μL, and stored at −20 °C until PCR amplification.

2.2. SRAP Analysis

SRAP analysis was performed as described by Li and Quiros [25]. All reagents and buffers were supplied by Takara Bio (Otsu, Japan). Each PCR was prepared in a 25-μL reaction mixture containing 50 ng genomic DNA, 200 μM dNTPs, 2.75 mM MgCl2, 0.4 μM of each primer, 2.5 μL PCR buffer, 0.75 U Taq DNA polymerase, and sterile double-distilled water. PCR was conducted using the following cycle profile in an Eastwin thermal cycler (EDC-810, Suzhou, China): initial denaturation at 94 °C for 5 min, followed by five cycles of denaturation for 1 min, annealing at 35 °C for 1 min, and elongation at 72 °C for 1 min, and then 35 cycles of denaturation for 1 min and annealing at 50 °C for 1 min, ending with an elongation step at 72 °C for 5 min. Samples were then stored in a refrigerator at 4 °C until use.
The ability of the 783 SRAP primer combinations (27 forward and 29 reverse primers, Table 2) to amplify eight individual plant materials from different populations was assessed. In a subsequent test of material from 16 individuals, 20 SRAP primer combinations, including 12 forward and 13 reverse primers that identified consistently reproducible polymorphisms with clearly defined bands, were used to analyze all samples. PCR products were resolved in a 6% polyacrylamide gel at 12.5 V·cm−1 for 1.5 h, and stained with silver nitrate (AgNO3) [26]. Reliable and clearly distinguishable amplified bands of 100–1500 bp were scored as either 1 (present) or 0 (absent), and a SRAP data matrix was constructed.

2.3. Data Analysis

POPGENE version 1.32 was used to analyze the genetic datasets [27]. Genetic diversity parameters included the total genetic diversity (Ht), heterozygosity within population (Hs), the proportion of polymorphic loci (P), Nei’s genetic diversity index (H), and Shannon’s information index (I) [28]. The percentage of polymorphic bands (PPB) was calculated as PPB = (K/N) × 100%, where K is the number of polymorphic bands and N is the total number of amplified bands. Population genetic differentiation (Gst) was estimated [29], and gene flow was assessed under Wright’s island model of population structure [30].
The genetic relationships and genetic structure among 31 populations were examined using different analytical approaches. Analysis of molecular variance (AMOVA) was performed using Genalex 6.5 [31] to estimate the partitioning of genetic variance between the two putative species, among populations within each putative species, and within populations. Nei’s genetic distances were used to perform a cluster analysis using the neighbor-joining method with 50,000 bootstraps replications. A dendrogram was constructed from the genetic distance [32] using the POPTREE2 software [33]. A Bayesian-based structure analysis was also carried out using STRUCTURE [34]. Population structure was evaluated for a range of values of K from 1 (testing for panmixis) to 14, and the results were interpreted following the approaches suggested by Pritchard et al. [35] and Evanno et al. [36]. Multivariate principal coordinate analysis (PCoA) was applied to evaluate genetic relationships among populations using Genalex 6.5 software (Oxford University Press, New York, NY, USA) [31].
To test the effects of geographical distance, we used Mantel’s tests to determine whether the population genetic distance is correlated with geographic distance (km) [31,37].

3. Results

3.1. Screening SRAP Primers

Of 461 individuals representing 31 Melia populations, 257 clearly defined bands were amplified using 20 combinations of 12 forward and 13 reverse primers. Of these bands, 145 (58.24%) were polymorphic. The total number of bands ranged from 4 to 26, with an average of 12.85. The number of polymorphic bands ranged from 2 to 14, with an average of 7.25 (Table 3).

3.2. Genetic Diversity Analysis

Estimates of genetic diversity are summarized in Table 4. The percentage of polymorphic loci (P) varied from 35.17% to 76.55%, with an overall mean of 58.24%. Nei’s gene diversity (H) ranged from 0.13 to 0.31, with an overall mean of 0.20. The total genetic diversity (Ht) was 0.37 ± 0.01. Shannon’s information index (I) ranged from 0.18 to 0.45, with an average of 0.30. Genetic diversity within populations (Hs) was 0.20 ± 0.01.
The population genetic diversity varied among provenances. The GZ2 population, originating from Ceheng (Guizhou), had the highest genetic diversity, followed by the populations from Dazhou (Sichuang), Liping (Guizhou), Yanling (Hunan), Longnan (Gansu), and Mengla (Yunnan). The Tunchang population from Hainan had the lowest genetic diversity, followed by Baoding (Hebei), Tai’an (Shandong), and Ling’an (Zhejiang).

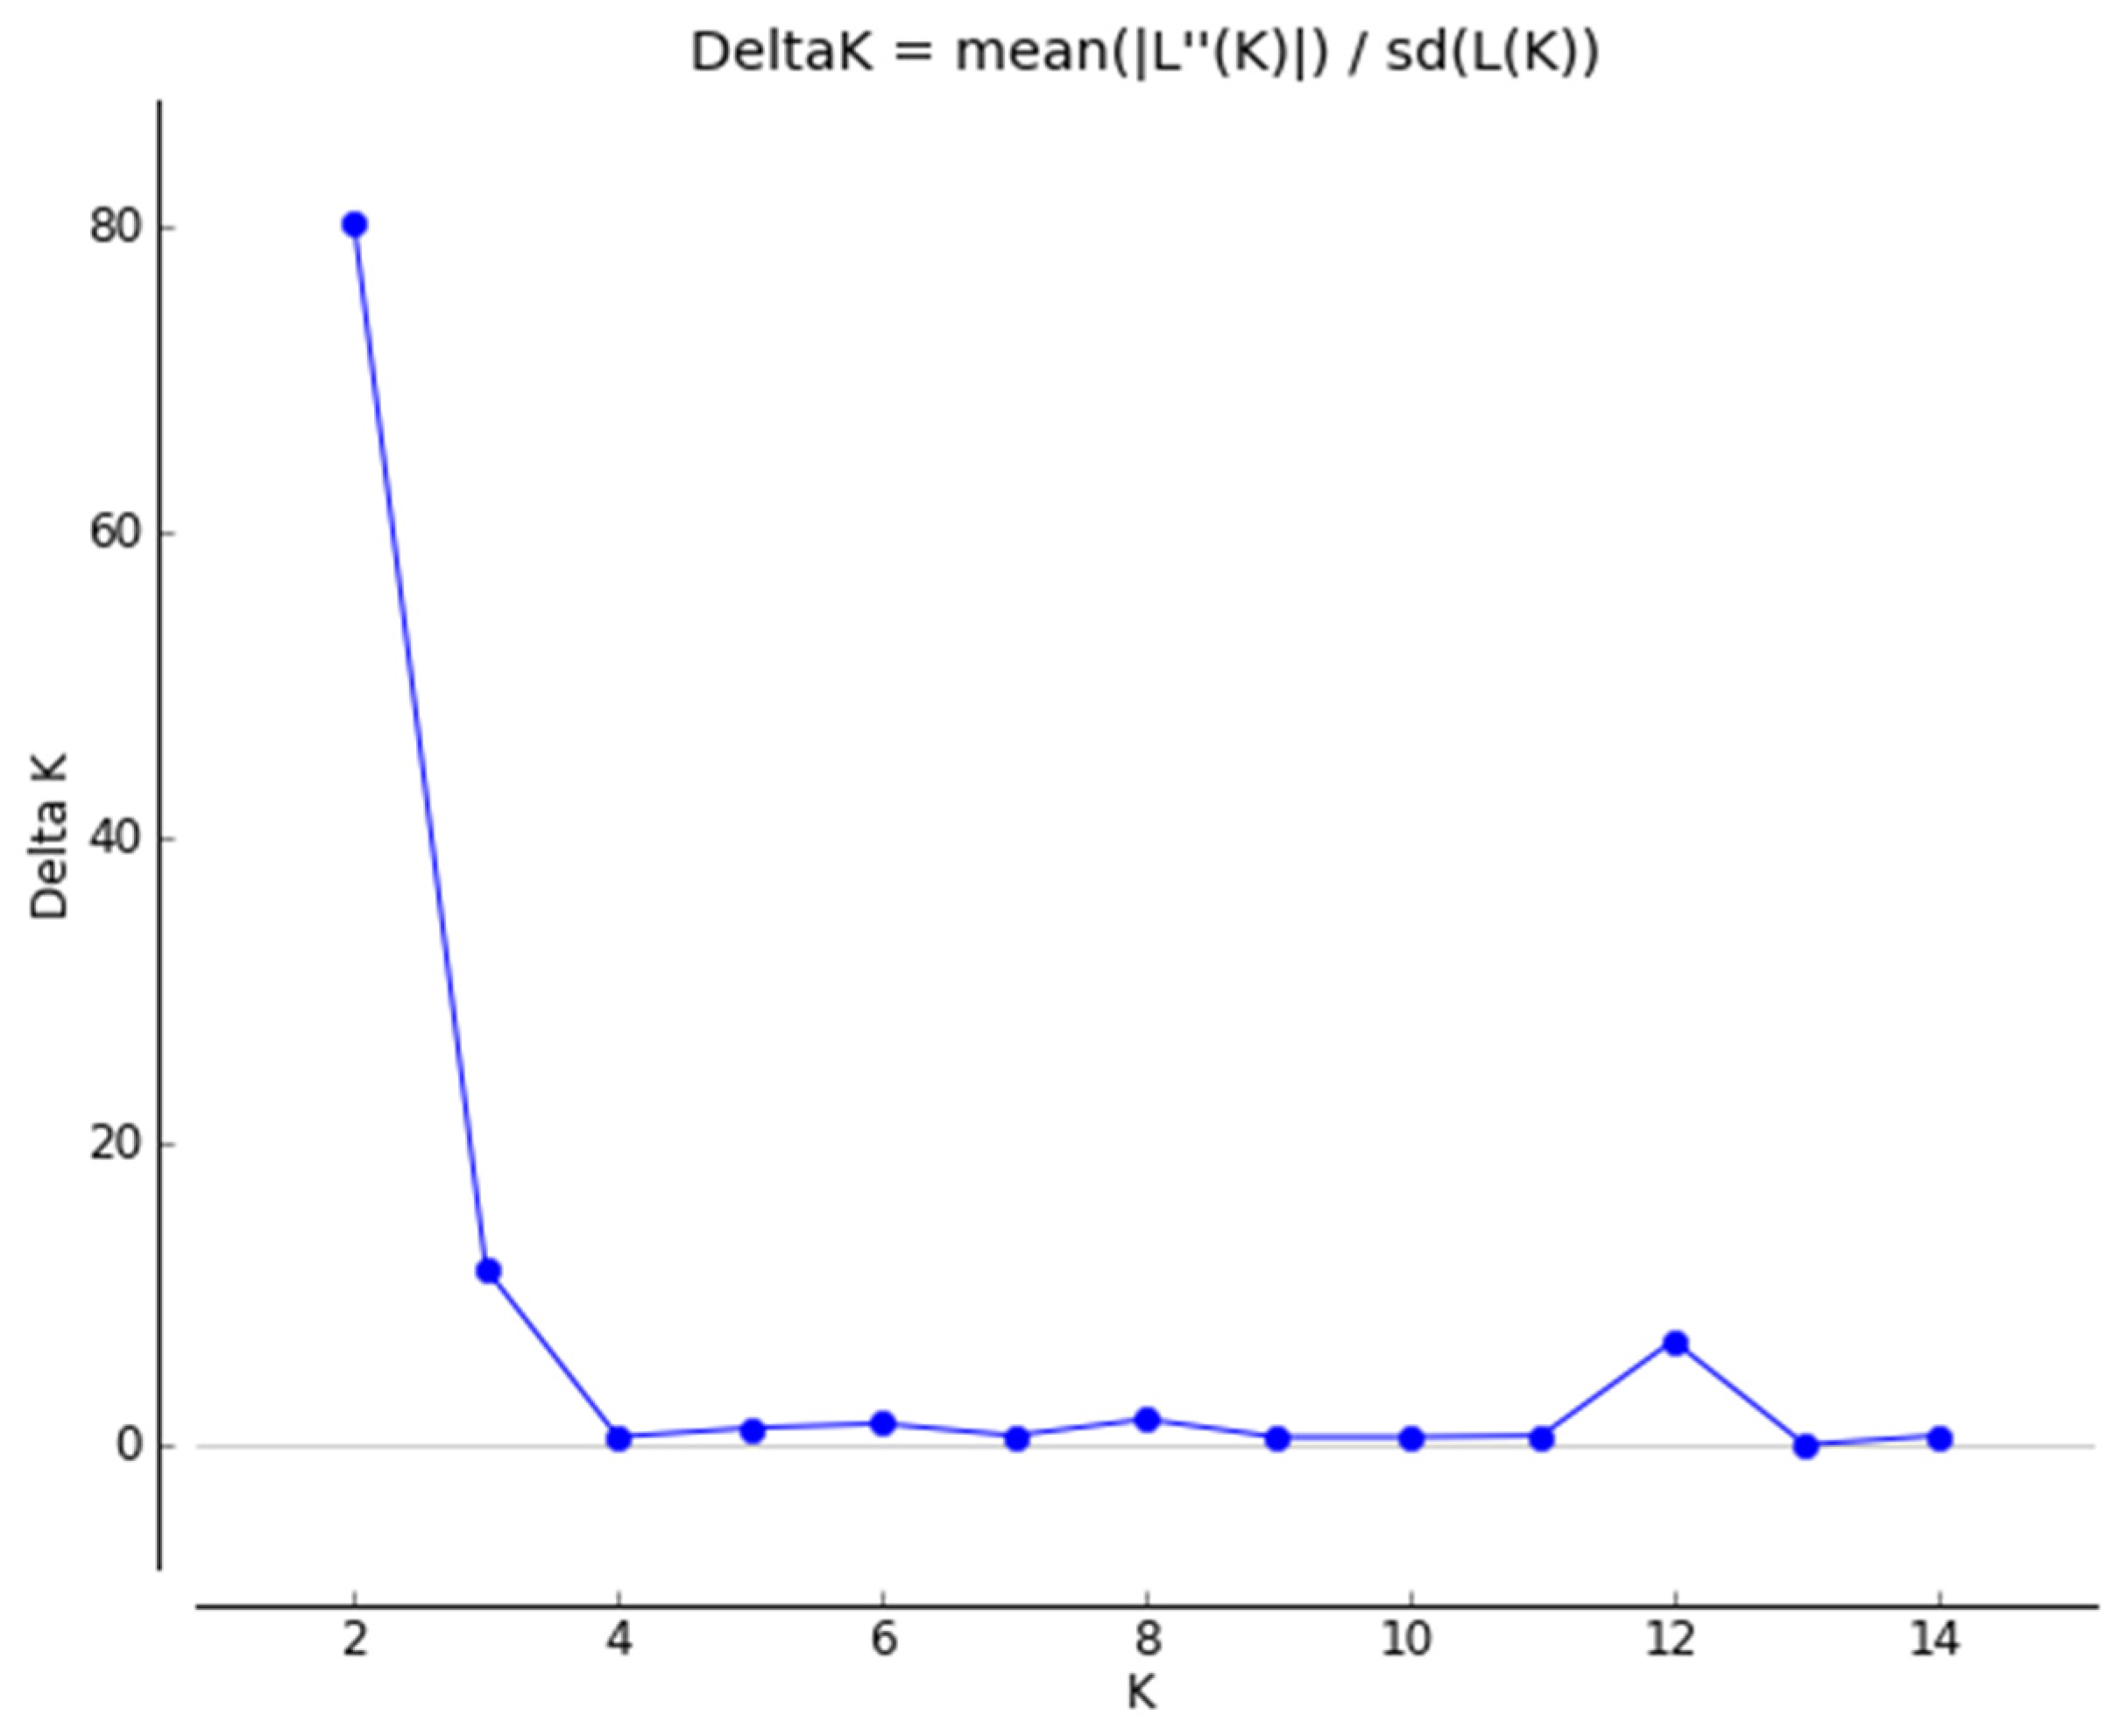
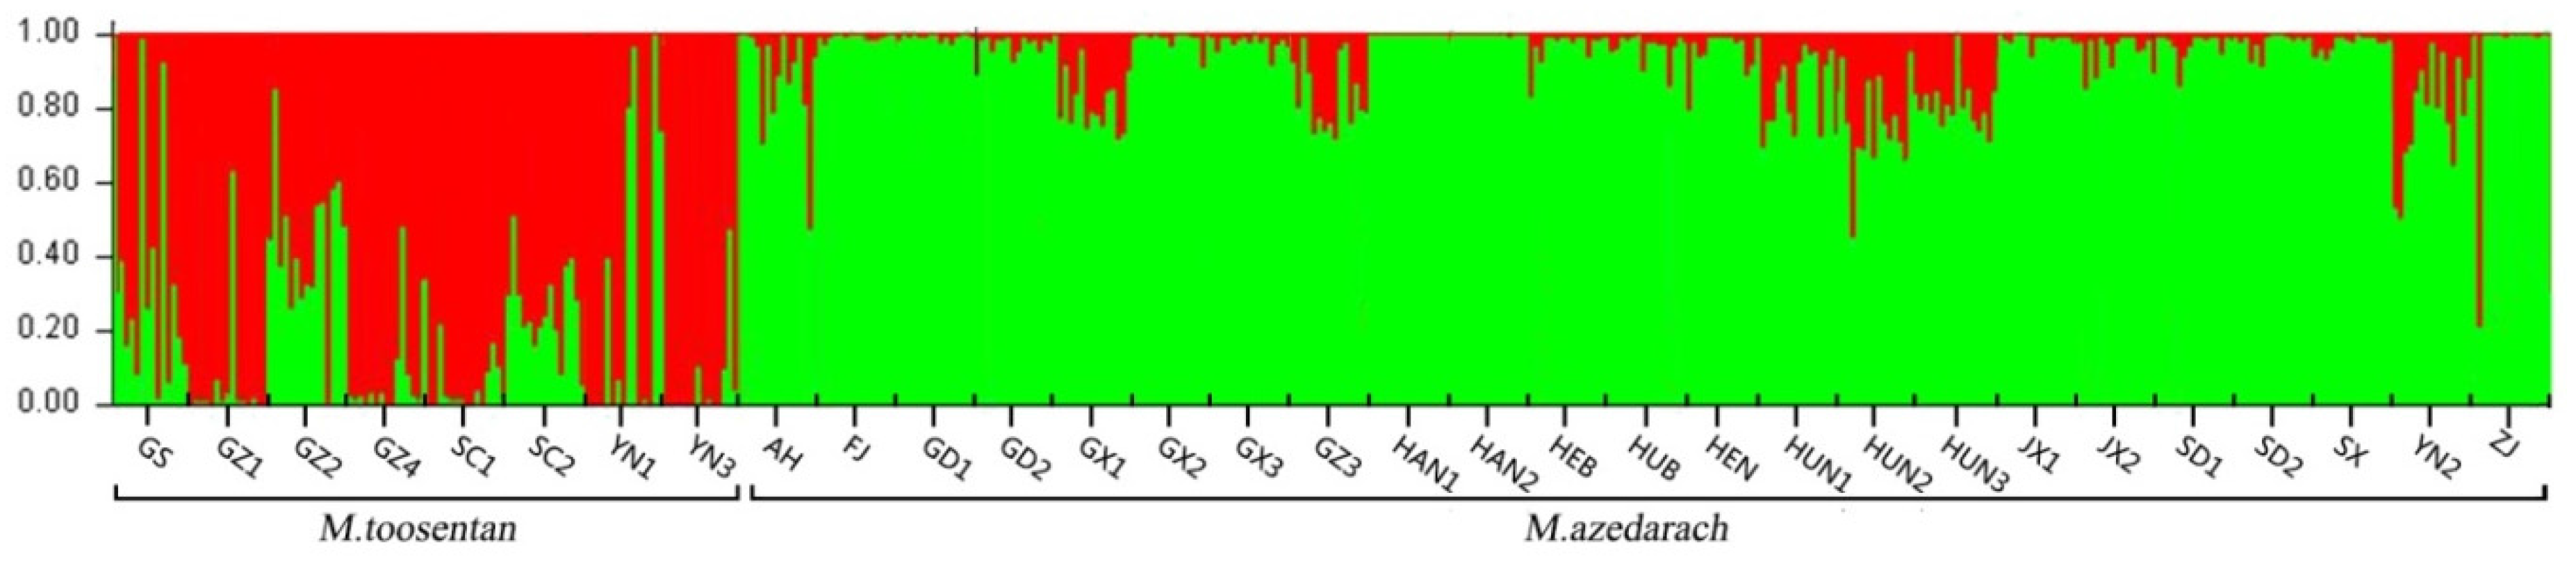
3.3. Population Structure

Population differentiation in terms of Gst was 0.45, and the average number of migrants per generation was 0.60. Figure 2 shows the results from STRUCTURE, indicating that two groups of 31 populations formed two distinct groups with the largest population differentiation. Group I included the eight populations from western China, whereas Group II consisted of the populations from southeast and south China. A considerable proportion of individuals was seen to introgress from one putative species to the other (Figure 3).
AMOVA (Table 5) indicated that 31.41% of the total variation corresponded to the variation between putative species (p-value < 0.001), 19.17% corresponded to variation among populations within putative species (Φst = 0.28, p-value < 0.001), and 49.42% corresponded to variation within populations (p-value < 0.001).

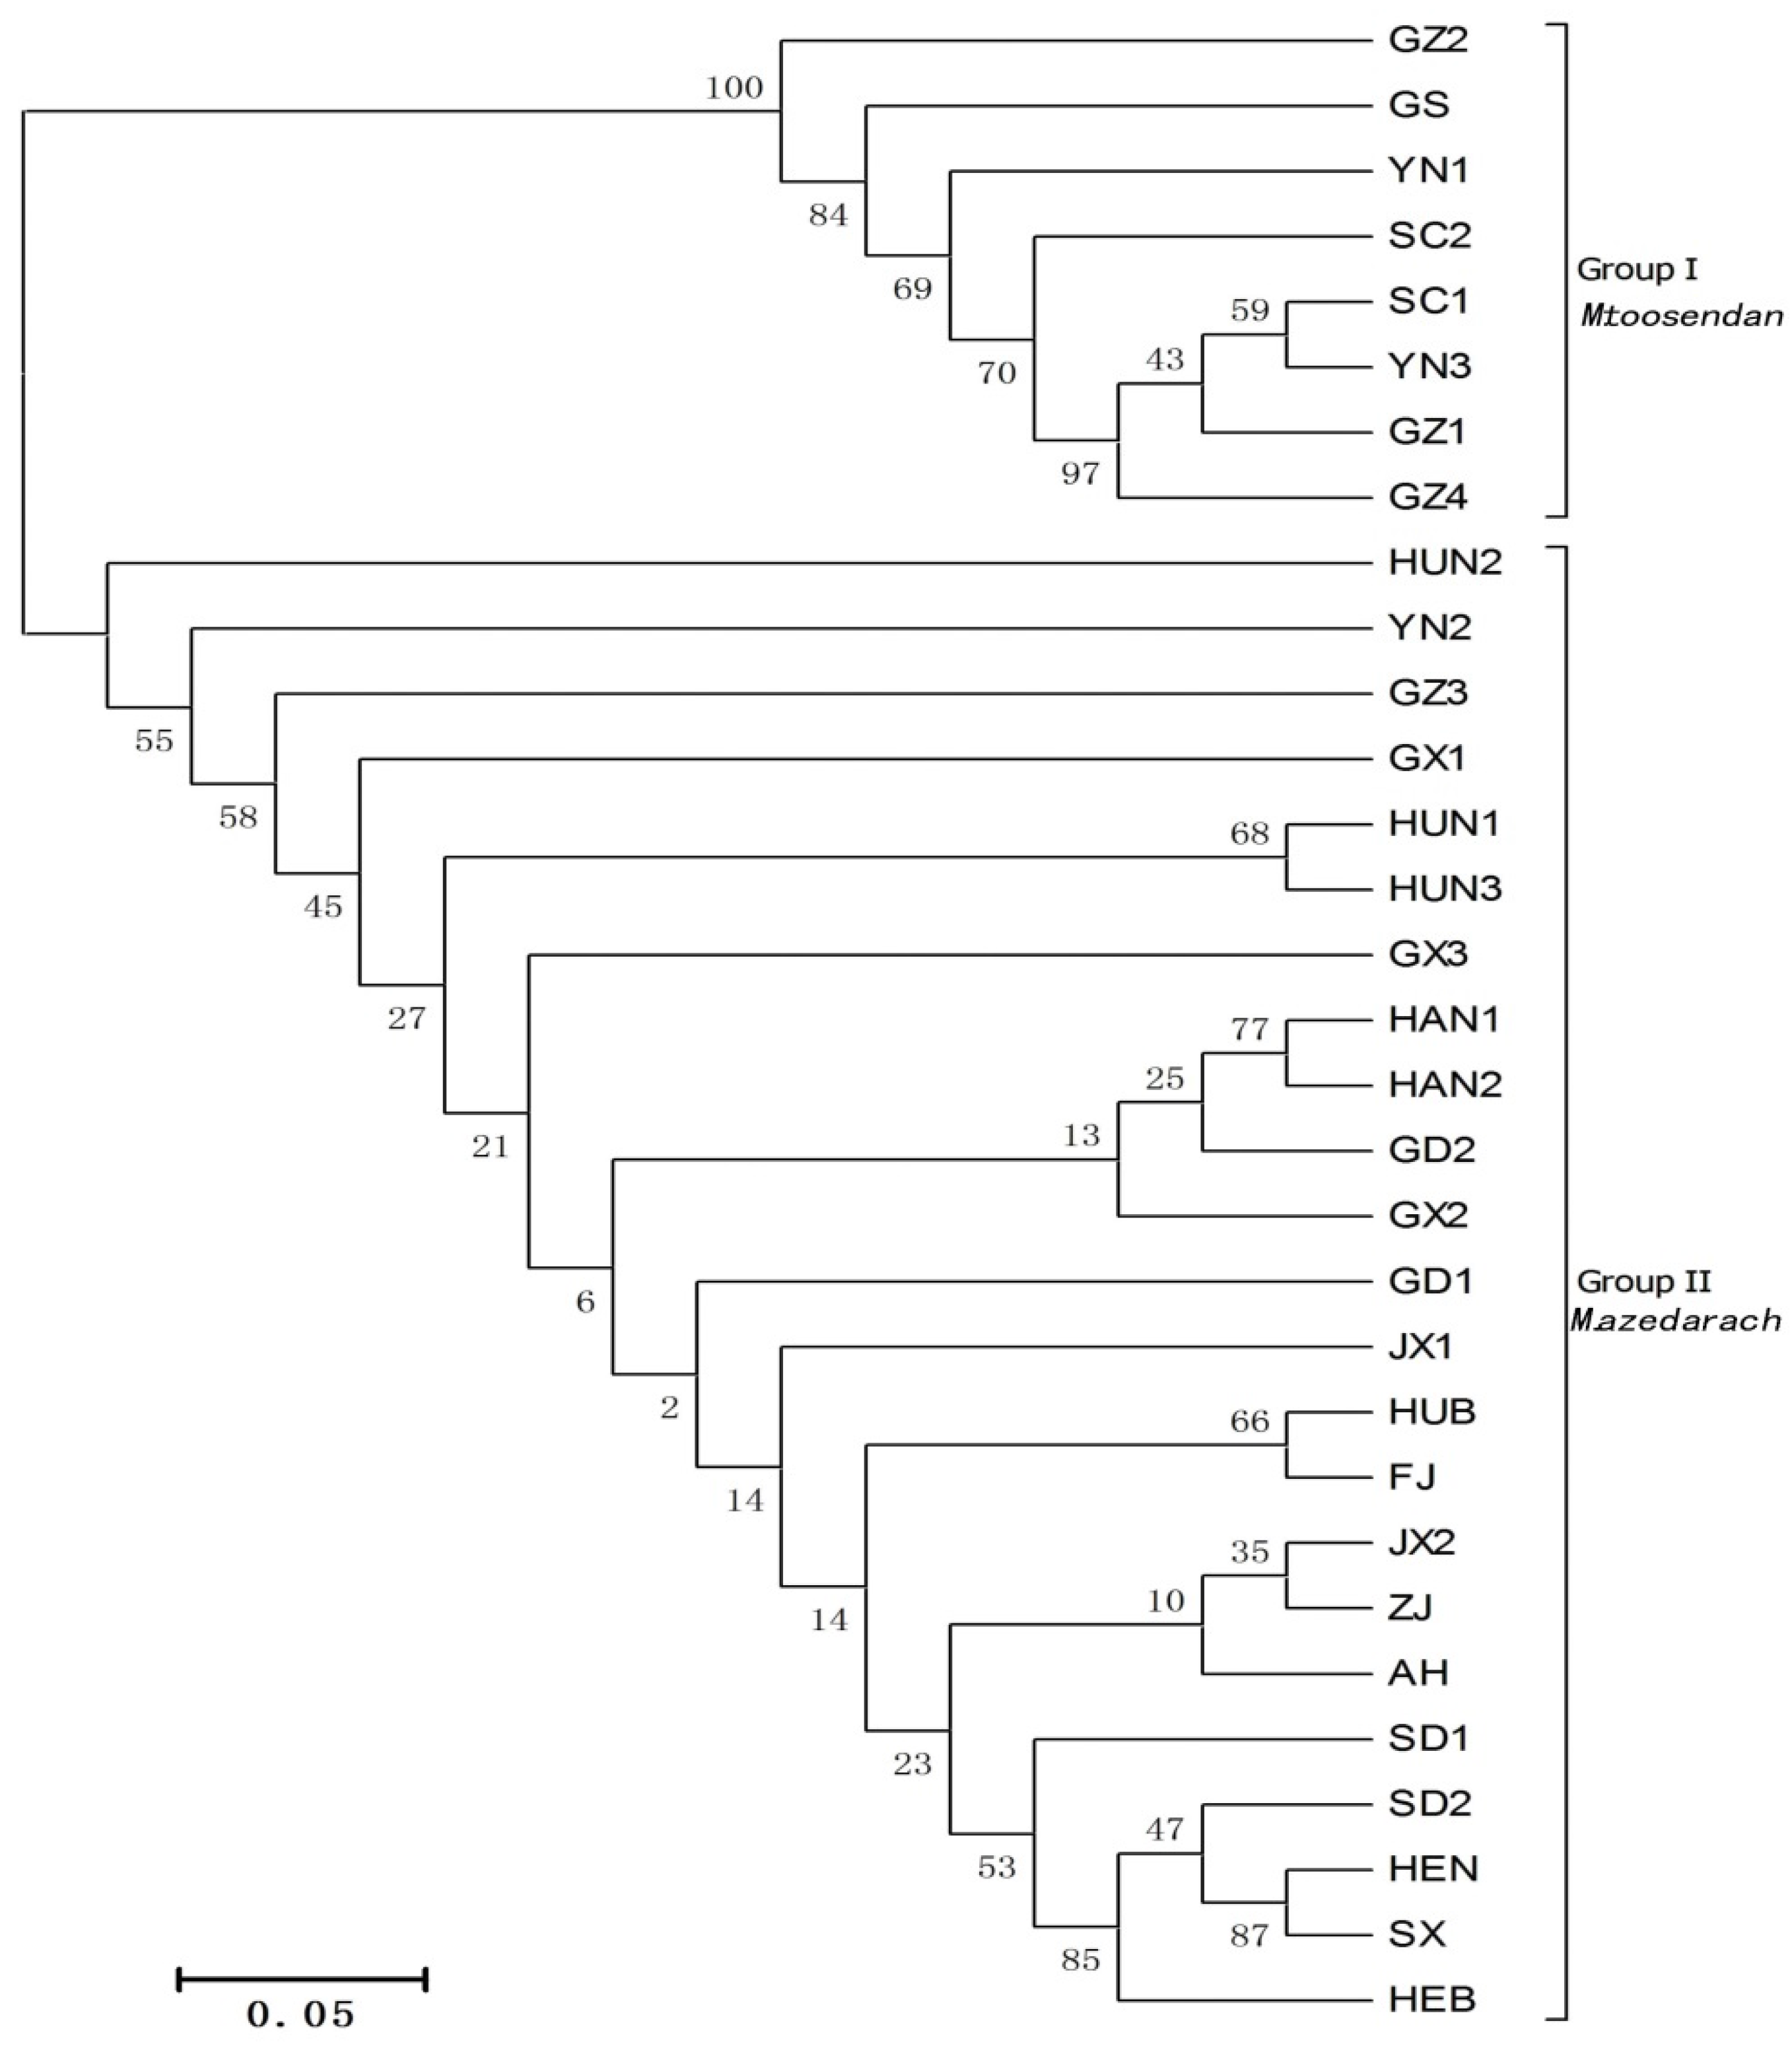
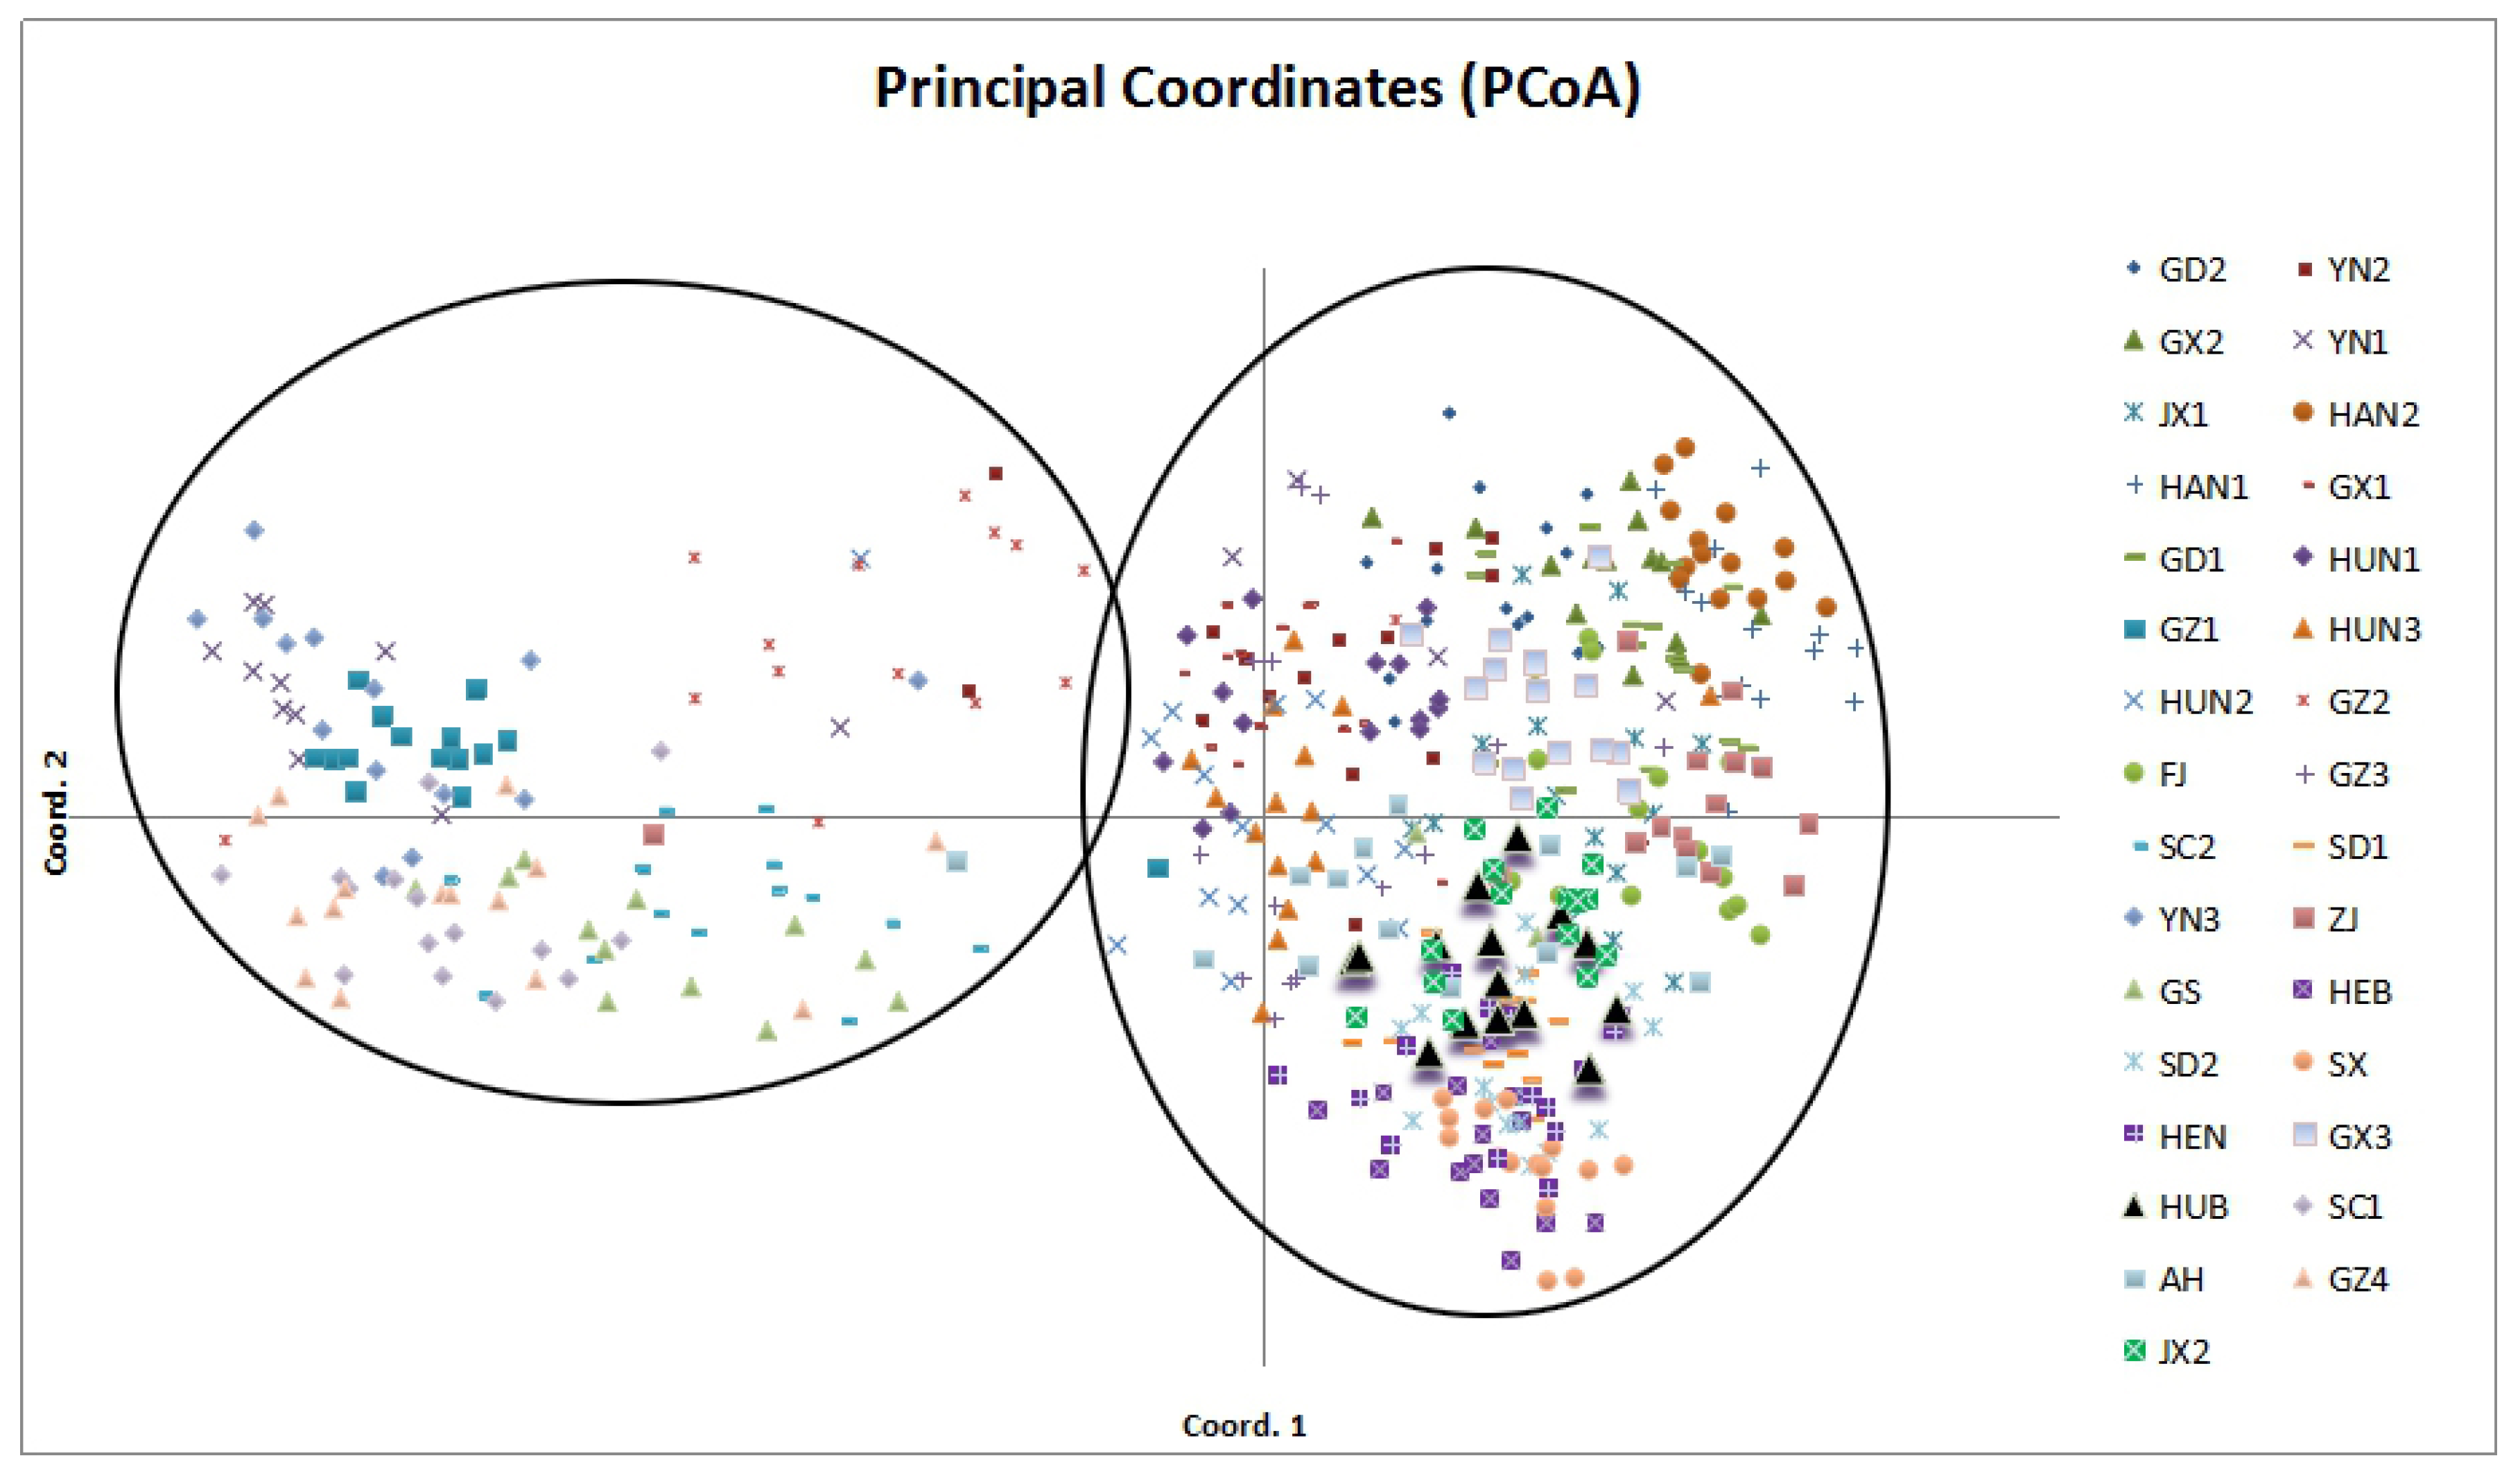
3.4. Genetic Relationships
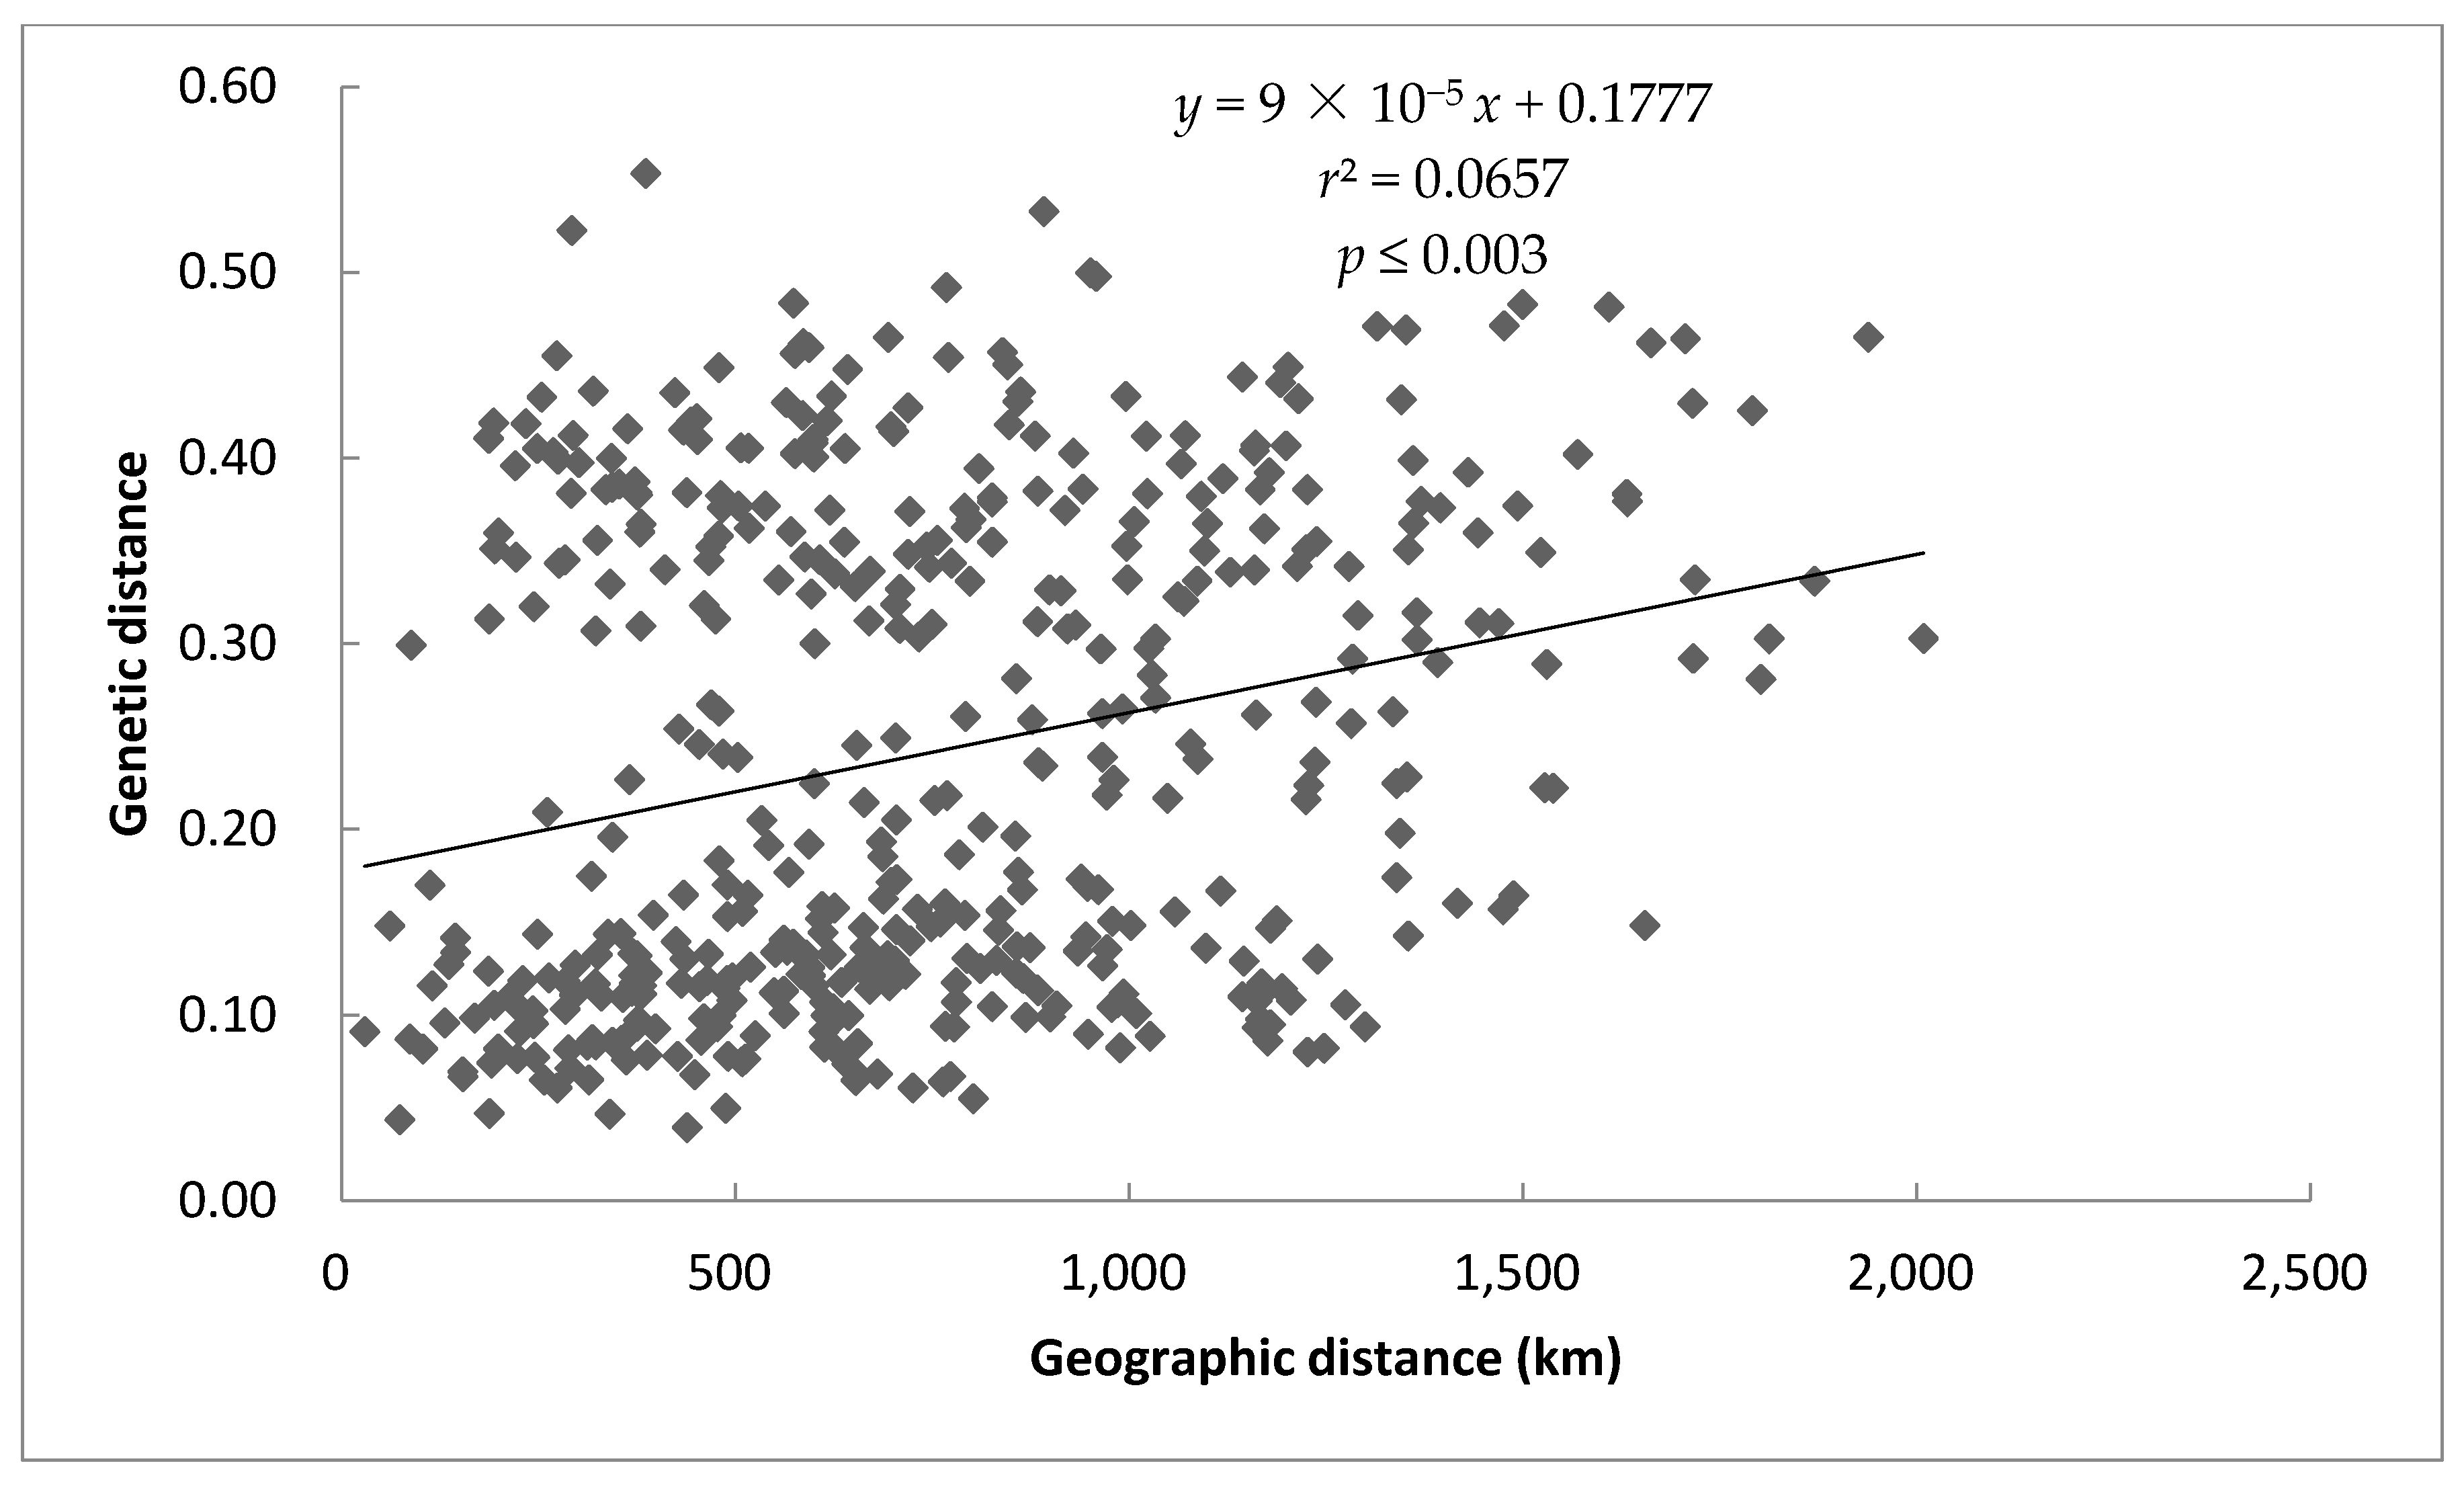
A dendrogram, based on Nei’s genetic distances and generated using the neighbor-joining clustering method (Figure 4), indicated the presence of two major groups among the 31 studied populations with a 100% support. Group I consisted of eight populations, GZ1 (Xingyi), GZ2 (Ceheng), GZ4 (Zunyi), GS (Longnan), SC1 (Chengdu), SC2 (Dazhou), YN1 (Mengla), and YN3 (Chuxiong), all of which were from western China. Based on their large fruits and stones, these seedlots were regarded as M. toosendan (Table 1). Group II comprised the remaining 23 sources from Guangdong (2), Guangxi (3), Guizhou (1), Hainan (2), Jiangxi (2), Hunan (3), Anhui (1), Hebei (1), Hubei (1), Henan (1), Shandong (2), Shanxi (1), Fujian (1), Zhejiang (1), and Yunnan (1), mainly from eastern and northern China. They were considered to be M. azedarach based on their small fruits and stones.
PCoA analysis revealed that the first two axes in the analysis accounted for 31.83% and 19.22% of the total variation (i.e., 51.05% in total). The biplot with PCoA 1 and PCoA 2 clearly showed two groups in the 31 Melia populations, which agreed with the neighbor-joining cluster analysis. Individuals from the same seedlots tended to align closely, and geographically close provenances tended to cluster together (Figure 5).

3.5. Mantel Test

For the 31 populations, a Mantel test indicated a significant correlation between genetic distance and geographic distance (r = 0.256, p-value ≤ 0.003 from 1000 permutations; Figure 6). Significant correlation indicated that geographical distance could increase population genetic distance, although this pattern was weak (r-square ~6.6%). However, no significant correlations existed between genetic distance and geographic distances within each putative species (r = −0.123, p-value ≤ 0.290 within M. toosendan; r = 0.001, p-value ≤ 0.436 within M. azedarach).

4. Discussion

This investigation represents the first study using SRAP as a molecular marker to evaluate genetic variation among and within Melia populations. The total genetic diversity (Ht = 0.37 ± 0.01) and percentage of polymorphic loci (P = 58.24%) indicated an intermediate level of genetic diversity in Melia. Populations from Ceheng and Liping (Guizhou) and Dazhou (Sichuan) had high genetic diversity (H = 0.20 and I = 0.30). The Nei’s and Shannon’s diversity within the putative M. toosendan populations were 0.23 and 0.34, respectively, and were higher than those of the putative M. azedarach populations, which were 0.19 and 0.29, respectively.
AMOVA further revealed that 31.41% of the variation was explained by differences between the two putative species, which was greater than population differentiation within each putative species (19.17%). These results were consistent with STRUCTURE analyses, which suggested that the two morphological groups were highly differentiated, with underlying clusters corresponding to the origins of the seedlots. This analysis also indicated that differentiation occurred mainly in populations from Yunnan, Guizhou, and Sichuan provinces. Various different genetic analysis methods (AMOVA, neighbor-joining cluster analysis, and PCoA grouping) indicated a consistent grouping pattern among the 31 populations. The eight populations in Group I (from Yunnan, Guizhou, Sichuan, and Gansu) were closely related to M. toosendan and were characterized by larger fruits and stones. The remaining 23 populations in Group II comprised southern, eastern, and northern seedlots, were associated with M. azedarach and were characterized by smaller fruits. These two distinct groups coincided with the two putative species described in the Flora Reipublicae Popularis Sinicae [12].
In this study, Groups I and II were putatively M. toosendan and M. azedarach, respectively. These groupings confirmed the morphological differences in the size and form of fruits and stones (Figure 7). The observation of fruit and seed characteristics showed that Melia populations from western China clustered together, and the stones and seeds of those seed lots differed significantly from those of other seedlots [38]. These results are consistent with the morphological differentiation reported by Chen et al. [39] and Hou et al. [40], and also match with the geographic distribution proposed for the two putative species in China [14,38]. Our genetic evidence supported the recognition of two taxa, M. toosendan and M. azedarach, in the genus Melia in China.
Genetic analyses have suggested the occurrence of a substantial population structure. The Mantel test indicated the presence of geographical distance effects on population genetic distance across the natural distribution range of the genus Melia in China. The number of migrants per generation per locus was less than 1, indicating a small extent of gene exchange between populations. This extent of population differentiation in the genus Melia was much greater than that in most conifers (Fst = 0.008–0.063) [41] and some broad-leaved tree species (Fst = 0.041–0.206) [42,43]. Population differentiation was also greater in Melia than in other outcrossing (Fst = 0.22), perennial (Fst = 0.19), and wind-pollinated (Fst = 0.13) plants [44,45]. These differences may arise primarily from their distinct dispersal properties and reproductive ecology.
In comparison with other species in the same family (Meliaceae), Melia had a degree of population differentiation comparable to those in Swietania macrophylla King, Toona ciliate Roemer, and Chukrasia [46,47,48], suggesting a similar reproductive ecology among different genera in Meliaceae. Furthermore, analogous to the genus Melia, the genus Chukrasia had two morphologically distinct groups of populations. This implies evolutionary convergence in population structure under biotic and abiotic environmental conditions.
The main reasons for a low gene flow between populations could be related to several factors. First, gene flow in genus Melia relies on gravity and seed dispersal by birds. Such birds include Pycnonotus sinensis sinensis Gmelin, Cyanopica cyana swinhoei Pallas, Turdus naumanni eunomus Temminck, Turdus naumanni naumanni Temminck, Turdus pallidus pallidus Gmelin, and Sturnus cineraceus Temminck. Of these species, T. n. naumanni can swallow more than 20 seeds per day during the autumn and winter in southern regions of Jiangsu, and they generally do not carry the seeds over long distances [24]. Gravity-mediated dispersal of non-ingested seeds results in much lower genetic diversity. Furthermore, seeds dispersed in this way can be washed to the bottom of valleys by streams. If seeds encounter suitable humidity and warm earth, they will germinate from their thick epicarp after the pulp is eaten, usually near water, not far from the seed trees. The second main reason is related to the low levels of inter-population gene flow, which may also be explained by the pollination ecology of Melia trees. In general, any geographic distribution cannot extend beyond the limits of the distribution of its pollinators. The main pollinators of Melia are insects, such as bees and ants [21,23], which tend to be confined to a particular location; this results in decreased gene flow between populations.
Analysis of the genetic structure of 31 Melia populations (Figure 5) revealed partial population genetic admixture, such as in populations GZ3, GX1, YN2, and the populations from Hunan province. In the M. toosendan gene pool, GZ2 and SCS also contained a proportion of M. azedarach genes. Although YN1, YN3, and YN2 were located in the same province, the YN2 population belonged to another gene pool. This was a case of differentiation in Melia within the same region. Genetic admixture implied that natural hybridization may have occurred between the two groups. These natural hybridization groups may form a barrier to gene flow or to germplasm introgression, as occurred in natural eucalyptus and pine tree species groups where germplasm introgression occurred between subspecies [49,50,51,52]. Our study provided preliminary experimental results to classify the genus Melia. Further study using chloroplast and mitochondrial DNA markers could provide additional genetic evidence on the classification of the genus Melia. Alternatively, artificial-pollination control testing and flowering biology observation could be used to test for interspecific hybridization between the two putative species or to ascertain whether the hybrids have a very low fitness compared with the parental fitness.

5. Conclusions

Melia populations exhibited substantial population differentiation, suggesting a low level of gene flow among populations. Genetic evidence indicated that the entire natural range of populations could be classified into two groups, which was consistent with the taxonomic classification based on the morphological characteristics of M. toosendan and M. azedarach. Our study supports the division of the genus Melia into two species in China, namely M. toosendan and M. azedarach. Additionally, this study also demonstrated that SRAP molecular markers were effective for characterizing population genetic diversity and the genetic relationships of Melia taxa and suggests that they could be useful for investigating the population genetic diversity of other broad-leaved tree species.

Acknowledgments

We appreciate Xinsheng Hu, Junling Shen and the two anonymous reviewers for their comments on an earlier version of this article. This study was supported by the Forestry Science and Technology Innovation Project in Guangdong Province (2011KJCX002), People’s Republic of China.

Author Contributions

Boyong Liao carried out the experiment, analyzed the data, and drafted the manuscript. Lijun Chen and Fang Wang participated in DNA extraction, genotyping, and manuscript preparation. Kunxi Ouyang, Wenkai Xi, Xiangbin Zhou, and Qingmin Que participated in seed collection and maintained the chinaberry seed germplasm. Ruiqi Pian, Pei Li, and Mingqian Liu provided technical support and assisted with the data analysis. Xiaoyang Chen initiated the project, designed the research framework, and coordinated the study. All authors have read and approved the final manuscript.

Conflicts of Interest

The authors declare that they have no conflict of interest.

References

  1. Muellner, A.N.; Pennington, T.D.; Chase, M.W. Molecular phylogenetics of Neotropical Cedreleae (mahogany family, Meliaceae) based on nuclear and plastid DNA sequences reveal multiple origins of “Cedrela odorata”. Mol. Phylogenet. Evol. 2009, 52, 461–469. [Google Scholar] [CrossRef] [PubMed]
  2. Muellner, A.N.; Savolainen, V.; Samuel, R.; Chase, M.W. The mahogany family “out-of-Africa”: Divergence time estimation, global biogeographic patterns inferred from plastid rbcL DNA sequences, extant, and fossil distribution of diversity. Mol. Phylogenet. Evol. 2006, 40, 236–250. [Google Scholar] [CrossRef] [PubMed]
  3. Muellner, A.N.; Samuel, R.; Johnson, S.A.; Cheek, M.; Pennington, T.R.; Chase, M.W. Molecular phylogenetics of Meliaceae (Sapindales) based on nuclear and plastid DNA sequences. Am. J. Bot. 2003, 90, 471–480. [Google Scholar] [CrossRef] [PubMed]
  4. Evans, P.T.; Rombold, J.S. Paraiso (Melia azedarach var. “Gigante”) woodlots: An agroforestry alternative for the small farmer in Paraguay. Agrofor. Syst. 1984, 2, 199–214. [Google Scholar] [CrossRef]
  5. Xu, H.; Xiao, X. Natural products-based insecticidal agents 4. Semisynthesis and insecticidal activity of novel esters of 2-chloropodophyllotoxin against Mythimna separata Walker in vivo. Bioorg. Med. Chem. Lett. 2009, 19, 5415–5418. [Google Scholar] [CrossRef] [PubMed]
  6. Xu, H.; Xiao, X.; Wang, Q. Natural products-based insecticidal agents 7. Semisynthesis and insecticidal activity of novel 4α-alkyloxy-2-chloropodophyllotoxin derivatives against Mythimna separata Walker in vivo. Bioorg. Med. Chem. Lett. 2010, 20, 5009–5012. [Google Scholar] [CrossRef] [PubMed]
  7. Xu, H.; Zhang, J. Natural products-based insecticidal agents 9. Design, semisynthesis and insecticidal activity of 28-acyloxy derivatives of toosendanin against Mythimna separata Walker in vivo. Bioorg. Med. Chem. Lett. 2011, 21, 1974–1977. [Google Scholar] [CrossRef] [PubMed]
  8. Nock, C.A.; Geihofer, D.; Grabner, M.; Baker, P.J.; Bunyavejchewin, S.; Hietz, P. Wood density and its radial variation in six canopy tree species differing in shade-tolerance in western Thailand. Ann. Bot. London 2009, 104, 297–306. [Google Scholar] [CrossRef] [PubMed]
  9. Sakagami, H.; Matsumura, J.; Oda, K. In situ visualization of hardwood microcracks occurring during drying. J. Wood Sci. 2011, 55, 323–328. [Google Scholar] [CrossRef]
  10. Vanlalhluna, P.; Sahoo, K.R. Performance of multipurpose trees and the associated crops in agroforestry system of Mizoram. Indian J. For. 2009, 32, 191–194. [Google Scholar]
  11. Sharma, S.K.; Shukla, S.R.; Sujatha, M.; Shashikala, S.; Kumar, P. Assessment of certain wood quality parameters of selected genotypes of Melia dubia Cav. grown in a seedling seed orchard. J. Indian Acad. Wood Sci. 2012, 9, 165–169. [Google Scholar] [CrossRef]
  12. Chen, S.K. Meliaceae. Flora Reipublicae Popularis Sinicae; Chen, C., Chang, H., Miau, R., Hsu, T., Eds.; Science Press: Beijing, China, 1997; Volume 43, pp. 99–103. (In Chinese) [Google Scholar]
  13. Peng, H.; David, J.M. Flora of China; Wu, Z., Peter, H.R., Eds.; Missouri Botanical Garden Press: St. Louis, MO, USA; Science Press: Beijing, China, 2008; Volume 11, pp. 130–131. [Google Scholar]
  14. Cheng, S.M.; Gu, W.C. The phonological division of distribution area in China for Melia azedarach. Sci. Silvae Sin. 2005, 41, 186–197. [Google Scholar]
  15. Zhang, M.L.; Zhang, X.; Zhao, S.H. Toosendanin content determination of Melia plants in different regions of China. J. South China Agric. Univ. 1988, 9, 31–36. [Google Scholar]
  16. Li, Y.S.; Wang, X.P.; Xu, S.N.; Wu, H.M.; Jin, F.Y.; Li, X.C. Study on identification of M. azedarach and M. toosendan by the high performance liquid chromatography (HPLC) fingerprint. Lishizhen Med. Mater. Med. Res. 2010, 21, 3264–3266. [Google Scholar]
  17. Wiart, C. Letter to the editor: A note on Melia toosendan Siebold & Zucc. Toxicology 2012, 295, 68. [Google Scholar] [PubMed]
  18. Tang, M.Z.; Wang, Z.F.; Shi, Y.L. Involvement of cytochrome C release and caspase activation in toosendanin-induced PC12 cell apoptosis. Toxicology 2004, 201, 31–38. [Google Scholar] [CrossRef] [PubMed]
  19. Cheng, S.M. Study on Genetic Diversity of Multitudinous Populations and Construction of Core Germplasm in Melia azedarach. Ph.D. Thesis, Chinese Academy of Forestry, Beijing, China, 2005. [Google Scholar]
  20. Xia, H.T. The Research on Genetic Diversity by ISSR Analysis and Genetic Variation Laws of Medicinal Melia azedarach. Master’s Thesis, Fujian Agriculture and Forestry University, Fuzhou, China, 2009. [Google Scholar]
  21. Majas, F.D.; Noetinger, M.; Romero, E.J. Airborne pollen and spores monitoring in Buenos Aires City: A preliminary report. Part I, Trees and shrubs (AP). Aerobiologia 1992, 8, 285–296. [Google Scholar] [CrossRef]
  22. Zhang, G.S.; Wang, S.B.; Liu, S.G. The research of gene resource and genetic improvement strategy of Melia azedarach L. in Henan Province. J. Henan For. Sci. Tech. 2009, 29, 41–42. [Google Scholar]
  23. Dos Reis Diniz, M.E.; Buschini, M.L. Pollen analysis and interaction networks of floral visitor bees of Eugenia uniflora L. (Myrtaceae), in Atlantic Forest areas in southern Brazil. Arthropod Plant Interact. 2015, 9, 623–632. [Google Scholar] [CrossRef]
  24. Pang, B.Z. Wild birds and chinaberry (Melia azedarach). Chin. J. Wildl. 1980, 1, 52–53. [Google Scholar]
  25. Li, G.; Quiros, C. Sequence-related amplified polymorphism (SRAP), a new marker system based on a simple PCR reaction: Its application to mapping and gene tagging in Brassica. Theor. Appl. Genet. 2001, 103, 455–461. [Google Scholar] [CrossRef]
  26. Bassam, B.J.; Gresshoff, P.M. Silver Staining of DNA in Polyacrylamide Gels. Nat. Protoc. 2007, 2, 2649–2654. [Google Scholar] [CrossRef] [PubMed]
  27. Yeh, F.C.; Yang, R.C.; Boyle, T. PopGene: Microsoft Window-Based Freeware for Population Genetic Analysis, Version 1.31; University of Alberta and Center for International Forestry Research: Edmonton, Canada, 1999. [Google Scholar]
  28. Nei, M. The theory of genetic distance and evolution of human races. Jpn. J. Hum. Genet. 1978, 23, 341–369. [Google Scholar] [CrossRef] [PubMed]
  29. Nei, M. Analysis of gene diversity in subdivided populations. Proc. Natl. Acad. Sci. USA 1973, 70, 3321–3323. [Google Scholar] [CrossRef] [PubMed]
  30. Wright, S. Evolution and the Genetics of Populations. In The Theory of Gene Frequencies; University of Chicago Press: Chicago, IL, USA, 1969; Volume 2. [Google Scholar]
  31. Peakall, R.; Smouse, P.E. GenAlEx 6.5: Genetic analysis in Excel. Population genetic software for teaching and research–An update. Bioinformatics 2012, 28, 2537–2539. [Google Scholar] [CrossRef] [PubMed]
  32. Nei, M.; Tajima, F.; Tateno, Y. Accuracy of estimated phylogenetic trees from molecular data. J. Mol. Evol. 1983, 19, 153–170. [Google Scholar] [PubMed]
  33. Takezaki, N.; Nei, M.; Tamura, K. POPTREE2. Software for constructing population trees from allele frequency data and computing other population statistics with Windows interface. Mol. Biol. Evol. 2010, 27, 747–752. [Google Scholar] [CrossRef] [PubMed]
  34. Pritchard, J.K.; Stephens, M.; Donnelly, P. Inference of population structure using multi-locus genotype data. Genetics 2000, 155, 945–959. [Google Scholar] [PubMed]
  35. Pritchard, J.K.; Wen, X.; Falush, D. Documentation for Structure Software: Version 2.3; University of Chicago: Chicago, IL, USA, 2010. [Google Scholar]
  36. Evanno, G.; Regnaut, S.; Goudet, J. Detecting the number of clusters of individuals using the software STRUCTURE: A simulation study. Mol. Ecol. 2005, 14, 2611–2620. [Google Scholar] [CrossRef] [PubMed]
  37. Mantel, N. The detection of disease clustering and a generalized regression approach. Cancer Res. 1967, 27, 209–220. [Google Scholar] [PubMed]
  38. Chen, L.J.; Deng, X.M.; Ding, M.M.; Liu, M.Q.; Li, J.C.; Hui, W.K.; Liao, B.Y.; Chen, X.Y. Geographic variation in traits of fruit stones and seeds of Melia azedarach. J. Beijing For. Univ. 2014, 36, 15–20. [Google Scholar]
  39. Chen, X.M. A preliminary taxonomic study on Meliaceae in Guangdong. J. Wuhan Bot. Res. 1986, 4, 167–194. [Google Scholar]
  40. Hou, K.Z.; Chen, D.Z. Chinese Meliaceae. J. Syst. Evol. 1955, 4, 8–11. [Google Scholar]
  41. Hamrick, J.L.; Godt, M.J.W.; Sherman-Broyles, S.L. Factors influencing levels of genetic diversity in woody plant species. N. For. 1992, 6, 95–124. [Google Scholar]
  42. Pazouki, L.; Salehi Shanjani, P.; Fields, P.D.; Martins, K.; Suhhorutšenko, M.; Viinalass, H.; Niinemets, Ü. Large within-population genetic diversity of the widespread conifer Pinus sylvestris at its soil fertility limit characterized by nuclear and chloroplast microsatellite markers. Eur. J. For. Res. 2016, 135, 161–177. [Google Scholar] [CrossRef]
  43. Di Pierro, E.A.; Mosca, E.; Rocchini, D.; Binelli, G.; Neale, D.B.; La Porta, N. Climate-related adaptive genetic variation and population structure in nature stands of Norway spruce in the South-Eastern Alps. Tree Genet. Genom. 2016, 12, 12–16. [Google Scholar] [CrossRef]
  44. Nybom, H. Comparison of different nuclear DNA markers for estimating intraspecific genetic diversity in plants. Mol. Ecol. 2004, 13, 1143–1155. [Google Scholar] [CrossRef] [PubMed]
  45. Nybom, H.; Kurt, W.; Bjorn, R. DNA fingerprinting in botany: Past, present, future. Investig. Genet. 2014, 5, 1–35. [Google Scholar] [CrossRef] [PubMed]
  46. Lemes, M.R.; Dick, C.W.; Navarro, C.; Lowe, A.J.; Cavers, S.; Gribel, R. Chloroplast DNA microsatellites reveal contrasting phylogeographic structure in mahogany (Swietenia macrophylla King, Meliaceae) from Amazonia and Central America. Trop. Plants Biol. 2010, 3, 40–49. [Google Scholar] [CrossRef] [Green Version]
  47. Li, P.; Zhan, X.; Que, Q.M.; Qu, W.T.; Liu, M.Q.; Ouyang, K.X.; Li, J.C.; Deng, X.M.; Zhang, J.J.; Liao, B.Y.; et al. Genetic diversity and population structure of Toona Ciliata Roem. based on sequence-related amplified polymorphism (SRAP) markers. Forests 2015, 6, 1094–1106. [Google Scholar] [CrossRef]
  48. Wu, C.; Zhong, C.; Zhang, Y.; Jiang, Q.B.; Chen, Y.; Chen, Z.; Pinyopusarerk, K.; Bush, D. Genetic diversity and genetic relationships of Chukrasia spp. (Meliaceae) as revealed by inter simple sequence repeat (ISSR) markers. Trees 2014, 28, 1847–1857. [Google Scholar] [CrossRef]
  49. Barbour, R.C.; Potts, B.M.; Vaillancourt, R.E. Gene flow between introduced and native Eucalyptus species: Early-age selection limits invasive capacity of exotic E. ovata×nitens F1 hybrids. For. Ecol. Manag. 2008, 228, 206–214. [Google Scholar] [CrossRef]
  50. Field, D.L.; Ayre, D.J.; Whelan, R.J.; Young, A.G. Molecular and morphological evidence of natural interspecific hybridization between the uncommon Eucalyptus aggregate and the widespread E.rubida and E.viminalis. Conserv. Genet. 2009, 10, 881–896. [Google Scholar] [CrossRef]
  51. Wachowiak, W.; Prus-Glowacki, W. Hybridisation processes in sympatric populations of pines Pinus sylvestris L., P. mugo Turra and P. uliginosa Neumann. Plant Syst. Evol. 2008, 271, 29–40. [Google Scholar] [CrossRef]
  52. Xu, S.Q.; Tauer, C.G.; Nelson, C.D. Natural hybridization within seed sources of shortleaf pine (Pinus echinata Mill.) and loblolly pine (Pinus taeda L.). Tree Genet. Genom. 2008, 4, 849–858. [Google Scholar] [CrossRef]
Figure 1. Geographical locations of the sampled populations covering the taxa of both M. azedarach and M. toosendan. Codes for the populations are given in Table 1.
Forests 07 00081 g001
Figure 2. Relationship between K and Delta K. Delta K is an indicator of the optimal number of population groups. The number of groups with the maximum Delta K was optimal. Delta K was calculated according to Evanno et al. (2005) [36].
Forests 07 00081 g002
Figure 3. Clustering analysis of 31 Melia populations with STRUCTURE.
Forests 07 00081 g003
Figure 4. Neighbor-joining dendrogram of the 31 Melia provenances.
Forests 07 00081 g004
Figure 5. Biplots of PCoA1 and PCoA2 within 31 Melia provenances.
Forests 07 00081 g005
Figure 6. Correlation between the geographic distance (x-axis) and Nei’s genetic distance (y-axis).
Forests 07 00081 g006
Figure 7. Morphological differences in Melia fruits and stones: (A)–(C) for putative M. toosendan; (D)–(H) for putative M. azedarach. The fruits and stones in (A)–(H) were collected from the same seed trees in different populations located in: (A) Chuxiong; (B) Zunyi; (C) Mengla; (D) Xuchang; (E) Tunchang; (F) Renhua; (G) Tai’an; and (H) Yanling.
Forests 07 00081 g007
Table 1. Summary of the 31 Melia seed sources sampled in this study.
No.Provenance CodeProvenanceLatitude (°′ N)Longitude (°′ E)Altitude (m a.s.l.)
M. toosendan
1GSGansu Longnan33°24′104°55′1106
2GZ1Guizhou Xingyi25°03′104°37′1407
3GZ2Guizhou Ceheng24°57′105°41′1117
4GZ4Guizhou Zunyi27°43′106°55′1168
5SC1Sichuan Chengdu30°34′104°3′495
6SC2Sichuan Dazhou31°12′107°28′593
7YN1Yunnan Mengla21°48′101°15′1010
8YN3Yunnan Chuxiong25°02′101°31′2173
M. azedarach
9AHAnhui Chuzhou32°18′118°19′15
10FJFujian Yong’an25°49′117°06′255
11GD1Guangdong Kaiping22°25′112°43′7
12GD2Guangdong Renhua25°19′113°55′99
13GX1Guangxi Guilin25°16′110°17′166
14GX2Guangxi Qinzhou21°58′108°39′17
15GX3Guangxi Du’an23°55′108°6′373
16GZ3Guizhou Liping26°13′109°08′618
17HAN1Hainan Wuzhishan18°47′109°29′280
18HAN2Hainan Tunchang19°24′110°07′160
19HEBHebei Baoding38°52′115°27′22
20HUBHubei Jingmen31°02′112°11′98
21HENHenan Xuchang34°02′113°51′71
22HUN1Hunan Dong’an26°22′111°14′205
23HUN2Hunan Yanling26°27′113°40′200
24HUN3Hunan Liuyang28°09′113°38′124
25JX1Jiangxi Yudu25°59′115°25′132
26JX2Jiangxi Ruichang29°40′115°40′18
27SD1Shandong Jinan36°39′117°07′122
28SD2Shandong Tai’an36°13′117°06′641
29SXShanxi Weinan34°29′109°30′351
30YN2Yunnan Malipo23°06′104°40′1180
31ZJZhejiang Ling’an30°13′119°43′47
Note that the provenance samples were grouped, based on morphological differences, according to the classification of two putative species described in the Flora Republicae Popularis Sinicae [12].
Table 2. Primers used for sequence-related amplified polymorphism (SRAP).
Forward PrimersReverse Primers
NameSequence (5′–3′)NameSequence (5′–3′)
Me1TGAGTCCAAACCGGATAEm1GACTGCGTACGAATTAAT
Me2TGAGTCCAAACCGGAGCEm2GACTGCGTACGAATTTGC
Me3TGAGTCCAAACCGGAATEm3GACTGCGTACGAATTGAC
Me4TGAGTCCAAACCGGACCEm4GACTGCGTACGAATTTGA
Me5TGAGTCCAAACCGGAAGEm5GACTGCGTACGAATTAAC
Me6TGAGTCCAAACCGGTAAEm6GACTGCGTACGAATTGCA
Me7TGAGTCCAAACCGGTCCEm7GACTGCGTACGAATTGAG
Me8TGAGTCCAAACCGGTGCEm8GACTGCGTACGAATTGCC
Me9TGAGTCCAAACCGGACAEm9GACTGCGTACGAATTTCA
Me10TGAGTCCAAACCGGACGEm10GACTGCGTACGAATTCAA
Me11TGAGTCCAAACCGGACTEm11GACTGCGTACGAATTGCA
Me12TGAGTCCAAACCGGAGGEm12GACTGCGTACGAATTCAT
Me13TGAGTCCAAACCGGAAAEm13GACTGCGTACGAATTCTA
Me14TGAGTCCAAACCGGAACEm14GACTGCGTACGAATTCTC
Me15TGAGTCCAAACCGGAGAEm15GACTGCGTACGAATTCTT
Me17TGAGTCCAAACCGGTAGEm16GACTGCGTACGAATTGAT
Me18TGAGTCCAAACCGGCATEm17GACTGCGTACGAATTATG
Me19TGAGTCCAAACCGGTTGEm18GACTGCGTACGAATTAGC
Me20TGAGTCCAAACCGGTGTEm19GACTGCGTACGAATTACG
Me21TGAGTCCAAACCGGTCAEm20GACTGCGTACGAATTTAG
Me22TGAGTCCAAACCGGGCAEm21GACTGCGTACGAATTTCG
Me23TGAGTCCAAACCGGATGEm22GACTGCGTACGAATTGTC
Me24TGAGTCCAAACCGGGATEm23GACTGCGTACGAATTGGT
Me25TGAGTCCAAACCGGGCTEm24GACTGCGTACGAATTCAG
Me26TTCAGGGTGGCCGGATGEm25GACTGCGTACGAATTCTG
Me27TGGGGACAACCCGGCTTEm26GACTGCGTACGAATTCGG
Me28TGAGTCCAAACCGGATCEm27GACTGCGTACGAATTCCA
Em28GACTGCGTACGAATTCGA
Em29GACTGCGTACGAATTATT
Table 3. Polymorphism data based on genetic analyses performed using 20 SRAP primer combinations.
Primer CombinationTotal Number of BandsPolymorphic Bands (n)PPB (%)
Me1/Em9171482.35
Me1/Em1713323.08
Me2/Em1212216.67
Me2/Em1310990.00
Me4/Em515640.00
Me5/Em1014964.29
Me6/Em4191368.42
Me6/Em511545.45
Me6/Em1011545.45
Me6/Em294250.00
Me11/Em2988100.00
Me17/Em29261038.46
Me19/Em57571.43
Me19/Em78337.50
Me20/Em7171376.47
Me24/Em149888.89
Me27/Em414857.14
Me27/Em1816425.00
Me28/Em15111090.91
Me28/Em1915853.33
Total257145
Mean12.857.2558.24
Table 4. Genetic diversity in 31 Melia populations.
No.CodePercentage of Polymorphic Loci (P)Nei’s Gene Diversity (H)Shannon’s Information Index (I)
M. azedarach
1GS67.590.25 ± 0.200.38 ± 0.28
2GZ158.620.19 ± 0.200.28 ± 0.28
3GZ276.550.31 ± 0.200.45 ± 0.27
4GZ461.380.21 ± 0.210.32 ± 0.29
5SC150.340.17 ± 0.190.25 ± 0.28
6SC271.720.27 ± 0.200.40 ± 0.28
7YN170.340.25 ± 0.200.38 ± 0.28
8YN355.860.18 ± 0.190.28 ± 0.28
M. toosendan (all) 64.050.23 ± 0.200.34 ± 0.28
M. azedarach
9AH64.830.24 ± 0.200.35 ± 0.29
10FJ52.410.17 ± 0.190.25 ± 0.27
11GD156.550.17 ± 0.190.27 ± 0.27
12GD255.170.18 ± 0.200.28 ± 0.28
13GX162.760.22 ± 0.200.33 ± 0.29
14GX254.480.18 ± 0.200.27 ± 0.29
15GX353.100.18 ± 0.200.27 ± 0.29
16GZ375.170.27 ± 0.200.41 ± 0.27
17HAN135.170.19 ± 0.170.18 ± 0.26
18HAN240.000.13 ± 0.180.20 ± 0.27
19HEB48.280.15 ± 0.190.23 ± 0.28
20HUB57.240.21 ± 0.210.30 ± 0.29
21HEN50.340.17 ± 0.200.26 ± 0.28
22HUN168.970.25 ± 0.200.37 ± 0.28
23HUN273.790.26 ± 0.200.39 ± 0.28
24HUN367.590.25 ± 0.210.37 ± 0.29
25JX156.550.19 ± 0.190.29 ± 0.28
26JX254.480.18 ± 0.190.27 ± 0.28
27SD148.970.17 ± 0.200.26 ± 0.29
28SD245.520.15 ± 0.190.23 ± 0.27
29SX46.900.16 ± 0.200.24 ± 0.29
30YN269.660.25 ± 0.200.37 ± 0.28
31ZJ55.170.15 ± 0.180.23 ± 0.26
M. azedarach (all) 56.220.19 ± 0.200.29 ± 0.28
Whole population 58.240.20 ± 0.200.30 ± 0.28
Table 5. Analysis of molecular variance (AMOVA) of 31 Melia populations.
SourceDegrees of FreedomSum of SquaresVariation ComponentPercentage of Variation (%)p
Among putative species11799.239.6631.41<0.001
Among populations Within putative species292985.255.9019.17<0.001
Within populations4306537.2915.2049.42<0.001
Total46011321.7630.76100.00

