Article

Deriving Merchantable Volume in Poplar through a Localized Tapering Function from Non-Destructive Terrestrial Laser Scanning

1
College of Forestry, Nanjing Forestry University, Nanjing 210037, China
2
Department of Remote Sensing and Photogrammetry, Finnish Geospatial Research Institute (FGI, formerly Finnish Geodetic Institute), Masala 02431, Finland
3
Department of Forest Resources Management, Faculty of Forestry, University of British Columbia, 2045-2424 Main Mall, Vancouver, BC V6T 1Z4, Canada
4
Advanced Analysis and Testing Center, Nanjing Forestry University, Nanjing 210037, China
*
Author to whom correspondence should be addressed.
These authors contributed equally to this work.
Forests 2016, 7(4), 87; https://doi.org/10.3390/f7040087
Submission received: 19 October 2015 / Revised: 24 March 2016 / Accepted: 9 April 2016 / Published: 20 April 2016
(This article belongs to the Special Issue Forest Ground Observations through Terrestrial Point Clouds)

Abstract

:
Timber volume is an important ecological component in forested landscapes. The application of terrestrial laser scanning (TLS) to volume estimation has been widely accepted though few species have well-calibrated taper functions. This research uses TLS technology in poplar (Populus × canadensis Moench cv. ‘I-72/58’) to extract stem diameter at different tree heights and establish the relationship between point cloud data and stem curve, which constitutes the basis for volume estimation of single trees and the stand. Eight plots were established and scanned by TLS. Stem curve functions were then fitted after extraction of diameters at different height, and tree heights from the point cloud data. Lastly, six functions were evaluated by R2 and RMSE. A modified Schumacher equation was the most suitable taper function. Volume estimates from the TLS-derived taper function were better than those derived using the stem-analysis data. Finally, regression analysis showed that predictions of stem size were similar when data were based on TLS versus stem analysis. Its high accuracy and efficiency indicates that TLS technology can play an important role in forest inventory assessment.

1. Introduction

Timber volume determination is a key element in the wood products supply chain and in sustainable forest management. One limitation to estimating volume is the lack of an efficient, accurate, and objective methodology. Taper functions represent the change in diameter in relation to height along a tree stem [1,2], and are widely used to estimate total stem volume as well as merchantable volume to a specified top diameter limit [3]. A range of functions has been developed, from simple equations describing general growth forms to equations specific to particular species [4,5,6,7,8,9,10]. However, few species have well-calibrated taper functions, even those with significant economic value.
Taper functions are conventionally developed through stem analysis; trees are felled and diameters measured at regular intervals along the stem [10,11,12,13,14]. Aside from requiring considerable time and effort, sampling is destructive and the process of tree removal imposes changes in forest structure and function. Terrestrial laser scanning (TLS) provides an alternative to stem analysis and has the potential to resolve many of these limitations [15]. TLS is a laser-based instrument that measures precise range and angular measurements. From this information, various structural metrics can be calculated, inferred, or modeled.
The application of TLS in forestry is relatively recent, but the method has shown considerable promise in obtaining highly accurate estimates of tree diameter and height, as well as stem curve [16,17]. TLS could be a useful option for acquiring the data necessary in developing new allometric models [18]. Since the collection and analysis of TLS data are automated and nondestructive, the cost of model development could be significantly reduced and the disturbance to forest structure minimized. Taper functions might thus be developed for a much larger number of species, thereby greatly improving forest stand planning and management.
China is one of the world’s leading countries in terms of forest plantations and at 7.6 million ha (year 2011 estimates) Poplar (Populus spp.) accounts for about 14% of the total forest area [19]. The ecological characteristics of this species are well described [13,14], but accurate taper functions are lacking [14]. Estimates of merchantable volume in China’s poplar plantations have therefore been based on a limited number of local volume tables developed more than three decades ago [15]. Given that poplar is a predominant plantation species across China and its significance to the world economy [20], rapid and accurate volume estimation is critical to its effective management. Poplar productivity has also become an important topic in China over recent years due to changes in government policy regarding the transfer of land ownership to individuals. These reforms are based on land valuation assessments that are often contingent on a forest volume inventory. The overall objective of this study is to investigate whether non-destructive TLS measurements suitable for deriving local taper functions and merchantable volume. The detailed objectives of this work therefore were: (1) develop a poplar taper function using TLS point cloud data and the conventional techniques of stem analysis and local yield tables; (2) compare the fit of both approaches; and (3) compare merchantable volume derived from each function with local volume tables.

2. Materials and Methods

2.1. Study Area and Field Measurements

The study area is located in a 39.8 km2 hybrid poplar (P. × canadensis Moench cv. ‘I-72/58’) plantation near Huai′an, Jiangsu Province, China (33°40′ N, 119°23′ E). The plantation was established progressively between 1990 and 1995; tree age at the time of measurement was 20–24 years.
A total of 8 circular plots with a 15-m radius in size were established at random locations within the stand. The diameter at breast height (DBH) (1.3 m above ground surface) and height of all trees with a DBH larger than 5 cm were measured in the plots over the period 27–29 March 2014. DBH was measured with a standard diameter tape and height using a Vertex hypsometer (Haglöf, Sweden). The azimuth angle and distance from a given plot center were measured for each tree using a PosTex laser positioning instrument (Haglöf, Långsele, Västernorrland, Sverige, Sweden).
Plot inventories were conducted prior to laser scanning and stem felling. A total of 198 trees were sampled in the 8 plots, of which 16 were subject to a stem analysis. In the latter group, half were used for model parameterization and the remainder for testing model performance.

2.2. Laser Scanning

Laser scanning was undertaken in March 2014 using a Leica Scanstation C10 scanner (Leica Geosystem AG, Heerbrugg, Switzerland) with a dual-axis compensator and high-resolution camera. Technical features of the scanner are described in Table 1.
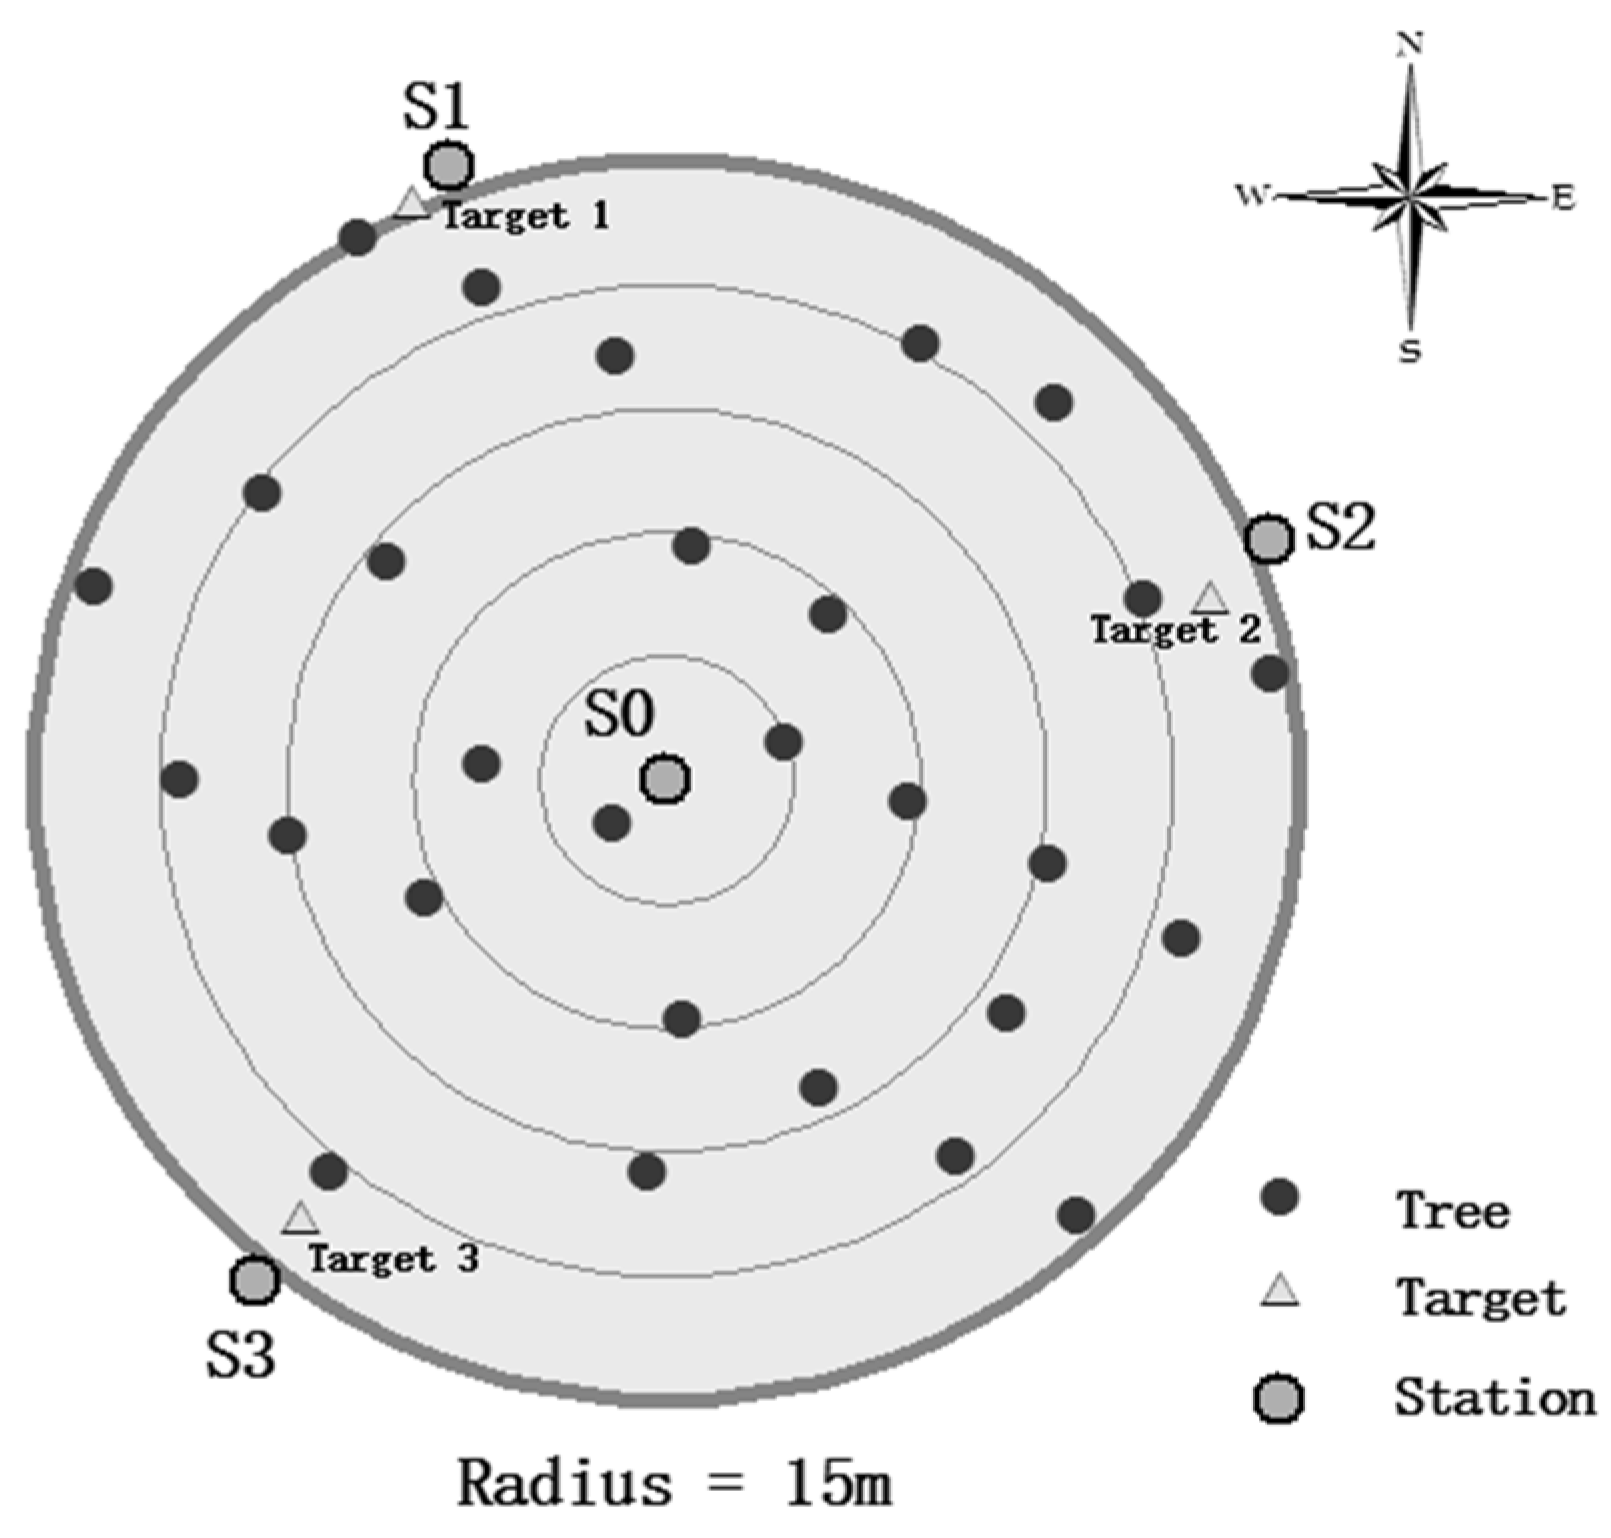
Plots were scanned using a multi-scan approach from 4 locations: a center station and 3 stations around the periphery of the plot (Figure 1). Multiple stations are required in order to assemble a 3-dimensional (3D) map of the stems as well as their structure (details in [21,22]). The point cloud data from each location have different coordinates. This necessitates the use of reference points as a means for correctly matching coordinate positions [22]. Three Leica vertical targets were placed at the plot border for data registration. A target provided two registration points at each location at different heights. At least two registration targets from different locations should be overlapped in order to facilitate registration. The scan set-up is illustrated in Figure 1.

2.3. Stem Analysis

After the TLS scans, two trees in each plot were felled and removed for stem analyses. Trees were selected randomly in each plot in accordance with the following criteria: (1) visually healthy and undamaged, with straight, single stems; (2) dominant or codominant; and (3) DBH should be between arithmetic mean DBH, and the mean basal area-weighted DBH in the plot. Half of the felled trees (n = 8) were used for model parameterization and the remainder (n = 8) for evaluating model performance. The stem analysis provided data (DBH, tree height, stem curve) ranging from age 0 (at the top of the tree) to a maximum of 24 years at the tree base. The age of felled trees was estimated by counting annual rings from a disc cut at stump height (0.2 m). Additional discs were cut at 1.3 m, and at 2-m intervals up the stem. Their rings were counted, and the inside-bark diameter was measured. The stem analysis data were used to reconstruct annual radial and height increments [11].

2.4. Scanning Analysis

The TLS point cloud data were processed using a robust tree mapping method, as follows (further details in [21]). Stem points were first identified from the TLS data based on spatial distribution characteristics. A local coordinate system was established for each point in the neighborhood. A point neighborhood was defined by its k-nearest points; in this study, k = 100. The axis directions were indicated by eigenvectors, and the variance of the points along the axes characterized by their eigenvalues. A stem point was identified if it was on a vertical planar structure, its neighboring points were along two axes in the local coordinate system, and the normal vector to the surface was approximately horizontal in the real-world coordinate system.
A series of 3-D cylinders were utilized to model a stem. Stem diameter at a given height was estimated from the cylinder element at that corresponding height. Tree height was estimated using the highest and lowest locations in the point cloud.

2.5. Taper Functions

Six taper equations were used to predict inside-bark diameter (d), in relation to height (h):
d 2 = D a 0 + a 1 H ( H h ) a 2 + a 3 D / H
Meng, 1982 [8]
d 2 = a 0 D a 1 ( H h ) H a 3 a 2
Schumacher and Hall, 1933 [23]
d 2 = a 0 D ( H h H 1.3 ) a 1
Yan, 1992 [24]
d 2 = D 2 ( H h H 1.3 ) a 0
Ormerod, 1971 [25]
d 2 = D 2 ( a 0 + a 1 ( h H ) + a 2 ( h H ) 2 )
Kozak, 1966 [26]
d 2 = D 2 ( a 0 + a 1 H h h )
Nagashima, 1980 [27]
where D is DBH (cm), H is total tree height (m), and a0, a1, a2, and a3 are fitted parameters.
Stem diameter values extracted from the TLS point cloud data correspond to the outside-bark diameter. Inside-bark diameters were therefore estimated using the following Equation (7) [13]:
D i n s i d e b a r k = ( D o u t s i d e b a r k 1.0898 ) / 1.0399

2.6. Evaluation of the Taper Equations

Each of the 6 taper equations was fitted to data for the complete set of trees derived from TLS, and to 8 of the 16 trees subject to stem analysis. Model fitting was conducted with the statistical program, SPSS (Version 22; SPSS Inc., Chicago, IL, USA. ISBN1-56827-390-8), using the Levenberg-Marquardt (L-M) least squares fitting technique, an algorithm for solving generic curve-fitting problems [28,29]. Two statistical criteria were used to evaluate the fit of the taper equations, the coefficient of determination (R2), a representation of the degree of association between the dependent and independent variables, and root mean square error (RMSE), an index of the variance between observed and predicted values. The objective at this stage was to determine which equations best fit the TLS and stem analysis data. This was accomplished by scoring equations from 1 to 6 with the lowest score assigned to the highest R2 and the lowest RMSE. Scores were then simply added.
Two taper functions with the lowest total score (the highest ranking) were then compared to determine the best equation as follows. The functions parameterized from the TLS data were used to predict inside-bark stem diameter in relation to age or height. Predictions were compared against the measured values calculated from the remaining 8 plot trees, and assessed from the average error, s, and standard deviation, δ (see [13]). Equations were ranked by each metric (from 1 to 3) and the score summed. The equation with the lowest score was selected as the most suitable function.

2.7. Plot Merchantable Volume

After selecting the best taper equation, the last step was to compare its predictive capability when calibrated with the actual stem analysis versus the TLS dataset. In China, poplar merchantable timber is grouped according to log diameter and length [30], as shown in Table 2.
From the generalized taper function d 2 = f ( D , H , h ) , the accumulated log length (h) can be calculated as: h k = φ ( D , H , d k 2 ) , where k is the minimum top diameter (Table 2). Merchantable volume for a given log length (VLk) can thus be calculated as:
V L k = 0 L k π 40000 [ d 2 ( h ) ] d h
The total volume per tree (Vtotal) can be calculated from the definite integral of total tree height:
V t o t a l = 0 H π 40000 [ d 2 ( h ) ] d h
Finally, the percent merchantable volume in a given stem size class, R, is calculated as:
R = V L k V t o t a l × 100 %

3. Results

3.1. Summary Data

Table 3 shows the DBH values across all plots. A majority (70%) of stems were between 19 and 34 cm DBH, and the overall distribution was approximately normal. Table 4 shows summary data for the 8 plots. Mean DBH by plot varied from 24.7 to 33.1 cm, (range 9.1–41.3) and average height from 21.3 to 27.6 m (range 11.3–29.2). The basal area (G) ranged from 12.1 to 15.9 m2·ha−1.
Of the 16 trees cut for stem analysis, minimum and maximum DBH and height ranged from 21.7 to 37.9 cm, and 20.6 to 30.0 m, respectively (Table 5).

3.2. Taper Equation Comparison

From the taper equation comparison using the stem analysis versus point cloud data, Equations (2) and (5) had the best rankings (based on the highest R2 and lowest RMSE; Table 6). Equations (1), (3), (4), and (6) were therefore removed from further consideration.
These two models were used to predict stem diameters in relation to tree height using parameter values derived from the TLS and stem analysis data, respectively (Table 7). Model 2 provided a good fit to measured data, and there was no consistent trend favoring TLS versus stem analysis (Figure 2a). Model 5 showed poor predictive capability at tree heights greater than 14 m (Figure 2b). Consequently, only Model 2 was used in subsequent analyses.

3.3. Merchantable Volume Predictions

Rearranging taper Equation (2) gives the upper trunk diameter (hk) according to accepted timber standards (Table 2):
h k = H ( d k 2 H a 3 a 0 D a 1 ) 1 a 2
where H is tree height, D is the breast height diameter, including bark, dk is the upper trunk diameter according to timber standards (Table 2), and ai are fitted parameters. The merchantable volume (MV) can now be calculated from the definite integral of Equation (2):
V L k = K a 0 D 2 a 1 ( a 2 + 1 ) H a 3 [ ( H h ( k + 1 ) ) a 2 + 1 ( H h k ) a 2 + 1 ]
where K = Π/40,000, k = 26, 20, and 6 (Table 2), D2 is the breast height diameter without bark, and all other variables are as described above; ai are fitted parameters.
A comparison of predicted total volume per plot using TLS and stem analysis data versus local volume tables is shown in Table 8. Local tables always predicted lower volumes than the two alternatives. With the stem analysis data, differences from the local table predictions were fairly consistent across plots and varied from 12% to 21% (Table 8). In the case of the TLS taper function, it made volume predictions that were more similar to the local data, with differences ranging from 1% to 18%. Volume estimates from the TLS-derived taper function were clearly better than that from the stem-analyses derived taper function in plots 6–8 where there were mainly big trees (Figure 3).
Table 9 shows a comparison of predictions from Model 2 using the TLS and stem-analysis data. All regressions had correlation coefficients ≥97%. The majority of slopes were within 20% of unity, except for predictions of merchantable volume and the percent merchantable volumes in medium logs, which were 0.7 and 0.77, respectively (Table 9).

4. Discussion

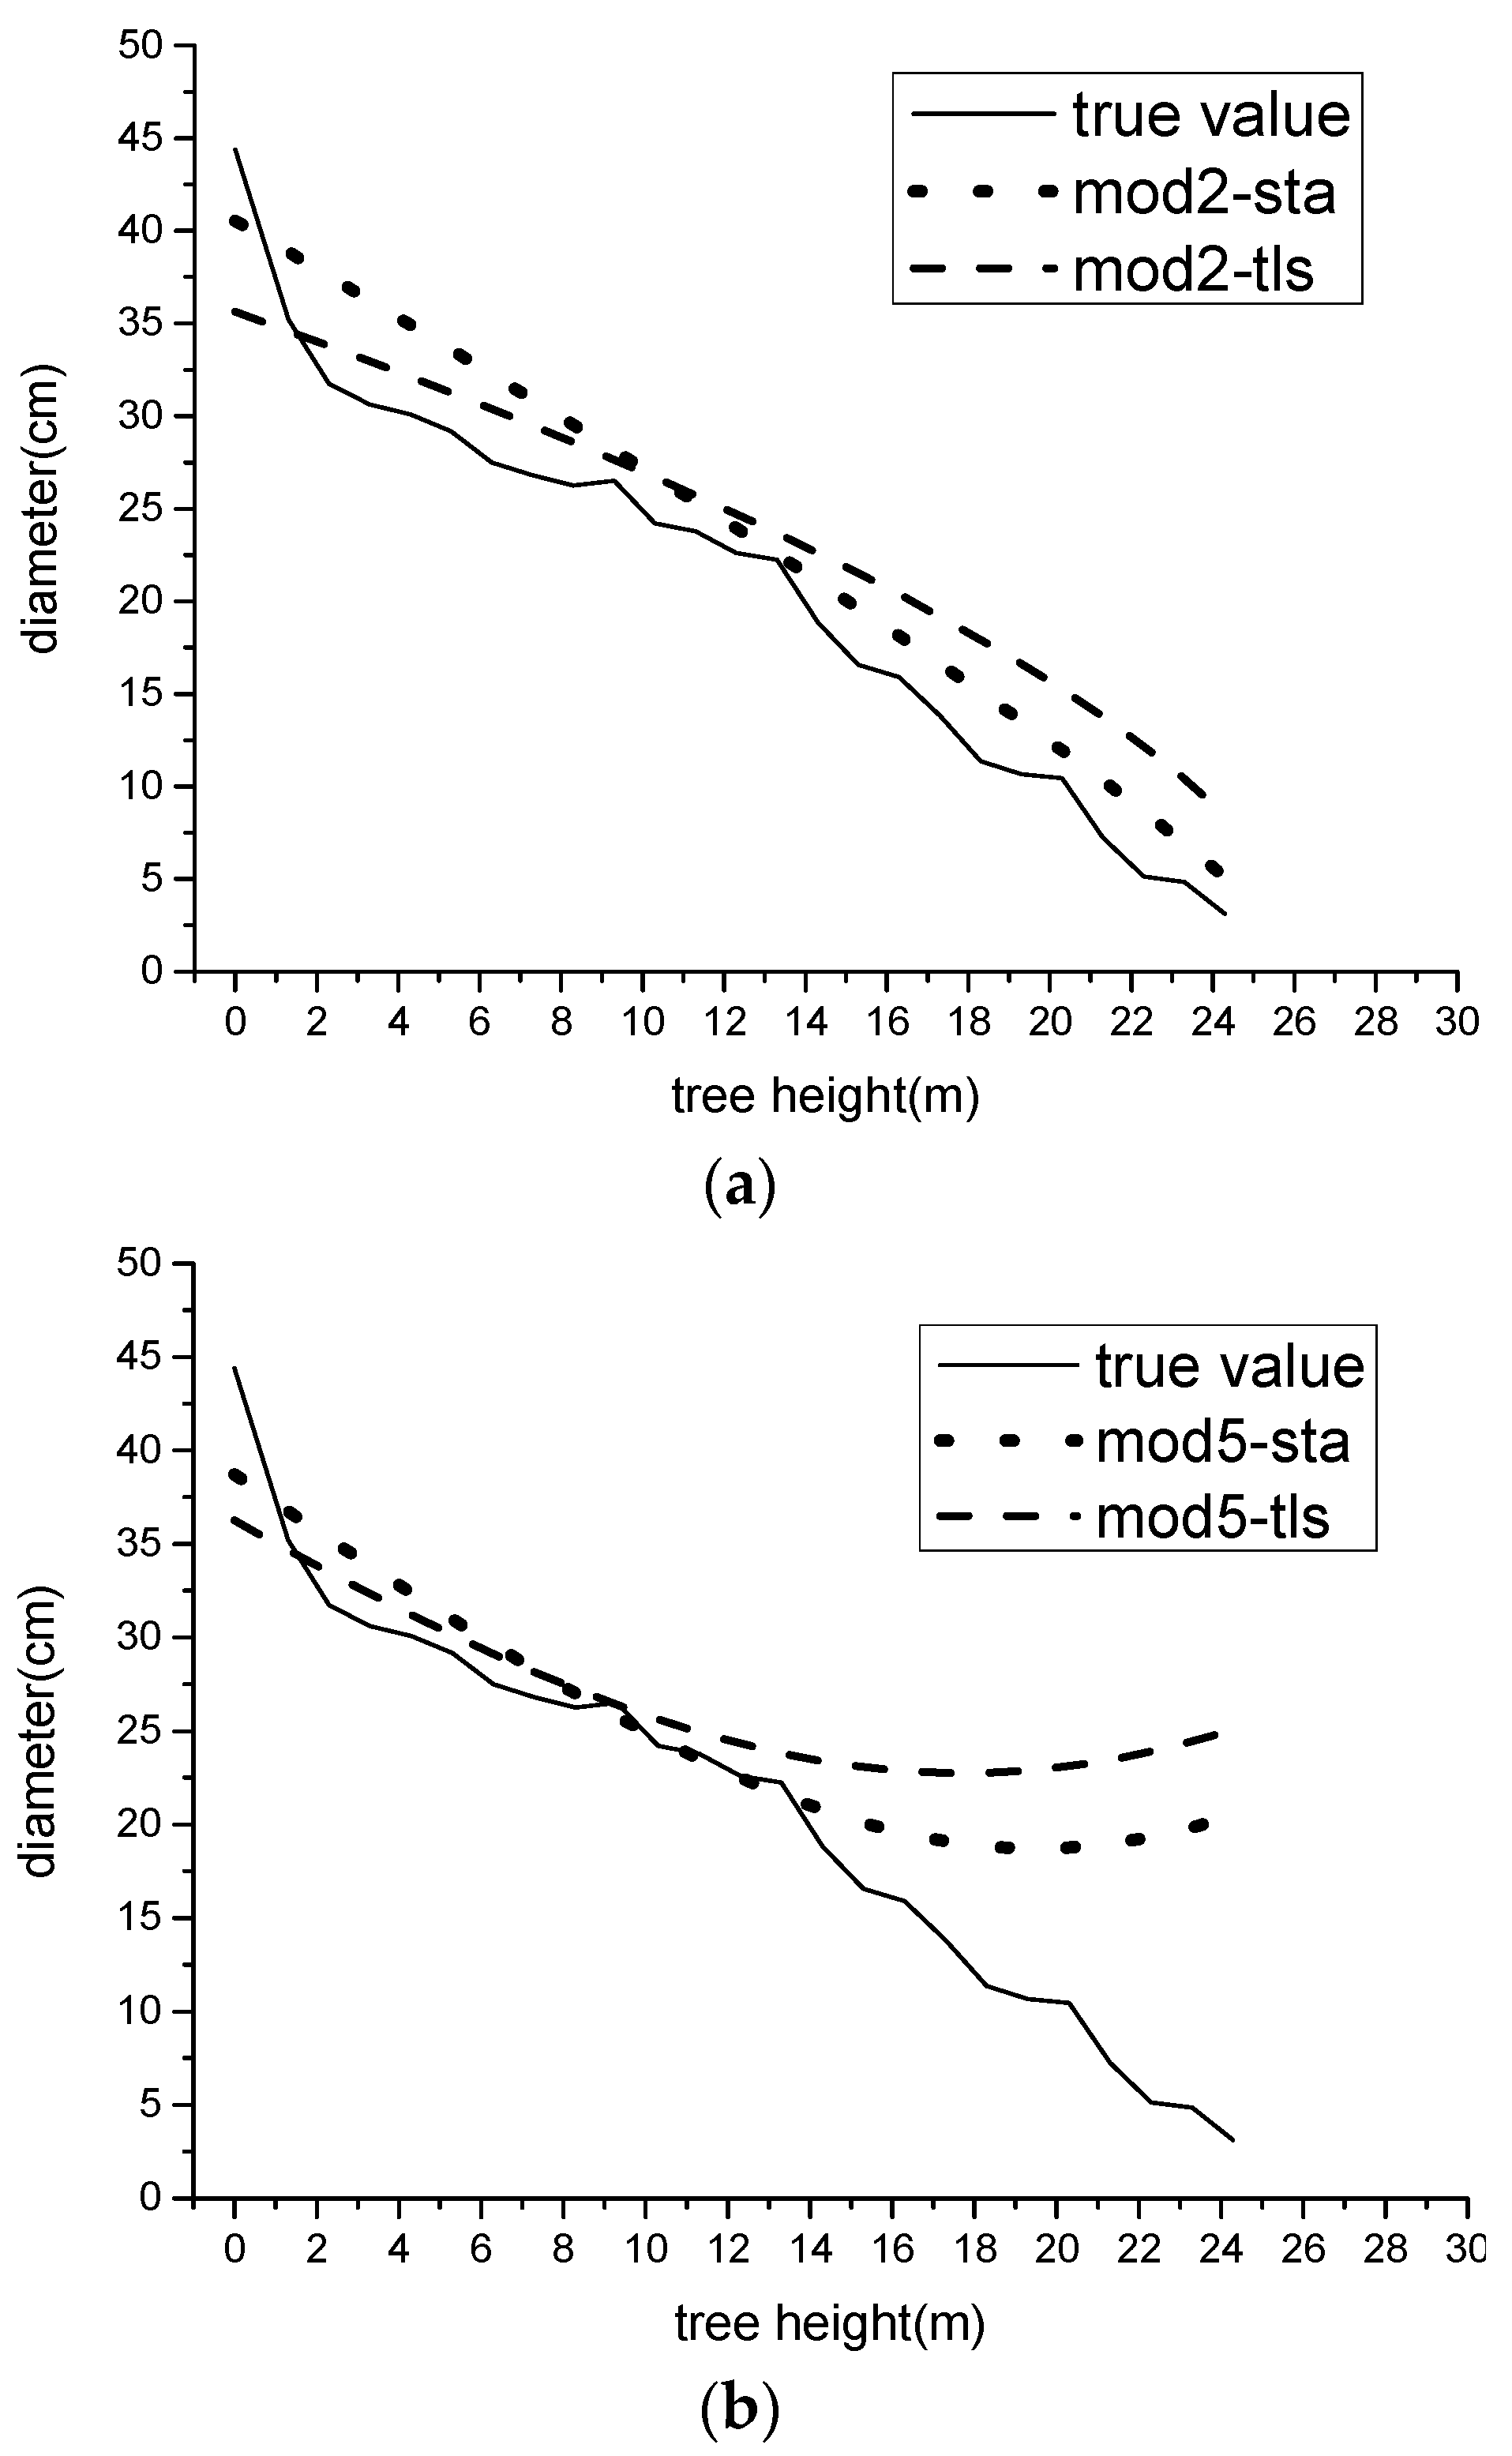
This study evaluated the feasibility of deriving localized taper function for poplar through non-destructive automated TLS measurement. The modified Schumacher function (Model 2) provided the overall best fit, and fitting stem curves with this equation based on TLS data yielded a fit comparable to stem analysis. This suggests that, at least at the plot level, TLS is a suitable method for estimating stem taper without the need for destructive sampling.
Taper functions are used when upper stem diameters need to be estimated based on a DBH and total tree height [32]. A slight but significant improvement in the Schumacher equation was obtained by using d2 as the dependent variable. After model evaluations, predictions of upper stem diameters were compared between the two best models, Equations (2) and (5). Model 5 has a variable exponent which changes continuously along the stem. The stem analysis data, however, showed that the upper diameters were not normally distributed. That likely reduced its predictive accuracy relative to Model 2.
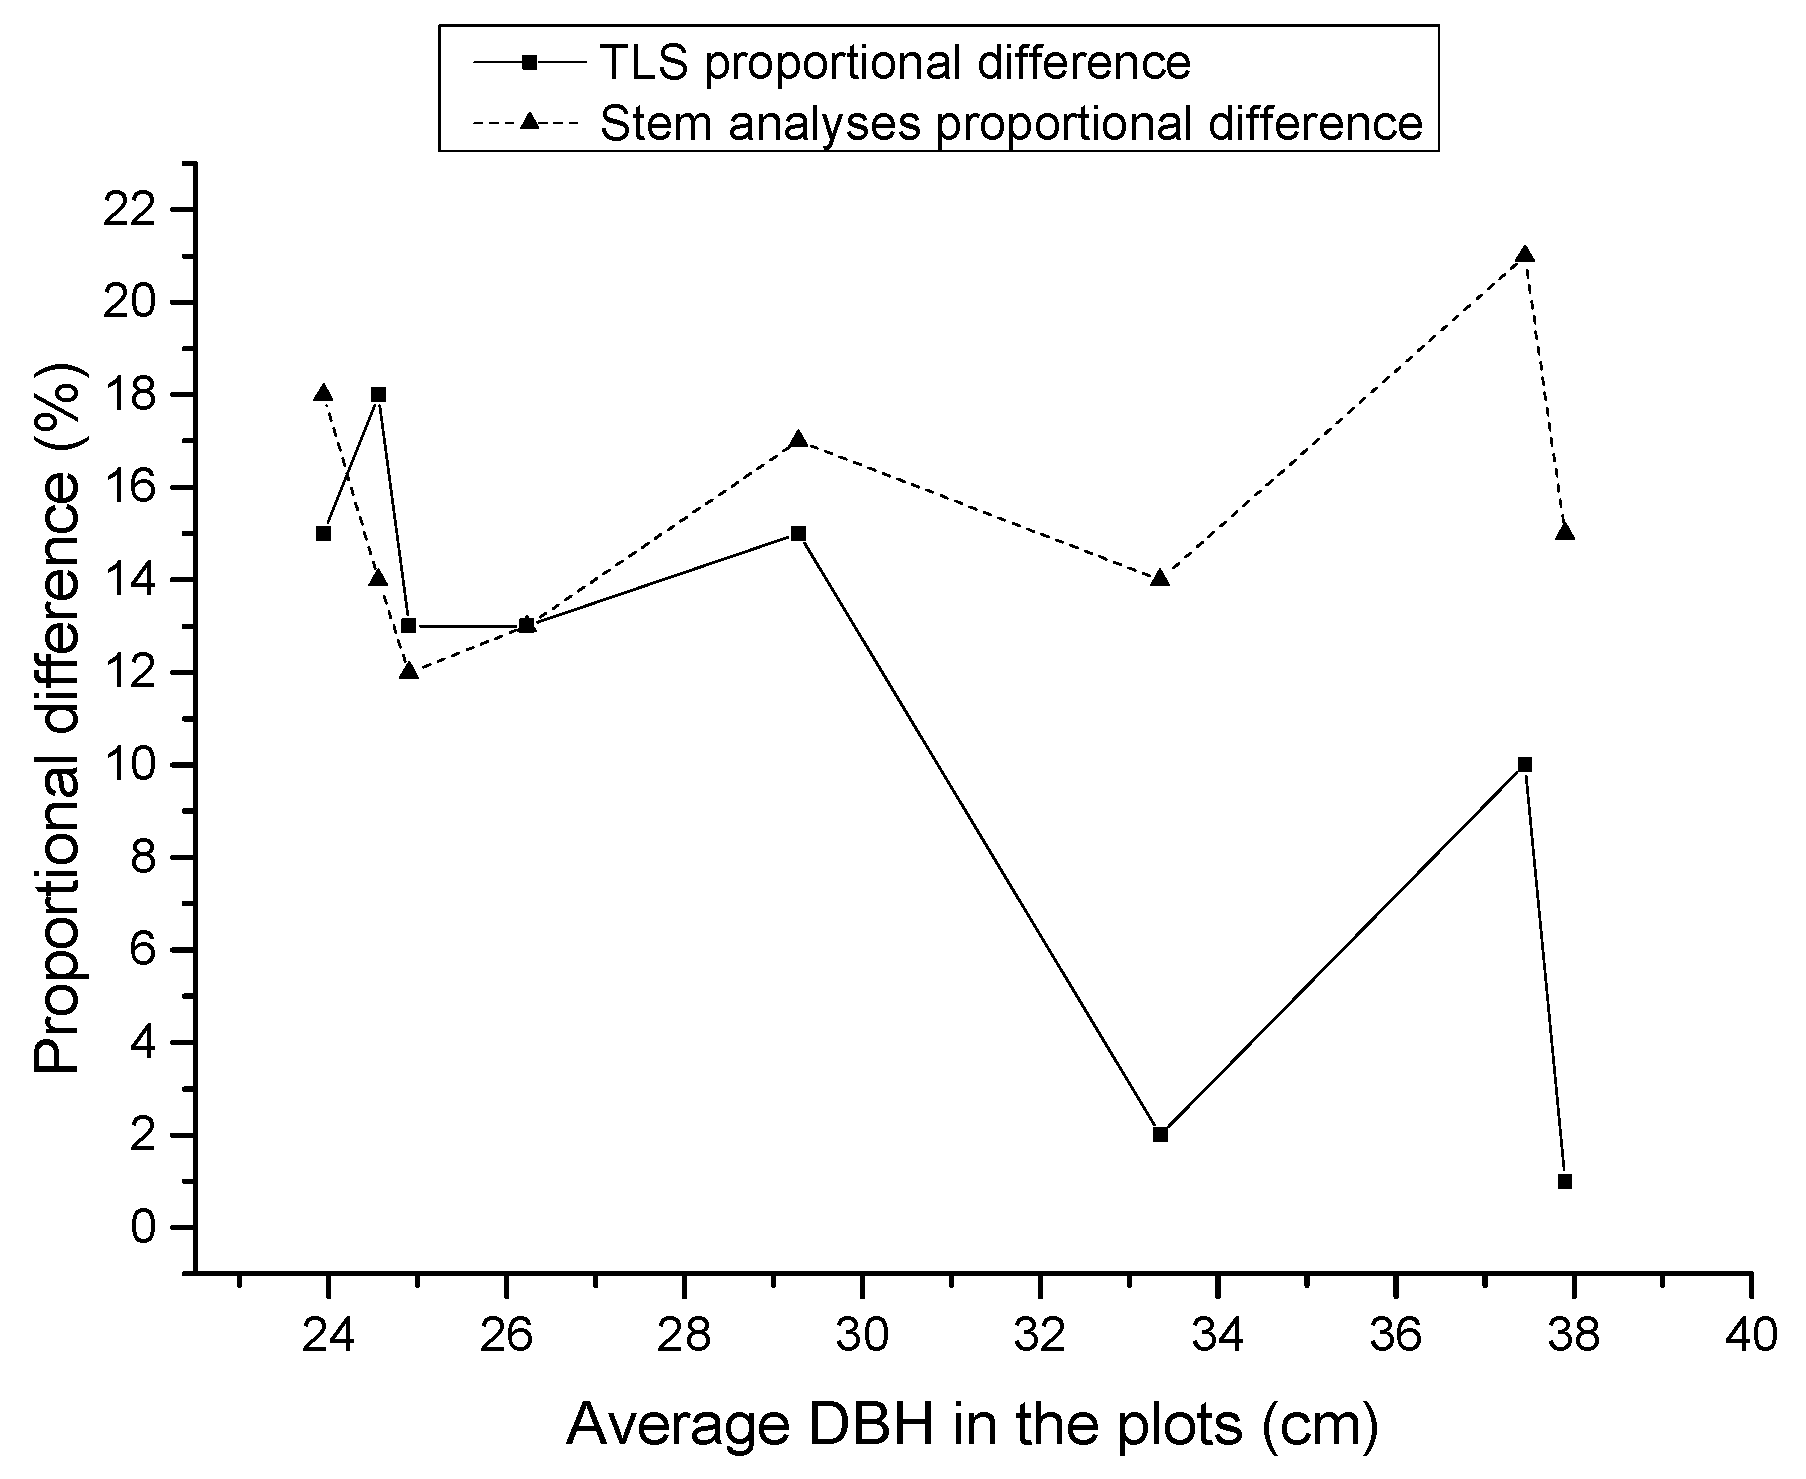
Deriving the taper function in a hybrid poplar stand based on TLS yielded a fit comparable to what was achieved from the stem analyses. However, TLS offers important advantages over the latter methodology. First, TLS requires less time and labor. Our methodology utilized only a single scanner, with three targets and tripods for the scanner. Three persons were needed to carry and operate the instrumentation, with each plot requiring only 2–3 h to complete. A second advantage is that, in contrast to stem analysis, tree cutting is not required, nor is there a necessity for stem diameter measurements. Hence, TLS taper functions could be quickly developed for a much larger number of species, or for the same species under different growth conditions. Furthermore, the point cloud data provide a detailed 3D representation of the tree stems on the plots. From a series of sequential measurements, it should thus be possible to accurately characterize changes in stand composition and structure [21], thereby improving management and planning practices.
A limitation of TLS is that the area of coverage per scan is small. This means a number of sample plots will be required to properly assess a stand spread over a large area. One approach to resolving this issue is to combine TLS with multiple-source remote sensing data. Mobile laser scanning (MLS) [18] and hand-held mobile laser scanning (HMLS) are examples [33]. With this approach, a scan is conducted from a moving vehicle, while the navigation system, typically based on a global navigation satellite system and inertial measurement unit, tracks the vehicle’s trajectory and attitude. This information is used to produce a 3D point cloud from the range data collected by the onboard scanners [18]. Although there are limitations related to vehicular access (lack of roads and difficult terrain), this approach has considerably lower costs when compared to another alternative, airborne laser scanning approach [17].
Our success in the application of TLS to a hybrid poplar plantation was a result, in part, because trees were of uniform age and spacing, and large enough that stems could be clearly scanned. In addition, the site was flat and uniformly contoured. These conditions are seldom realized in natural forests where trees are often irregularly dispersed and with a broad range of growth forms. This can limit the effectiveness of the scan. Young stands can also be problematic because stem sizes are small, so their lower portions can be obscured by understory vegetation. Though TLS may not be suitable for all stand conditions, the relative ease with which accurate data can be collected and analyzed highlights its utility as a forest management tool. To solve some of its limitations, a multi-return TLS or full-wave form TLS could be used to obtain more reflectance laser points.

5. Conclusions

A modified Schumacher equation was the most effective taper function for predicting stem diameters based on the breast height diameter and total tree height. TLS provided a comprehensive estimate of stem curve and volume using all stems within a plot. In that regard, its estimates compared very favorably to those derived from stem analysis. TLS holds considerable promise as a tool in forest management given its accuracy and the efficiency with which samples can be obtained and analyzed.

Acknowledgments

The authors acknowledge the financial support of the Co-Innovation Center for Sustainable Forestry in Southern China, Nanjing Forestry University, the Priority Academic Programmer Development of Jiangsu Higher Education Institutions (PAPD), and the specialized research fund for doctoral program of higher education in China (20133204130001). The author is grateful to employees of the poplar plantation farm in Lianshui County, for assistance in the field measurements. We are grateful to the referees for comments that helped improved the paper.

Author Contributions

Sun Yuan was the principal researcher. Liang Xinlian proposed and co-designed the research, and assisted in writing. Liang Ziyu assisted with data analysis. Clive Welham edited the paper and provided assistance with data analysis. Li Weizheng provided field assistance.

Conflicts of Interest

The authors declare no conflict of interest. The founding sponsors had no role in the design of the study; in the collection, analyses, or interpretation of data; in the writing of the manuscript; nor in the decision to publish the results.

References

  1. Jiang, L.; Brooks, J.R.; Wang, J.X. Compatible taper and volume equations for yellow-poplar in West Virginia. For. Ecol. Manag. 2005, 213, 399–409. [Google Scholar] [CrossRef]
  2. Gray, H.R. The form and taper of forest-tree stems. Univ. Oxf. Imp. For. Inst. Pap. 1956, 32, 1–74. [Google Scholar]
  3. Gaffrey, D.; Sloboda, B.; Matsumura, N. Representation of tree stem taper curves and their dynamic, using a linear model and the centroaffine transformation. J. For. Res. 1998, 3, 67–74. [Google Scholar] [CrossRef]
  4. Kozak, A. My last words on taper equations. For. Chron. 2004, 80, 507–515. [Google Scholar] [CrossRef]
  5. Xu, H.; Meng, X.Y. Study on taper functions and merchantable volume yielding rate tables of Picea schrenkianavartianshanica. J. Beijing For. Univ. 1996, 18, 21–30. [Google Scholar]
  6. Bluhm, A.; Garber, S.M.; Hibbs, D.E. Taper Equation and Volume Tables for Plantation-Grown Red Alder; General Technical Report; U.S. Department of Agriculture, Forest Service, Pacific Northwest Research Station: Portland, OR, USA, 2007. [Google Scholar]
  7. Rodríguez, F. Additively on nonlinear stem taper functions: A case for corsican pine in Northern Spain. For. Sci. 2013, 59, 464–471. [Google Scholar]
  8. Meng, X.Y. Studies of taper equations and the table of merchantable volumes. J. Nanjing For. Univ. 1982, 6, 122–132. [Google Scholar]
  9. Chao, L.; Barclay, H.; Huang, S.M.; Hans, H.; Ghebremusse, S. Sensitivity of predictions of merchantable tree height, log production, and lumber recovery to tree taper. For. Chron. 2013, 89, 741–752. [Google Scholar]
  10. Gong, J.R.; Zhang, X.S.; Huang, Y.M. Comparison of the performance of several hybrid poplar clones and their potential suitability for use in northern China. Biomass Bioenerg. 2011, 35, 2755–2764. [Google Scholar] [CrossRef]
  11. Spiecker, H. Tree rings and forest management in Europe. Dendrochronologia 2002, 20, 191–202. [Google Scholar] [CrossRef]
  12. Subedi, N.; Sharma, M. Evaluating height–age determination methods for jack pine and black spruce plantations using stem analysis data. North. J. Appl. For. 2010, 27, 50–55. [Google Scholar]
  13. Sun, Y. Study on Models of Poplar Growth and Estimation with Yield Table in Jiangsu Province. Master’s Thesis, Nanjing Forestry University, Nanjing, China, 2006. [Google Scholar]
  14. Zhou, J.; Zhang, Z.Q.; Sun, G.; Fang, X.R.; Zha, T.G.; McNulty, S.; Chen, J.Q. Response of ecosystem carbon fluxes to drought events in a poplar plantation in Northern China. For. Ecol. Manag. 2013, 300, 33–42. [Google Scholar] [CrossRef]
  15. Newnham, G.J.; Armston, J.D.; Calders, K.; Disney, M.L.; Lovell, J.L.; Schaaf, C.B.; Strahler, A.H.; Danson, F.M. Terrestrial laser scanning for pot-scale forest measurement. Remote Sens. 2015, 1, 239–251. [Google Scholar]
  16. Pirotti, F.; Grigolato, S.; Lingua, E.; Sitzia, T.; Tarolli, P. Laser scanner applications in forest and environmental sciences. Ital. J. Remote Sens. 2012, 44, 109–123. [Google Scholar] [CrossRef]
  17. Kukko, A.; Kaartinen, H.; Hyyppä, J.; Chen, Y. Multiplatform mobile laser scanning: Usability and performance. Sensors 2012, 12, 11712–11733. [Google Scholar] [CrossRef]
  18. Liang, X.; Kankare, V.; Hyyppä, J.; Wang, Y.; Kukko, A.; Haggrén, H.; Yu, X.; Kaartinen, H.; Jaakkola, A.; Guan, F. Terrestrial laser scanning in forest inventories. ISPRS J. Photogramm. Remote Sens. 2016. [Google Scholar] [CrossRef]
  19. Chinese Forestry Society; National Poplar Commission. Forest resource, timber production and popular culture in China. In Proceedings of the 1st International Conference on the Future of Poplar, Rome, Italy, 13 November 2003.
  20. Isebrands, J.G.; Richardson, J. (Eds.) Poplar and Willows: Trees for Society and the Environment; CAB International: Wallingford, UK, 2014.
  21. Liang, X.L.; Kankare, V.; Yu, X.; Holopainen, J.; Hyyppä, M. Automatic stem curve measurement using terrestrial laser scanning. IEEE Geosci. Remote Sens. 2014, 52, 1739–1748. [Google Scholar] [CrossRef]
  22. Henning, J.G.; Radtke, P.J. Detailed stem measurements of standing trees from ground-based scanning lidar. For. Sci. 2006, 52, 67–80. [Google Scholar]
  23. Schumacher, F.X.; Hall, F.S. Logarithmic expression of timber tree volume. J. Agric. Res. 1993, 47, 719–734. [Google Scholar]
  24. Yan, R.H.; Wu, F.Z. A study on variable merchantable volume estimation system. J. Nanjing For. Univ. 1992, 16, 31–37. [Google Scholar]
  25. Ormerod, D. A simple bole model. For. Chron. 1971, 49, 136–138. [Google Scholar] [CrossRef]
  26. Kozak, A.; Smith, J.H.G. Critical analysis of multivariate techniques for estimating tree taper suggests that simpler methods are best. For. Chron. 1966, 41, 458–463. [Google Scholar] [CrossRef]
  27. Nagashima, I.; Yamamoto, M.; Sweda, T. A theoretical stem taper curve (I). J. Japanese For. Soc. 1980, 26, 217–226. [Google Scholar]
  28. Yamashita, N.; Fukushima, M. On the rate of convergence of the Levenberg—Marquardt method. Computing 2001, 15, 239–249. [Google Scholar]
  29. Dan, H.; Yamashita, N.; Fukushima, M. Convergence properties of the inexact Levenberg—Marquardt method under local error bound conditions. Optim. Methods Softw. 2002, 17, 605–626. [Google Scholar] [CrossRef]
  30. The People’s Republic of China National Standard of Logs for Direct—Pit-Props (GB142-2013), China Standard Publishing House. September 2014. Available online: http://www.csres.com/detail/236833.html (accessed on 11 April 2014).
  31. One-Way Volume Table of Odd-Populus. Available online: http://www.tsinfo.js.cn/inquiry/gbtdetails.aspx?A100=DB32/T%202349-2013 (accessed on 30 September 2013).
  32. Bailey, R.L. A compatible volume-taper model based on the schumacher and hall generalized constant form factor volume equation. For. Sci. 1994, 40, 303–313. [Google Scholar]
  33. James, M.; Quinton, J. Ultra-rapid topographic surveying for complex environments: The hand-held mobile laser scanner (HMLS). Earth Surf. Proc. Landf. 2014, 39, 138–142. [Google Scholar] [CrossRef]
Figure 1. An illustration of tree stem, scanning stations, and reference target locations in a 15-m circular plot. S0 to S4 represent the four scanning locations, and the triangles show the three reference points.
Forests 07 00087 g001
Figure 2. Predicted stem diameter in relation to tree height, as derived using stem analysis (sta) and laser scanning data (tls), from Model 2 (a) and Model 5 (b). Also shown are the corresponding measured (true) values.
Forests 07 00087 g002
Figure 3. Percent difference in total volume prediction as compare with local volume table data.
Forests 07 00087 g003
Table 1. Laser scanner specifications.
SpecificationsLeica Scanstation C10
Field-of-View (Horizontal × Vertical)360° × 270°
Range300 m @90%;134 m @18% albedo (minimum range 0.1 m)
Scan RateUp to 50,000 points/second
TypePulsed; proprietary microchip
Table 2. Poplar merchantable volume specifications.
Log LengthMinimum Top Diameter under Bark (cm)Minimum Length (m)Use
Large>26≥2Special timber, plywood, ship-building wood
Mid-length>20–26≥2Normal timber, pit wood, pile timber
Short6–20≥2Civil timber, pulpwood
Table 3. Diameter at breast height (DBH) distribution (n = 198).
DBH (cm)9–14>14–19>19–24>24–29>29–34>34–39>39–44
Frequency719335254303
Table 4. Summary tree attributes by plot (n = 8).
Plot Number12345678
Number of trees1628322728182623
Basal area (G) (m2/ha)12.117.415.113.415.614.413.115.9
DBH (cm)Max40.838.033.934.841.338.234.636.8
Min17.814.813.610.710.723.99.123.4
Mean29.529.024.724.925.133.125.630.7
Tree Height (m)Max25.929.826.526.626.927.627.829.2
Min15.024.912.512.514.719.811.321.2
Mean21.327.621.621.822.224.423.526.3
Table 5. Summary of stem analysis data by tree.
TreePlot NumberAge (Years)DBH (cm)Height (m)
111835.226.6
212135.628.2
322431.929.8
422437.530.0
531727.221.3
631724.222.4
742026.124.7
842122.620.6
952224.522.4
1052121.722.8
1162334.224.9
1262237.227.6
1372027.623.7
1472134.627.2
1581931.929.2
1682136.826.9
Table 6. Statistics derived after fitting six taper equations.
ModelStem AnalysisTLS Data
RMSE (cm2)R2RMSE (cm2)R2
161.20.9662.10.96
260.90.9661.80.96
399.10.88130.70.80
465.30.9567.50.95
561.10.9655.20.97
6142.40.6584.30.90
Table 7. Comparison of Equation (2) predictions when calibrated with stem analysis versus terrestrial laser scanning (TLS) data.
Stem AnalysisTLS
Parametera0a1a2a3R2a0a1a2a3R2
Estimate1.102.631.702.320.9551.622.011.311.470.96
std. error0.120.110.020.110.130.010.010.03
95% confidence intervallower bound0.862.411.652.101.371.981.290.41
upper bound1.332.851.742.541.892.041.341.52
Table 8. Predicted total volume, including bark, ranked by DBH.
Average DBH in the plot (cm)23.924.624.926.229.333.437.537.9
Local volume tables (m3)0.380.410.420.490.660.951.301.34
TLS (m3)0.440.480.480.550.760.971.431.35
Percent difference15181313152101
Stem analysis (m3)0.450.470.480.560.771.081.571.55
Percent difference 11814121317142115
1 Expressed as the difference from the local volume table predictions [31].
Table 9. Regression analysis for TLS (x-axis) versus stem analysis (y-axis) predictions from Model 2.
Log TypesSmallMediumLarge
VariableSlopeR2SlopeR2SlopeR2
Accumulated log length1.010.990.980.990.900.99
Merchantable volume0.890.990.700.981.160.99
Percent of merchantable volume 0.990.970.770.990.820.99

