
Estimates of Wildfire Emissions in Boreal Forests of China

1
Institute of Remote Sensing and Digital Earth (RADI), Chinese Academy of Sciences (CAS), Beijing 100101, China
2
College of Geography Science, Inner Mongolia Normal University, Hohhot 101022, China
*
Author to whom correspondence should be addressed.
Forests 2016, 7(8), 158; https://doi.org/10.3390/f7080158
Submission received: 29 March 2016
/
Revised: 7 July 2016
/
Accepted: 21 July 2016
/
Published: 1 August 2016
(This article belongs to the Special Issue Fire Regimes: Spatial and Temporal Variability and Their Effects on Forests)
Abstract
:Wildfire emissions in the boreal forests yield an important contribution to the chemical budget of the troposphere. To assess the contribution of wildfire to the emissions of atmospheric trace species in the Great Xing’an Mountains (GXM), which is also the most severe fire-prone boreal forest region in China, we estimated various wildfire activities by combining explicit spatio-temporal remote sensing data with fire-induced emission models. We observed 9998 fire scars with 46,096 km2 in the GXM between the years 1986 and 2010. The years 1987 and 2003 contributed 33.2% and 22.9%, respectively, in burned area during the 25 years. Fire activity is the strongest in May. Most large fires occurred in the north region of the GXM between 50° N and 54° N latitude due to much drier weather and higher fire danger in the northern region than in the southern region of the study domain. Evergreen and deciduous needleleaf forest and deciduous broadleaf forest are the main sources of emissions, accounting for 84%, 81%, 84%, 87%, 89%, 86%, 85% and 74% of the total annual CO2, CH4, CO, PM10, PM2.5, SO2, BC and NOx emissions, respectively. Wildfire emissions from shrub, grassland and cropland only account for a small fraction of the total emissions level (approximately 4%–11%). Comparisons of our results with other published estimates of wildfire emissions show reasonable agreement.

1. Introduction
Wildfire is a critical disturbance factor in the boreal forests, which acts as a double-edged sword in the natural context. On the one hand, fire is traditionally used as a tool to aid in many land use and related changes, including the clearing of forests for agriculture and for shifting agricultural practices. Wildfire is an important part of ecosystem services, providing nutrients and recycling material. On the other hand, wildfire always releases some emissions of gases and aerosols to the atmosphere [1]. It is considered a major source of aerosol that affects air quality, atmospheric composition and the Earth’s radiation budget [2,3]. Smoke emitted by fires is composed of volatile organic compounds [4], particulate matter (PM) and numerous trace gases, including carbon monoxide (CO), carbon dioxide (CO2), methane (CH4) and nitrogen oxides [5]. Globally, wildfire contributes approximately 50% of the total direct CO emissions and approximately 15% of surface NOx emissions [6]. Most of these particular matters and trace gases can have significant effects, not only on human health but also affect the climate, with potential feedback on air quality. As gaseous and aerosol emissions from fires are transported through the atmosphere, they degrade air quality by reducing visibility, creating unhealthy levels of PM, and reacting to create harmful tropospheric trace gases, such as ozone (O3) [7]. Some species have significant and far-reaching consequences due to their long lifetime (e.g., N2O: ~150 years, CO2: ~100 years, CH4: ~10 years) [8]. In addition, smoke and PM influences precipitation processes, resulting in delayed, suppressed or invigorated rainfall, which changes cloud albedo [9], scatters and absorbs solar radiation [10,11], affecting atmospheric warming or cooling and contributing to climate change [12,13,14].
With increasing scientific and political concern regarding the carbon cycle, there is a strong impetus to better understand wildfire carbon emissions on both a global and regional scale. For several decades, researchers have made great efforts to estimate burned biomass emissions from ground-based and in situ measurements. Both spatial and temporal coverage of these studies is severely limited in pre satellite era [15,16,17]. However, during the past two decades, major advances have occurred in the detection of atmospheric pollution from space. The generation of satellite instruments launched since 1995 has proven to be capable of observing a wide range of chemical species at increasingly high spatial and temporal resolutions [18,19,20]. In addition, the transformation of raw satellite retrievals to user-friendly, archived products has considerably progressed, such that the application of satellite observations to a wide range of atmospheric problems is no longer a daunting prospect. Space-based observations, such as the Along-Track Scanning Radiometer (ATSR) [21] and the Moderate Resolution Imaging Spectroradiometer (MODIS), provide information concerning global burning hotspots at a spatial resolution of 1 km, which have allowed a better identification of wildfire and emissions [22].
Previous studies have attempted to estimate the amount of burned biomass and the fire-induced emissions in China [23,24,25]. The total amount of carbon emitted per year via the burning of terrestrial biomass in China has been estimated at 11.31 Tg from 1950 to 2000 [25]. This amount of carbon emissions has resulted from the atmospheric emissions of three trace gases: 40.6 Tg year−1 CO2, 27.1 Tg year−1 CO and 0.112 Tg year−1 CH4, besides 0.113 Tg year−1 NMHC (non-methane hydrocarbons) [25]. Black carbon (BC) emissions have increased at an average annual rate of 25.54%, from 0.014 Tg in 1990 to 0.067 Tg in 2005 [23]. Nevertheless, current approaches depend on factors such as scale, accuracy requirements and information availability, among others. Therefore, a longer-term, higher-resolution study into the emissions from wildfire on both a global and regional scale is required.
Local estimates are necessary to understand micro-scale emission mechanisms, whereas regional and global modeling is essential to assess the net effects of emissions on the atmosphere and on global climate change [26]. Some articles argue that China should take more responsibility for climate change mitigation than other counties due to much CO2 emissions by fossil fuel consumption and by wildfire [27,28,29]. In China, the most severe fire-prone area is the northeastern region, particularly the GXM region. Wildfire is inevitable and is ecologically important in forests throughout much of the GXM because of the fuels, ignition sources and variable climatic conditions. It has been roughly estimated that 1.2 × 10⁷ Mg carbon emissions were released from forest fires, with approximately 1.0 × 10⁶ hm2 of forest burned in the GXM during the period from 1980 to 2005 [30]. To assess the atmospheric impact of biomass burning quantitatively, accurate emissions estimates of trace gases and aerosols are required. The purpose of this work is to provide estimates of total direct emissions from wildfire by combining explicit spatio-temporal remote-sensing data with fire-induced emission models. Another major objective of this investigation is to estimate the potential range and spatial-temporal patterns of wildfire events in the GXM area. We also attempt to identify gaps and limitations in existing data and methods that must be studied in the future to improve our understanding of the role of wildfire in regional carbon dynamics.
2. Materials and Methods
2.1. Study Area
The Great Xing’an Mountains (GXM), which lie on China's northern border frontier and neighbor Russia in the north and Mongolia in the west, are commonly defined as stretching from the Heilongjiang (or Amur) River in the north to the Silas Moron River in the south. This study focuses on the Hulun Buir Plateau and the majority of the GXM (Figure 1). This region is primarily a hilly mountainous region that ranges from 450 m to 1500 m in elevation. The climate is terrestrial monsoon, with long, severe winters (mean January temperature −28.5 °C) and short, mild summers (mean July temperature 17 °C). Precipitation, which peaks in summer, is 420 mm annually and is unevenly distributed throughout the year, with more than 60% of precipitation occurring between June and August. Vegetation in this region falls within the cool temperate coniferous forests, which occur at the southern extension of the eastern Siberian light coniferous forest [31].
The species composition is relatively simple, and the forest area covers over 75% of the study area. The most dominant tree species is larch, which accounts for 80% of the study area. The second most dominant species is birch, which covers 10% of the study area. Other species, including pine, spruce, aspen and willow cover approximately 10% of the study area. Figure 1 show the land cover distribution in the study area, which was acquired from the Advanced Very High Resolution Radiometer (AVHRR) Global Land Cover Map (http://www.glcf.umd.edu/data/landcover).
2.2. Methodology:Carbon Emission Calculations
Over the past several decades, substantial efforts have been devoted to evaluating fire-induced carbon emissions, primarily by use of models. Specifically, remote-sensing technologies are assessed as a feasible way to estimate emissions from both a direct approach (i.e., smoke measurements) and an indirect approach (i.e., model emissions driving variables, such as fuel availability and combustion efficiency) [26].
The most general way to compute gas emissions is deterministic, where the trace gas emissions are linked to the amount and type of fuel consumed and to the combustion characteristics [32]. The amount of a specific gas or aerosol species, x, emitted as follows [32]:
where Mx is the mass of species x emitted from fire EFx is the mass of species x released per kilogram of the biomass burned (emission factor); and MBconsumed is the mass of the dry biomass burned. MBconsumed can be estimated using the following equation:
where BA (ha) is the area burned by fire; BD (kg ha−1) is the density of the dry biomass in the area; and BE (%) is burn efficiency or combustion completeness, i.e., the percentage of biomass consumed by fire. The model used in our study integrates a series of biophysical variables that can be estimated based on various sources from remote sensing imagery and from the literature.
Mx = MBconsumed × EFx
MBconsumed = BA × BD × BE
2.3. DeterMination of Variables
2.3.1. Burned Area (BA)
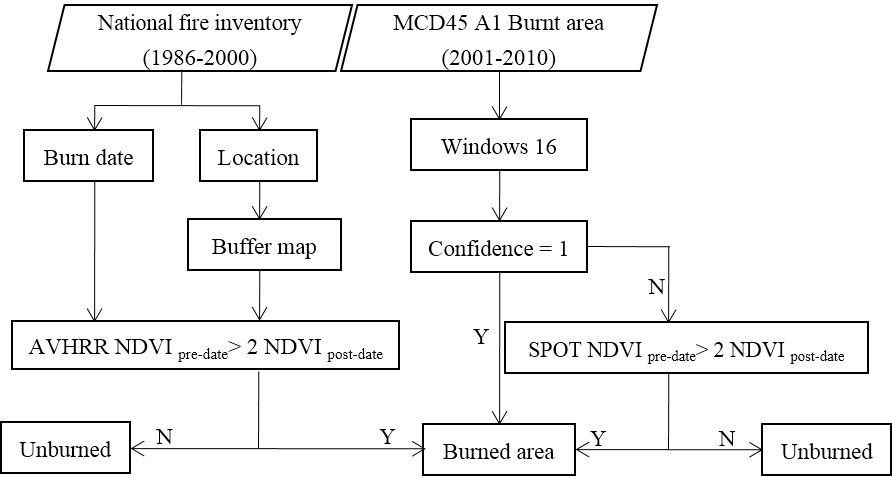
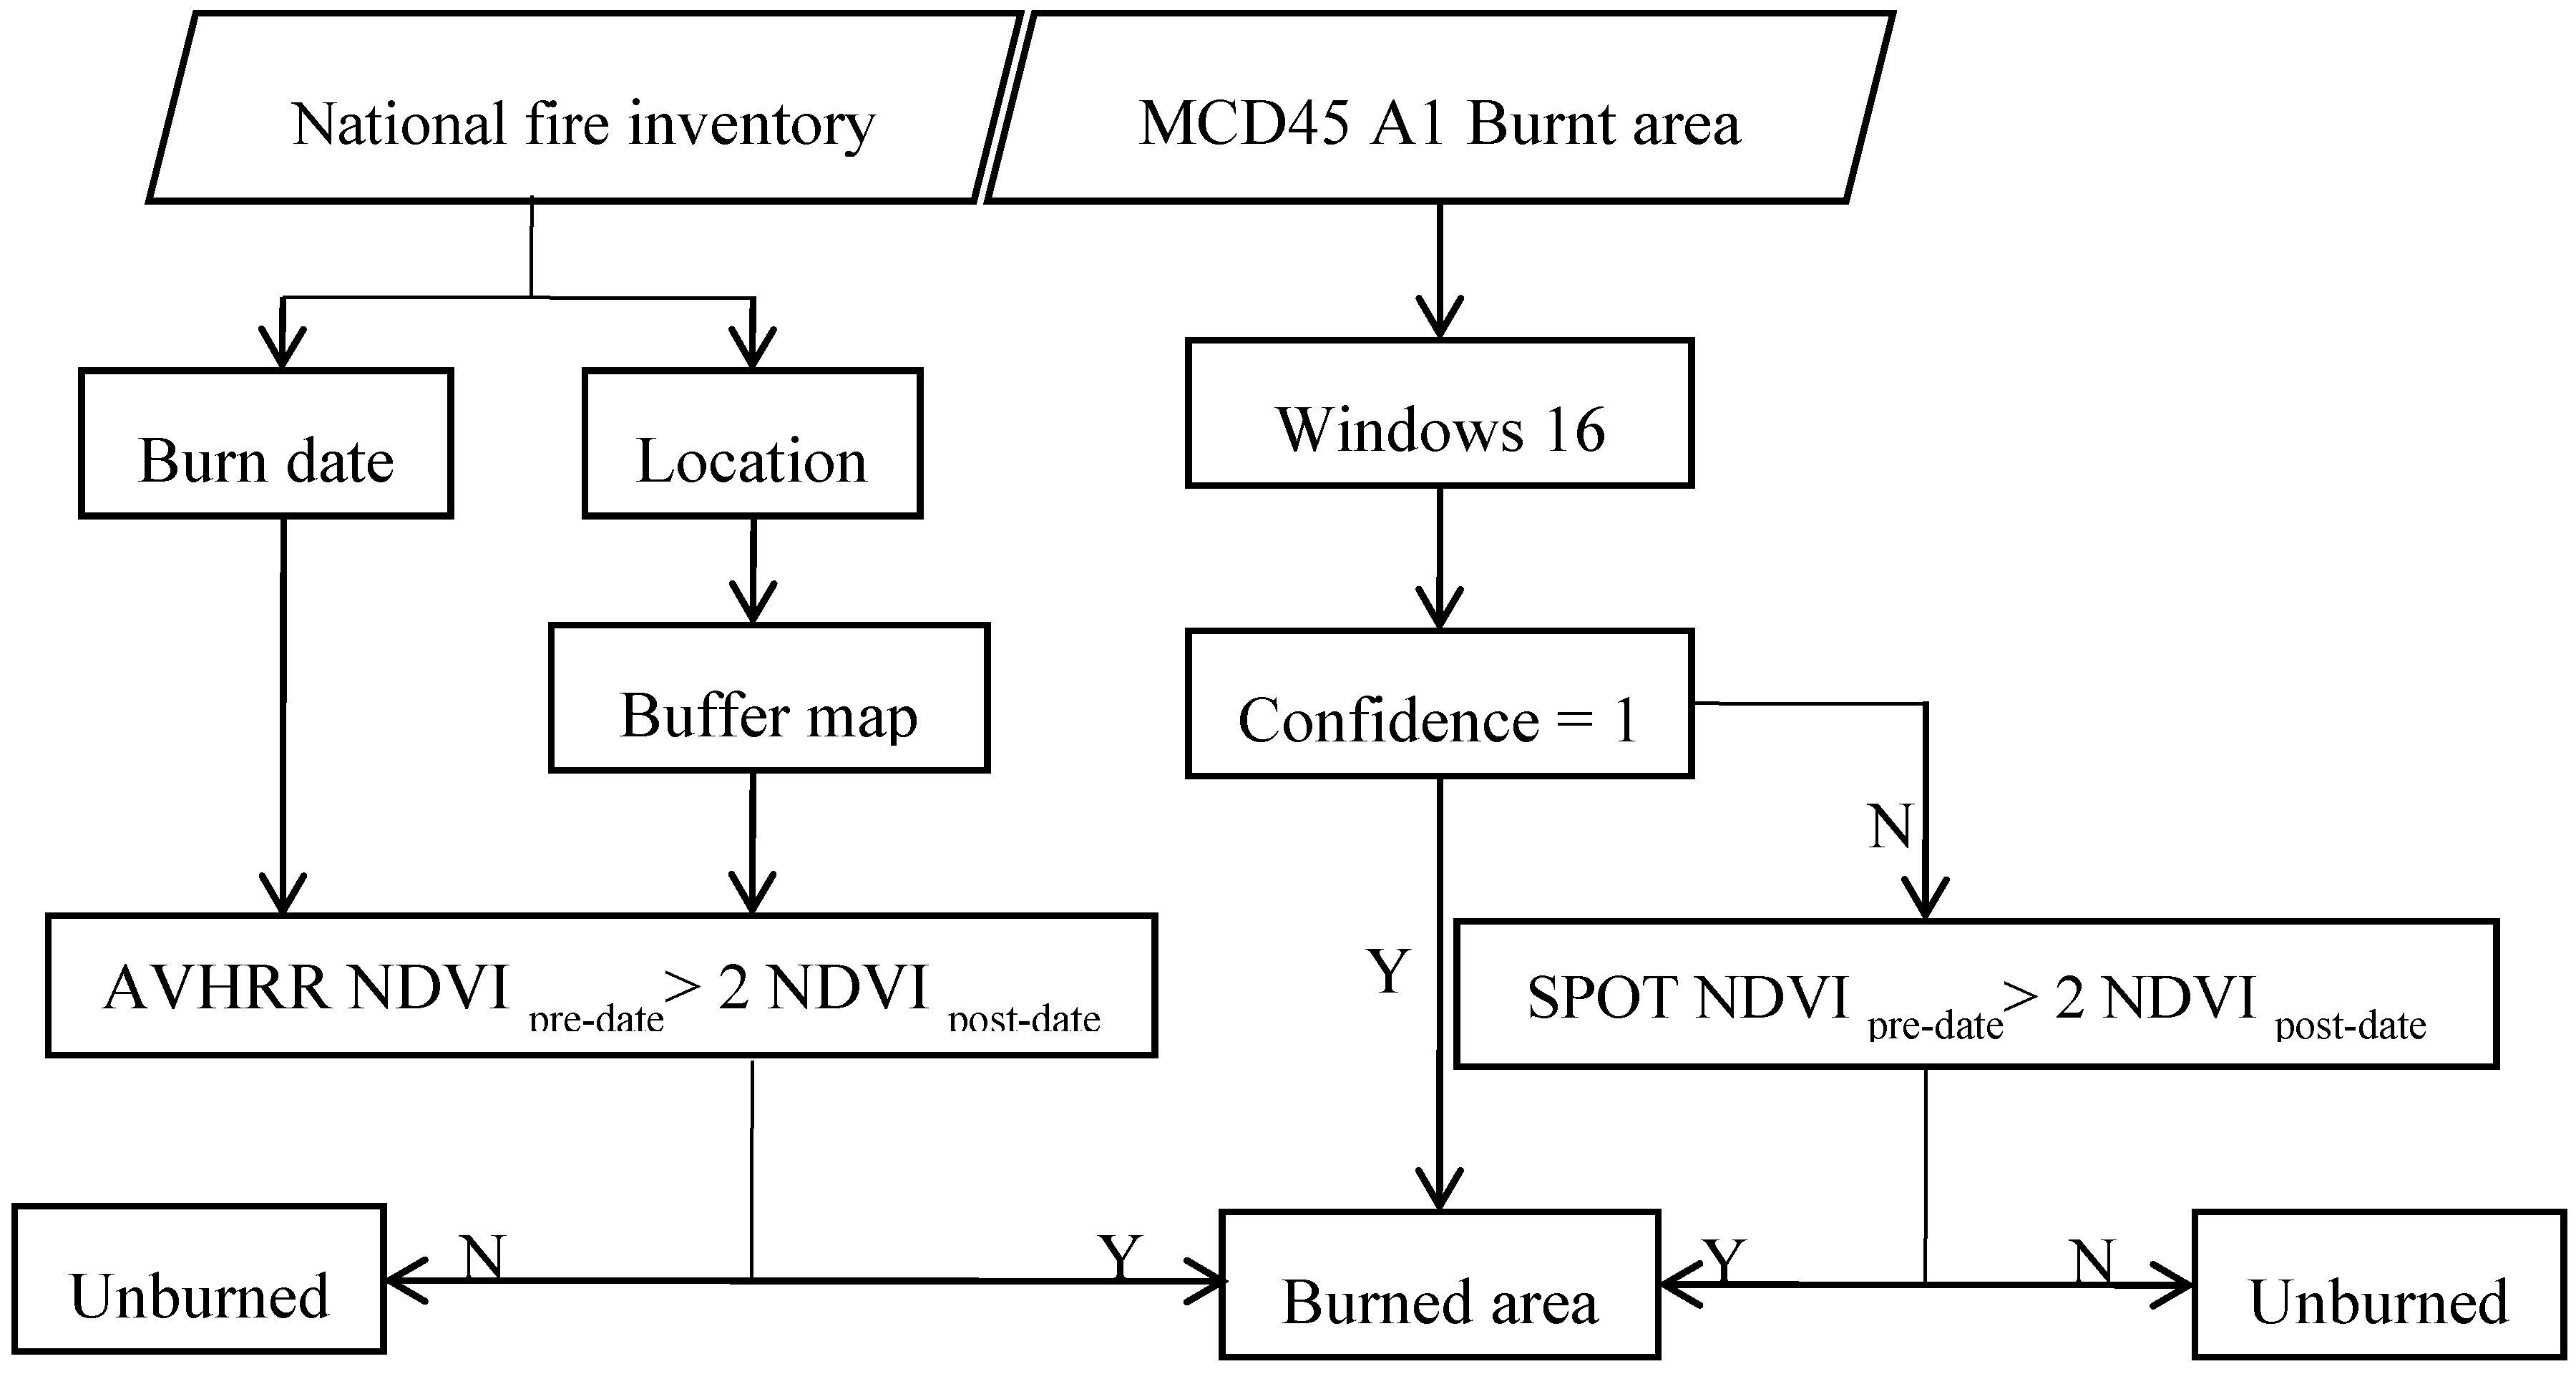
The Great Xing’an Mountain (GXM) is a typical fire-prone region, where many species have a recognized ability to regenerate after fire. Fire has been a primary disturbance in most forests of this region and has shaped their plant communities for millions of years [33,34,35]. The National Forestry Bureau (NFB) of China reported information on significant fires across China since 1950, including information on fire numbers, burnt areas, and fire locations. Historically, fire regimes in this region have been characterized by frequent, low intensity surface fires mixed with sparse stand-replacing fires in relatively small areas [36]. The historical burned areas used in this study were derived from NOAA (National Oceanic and Atmospheric Administration) AVHRR for 1986–2000. We can obtain burned date and fire location from national fire inventory. Firstly, we buffer a region as a rough burned area by using fire location. Then we compare AVHRR NDVI images of pre burn date and post burn date. If AVHRR NDVIpre is larger than two times NDVIpost, then the pixels were considered as burnt area. If not, the pixel will be flagged as unburnt area (Figure 2). The AVHRR NDVI datasets from 1986–2000 provided by National Aeronautics and Space Administration (NASA) (URL: http://daac.gsfc.nasa.gov/ DATASET _DOCS /avhrr_dataset.html).
For the period from 2000 to 2010, the burned area was estimated using the satellite MODIS MCD45 Burned Area Level3 product, which provides the most comprehensive data concerning fire-affected areas in remote boreal regions. MCD45A1 is a monthly, 500-m resolution product and has been available online since April 2000. In this study, MCD45A1 burned area dataset from 2001 to 2010 were obtained from USGS (URL:http://e4ftl01.cr.usgs.gov/MOTA/MCD45A1.005/). Uncertainty of MODIS burnt area is still substantial. On the one hand, overestimation of burnt area may occur as a consequence of including unburnt patches within pixels classified as burnt. On the other hand, underestimation of area burnt may occur in pixels where only a small fraction was burned. In this case, the satellite senor cannot capture such weak signals. Therefore, the confidence of MODIS burnt pixels detection was divided into four values (QA = 1 (most confident) to QA = 4 (least confident)). In this study, if burnt pixels QA = 1, then those pixels were flag as burnt; for those pixels with less confident (QA = 2, 3 or 4), we redefined them by comparing SPOT (Satellite for Observation of Earth) NDVI images of pre burn date and post burn date. A different satellite product, SPOT vegetation, was used to check the MODIS results. If evidence were found by both of them, then the results are right. Especially, if SPOT NDVIpre is larger than two times SPOT NDVIpost, then the pixels was considered as burnt area, otherwise, the pixels were considered as unburnt area (Figure 2).
2.3.2. Biomass Density (BD) and Burning Efficiency (BE)
Biomass density and burning efficiency are two uncertain parameters in biomass burning estimates due to the high-spatial variability of the burning process and of fuel availability, which are related not only to general ecosystem characteristics but also to the micro-scale environmental conditions. Trace gas emissions are directly related to biomass and land cover through the amount and composition of the fuel [26]. Simply stated, the higher the biomass density is, the higher the amount available for burning and, therefore, the greater the total quantity of carbon that can be released as trace gases [37]. In areas of low precipitation and in regions with dry periods of high temperature, biomass consumption is higher than in more humid climates in Brazil [38]. A linear relation between the annual area burned and the fraction of biomass consumed was revealed in previous study [39], they found that in warmer years, when a higher number of fires occur, burning efficiency is higher as well in boreal forests. Thus, in warmer years, when a higher number of fires occur, the burning efficiency is also higher [26]. It is infeasible to identify the specific meteorological conditions of each fire event. Most plants live in areas with very specific climate conditions. Phytogeography tells us that the geographic distribution of plant species is primarily decided by those regional climate characteristics, such as temperature and rainfall patterns. In this sense, the land cover map can also commendably reflect the site climate characteristics. Therefore, in this study, the biomass densities (BD) and burning efficiencies (BE) were derived from values published [40,41,42] using the AVHRR Global Land Cover Map (AVHRR GLC-2000) at a 1 km resolution. In this study, we presume that biomass below ground does not burn, although fires can burn deep into the ground under certain conditions, such as peat fire. Table 1 shows the determination of biomass densities (BD) and burning efficiencies (BE), whose values are derived from published literature based on specific sites across the globe. Thus, we can get biomass density and burned efficiency on pixel level (Figure 3).
2.3.3. Determination of Emission Factors (EF)
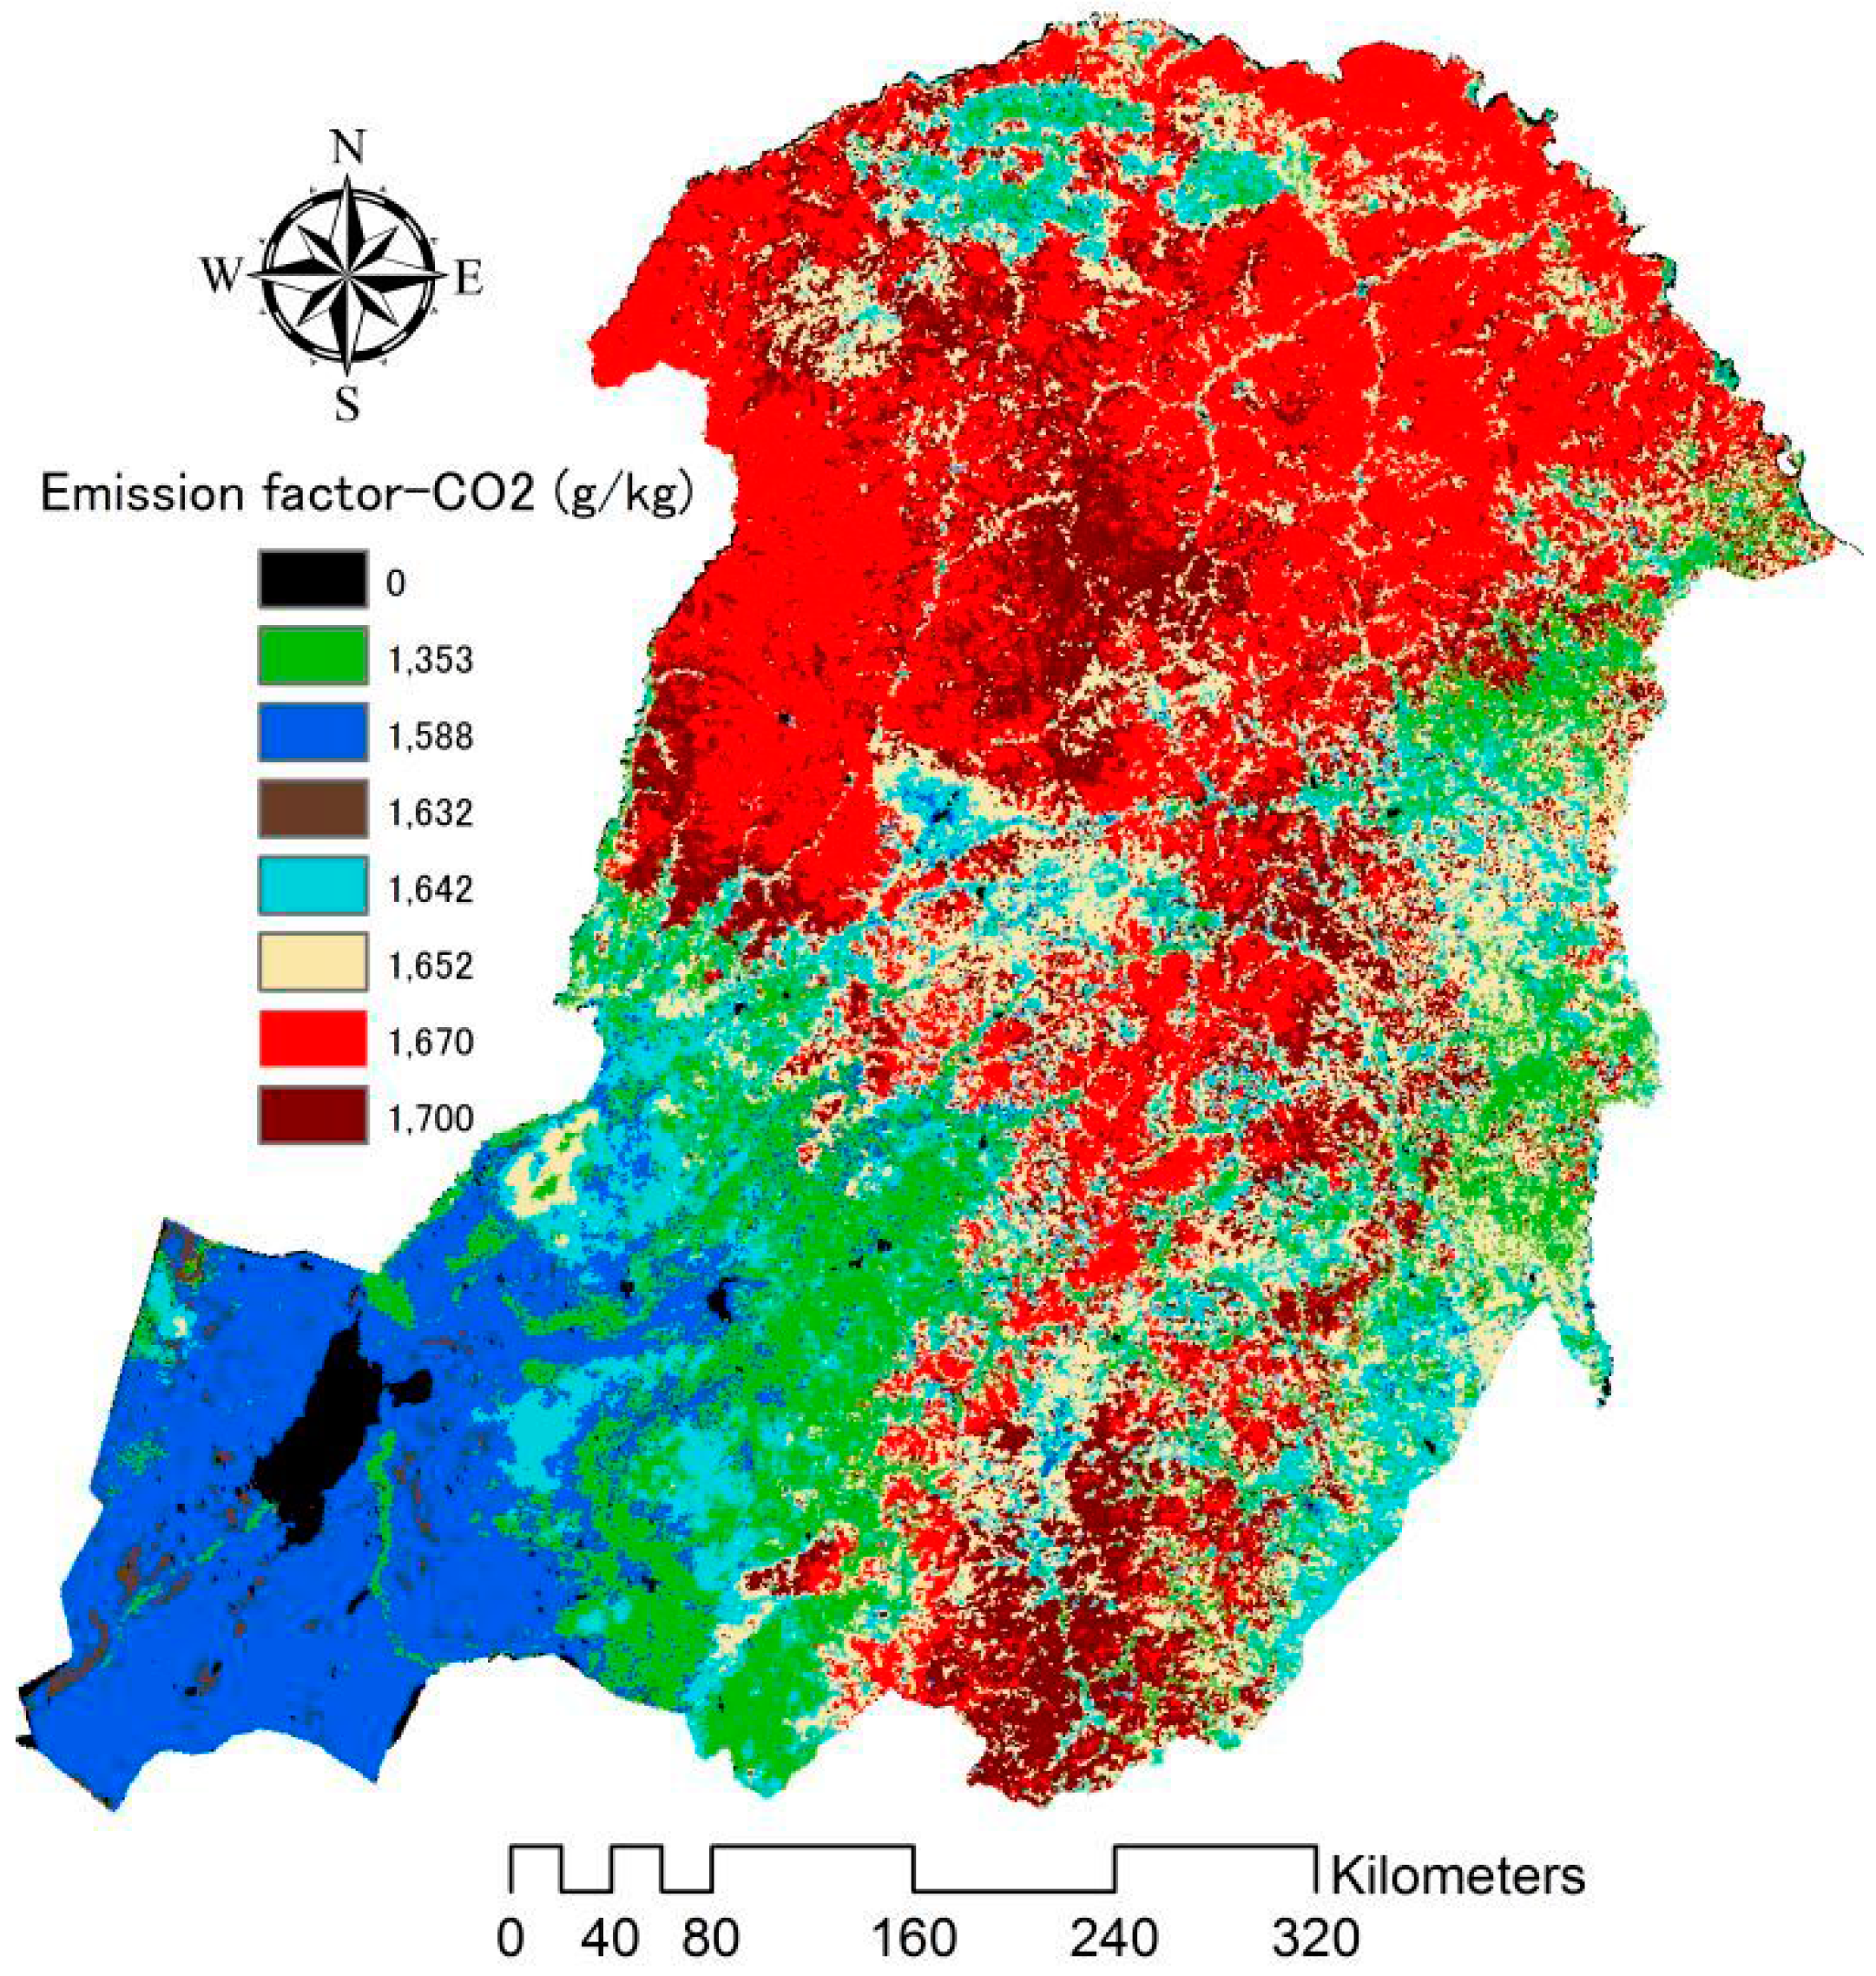
Emission factors, usually defined as the amount of certain trace gas and aerosol species released per amount of fuel consumed, which are expressed in grams of a gas compound per kilogram of dry matter [26,43]. Emission factors are based on the correlation between the concentration of a certain gas species and the concentration of the reference species emitted and are estimated from experiments for specific conditions [26]. Emission factors for various ecosystems and environmental conditions have been derived either in natural conditions or in controlled laboratory experiments [7,41,42] where the rest of the variables were known (i.e., the amount of the compound released, the amount of fuel burned and the concentration of the element in the fuel) [26]. In the present study, emission factors were also assigned for each land cover classification in the AVHRR GLC-2000 data. These emission factors for each emitted species, which are given in Table 2, were based on previously published studies [7,42]. The average of relevant emission factors for each gaseous or particulate species was applied when more than one emission factor was available in the literature. Figure 4 shows the determination of CO2 emission factors in China. The emission factors of other emitted species (CH4, CO, PM10, PM2.5, SO2, BC and NOx) were also determined in the same way.
3. Results and Discussion
3.1. Wildfire Distributionin the Great Xing’an Mountains
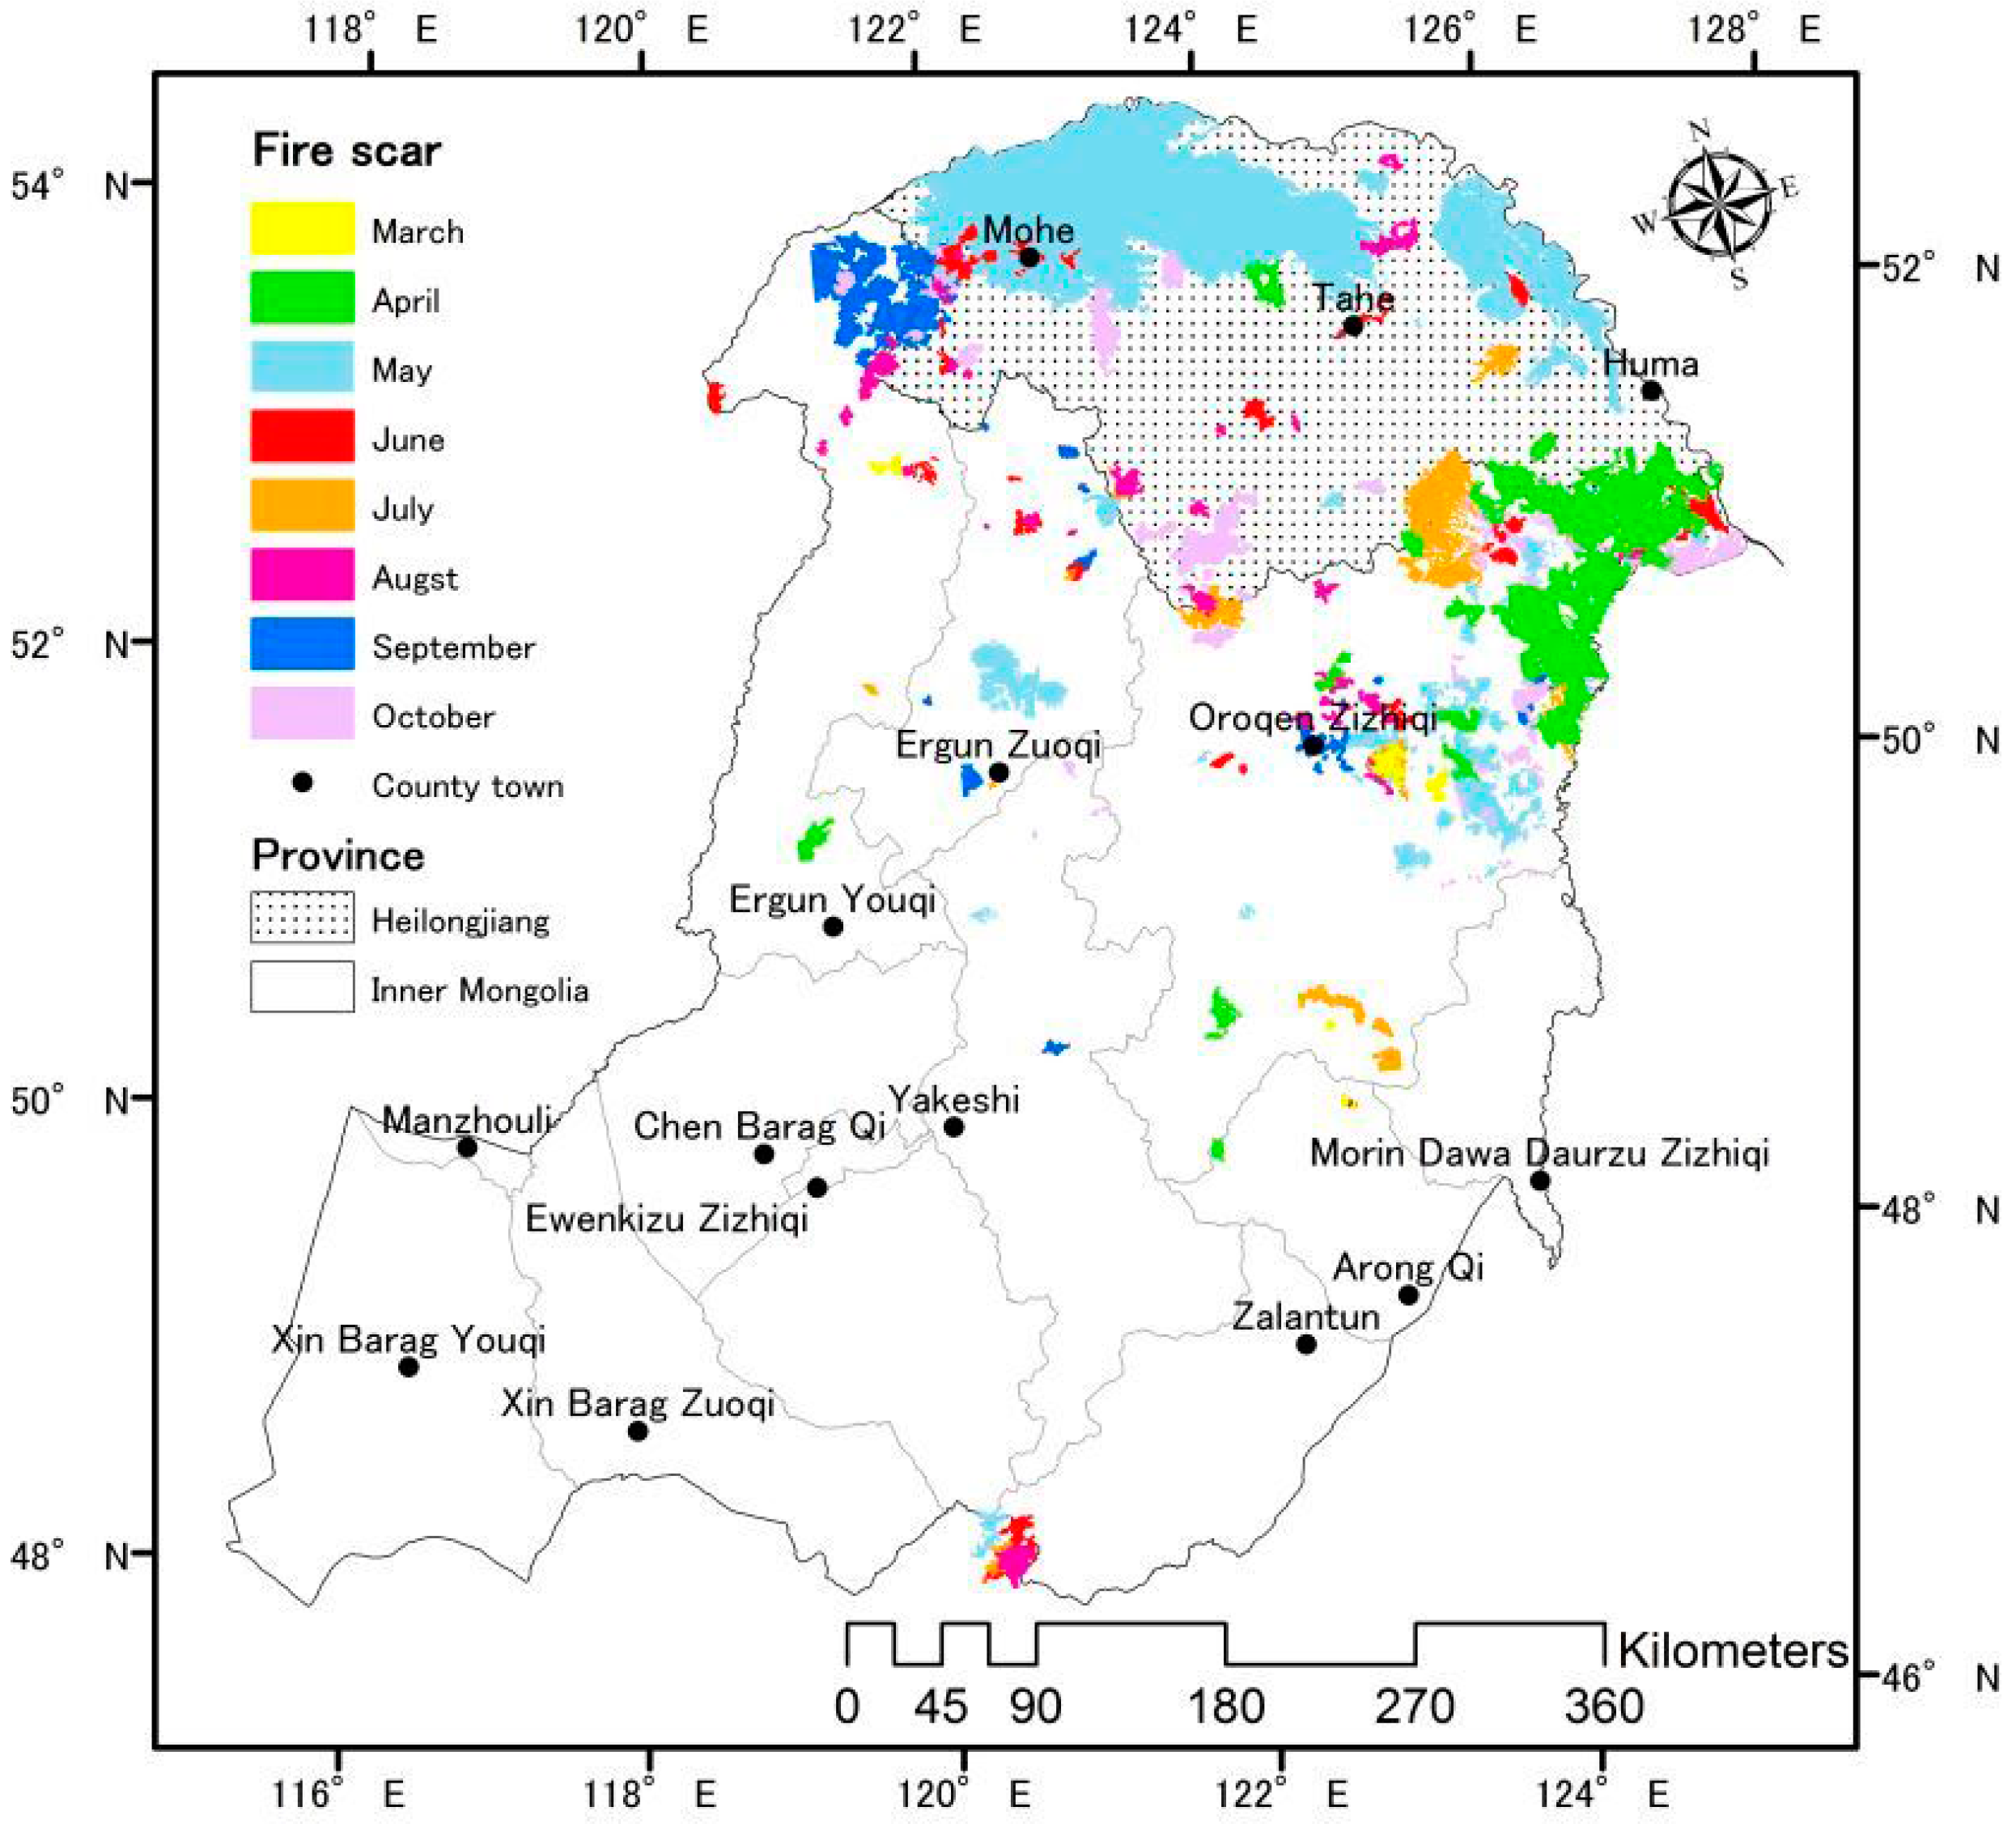
Figure 5 shows the historical burned area distribution by month from the years 1986 to 2010. In total, 9998 fire scars were observed in the GXM between the years 1986 and 2010. Particularly during the spring fire season, there are always serious large forest fire events. For example, on 6th May 1987, a catastrophic fire occurred on the northern slopes of the GXM, which burned a total area of 1.3 × 10⁶ ha, with disastrous effects on the forest composition and structure, ecosystem processes and the landscape pattern [44]. The wildfire that broke out in Jinhe and Genhe counties on 5 May 2003 burned 7.9 × 10⁴ hectares, including 6.3 × 10⁴ hectares of forest areas, with an economic loss of more than 198 million RMB [44].
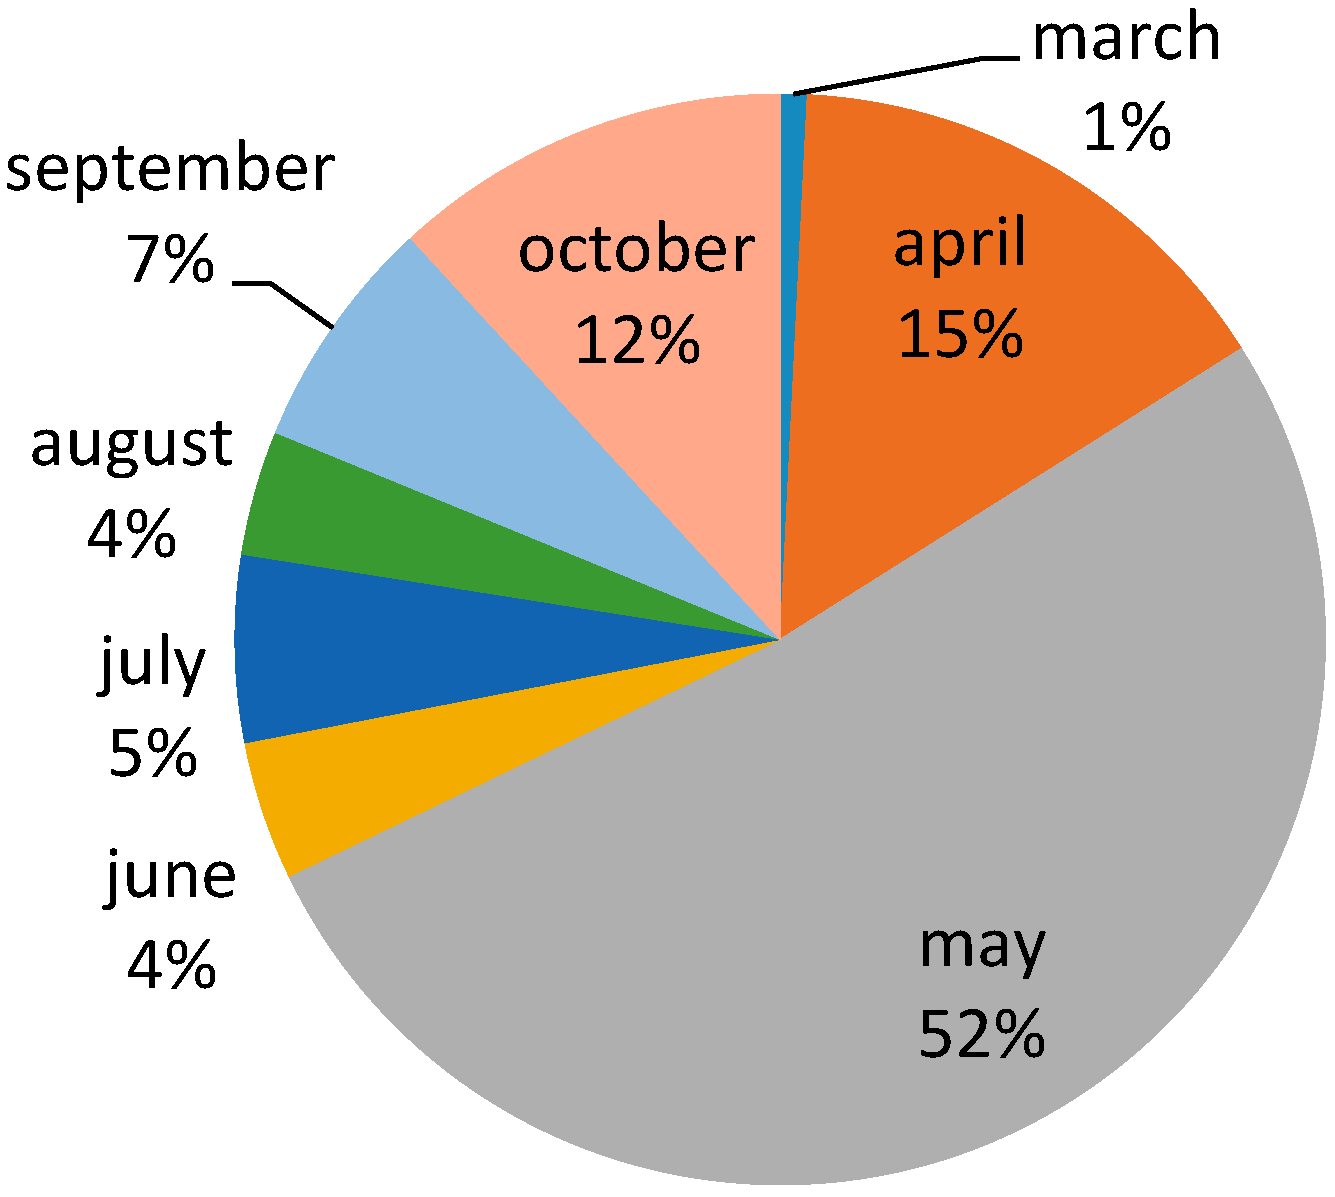
Spring and autumn are two primary fire seasons in the GXM. Almost 80% burned area are burned in three months (May: 52%; April: 15%; October: 12%). Normally, there are no large fire events due to high precipitation and high fuel moisture in summer (July and August) and to low temperatures accompanied by the accumulation of snow and frozen land in winter (late November to February) (Figure 6). Thus, fire events occur in spring from mid-March to mid-June and from mid-September to mid-November in fall. Large fires occurred more often in the northern region of the GXM between 50° N and 54° N latitude than in the southern region (part of Inner Mongolia Province) (Figure 5) due to much drier weather and higher fire danger in the northern region (part of Heilongjiang Province). The vegetation in this region is a cold-temperature mixed coniferous forest, in which fire is likely to occur. Burn scars and the associated vegetation succession lead to a mosaic of landscape patches. These spatial patterns of regenerating vegetation in various succession stages are important considerations for carbon budget studies in boreal forests [45].
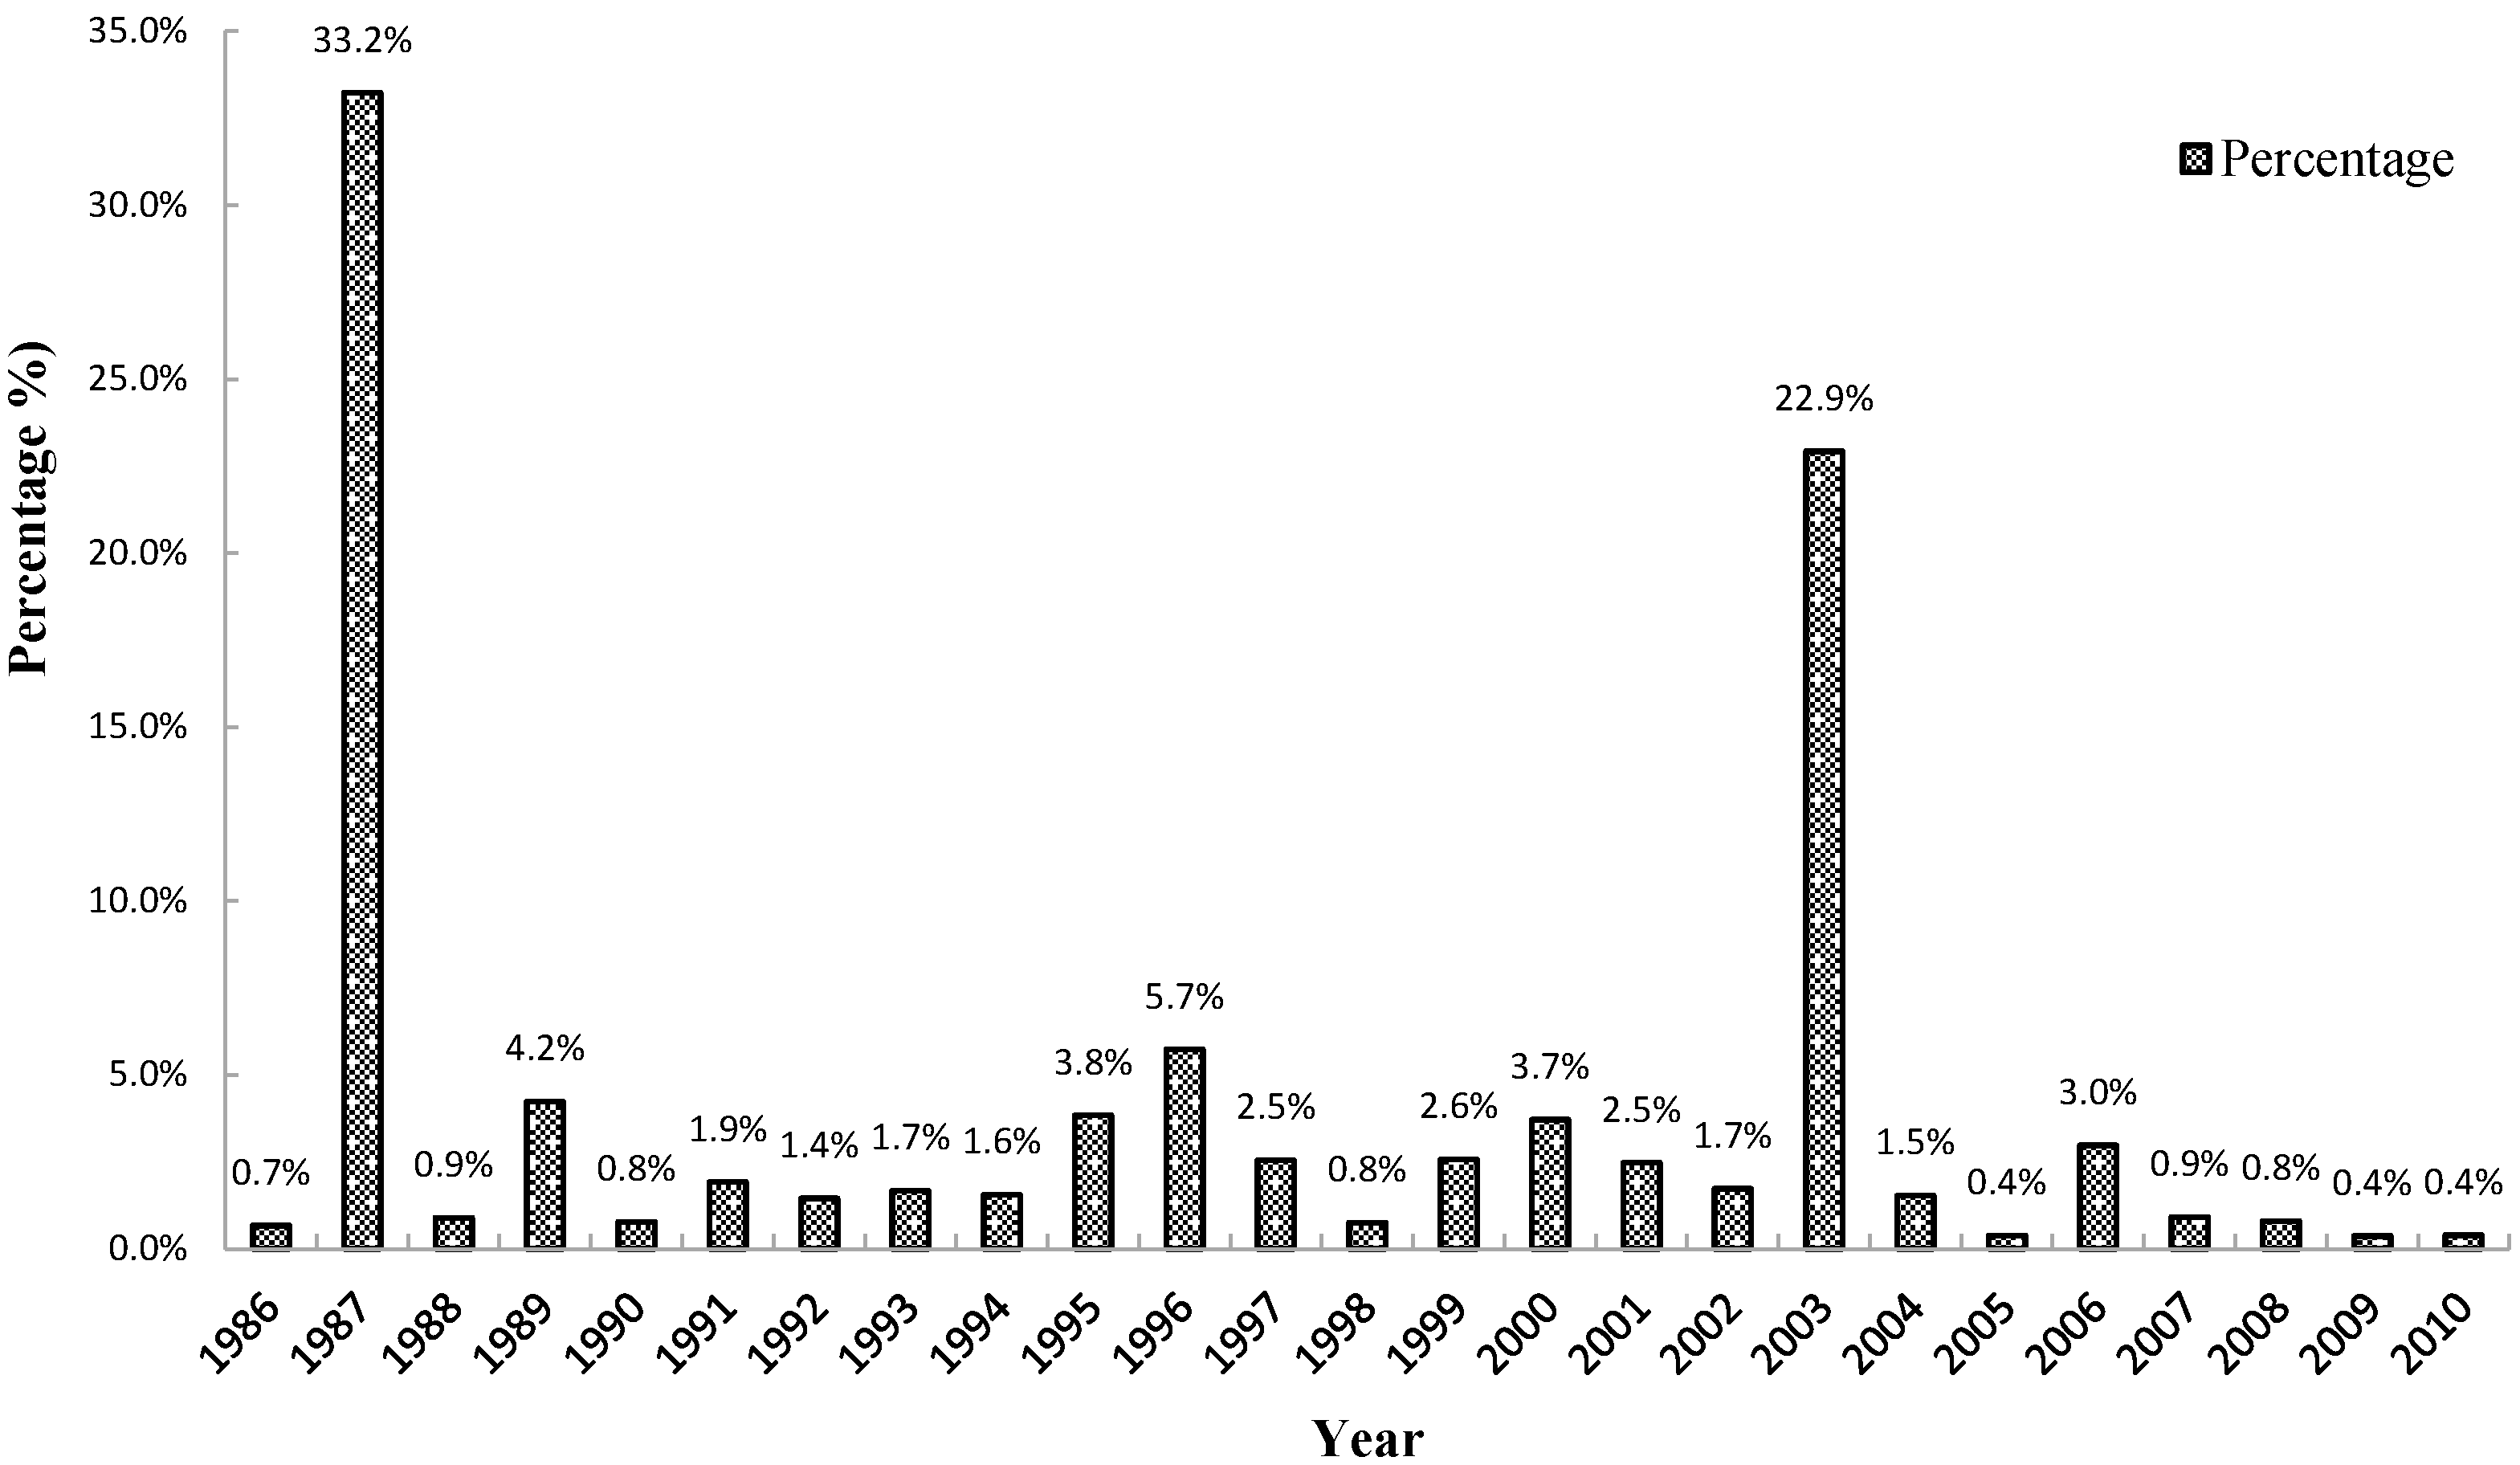
Figure 7 shows the burned area shift from 1986 to 2010. The years 1987 and 2003 contributed 33.2% and 22.9%, respectively, in burned area during the 25 years. In total, 1.53 million hectares were charred by fires in 1987, which was the most destructive fire year in China’s history, with a specific larger fire in May that burned 1.33 million hectares alone. Extreme meteorological conditions, in combination with the lack of accessibility, resulted in large, high-intensity crown fires throughout China’s boreal forests in 1987 [44]. Snowfall over the northern China was typically light during the winter of 1986–1987, and the snow cover had disappeared by early April southeast of Lake Baikal and along the Amur River. Low temperatures and relative humidity prevailed throughout April, with only a light scattering of precipitation. The cumulative result was an extremely dry forest fuel situation in this region by the beginning of May 1987, which combined with increasing temperatures and strong winds to produce uncontrollable forest fires. Another severe fire year in the history is 2003, during which approximately 1.1 million hectares was burned. Dozens of fires burned in the GXM region from Inner Mongolia to Heilongjiang Province in May 2003. As the neighbor of the GXM, West Siberia’s largest forest fires on record also occurred during the same period in 2003, claiming approximately 20 million hectares of land and emitting heat-trapping emissions equal to the total cuts in emissions that the European Union pledged under the Kyoto Protocol [46]. Higher temperatures and thawing permafrost are most likely contributing to the rising frequency and severity of forest fires in West Siberia [47].
3.2. Trends in Biomass Burning Emissions
Yearly and monthly emissions of CH4, CO, PM10, PM2.5, SO2, BC and NOx from biomass burning in the GXM have been estimated from 1986 to 2010. The spatial and temporal distribution of fire emissions is similar to that of the burned area because the burned pixels were defined as 1, whereas unburned pixels were defined as 0. Table 3 summarizes the average annual emissions of trace gases and particulate matter for different land cover types. Evergreen and deciduous needleleaf forest and deciduous broadleaf forest are the main sources of emissions, accounting for 84%, 81%, 84%, 87%, 89%, 86%, 85% and 74% of the total annual CO2, CH4, CO, PM10, PM2.5, SO2, BC and NOx emissions, respectively. Fire emissions from shrub, grassland and cropland only account for a small fraction of the total emissions level (approximately 4%–11%). The two extreme fire years of 1987 and 2003 contributed approximately 60% of total biomass burning emission, according to this study from 1986 to 2010. Cahoon et al. estimated that 14.5 million ha burned and that approximately 36 Tg CO were emitted during the catastrophic fire burned on 6 May 1987 in China using AVHRR burn scars [44]. This result suggests that the inclusion of fire emissions that are specific to a particular period and region is essential for realistically simulating air quality [7].
Several published papers have also estimated the biomass burning emissions in different regions for recent years [7,48,49,50]. The emissions from wildfire in this study are compared with four other previous study results (Table 4). Our study period includes two extreme fire years, 1987 and 2003, which play an important role in the final average annual result from 1986–2010. Thus, to make a reasonable comparison with other studies, we calculated another average annual emission result for a normal period (2005–2010) without any extreme fire events. The areas of these study domains differ from our study area. Thus, we list all estimated regions and their area ratios in Table 4 for comparison (United States: 962.9 × 10⁴ km2; Canada: 998.5 × 10⁴ km2; China: 962.9 × 10⁴ km2; Our study area: 32.7 × 10⁴ km2). Wiedinmyer et al. estimated the entire fire-induced emissions across North America and Central America for the calendar year 2004 [7]. These authors estimated 356 Tg and 227 Tg yearly total CO2 emissions for the United States and Canada, respectively. The yearly total CO2 emissions for the United States are only 3.6 times and 14.7 times our resulting annual CO2 emissions of the GXM for 1986–2010 and for 2005–2010, respectively. However, the area of the United States is 29.4 times that of our study domain. Table 4 indicates that the yearly total CO2 emissions in the United States are much higher than in China, by approximately 3–9-fold, according to different estimates [25,49,50]. Other emission species in the United States also show a similar relation with China. Estimating trace gas emissions from biomass burning is a complex issue due to the many variables that are involved in the process. The level of uncertainty includes several factors directly related to the working scale and to each of the variables involved in the models [26]. Notably, there was a significant difference in the emissions results among different studies, even within the same study domain [25,49,50]. Compared with the CO2 emission for all of China’s, the average annual CO2 emission (2005–2010) accounts for 24%, according to Song et al. [50], 30.3%, according to Yan et al. [49] and 59.3%, according to Lu et al. [25].
4. Estimates Challenges
Modeling methodologies are the most realistic way to accomplish emissions estimations, and remote-sensing data acquisition seems to be a feasible way to estimate those parameters required for the models. These approaches depend on factors such as the scale, accuracy requirements and information availability, among others. The variables involved in most of the models are the burned area, fuel availability, burning efficiency, and emission factors. In this study, we assumed that the emission model coefficients depend only on the type of dominating vegetation, which, in turn, is the function of geographic coordinates. In reality, the intensity of emissions during biomass burning is determined by a wider set off actors and can vary in the course of the fire risk season [51]. For example, the completeness of combustion is determined by the moisture content in combustible vegetation, which, in turn, depends on meteorological conditions (air temperature and precipitation) and seasonal factors (the time of snow cover thawing and moistening regime) in a given region [51,52]. Comparison of burned area or hotspot products often reveals factor of ten or larger disagreements [53]. Burning efficiency (BE) is also affected by instantaneous meteorological conditions on the burning days, such as wind and precipitation. Concerning the emission factors, data are available only for specific sites across the globe or for laboratory experiments. Although remote sensing may provide helpful insight into their temporal and spatial evolution in biomass burning, the accuracy of burned area extract from satellite image are need to further improve by using spectral data and vegetation properties. The use of common emission factors and biomass available for highly diverse environmental conditions introduces a high level of uncertainty into the calculations. In this sense, uncertainty is highly associated with the land cover inside class variability; areas with high variability show higher levels of uncertainty due to the difficulty in applying precise coefficients [26]. Now there are two satellites monitor Earth’s greenhouse gas emissions from space, the one is NASA’s Orbiting Carbon Observatory-2 (OCO-2) [54], which launched in 2014 and measures CO2, and the other one is Japan’s Greenhouse Gases Observing Satellite (GOSAT) [55], which launched in 2009 and tracks CO2 and methane. However, it is very hard for those measurements to calculate the total trace gas emissions from specific fire events. This is because a polar orbiting satellite has a strict running period and orbit so only a fire in the area right under the satellite can be monitored, and it cannot make continuous observation on a single fire event. Satellites can monitor only the instantaneous values and cannot record the complete and entire values in a single fire event.
5. Conclusions and Recommendations
This study improves strategies that optimize input information by combining explicit spatio-temporal remote-sensing data with models to obtain emissions information. Biomass burning emissions in the boreal region yield an important contribution to the chemical budget of the troposphere. To assess the contribution of biomass burning to the emissions of atmospheric trace species in the GXM, which is the most severe fire-prone area in China, we estimated various fire activities by combining explicit spatio-temporal remote sensing data with models. We observed 9998 fire scars with a total area of 46,096 km2 in the GXM between the years 1986 and 2010. The years 1987 and 2003 contributed 33.2% and 22.9%, respectively, in burned area during the 25 years. Fire activity is the strongest in May. Most large fires occurred in the northern region of the GXM between 50 °N and 54° N latitude due to much drier weather and higher fire danger in the northern region than in the southern region. Evergreen and deciduous needle leaf forest and deciduous broadleaf forest are the main sources of emissions, accounting for 84%, 81%, 84%, 87%, 89%, 86%, 85% and 74% of the total annual CO2, CH4, CO, PM10, PM2.5, SO2, BC and NOx emissions, respectively. Fire emissions from shrub land, grassland and cropland only account for a small fraction of the total emissions level (approximately 4%–11%). Comparisons of our results with other published estimates of biomass burning emissions show reasonable agreement; however, substantial uncertainties remain concerning the modeling parameters. The variability in emission factors greatly contributed to the uncertainty. There is an urgent requirement to obtain more accurate biomass burning estimates because of its considerable contribution to the regional and global carbon balance and to the atmosphere.
Acknowledgments
This study would not have been possible without the financial support from the Postdoctoral Science Foundation of China (Y5T0020022) and National Nature Science Foundation of China (41561099). We would like to thank University of Maryland for providing AVHRR Global Land Cover Map (AVHRR GLC-2000) data used in this research. The authors are grateful to the anonymous reviewers for their insightful and helpful comments to improve the manuscript.
Author Contributions
Kunpeng Yi and Yulong Bao conceived and designed the research; Kunpeng Yi performed the research; Kunpeng Yi and Yulong Bao analyzed the data; Yulong Bao contributed analysis tools; Kunpeng Yi wrote the paper. All authors have read and approved the final manuscript after minor modifications.
Conflicts of Interest
The authors declare no conflict of interest.
References
- Keywood, M.; Kanakidou, M.; Stohl, A.; Dentener, F.; Grassi, G.; Meyer, C.P.; Torseth, K.; Edwards, D.; Thompson, A.M.; Lohmann, U.; et al. Fire in the air: Biomass burning impacts in a changing climate. Crit. Rev. Environ. Sci. Technol. 2013, 43, 40–83. [Google Scholar] [CrossRef]
- Marshall, S.; Taylor, J.A.; Oglesby, R.J.; Larson, J.W.; Erickson, D.J. Climatic effects of biomass burning. Environ. Softw. 1996, 11, 53–58. [Google Scholar] [CrossRef]
- Jacobson, L.V.; Hacon, S.; Ignotti, E.; Castio, H.; Artaxo, P.; de Leon, A.P. Effects of air pollution from biomass burning in amazon: A panel study of schoolchildren. Epidemiology 2009, 20, S90–S90. [Google Scholar] [CrossRef]
- Akagi, S.K.; Yokelson, R.J.; Wiedinmyer, C.; Alvarado, M.J.; Reid, J.S.; Karl, T.; Crounse, J.D.; Wennberg, P.O. Emission factors for open and domestic biomass burning for use in atmospheric models. Atmos. Chem. Phys. 2011, 11, 4039–4072. [Google Scholar] [CrossRef]
- Knox, K.J.E.; Clarke, P.J. Fire severity, feedback effects and resilience to alternative community states in forest assemblages. For. Ecol. Manag. 2012, 265, 47–54. [Google Scholar] [CrossRef]
- Ito, A.; Penner, J.E. Global estimates of biomass burning emissions based on satellite imagery for the year 2000. J. Geophys. Res. Atmos. 2004, 109, D14S05. [Google Scholar] [CrossRef]
- Wiedinmyer, C.; Quayle, B.; Geron, C.; Belote, A.; McKenzie, D.; Zhang, X.; O’Neill, S.; Wynne, K.K. Estimating emissions from fires in north america for air quality modeling. Atmos. Environ. 2006, 40, 3419–3432. [Google Scholar] [CrossRef]
- Ichoku, C.; Kahn, R.; Chin, M. Satellite contributions to the quantitative characterization of biomass burning for climate modeling. Atmos. Res. 2012, 111, 1–28. [Google Scholar] [CrossRef]
- Zhang, X.; Hecobian, A.; Zheng, M.; Frank, N.H.; Weber, R.J. Biomass burning impact on PM2.5 over the southeastern US during 2007: Integrating chemically speciated frm filter measurements, modis fire counts and pmf analysis. Atmos. Chem. Phys. 2010, 10, 6839–6853. [Google Scholar] [CrossRef]
- Tian, D.; Hu, Y.T.; Wang, Y.H.; Boylan, J.W.; Zheng, M.; Russell, A.G. Assessment of biomass burning emissions and their impacts on urban and regional PM2.5: A georgia case study. Environ. Sci. Technol. 2009, 43, 299–305. [Google Scholar] [CrossRef] [PubMed]
- Barrera, V.A.; Miranda, J.; Espinosa, A.A.; Meinguer, J.; Martinez, J.N.; Ceron, E.; Morales, J.R.; Miranda, P.A.; Dias, J.F. Contribution of soil, sulfate, and biomass burning sources to the elemental composition of PM10 from Mexico city. Int. J. Environ. Res. 2012, 6, 597–612. [Google Scholar]
- Liu, Y.; Goodrick, S.L.; Stanturf, J.A. Future US wildfire potential trends projected using a dynamically downscaled climate change scenario. For. Ecol. Manag. 2013, 294, 120–135. [Google Scholar] [CrossRef]
- Crimmins, M.A. Wildfire and Climate Interactions Across the Southwest United States. Ph.D. Thesis, The University of Arizona, Tucson, AZ, USA, 2004. [Google Scholar]
- Aldersley, A.; Murray, S.J.; Cornell, S.E. Global and regional analysis of climate and human drivers of wildfire. Sci. Total Environ. 2011, 409, 3472–3481. [Google Scholar] [CrossRef] [PubMed]
- Allen, A.G.; Miguel, A.H. Biomass burning in the Amazon: Characterization of the ionic component of aerosols generated tom flaming and smoldering rain-forest and savanna. Environ. Sci. Technol. 1995, 29, 486–493. [Google Scholar] [CrossRef] [PubMed]
- Delmas, R.; Lacaux, J.P.; Menaut, J.C.; Abbadie, L.; Leroux, X.; Helas, G.; Lobert, J. Nitrogen compound emission from biomass burning in tropical african savanna fos/decafe 1991 experiment (lamto, ivory coast). J. Atmos. Chem. 1995, 22, 175–193. [Google Scholar] [CrossRef]
- Lacaux, J.P.; Brustet, J.M.; Delmas, R.; Menaut, J.C.; Abbadie, L.; Bonsang, B.; Cachier, H.; Baudet, J.; Andreae, M.O.; Helas, G. Biomass burning in the tropical savannas of ivory coast: An overview of the field experiment fire of savannas (fos/decafe 91). J. Atmos. Chem. 1995, 22, 195–216. [Google Scholar] [CrossRef]
- Simoneit, B.R.T. Biomass burning—A review of organic tracers for smoke from incomplete combustion. Appl. Geochem. 2002, 17, 129–162. [Google Scholar] [CrossRef]
- Randerson, J.T.; Chen, Y.; van der Werf, G.R.; Rogers, B.M.; Morton, D.C. Global burned area and biomass burning emissions from small fires. J. Geophys. Res. Biogeosci. 2012, 117, G04012. [Google Scholar] [CrossRef]
- Zhang, X.; Kondragunta, S. Temporal and spatial variability in biomass burned areas across the USA derived from the goes fire product. Remote Sens. Environ. 2008, 112, 2886–2897. [Google Scholar] [CrossRef]
- Kasischke, E.S.; Hewson, J.H.; Stocks, B.; van der Werf, G.; Randerson, J. The use of atsr active fire counts for estimating relative patterns of biomass burning—A study from the boreal forest region. Geophys. Res. Lett. 2003, 18, 1969. [Google Scholar] [CrossRef]
- Giglio, L.; Csiszar, I.; Justice, C.O. Global distribution and seasonality of active fires as observed with the terra and aqua moderate resolution imaging spectroradiometer (modis) sensors. J. Geophys. Res. 2006, 111, G02016. [Google Scholar] [CrossRef]
- Qin, Y.; Xie, S.D. Historical estimation of carbonaceous aerosol emissions from biomass open burning in china for the period 1990–2005. Environ. Pollut. 2011, 159, 3316–3323. [Google Scholar] [CrossRef] [PubMed]
- Huang, X.; Li, M.M.; Friedli, H.R.; Song, Y.; Chang, D.; Zhu, L. Mercury emissions from biomass burning in China. Environ. Sci. Technol. 2011, 45, 9442–9448. [Google Scholar] [CrossRef] [PubMed]
- Lu, A.F.; Tian, H.Q.; Liu, M.L.; Liu, J.Y.; Melillo, J.M. Spatial and temporal patterns of carbon emissions from forest fires in China from 1950 to 2000. J. Geophys. Res. Atmos. 2006, 5, D05313. [Google Scholar] [CrossRef]
- Palacios-Orueta, A.; Chuvieco, E.; Parra, A.; Carmona-Moreno, C. Biomass burning emissions: A review of models using remote-sensing data. Environ. Monit. Assess. 2005, 104, 189–209. [Google Scholar] [CrossRef] [PubMed]
- Oberheitmann, A. CO2-emission reduction in China’s residential building sector and contribution to the national climate change mitigation targets in 2020. Mitig. Adapteg. Strat. Glob. Change 2012, 17, 769–791. [Google Scholar] [CrossRef]
- Oberheitmann, A. A new post-kyoto climate regime based on per-capita cumulative CO2-emission rights—Rationale, architecture and quantitative assessment of the implication for the CO2-emissions from china, india and the annex-i countries by 2050. Mitig. Adapteg. Strat. Glob. Chang. 2010, 15, 137–168. [Google Scholar] [CrossRef]
- Hasanbeigi, A.; Morrow, W.; Masanet, E.; Sathaye, J.; Xu, T.F. Energy efficiency improvement and CO2 emission reduction opportunities in the cement industry in China. Energ. Policy 2013, 57, 287–297. [Google Scholar] [CrossRef]
- Zhang, Y.; Hu, H.Q.; Wang, Q. Carbon emissions from forest fires in great Xing’an mountains from 1980 to 2005. Procedia Environ. Sci. 2011, 10, 2505–2510. [Google Scholar] [CrossRef]
- Li, X.; He, H.S.; Wu, Z.; Liang, Y.; Schneiderman, J.E. Comparing effects of climate warming, fire, and timber harvesting on a boreal forest landscape in northeastern China. PLoS ONE 2013, 8, e59747. [Google Scholar] [CrossRef] [PubMed]
- Seiler, W.; Crutzen, P.J. Estimates of gross and net fluxes of carbon between the biosphere and the atmosphere from biomass burning. Clim. Chang. 1980, 2, 207–247. [Google Scholar] [CrossRef]
- Hoffmann, W.A.; Geiger, E.L.; Gotsch, S.G.; Rossatto, D.R.; Silva, L.C.R.; Lau, O.L.; Haridasan, M.; Franco, A.C. Ecological thresholds at the savanna-forest boundary: How plant traits, resources and fire govern the distribution of tropical biomes. Ecol. Lett. 2012, 15, 759–768. [Google Scholar] [CrossRef] [PubMed]
- Moreno, J.M.; Viedma, O.; Zavala, G.; Luna, B. Landscape variables influencing forest fires in central Spain. Int. J. Wildland Fire 2011, 20, 678–689. [Google Scholar] [CrossRef]
- Zinck, R.D.; Johst, K.; Grimm, V. Wildfire, landscape diversity and the drossel-schwabl model. Ecol. Model. 2010, 221, 98–105. [Google Scholar] [CrossRef]
- Liu, Z.; He, H.S.; Chang, Y.; Hu, Y. Analyzing the effectiveness of alternative fuel reductions of a forested landscape in northeastern China. For. Ecol. Manag. 2010, 259, 1255–1261. [Google Scholar] [CrossRef]
- Prasad, V.K.; Kant, Y.; Gupta, P.K.; Elvidge, C.; Badarinath, K.V.S. Biomass burning and related trace gas emissions from tropical dry deciduous forests of India: A study using dmsp-ols data and ground-based measurements. Int. J. Remote Sens. 2002, 23, 2837–2851. [Google Scholar] [CrossRef]
- Ward, D.; Susott, R.; Kauffman, J.; Babbitt, R.; Cummings, D.; Dias, B.; Holben, B.; Kaufman, Y.; Rasmussen, R.; Setzer, A. Smoke and fire characteristics for cerrado and deforestation burns in Brazil: Base-b experiment. J. Geophys. Res. Atmos. 1992, 97, 14601–14619. [Google Scholar] [CrossRef]
- Kasischke, E.S.; Stocks, B.J.; O’Neill, K.; French, N.H.; Bourgeau-Chavez, L.L. Direct effects of fire on the boreal forest carbon budget. In Biomass Burning and Its Inter-Relationships with the Climate System; Springer: Dordrecht, The Netherlands, 2000; pp. 51–68. [Google Scholar]
- Michel, C.; Liousse, C.; Grégoire, J.M.; Tansey, K.; Carmichael, G.; Woo, J.H. Biomass burning emission inventory from burnt area data given by the spot-vegetation system in the frame of trace-p and ace-asia campaigns. J. Geophys. Res. Atmos. 2005, 110, D09304. [Google Scholar] [CrossRef]
- Song, Y.; Liu, B.; Miao, W.J.; Chang, D.; Zhang, Y.H. Spatiotemporal variation in nonagricultural open fire emissions in China from 2000 to 2007. Glob. Biogeochem. Cycles 2009, 23, GB2008. [Google Scholar] [CrossRef]
- Wang, X.P.; Fang, J.Y.; Zhu, B. Forest biomass and root-shoot allocation in northeast China. For. Ecol. Manag. 2008, 255, 4007–4020. [Google Scholar] [CrossRef]
- Vasileva, A.; Moiseenko, K. Methane emissions from 2000 to 2011 wildfires in northeast Eurasia estimated with modis burned area data. Atmos. Environ. 2013, 71, 115–121. [Google Scholar] [CrossRef]
- Cahoon, D.R.; Stocks, B.J.; Levine, J.S.; Cofer, W.R.; Pierson, J.M. Satellite analysis of the severe 1987 forest fires in northern China and southeastern Siberia. J. Geophys. Res. Atmos. 1994, 99, 18627–18638. [Google Scholar] [CrossRef]
- Lin, Y.; Wang, L. Typical Cases of Forest Fire in China from 1953 to 2005; Chinese Forestry Press: Beijing, China, 2007. [Google Scholar]
- Balzter, H.; Gonzalez, M.C.; Gerard, F.; Riaño, D. Post-fire vegetation phenology in Siberian burn scars. Geosci. Remote Sens. Symp. 2007, 4652–4655. [Google Scholar] [CrossRef]
- Van Leeuwen, T.T.; van der Werf, G.R. Spatial and temporal variability in the ratio of trace gases emitted from biomass burning. Atmos. Chem. Phys. 2011, 11, 3611–3629. [Google Scholar] [CrossRef] [Green Version]
- Sheng, Y.W.; Smith, L.C.; MacDonald, G.M.; Kremenetski, K.V.; Frey, K.E.; Velichko, A.A.; Lee, M.; Beilman, D.W.; Dubinin, P. A high-resolution GIS-based inventory of the west siberian peat carbon pool. Glob. Biogeochem. Cycles 2004, 18, GB3004. [Google Scholar] [CrossRef]
- Roy, D.P.; Jin, Y.; Lewis, P.E.; Justice, C.O. Prototyping a global algorithm for systematic fire-affected area mapping using modis time series data. Remote Sens. Environ. 2005, 97, 137–162. [Google Scholar] [CrossRef]
- Yan, X.Y.; Ohara, T.; Akimoto, H. Bottom-up estimate of biomass burning in mainland China. Atmos. Environ. 2006, 40, 5262–5273. [Google Scholar] [CrossRef]
- Frey, K.E.; Smith, L.C. Amplified carbon release from vast west Siberian peatlands by 2100. Geophys. Res. Lett. 2005, 32, L09401. [Google Scholar] [CrossRef]
- Vivchar, A.V.; Moiseenko, K.B.; Pankratova, N.V. Estimates of carbon monoxide emissions from wildfires in northern Eurasia for airquality assessment and climate modeling. Izv. Atmo. Ocean. Phys. 2010, 46, 281–293. [Google Scholar] [CrossRef]
- Urbanski, S.P.; Hao, W.M.; Nordgren, B. The wildland fire emission inventory: Western United States emission estimates and an evaluation of uncertainty. Atmos. Chem. Phys. 2011, 11, 12973–13000. [Google Scholar] [CrossRef] [Green Version]
- Taylor, T.E.; O'Dell, C.W.; Frankenberg, C.; Partain, P.T.; Cronk, H.Q.; Savtchenko, A.; Nelson, R.R.; Rosenthal, E.J.; Chang, A.Y.; Fisher, B.; et al. Orbiting carbon observatory-2 (OCO-2) cloud screening algorithms: Validation against collocated modis and caliop data. Atmos. Meas. Tech. Discuss. 2016, 9, 973–989. [Google Scholar] [CrossRef]
- Takagi, H.; Saeki, T.; Oda, T.; Saito, M.; Valsala, V.; Belikov, D.; Saito, R.; Yoshida, Y.; Morino, I.; Uchino, O.; et al. On the benefit of gosat observations to the estimation of regional CO2 fluxes. Sola 2011, 7, 161–164. [Google Scholar] [CrossRef]
Figure 1.
Land cover distribution in the study area. This distribution was derived from the AVHRR Global Land Cover Map.
Figure 1.
Land cover distribution in the study area. This distribution was derived from the AVHRR Global Land Cover Map.

Figure 2.
Flow chart used to derive burned area.

Figure 3.
Biomass density (left) and burned efficiency (right) distribution in the study.

Figure 4.
The determination of CO2 emission factors in China.

Figure 5.
Burned area distribution from 1986 to 2010. Only the fire scars larger than 100 ha are shown in this figure. Note that the size of the burn scars increases slightly for the display purpose.
Figure 5.
Burned area distribution from 1986 to 2010. Only the fire scars larger than 100 ha are shown in this figure. Note that the size of the burn scars increases slightly for the display purpose.

Figure 6.
Monthly pattern of wildfire in the Great Xing’an Mountains.

Figure 7.
Yearly burned area shift in the Great Xing’an Mountains.


Table 1.
Determination of emission model parameters for each bioclimatic zone against the AVHRR Global Land Cover Map.
| Code | Description | BD (Mg/ha) | (BE%) |
|---|---|---|---|
| 1, 3 | Evergreen and deciduous needleleaf forest | 140 | 40 |
| 4 | Deciduous broadleaf forest | 95 | 40 |
| 5 | Mixed forest | 12 | 40 |
| 6 | Woodland | 95 | 40 |
| 7 | Wooded grassland | 11 | 90 |
| 8, 9 | Scrubland | 43 | 50 |
| 10 | Grassland | 11 | 90 |
| 11 | Cropland | 5 | 90 |
| 0, 12–14 | Water bodies, barren, built-up, undefined | 0 | 0 |
Table 2.
Emission factors assigned to fires in each of the vegetation types of the AVHRR GLC-2000 data.
| Description | CO2 * | CH4 | CO | PM10 | PM2.5 | SO2 | BC | NOx |
|---|---|---|---|---|---|---|---|---|
| Evergreen and deciduous needleleaf forest | 1700 | 4.8 | 89 | 13.1 | 12.7 | 0.6 | 0.77 | 3.1 |
| Deciduous broadleaf forest | 1750 | 4.5 | 94 | 15 | 12.3 | 0.5 | 0.82 | 2.5 |
| Mixed forest | 1670 | 4.5 | 84 | 12.5 | 7.9 | 0.6 | 0.8 | 3 |
| Woodland | 1652 | 4.5 | 90 | 8.5 | 7.3 | 0.5 | 0.5 | 6.5 |
| Wooded grassland | 1642 | 3.1 | 80 | 8.5 | 7 | 0.5 | 0.52 | 3.2 |
| Scrubland | 1632 | 3.1 | 85 | 8.5 | 7 | 0.5 | 0.52 | 6.5 |
| Grassland | 1588 | 3.1 | 80 | 9.9 | 6.3 | 0.5 | 0.48 | 4 |
| Cropland | 1353 | 2.2 | 80 | 9.9 | 6.3 | 0.4 | 0.63 | 2.9 |
| Water bodies, barren, urban ** | 0 | 0 | 0 | 0 | 0 | 0 | 0 | 0 |
Table 3.
Emissions of estimated trace gases and particulate matter (Tg/year) from fires for the average annual value of the period from 1986 to 2010.
| Description | CO2 | CH4 | CO | PM10 | PM2.5 | SO2 | BC | NOx |
|---|---|---|---|---|---|---|---|---|
| Evergreen and deciduous needle leaf forest | 52.66 | 0.15 | 27.57 | 0.41 | 0.39 | 0.02 | 0.02 | 0.10 |
| Deciduous broadleaf forest | 30.65 | 0.08 | 16.47 | 0.26 | 0.22 | 0.01 | 0.01 | 0.04 |
| Mixed forest | 2.22 | 0.01 | 1.12 | 0.02 | 0.01 | 7.97 × 10⁻⁴ | 1.06 × 10⁻³ | 3.98 × 10⁻³ |
| Woodland | 5.79 | 0.02 | 3.15 | 0.03 | 0.03 | 1.75 × 10⁻³ | 1.75 × 10⁻³ | 0.02 |
| Wooded grassland | 1.50 | 2.83 × 10⁻³ | 0.73 | 0.01 | 0.01 | 4.56 × 10⁻⁴ | 4.75 × 10⁻⁴ | 0.00 |
| Scrubland | 3.23 | 0.01 | 1.68 | 0.02 | 0.01 | 9.91 × 10⁻⁴ | 1.03 × 10⁻³ | 1.29 × 10⁻³ |
| Grassland | 2.90 | 0.01 | 1.46 | 0.02 | 0.01 | 9.13 × 10⁻⁴ | 8.76 × 10⁻⁴ | 0.01 |
| Cropland | 0.56 | 9.13 × 10⁻⁴ | 0.33 | 4.11 × 10⁻³ | 2.61 × 10⁻³ | 1.66 × 10⁻⁴ | 2.61 × 10⁻⁴ | 1.20 × 10⁻³ |
| Total | 99.51 | 0.28 | 52.51 | 0.77 | 0.68 | 0.04 | 0.04 | 0.19 |
Table 4.
Comparison of our biomass burning estimations with several other published estimations (Tg/year).
| Literature Cited | Regions | Area ratio 1 | CO2 | CH4 | CO | PM10 | PM2.5 | SO2 | BC | NOx |
|---|---|---|---|---|---|---|---|---|---|---|
| [7] 2 | United states | 29.4:1 | 356 | 1.0 | 19.8 | 2.7 | 2.4 | 0.16 | - | 0.68 |
| Canada | 30.5:1 | 227 | 0.64 | 12.7 | 1.8 | 1.6 | 0.11 | - | 0.43 | |
| [50] 3 | China | 29.5:1 | 79.7 | 0.24 | 5.4 | - | 0.66 | 0.05 | 0.03 | 0.2 |
| [23] 4 | China | 29.5:1 | 40.7 | 0.11 | 2.7 | - | - | - | - | - |
| [25] 5 | China | 29.5:1 | 102 | 0.27 | 6.8 | - | 0.69 | 0.05 | 0.06 | 0.2 |
| This study 6 | GXM | 1:1 | 99.51 | 0.26 | 52.51 | 0.76 | 0.68 | 0.03 | 0.04 | 0.19 |
| This study 7 | GXM | 1:1 | 24.15 | 0.06 | 1.27 | 0.18 | 0.16 | 0.05 | 0.02 | 0.05 |
1 The area ratio of other study domains and the Great Xing’an Mountains (GXM); 2 calendar year 2004 estimated by [7]; 3 calendar year 2000 estimated by [49]; 4 average from calendar years 1950 to 2000 estimated by [23]; 5 fire year 2000 (April 2000 to March 2001) estimated by [47]; 6 average annual value of the period from 1986 to 2010; 7 average annual value of the period from 2005 to 2010.
© 2016 by the authors; licensee MDPI, Basel, Switzerland. This article is an open access article distributed under the terms and conditions of the Creative Commons Attribution (CC-BY) license (http://creativecommons.org/licenses/by/4.0/).
Share and Cite
MDPI and ACS Style
Yi, K.; Bao, Y. Estimates of Wildfire Emissions in Boreal Forests of China. Forests 2016, 7, 158. https://doi.org/10.3390/f7080158
AMA Style
Yi K, Bao Y. Estimates of Wildfire Emissions in Boreal Forests of China. Forests. 2016; 7(8):158. https://doi.org/10.3390/f7080158
Chicago/Turabian StyleYi, Kunpeng, and Yulong Bao. 2016. "Estimates of Wildfire Emissions in Boreal Forests of China" Forests 7, no. 8: 158. https://doi.org/10.3390/f7080158
Note that from the first issue of 2016, this journal uses article numbers instead of page numbers. See further details here.