Article

Mapping Local Effects of Forest Properties on Fire Risk across Canada

1
Canadian Forest Service, Natural Resources Canada, Quebec, QC G1V 4C7, Canada
2
Currently at Premier Tech Horticulture, 1 Avenue Premier, Rivière-du-Loup, QC G5R 6C1, Canada
*
Author to whom correspondence should be addressed.
Forests 2016, 7(8), 157; https://doi.org/10.3390/f7080157
Submission received: 9 May 2016 / Revised: 6 July 2016 / Accepted: 19 July 2016 / Published: 27 July 2016

Abstract

:
Fire is a dominant mechanism of forest renewal in most of Canada’s forests and its activity is predicted to increase over the coming decades. Individual fire events have been considered to be non-selective with regards to forest properties, but evidence now suggests otherwise. Our objective was therefore to quantify the effect of forest properties on fire selectivity or avoidance, evaluate the stability of these effects across varying burn rates, and use these results to map local fire risk across the forests of Canada. We used Canada-wide MODIS-based maps of annual fires and of forest properties to identify burned and unburned pixels for the 2002–2011 period and to bin them into classes of forest composition (% conifer and broadleaved deciduous), above-ground tree biomass and stand age. Logistic binomial regressions were then used to quantify fire selectivity by forest properties classes and by zones of homogeneous fire regime (HFR). Results suggest that fire exhibits a strong selectivity for conifer stands, but an even stronger avoidance of broadleaved stands. In terms of age classes, fire also shows a strong avoidance for young (0 to 29 year) stands. The large differences among regional burn rates do not significantly alter the overall preference and avoidance ratings. Finally, we combined these results on relative burn preference with regional burn rates to map local fire risks across Canada.

Graphical Abstract

1. Introduction

Fire is a dominant disturbance across boreal forests, with surface fires and stand-replacing canopy fires dominating in the Eurasian and North-American boreal forests respectively [1]. In Canada, the rate at which boreal and Montane forest burn, and the inter-annual variability in area burned affect all ecological processes, from landscape diversity to carbon sequestration [2]. Wildfires are also a threat to communities and infrastructures, and their frequency is predicted to increase during this century with climate change [3]. Because of this, improved maps of local fire risks are now needed to help inform management actions for risk mitigation.
Fire was initially studied in terms of its behaviour based on the detailed analysis of individual fires, with results showing the importance of weather conditions, and tree species on variables such as crowning, rate of spread and fuel consumption, e.g., [4,5]. This knowledge base was later extended to fire frequency using regional studies. In general, fire frequency or fire risk was found to be related to a host of factors, including longitude and latitude, topography, surficial deposits and forest properties [6,7], often dependant on the scale at which the study was conducted. In particular, fire was shown to strongly select conifer stands as compared to stands with a large deciduous component [8,9]. Finally, over the past decade, efforts have included national evaluations of fire risk and projections of such risks over time as a function of climate scenarios [10,11]. Because of their national coverage, these studies have been based exclusively on historical fire records and regional climate data and projections.
In the studies and approaches described above, the shift from understanding behavior to mapping risks at the national level has entailed the use of a data at coarse resolution, and an associated shift from local to regional drivers of fire dynamics. However, the mapping of fire risks across Canada’s forests at a scale relevant to management decisions requires a merging of regional climatic drivers of burn rates and local drivers of fire risk. Possibly the only study that tackled this scale issue was that of Parisien and colleagues [12] who looked at drivers of fire dynamics across Canada’s forests within 10,000-km2 hexagonal pixels. In that study, the authors extracted both regional (climate) and local (forest type) drivers of burn rates in the same analysis, and concluded that the climate variables largely dominate the explained variation in regional burn rates.
Recent developments described below now enable us to use a different approach for getting at a much finer evaluation of local forest fire risks across Canada. Regional fire risks, in terms of annual area burned and burn rate have been evaluated by Boulanger and colleagues [11] across 16 zones of homogeneous fire regimes (HFR) across Canada’s vegetated landscape. At the same time, Canada-wide maps of forest properties for base year 2001 and of fire for years 2001 to 2011 were created by Beaudoin and colleagues [13] and by Guindon and colleagues [14] respectively at a 250 m (6.25 ha) resolution corresponding to the pixel grid of the space-borne MODIS sensor. These last two products offer the possibility to quantify vegetation controls on fire risk with a massive dataset of fire and forest property observations. The goal of this study was therefore, by capitalising on this new information, to create a map of local (pixel-level) fire risk by combining quantified effect of vegetation properties on fire risk and the regional, climate-driven burn rates.
More specifically, the objectives of this study were (1) to quantify the effect of forest properties on fire selectivity; and (2) to assess the stability of this selectivity by forest property class across the range of regional burn rates found in Canada’s forests; and (3) to combine regional burn rates and fire selectivity by forest property class into a map of current fire risk at a 250 m resolution. We chose forest age, biomass and composition as forest properties, with age and biomass used as equivalent proxies to fuel loads, and composition used as a proxy to fuel flammability. In this analysis, forest composition is expressed as the percent composition in either coniferous evergreen (including Larix species) or broadleaved deciduous tree species. Across Canada, coniferous species are mostly represented by the genus Picea, Abies and Pinus, while broadleaved deciduous tree species in fire-prone areas are mostly represented by species from the genus Populus and Betula, while forest zones in south-eastern Canada with very limited fire activity have additional and often dominant components in trees of the genus Acer, with a large number of other broadleaved deciduous genus at various level of representation.

2. Materials and Methods

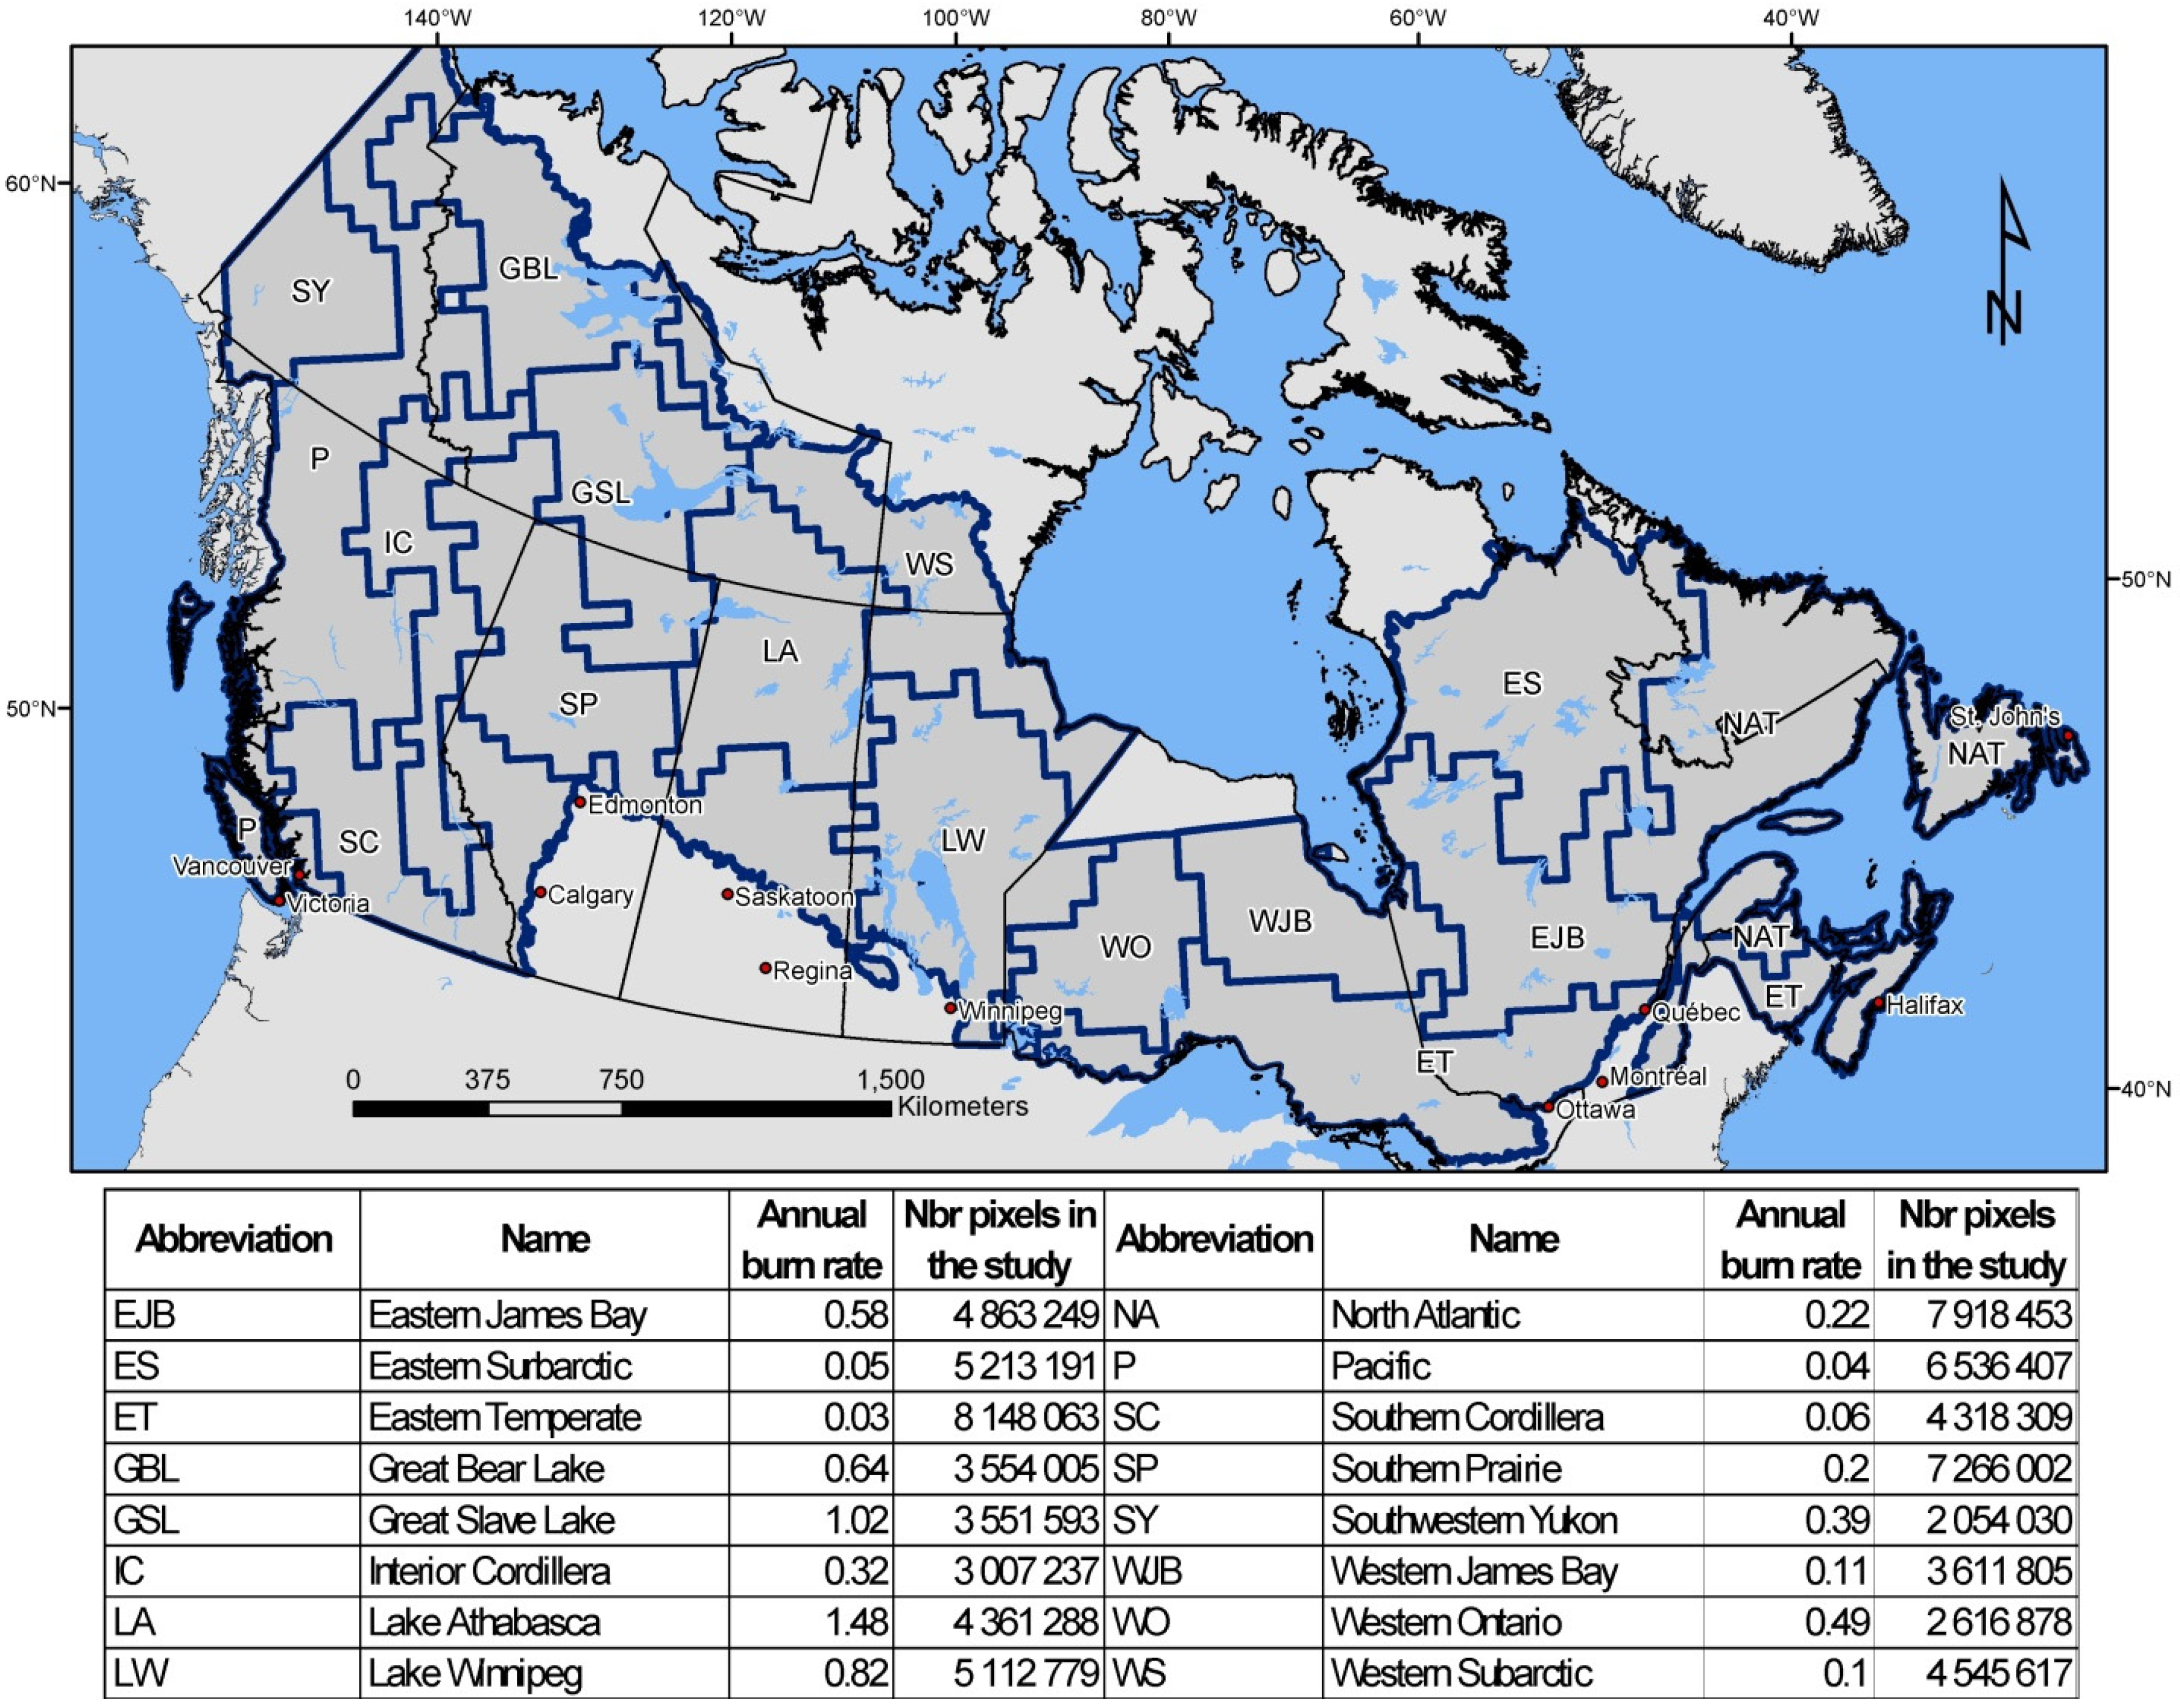
2.1. Region of Interest and Source of Data

The study was conducted across all forests of Canada using the 16 Homogeneous Fire Regime (HFR) zones from which we selected the percent annual area burned, or burn rate, as our regional fire risk metric [11] (Figure 1). These historical (1959–1999) annual burn rates range from less than 0.1% in the broadleaved-deciduous dominated forests of the Eastern Temperate zone, to nearly 1.5% in the conifer-dominated Lake Athabaska zone, for a 50-fold difference across the HFR zones.
Forest composition, age and biomass were obtained at a pixel resolution of 250 m × 250 m (6.25 ha) from the Canada-wide maps of forest properties of Beaudoin and colleagues [13]. These maps were created for base year 2001 using the non-parametric k-nearest-neighbour as the statistical estimation method, the National Forest Inventory photoplot data [15] as reference information, and a set of Canada-wide variables including MODIS spectral reflectance at 250 m (6.25 ha) pixel resolution as predictors. For our analysis, pixels in which the forest was identified as recently disturbed in 2001 and pixels with <80% of vegetation cover were eliminated. The analyses were carried out on the remaining 76,678,906 pixels, referred below as the “full set”.
Yearly Canada-wide maps of fire and harvest were produced for years 2001–2011 by Guindon and colleagues [14], also on the 250 m MODIS grid (available as supplementary material b of the original publication). These maps were created by analysing the pixel-level change in spectral properties over a moving 4-year window with the use of models trained on a large representative set of pixels that had been either harvested or burned. We used these maps to extract from our full set of pixels those that had burned in years 2002 to 2011. This led to the identification of 2,739,728 pixels distributed across all the HFR zones in which a fire had taken place in those years, with the fire extending across the full extent of the pixel in nearly 80% of the cases. The pre-burn composition, age and biomass of these burned pixels had been extracted earlier from the 2001 forest properties maps. The fire map product was specifically designed to minimize commission errors [14], and all pixels thus identified as having burned were retained for the analysis.
All pixels within the full set and the burned subset were binned into four composition classes, three age classes and three biomass classes based on their 2001 properties. Composition classes were: pure conifers (more than 75% conifers), conifer-dominated mixtures (between 50% and 75% of conifers), deciduous-dominated mixtures (between 25% and 50% of conifers), and pure deciduous (less than 25% of conifers). Age classes were: young (0 to 29 years), mature (30 to 89) and old (90+). Biomass classes were divided so as to contain the same number of pixels across the full dataset: low: (less than 19 tons/ha), medium: (19–55 tons/ha) and high (more than 55 tons/ha). The analyses were to be carried out on two combinations of independent variables: “composition and age”, and “composition and biomass”. Preliminary tests showed no significant correlation between composition and age or biomass across the HFR zones.

2.2. Analytical Methods

We used logistic binomial regressions to examine the pixel-level fire selectivity to biomass or age and composition. The full set of pixels was used as the trial set from which fire could select whereas the burned subset of pixels was used as the event set that was selected by the fire. Pixels in the full set and in the burned subset were processed by HFR zone using logistic regressions in which “composition and age” or “composition and biomass” were the independent class variables, and tested with or without interaction among them. Calculations were done using the glm function as programmed in the R open software [16]. Models were compared based on the smallest area under the Receiver Operating Characteristic (ROC) curve obtained using the pROC procedure of [17] programmed within the R open software.
Probabilities derived from the logistic models inherently reflect the 10-year burn rate in each individual HFR zones, which is thought to be in large part driven by climatic conditions (top-down factors). This effect had to be removed in order to compare the relative selectivity of fire for each “composition × age” or “composition × biomass” class across all HFR zones. Within each HFR zone, we therefore divided the burn probability of each class by the mean probability of the 12 classes, thereby transforming the probabilities into a set of normalised selection ratios in which a value of 1 represents a random selection process [18]. This normalisation enabled us to extract the effect of forest composition and age (or biomass) on fire selectivity within each HFR zone, as required by the first objective of this study.
For the second objective, two approaches were used to test whether or not the selectivity of fire with respect to forest composition and age or biomass changed with the regional burn rate. In the first approach, we used the hypothesis from [9] that an increased burn rate would decrease fire selectivity, and thus reduce the variability in selection ratios among the 12 “composition × age” or “composition × biomass”. To test this, we determined the significance of both a linear and a non-linear relationship between the burn rate (Rb) and the standard deviation among the 12 selection ratios (Ssr) across the 16 HFR zones. The linear and non-linear functions tested were:
S s r = a R b + b
S s r = 1 a R b + b
where a and b are parameters to be adjusted, using the nls function of the R open software.
In a second approach, we evaluated the relative contribution of composition, age (or biomass) and HFR zones in classifying the selection ratios within a regression tree. Since mean yearly burn rates vary by about 50-fold across the 16 HFR zones, we hypothesized that the HFR zones would be a strong classifying variable should burn rates influence the selection ratios of the 12 different forest classes. The selection ratios were used as response variable, and age or biomass, composition type and HFR zone were included as predictor variables. The analysis was carried out using the party procedure of [19] within the R open software with Bonferonni correction applied at p < 0.01.
As we will see in the results section, selection ratios were unaffected by fire regime and were therefore averaged by forest property class across Canada into national selection ratios. We combined these national selection ratios and the HFR zone burn rates of [11] to map pixel-level fire risk as a function of pixel-level forest properties. The national selection ratios provide a relative measure of fire selectivity among forest property classes, but their application at the pixel level must account for the relative abundance of these classes within each HFR zone (Table S1a,b). For this reason, we performed the following calculations by HFR zone. We first calculated a “fire risk adjustment factor” by forest property class as the national selection ratio of that class divided by the weighed mean of the 12 national selection ratios (Table S2), where the weights are the relative abundances (proportion of HFR zone pixels) of their respective forest property class. The fire risk of each forest property class was then computed as the product of its “fire risk adjustment factor” and the burn rate of [11] (Table S3a,b), and mapped by pixel across each HFR zone based on the forest property maps of Beaudoin and colleagues [13].

3. Results

In each of the 16 HFR zone, the interaction between the independent variables (i.e., “age × composition” or “biomass × composition”) were non-significant, and the logistic regression model with both independent variables performed better than the model with only one variable (Table S4a,b). The exceptions to this were two HFR zones, the low-fire conifer-dominated North Atlantic (NA) and the sub-arctic Western James Bay (WBJ) (see Figure 1 for location), in which models with age only were the best. The pixel-level probability of burning increased consistently with age class (or biomass) within each HFR zone, and with the proportion of conifers in all HFR zones other than NA and WBJ. Predicted 10-year probability of burning and corresponding standard errors for each of the 12 “composition × age” (or “composition × biomass”) classes for the 2002 to 2011 period are shown by HFR zone in Table S5a,b. The probability values were normalized into selection ratios by HFR zone (Table S6a,b) as described in the Methods section so as to express the relative effect of composition and age (or biomass) while controlling for the HFR annual burn rate on fire selectivity.
Overall, we found no strong evidence of a relationship between selection ratios and fire regime. In spite of a 50-fold span of burn rates across the 16 HFR zones, we found no significant linear or non-linear relationship (p > 0.55) between the standard deviation of the mean in selection ratios and the burn rate (Figure 2), thereby invalidating our hypothesis of a regional burn rate effect on fire selectivity. Furthermore, only composition and age were necessary to classify the selection ratios of forest composition and ages classes within a regression tree analysis, with p < 0.01 (Figure 3; note that NA and WJB were not included in these analyses). The patterns were the same when using biomass classes instead of the age ones, with the exception of a modest HFR zone effect on selection ratio classification of the combined mixed-deciduous and deciduous composition classes (Figure S1). This effect is very modest in that it affects only a small part of the classification tree for composition types that are less abundant, and was therefore disregarded in the remainder of the analysis.
The lack of a consistent burn rate effect on selection ratios allowed us to compute national selection ratios as the mean of all HFR zone selection ratios by “composition × age” or “composition × biomass” classes (Figure 4A,B, Table 1). Only these national values are referred to hereafter. When averaged across all age classes, pixels of pure conifer forests were selected by fire 1.9 times more, and pixels of pure deciduous avoided (avoidance = 1/selection) 2.6 times more, than what would be expected from a random selection process. Averaged across all composition classes, pixels of old forests were selected by fire 1.6 times more, and young forests avoided by fire 2.5 times more, than would be expected from a random selection process. Results suggest that old conifer forests were selected 2.9 times more and young deciduous forests avoided 6.6 times more than what would be expected from a random fire selection process. Age (Figure 4A) and biomass (Figure 4B) performed nearly interchangeably as controls of fire selectivity or avoidance. Although the regression tree analysis was unable to separate old from mature age classes in the pure conifer composition, and mixed deciduous from deciduous compositions across all three age classes (Figure 3), their respective national selections ratios are reported and were used in the mapping exercise.
The fire risk map resulting from the incorporation of local vegetation effect on regional burn rates shows the extent to which burn rates by HFR zone still dominate the national picture, with abrupt transitions between contrasting HFRs (Figure 5). However, the details shown in the cut-outs emphasize the extent to which accounting for pixel-level forest properties creates significant within-HFR zone modulation of local fire risk. The most striking within-HFR zone features are the lower fire risks (longer return intervals) areas associated with the recent fire scars in the western cut-out, but also with the agricultural areas around the near-circular Lac St-Jean in the eastern cut-out.

4. Discussion

Our results demonstrate that fire selectivity or avoidance with respect to stand properties can be described in terms of forest composition and age (or biomass). Composition in terms of conifers or deciduous species was used as a proxy for flammability, while age or biomass was used as a proxy for fuel load. Both proxies proved to be powerful and independent classifiers of fire selectivity. These results agree with studies that found lower fire risks in young or deciduous stands [9,20,21,22] in regional analyses of fire statistics and forest composition. Our results also complement those of [23] on the relationship between forest composition and regional burn rates, by providing an evaluation at a local level and as a function of both composition and age (or biomass).
The absence of interaction between composition and age (or biomass) with respect to fire risk in our analysis contrasts with results from studies that have highlighted such interactions [8] or shown differences in fire risk among different coniferous species [24,25]. These studies were apparently able to capture subtleties in fire behavior induced by local vegetation composition and age at the within-fire scale. Such effects may simply be too local to be captured in our national-scale analysis.
The absence of interaction between burn rates and the forest property-based selection ratios is in line with the regional results of [9] and suggests that our results capture the general flammability and loading within our generic species classification. Conifer species dominance across Canada ranges from Abies balsamea, (L.) Mill. a fire avoider (sensu [1]) in the wet North Atlantic HFR zone to the fire-embracing Pinus banksiana Lamb. in the high-burn rate Lake Athabaska HFR zone. Such a difference in species dominance does not seem to affect the selection ratios, and may suggest a low impact of the dominant conifer species on the regional burn rate. By contrast, [1] linked the prevalence of canopy versus ground fires in North America versus Eurasia to trait differences between dominant conifer tree species. It is apparent that the fundamental differences in tree architecture linked to fire types in the intercontinental comparison do not seem to be prevalent within Canada’s forests.
Many studies have found small scale differences in fire behavior among conifer species, with results for Canada’s forests encapsulated in the 16 fuel types of the Canadian Forest Fire Behavior Prediction (FBP) System [26]. Studies have also shown the temporally or locally dominant effects of weather and of fine-scale variables such as topography or surficial deposits [7,27] on fire occurrence. Our analysis is based on empirical “realized” fire occurrence, and, as in [28], yields results that may differ from those from process-based analysis of fire potential or behavior. Such a difference, however, is likely a matter of scale and optics as we do not attempt to capture elements fire behavior such as the rate of spread or the energy of the fire front, but rather assess the fire risk of pixel-level forest types independently of their neighbors. Also, our choice to perform this analysis at the scale of Canada and at the resolution of 250 m pixels means a near impossibility to reconcile our national-level results with highly local effects other than forest properties. Nevertheless, the quantitative evaluation of forest selectivity or avoidance based on our independent variables provides a level of information and spatial resolution that can be used to support management decisions.

5. Conclusions

The projections of future regional fire risk as performed by [11] and others assume that the influence of vegetation is stationary, based on the assumption of complete fire randomness within a fire regime zone. However, it is now apparent that there is a negative feedback process between fire regime and vegetation dynamics, as suggested by [21] and [29], on account of the avoidance of regenerating stands by fire, and even more so if hardwood regeneration is enhanced. Although not perfect, our results should help improve the evaluation of landscape-level flammability [30], the design of fire management activities and the development of adaptation measures to an increased fire risk.

Supplementary Materials

The following are available online at www.mdpi.com/1999-4907/7/8/157/s1, Figure S1: Regression tree classification of selection ratios among the 12 composition × biomass classes across the 14 homogeneous fire regime zones (HFR), using class variables composition, age and HFR as classifiers. Box-and-whiskers plots show values of the median, first and fourth quartiles and the 95% confidence interval of the selection ratios within each classification. Note that the homogeneous fire zones NA and WJB were not included in the analysis, Figure S2: Map of the homogeneous fire regime (HFR) zones of [11] in which the HFR-level fire risk has been modulated at the pixel level by fire selectivity given the pixel’s composition and biomass. The legend refers to the fire return interval, in years, which is equal to 1/(fractional annual burn rate), Table S1a: Relative abundance of each composition and age class, expressed as a fraction of total pixel numbers, within each of the 16 homogeneous fire regime (HFR) zones, Table S1b: Relative abundance of each composition and biomass class, expressed as a fraction of total pixel numbers, within each of the 16 homogeneous fire regime (HFR) zones, Table S2: Abundance-weighed mean of the 12 national selection ratios for Age and composition and for Biomass and composition Age × Composition forest property classes, Table S3a: Adjusted burn rate for each forest property classes of each HFR region for Age × composition forest property classes, Table S3b: Adjusted burn rate for each forest property classes of each HFR region for Biomass × composition forest property classes, Table S4a: Values of “Receiver Operating Characteristic” (ROC) used to compare regression models to explain the pixel-level occurrence of fire within the homogeneous fire regime zones of [11], and using forest composition (conifer, mixed-conifer, mixed-deciduous and deciduous) and age (0–30, 31–90, 91+) as independent variables. Values in bold indicate the model used to compute the regional selection ratio based on the logistic regression results obtained with glm, Table S4b: Values of “Receiver Operating Characteristic” (ROC) used to compare regression models to explain the pixel-level occurrence of fire within the homogeneous fire regime zones of [11], and using forest composition (conifer, mixed-conifer, mixed-deciduous and deciduous) and biomass (low: <19 tons/ha; medium: 19–55 tons/ha; high: >55 tons/ha) as independent variables. Values in bold indicate the model used to compute the regional selection ratio based on the logistic regression results obtained with glm, Table S5a: Predicted 10-year probabilities of burning (2002–2011) and their corresponding standard error for each combination of composition and age from logistic binomial regression models. Homogeneous fire regime (HFR) zones and their annual burn rates (BR; %) are from [11]. HRF zone names are detailed in Figure 1 of the main text, Table S5b: Predicted 10-year probabilities of burning (2002–2011) and their corresponding standard error for each combination of composition and biomass from logistic binomial regression models. Homogeneous fire regime (HFR) zones and their annual burn rates (BR; %) are from [11]. HRF zone names are detailed in Figure 1 of the main text, Table S6a: Selection ratios by homogeneous fire regime (HFR) zone for the 12 composition and age classes, Table S6b: Selection ratios by homogeneous fire regime (HFR) zone for the 12 composition and biomass classes.

Acknowledgments

The authors would like to acknowledge the Forest Change program within the Canadian Forest Service for its support to the development of the underlying spatial databases and to the current analysis.

Author Contributions

P.Y.B. and S.G. contributed equally to the conceptual development of the project, the interpretation of results and the writing of the manuscript. P.O.J. and F.M. carried out the analyses. Y.B., A.B. and L.G. provided expertise and interpretation related to the spatial databases of forest properties and fire dynamics that underpinned the analyses.

Conflicts of Interest

The authors declare no conflict of interest.

References

  1. Rogers, B.M.; Soja, A.J.; Goulden, M.L.; Randerson, J.T. Influence of tree species on continental differences in boreal fires and climate feedbacks. Nat. Geosci. 2015, 8, 228–234. [Google Scholar] [CrossRef]
  2. Kurz, W.A.; Stinson, G.; Rampley, G.J.; Dymond, C.C.; Neilson, E.T. Risk of natural disturbances makes future contribution of Canada’s forests to the global carbon cycle highly uncertain. Proc. Nat. Acad. Sci. USA 2008, 105, 1551–1555. [Google Scholar] [CrossRef] [PubMed]
  3. Flannigan, M.D.; Logan, K.A.; Amiro, B.D.; Skinner, W.R.; Stocks, B.J. Future area burned in Canada. Clim. Chang. 2005, 72, 1–16. [Google Scholar] [CrossRef]
  4. Van Wagner, C.E. Age class distribution and the forest fire cycle. Can. J. For. Res. 1978, 8, 220–227. [Google Scholar] [CrossRef]
  5. Stocks, B.J. Fire behaviour in mature jack pine. Can. J. For. Res. 1989, 19, 783–790. [Google Scholar] [CrossRef]
  6. Cyr, D.; Gauthier, S.; Bergeron, Y. Scale-dependent determinants of heterogeneity in fire frequency in a coniferous boreal forest of eastern Canada. Landsc. Ecol. 2007, 22, 1325–1339. [Google Scholar] [CrossRef]
  7. Mansuy, N.; Gauthier, S.; Robitaille, A.; Bergeron, Y. The effects of surficial deposit-drainage combinations on spatial variations of fire cycles in the boreal forest of eastern Canada. Int. J. Wildland Fire 2010, 19, 1083–1098. [Google Scholar] [CrossRef]
  8. Kafka, V.; Gauthier, S.; Bergeron, Y. Fire impacts and crowning in the boreal forest: Study of a large wildfire in western Quebec. Int. J. Wildland Fire 2001, 10, 119–127. [Google Scholar] [CrossRef]
  9. Cumming, S.G. Forest type and wildfire in the Alberta boreal mixedwood: What do fire burn? Ecol. Appl. 2001, 11, 97–110. [Google Scholar] [CrossRef]
  10. Jiang, Y.; Zhuang, Q.; Flannigan, M.D.; Little, J.M. Characterization of wildfire regimes in Canadian boreal terrestrial ecosystems. Int. J. Wildland Fire 2009, 18, 992–1002. [Google Scholar] [CrossRef]
  11. Boulanger, Y.; Gauthier, S.; Burton, P.J. A refinement of models projecting future Canadian fire regimes using homogeneous fire regime zones. Can. J. For. Res. 2014, 44, 365–376. [Google Scholar] [CrossRef]
  12. Parisien, M.-A.; Parks, S.A.; Krawchuk, M.A.; Flannigan, M.D.; Bowman, L.M.; Moritz, M.A. Scale-dependent controls on the area burned in the boreal forest of Canada, 1980–2005. Ecol. Appl. 2011, 21, 789–805. [Google Scholar] [CrossRef] [PubMed]
  13. Beaudoin, A.; Bernier, P.Y.; Guindon, L.; Villemaire, P.; Guo, X.J.; Stinson, G.; Bergeron, T.; Magnussen, S.; Hall, R.J. Mapping attributes of Canada’s forests at moderate resolution through kNN and MODIS imagery. Can. J. For. Res. 2014, 44, 521–532. [Google Scholar] [CrossRef]
  14. Guindon, L.; Bernier, P.Y.; Beaudoin, A.; Pouliot, D.; Villemaire, P.; Hall, R.J.; Latifovic, R.; St-Amant, R. Annual mapping of severe forest disturbances across Canada’s forests using 250 m MODIS imagery from 2000 to 2011. Can. J. For. Res. 2014, 44, 1545–1554. [Google Scholar] [CrossRef]
  15. Gillis, M.D.; Omule, A.Y.; Brierley, T. Monitoring Canada’s forests: The national forest inventory. For. Chron. 2005, 81, 214–221. [Google Scholar] [CrossRef]
  16. R Core Team. R: A language and environment for statistical computing. R Foundation for statistical Computing: Vienna, Austria. Available online: https://www.R-project.org/.
  17. Robin, X.; Turck, N.; Hainard, A.; Tiberti, N.; Lisacek, F.; Sanchez, J.-C.; Müller, M. pROC: An open-source package for R and S+ to analyze and compare ROC curves. BMC Bioinform. 2011, 12, 77. [Google Scholar] [CrossRef] [PubMed]
  18. Manly, B.; McDonald, L.; Thomas, D. Resource Selection by Animals: Statistical Design and Analysis for Field Studies; Chapman and Hall: New York, NY, USA, 1993; p. 221. [Google Scholar]
  19. Hothorn, T.; Hornik, K.; Strobl, C.; Zeileis, A. Package ‘party’: A Laboratory for Recursive Partytioning. 2015. Available online: https://cran.r-project.org/web/packages/party/party.pdf (accessed on 22 July 2016).
  20. Niklasson, M.; Granström, A. Numbers and sizes of fires: Long-term spatially explicit fire history in a Swedish boreal landscape. Ecology 2000, 81, 1484–1499. [Google Scholar] [CrossRef]
  21. Héon, J.; Arseneault, D.; Parisien, M.-A. Resistance of the boreal forest to high burn rates. Proc. Natl. Acad. Sci. USA. 2014, 111, 13888–13893. [Google Scholar] [CrossRef] [PubMed]
  22. Krawchuk, M.A.; Cumming, S.G. Effects of biotic feedback and harvest management on boreal forest fire activity under climate change. Ecol. Appl. 2011, 21, 122–136. [Google Scholar] [CrossRef] [PubMed]
  23. Girardin, M.P.; Terrier, A. Mitigating risks of future wildfires by management of the forest composition: An analysis of the offsetting potential through boreal Canada. Clim. Chang. 2015, 130, 587–601. [Google Scholar] [CrossRef]
  24. Leduc, A.; Bergeron, Y.; Gauthier, S. Relationships between prefire composition, fire impact, and postfire legacies in the boreal forest of eastern Canada. In Proceedings of the RMRS-P-46CD, Fort Collins, CO, USA, 26–30 March 2007; Department of Agriculture, Forest Service, Rocky Mountain Research Station: Fort Collins, CO, USA, 2007. [Google Scholar]
  25. Van Wagner, C.E. Prediction of crown fire behavior in two stands of jack pine. Can. J. For. Res. 1993, 23, 442–449. [Google Scholar] [CrossRef]
  26. Hirsch, K.G. Canadian Forest Fire Behavior Prediction (FBP) System: User’s Guide; Special Report 7; Natural Resources Canada, Canadian Forest Service/Northern Forestry Centre: Edmonton, AB, Canada, 1996; p. 122. [Google Scholar]
  27. Parisien, M.-A.; Moritz, M.A. Environmental controls on the distribution of wildfire at multiple spatial scales. Ecol. Monogr. 2009, 79, 127–154. [Google Scholar] [CrossRef]
  28. Wang, X.; Parisien, M.-A.; Flannigan, M.D.; Parks, S.A.; Anderson, K.R.; Little, J.M.; Taylor, S.W. The potential and realized spread of wildfires across Canada. Glob. Chang. Biol. 2014, 20, 2518–2530. [Google Scholar] [CrossRef] [PubMed]
  29. Parks, S.A.; Holsinger, L.M.; Miller, C.; Nelson, C.R. Wildland fire as a self-regulating mechanism: The role of previous burns and weather in limiting fire progression. Ecol. Appl. 2015, 25, 1478–1492. [Google Scholar] [CrossRef] [PubMed]
  30. Palma, C.D.; Cui, W.; Martell, D.L.; Robak, D.; Weintraub, A. Assessing the impact of stand-level harvests on the flammability of forest landscapes. Int. J. Wildland Fire 2007, 16, 584–592. [Google Scholar] [CrossRef]
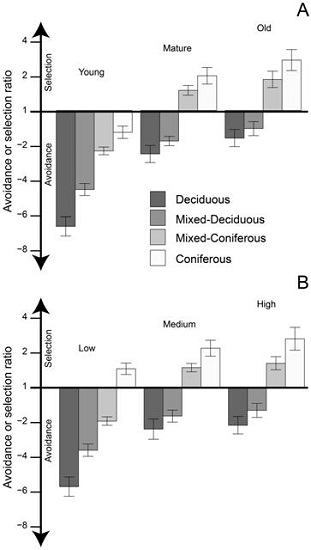
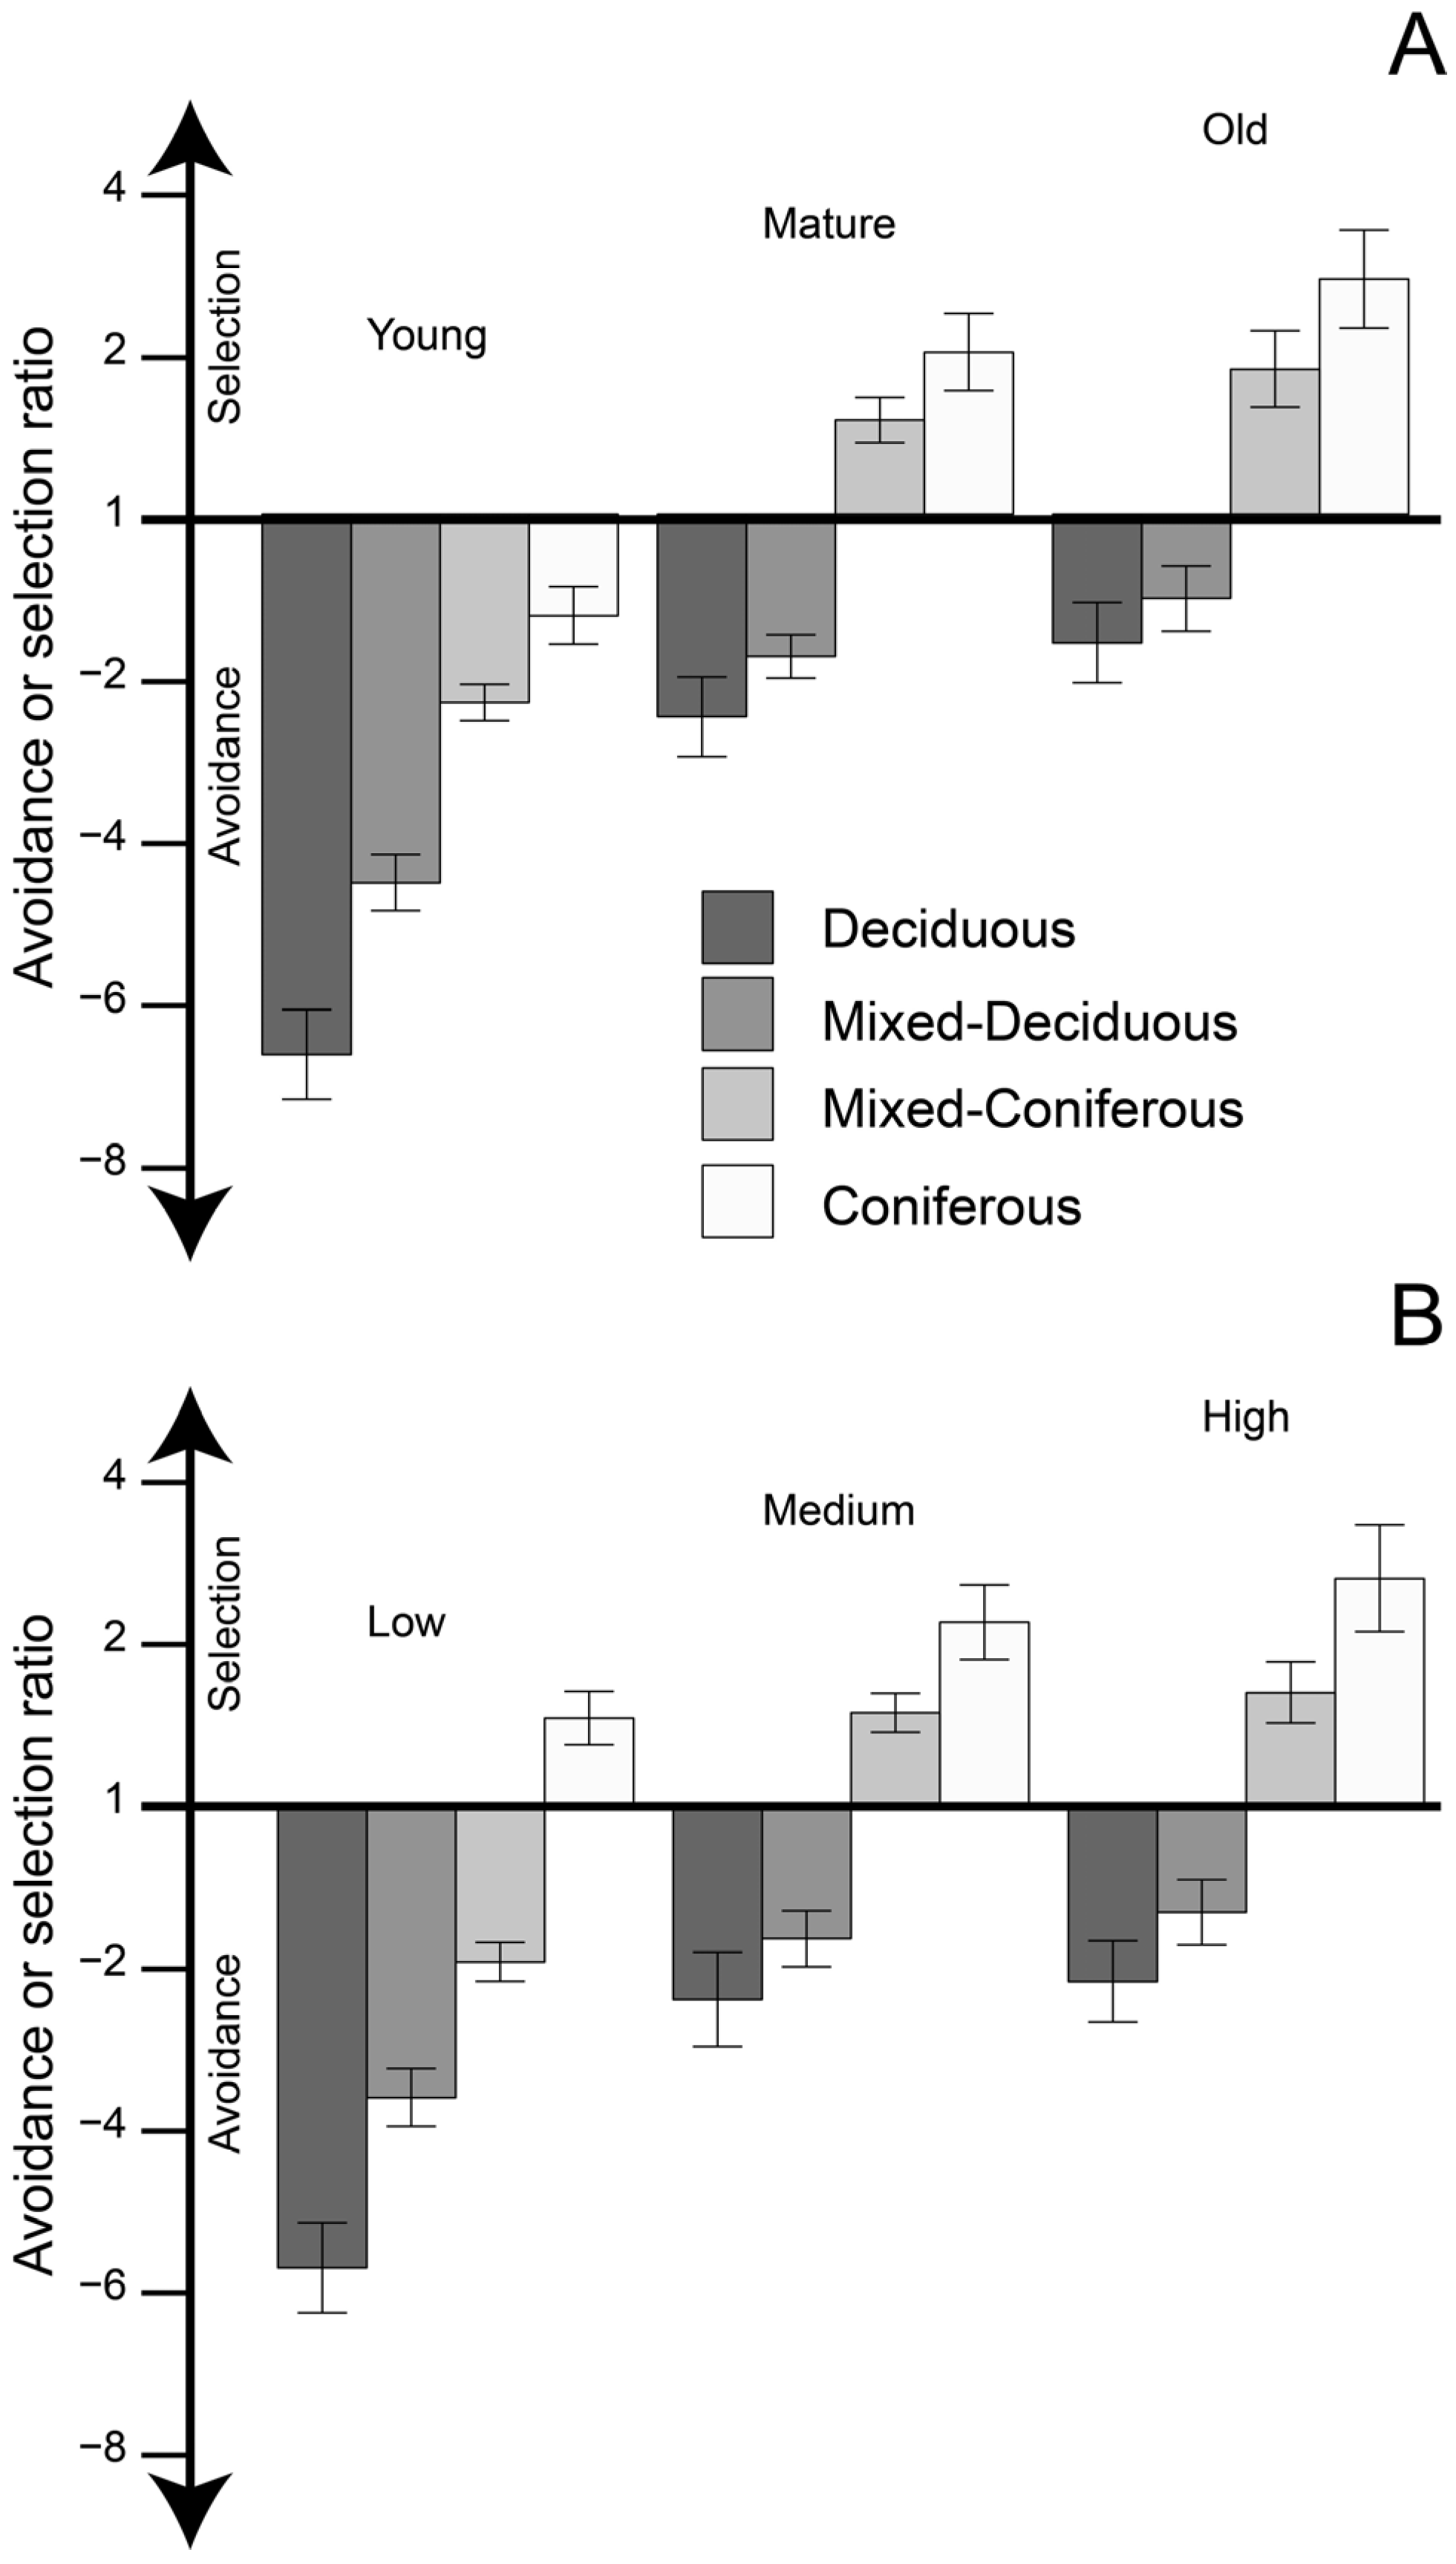
Figure 1. Homogeneous fire regime zones of Canada [11] with their associated burn rate, expressed as the mean annual area burned, in percent of their total area, and with the number of pixels from each homogeneous fire regime (HFR) used in the present analysis.
Forests 07 00157 g001
Figure 2. Standard deviations of the selection ratios of the 12 classes of composition and age across the 16 homogeneous fore regime (HFR) zones of [11] as a function of the annual burn rate of each HFR zone.
Forests 07 00157 g002
Figure 3. Regression tree classification of selection ratios among the 12 composition × age classes across the 14 homogeneous fire regime zones (HFR), using class variables composition, age and HFR as classifiers. Box-and-whiskers plots show values of the median, first and fourth quartiles and the 95% confidence interval of the selection ratios within each classification. The regression tree in which age is replaced by biomass is shown in Supplementary Material Figure S1. Note that NA and WJB zones were excluded from these analysis.
Forests 07 00157 g003
Figure 4. Values of the national selection ratios and avoidance ratios for (A) classes of “composition × age”; and (B) classes of “composition × biomass”. A value of 1 is expected if fire selectivity is random. Selection ratios < 1 indicate fire avoidance and are therefore expressed as avoidance ratios (1/selection ratio) for this graphical representation. The national selection ratios are means across the 16 homogeneous fire regime (HFR) zones. Also shown are the standard deviations of the selection and avoidance ratios among HFR zones.
Forests 07 00157 g004
Figure 5. Map of local (pixel-level) fire risks in which the HFR-level fire risks of [11] have been modulated at the pixel level by fire selectivity given the pixel’s composition and age. For the sake of clarity, fire risk is presented in terms of fire return interval (1/burn rate), and where long intervals represent a low fire risk. Cut-outs show in greater details the within-HFR degree of modulation as well as the abrupt transitions at HFR zone borders for regions across (A) western and (B) eastern forest regions of Canada.
Forests 07 00157 g005
Table 1. Mean selection ratios and corresponding standard errors (SE) of the mean calculated from the 16 homogenous fire regime zones for (A) composition × age classes, and (B) composition × biomass classes.
A
YoungMatureOld
Forest TypeRatioSERatioSERatioSE
Conifer0.800.152.000.262.900.35
Mixed-conifer0.430.051.160.161.790.26
Mixed-deciduous0.220.040.570.080.960.20
Deciduous0.150.040.400.100.630.16
B
LowMediumHigh
Forest TypeRatioSERatioSERatioSE
Conifer1.100.182.280.272.820.37
Mixed-conifer0.520.071.160.141.410.20
Mixed-deciduous0.280.050.610.110.770.16
Deciduous0.180.050.420.120.460.12

