Article

Cellulose Dynamics during Foliar Litter Decomposition in an Alpine Forest Meta-Ecosystem

1
Long-Term Research Station of Alpine Forest Ecosystems, Provincial Key Laboratory of Ecological Forestry Engineering, Institute of Ecology and Forestry, Sichuan Agriculture University, Chengdu 611130, China
2
Collaborative Innovation Center for Ecological Security in the Upper Reaches of the Yangtze River, Chengdu 611130, China
3
College of Life Science, Sichuan Normal University, Chengdu 610101, China
*
Author to whom correspondence should be addressed.
Forests 2016, 7(8), 176; https://doi.org/10.3390/f7080176
Submission received: 20 May 2016 / Revised: 1 August 2016 / Accepted: 11 August 2016 / Published: 19 August 2016

Abstract

:
To investigate the dynamics and relative drivers of cellulose degradation during litter decomposition, a field experiment was conducted in three individual ecosystems (i.e., forest floor, stream, and riparian zone) of an alpine forest meta-ecosystem on the eastern Tibetan Plateau. Four litter species (i.e., willow: Salix paraplesia, azalea: Rhododendron lapponicum, cypress: Sabina saltuaria, and larch: Larix mastersiana) that had varying initial litter chemical traits were placed separately in litterbags and then incubated on the soil surface of forest floor plots or in the water of the stream and riparian zone plots. Litterbags were retrieved five times each year during the two-year experiment, with nine replicates each time for each treatment. The results suggested that foliar litter lost 32.2%–89.2% of the initial dry mass depending on litter species and ecosystem type after two-year’s incubation. The cellulose lost 60.1%–96.8% of the initial mass with degradation rate in the order of stream > riparian zone > forest floor. Substantial cellulose degradation occurred at the very beginning (i.e., in the first pre-freezing period) of litter decomposition. Litter initial concentrations of phosphorus (P) and lignin were found to be the dominant chemical traits controlling cellulose degradation regardless of ecosystems type. The local-scale environmental factors such as temperature, pH, and nutrient availability were important moderators of cellulose degradation rate. Although the effects of common litter chemical traits (e.g., P and lignin concentrations) on cellulose degradation across different individual ecosystems were identified, local-scale environmental factors such as temperature and nutrient availability were found to be of great importance for cellulose degradation. These results indicated that local-scale environmental factors should be considered apart from litter quality for generating a reliable predictive framework for the drivers of cellulose degradation and further on litter decomposition at a global scale.

1. Introduction

Litter decomposition is a key ecological process in forest ecosystems, particularly in cold biomes where large amounts of plant litter accumulate [1]. The decomposition process provides nutrients for plant growth and is a critical step for terrestrial carbon (C) cycling, affecting soil organic matter buildup and controlling carbon dioxide (CO2) fluxes from soils [2,3]. Cellulose is the most abundant plant-synthesized biopolymer and typically constitutes 20%–30% of the C sequestered in plant litter [4]. Thus, in this respect, the understanding of cellulose degradation during litter decomposition in forest ecosystem is essential for future predictive power of litter decomposition models and terrestrial C cycles. Although intensive research on the subject of cellulose degradation has been carried out for decades [2], our current understandings on this process are mainly derived from terrestrial ecosystems such as forest floors [5,6,7], and little information is available on the dynamics of cellulose during litter decomposition in aquatic ecosystems (e.g., forest stream and forest fen), where the environmental factors substantially vary from those in terrestrial ecosystems.
Litter decomposition is traditionally thought to be hierarchically controlled by three main factors in the order of climate > litter quality > decomposer [8,9], but recent studies found that litter quality, which is usually expressed as litter species, can explain a much higher percent of variation in litter decomposition at both local and global scales [10,11]. Makkonen et al. suggested that litter decomposition process is driven by a small subset of litter traits, irrespective of the varying local decomposer communities at broad spatial scales [11]. However, more recent studies have proposed that climate and litter quality may not necessarily be the predominant controls on litter decomposition at regional scales, and local-scale environmental factors appear to be much more important than we previously supposed [12,13]. Environmental factors can have both direct (e.g., temperature, moisture, and nutrient availability) and indirect (e.g., through affecting decomposer community) effects on litter decomposition process [14]. Although litter decomposition in terrestrial and aquatic ecosystems can share some common driving factors such as ambient nutrient availability, decomposer community, and litter quality [11,15,16], several fundamental differences of environmental conditions in aquatic ecosystems can preclude a generalization for litter decomposition patterns. These include the buffered temperature ranges, unlimited water availability, and limiting oxygen levels in aquatic ecosystems [17]. Even in aquatic ecosystems, some factors can vary between lotic (e.g., forest stream) and stagnant (e.g., forest fen) waters, such as the abrasion induced by sediment transport [17] and continuous nutrient supply from upstream in streams [18]. However, previous studies have focused mainly on litter mass loss or decomposition rate in terrestrial or aquatic ecosystem separately, and whether these substantially varying local-scale environmental factors among different types of ecosystems will differently moderate the process of cellulose degradation during litter decomposition is still elusive.
In a forest meta-ecosystem, which is defined here as a set of individual ecosystems connected by subsidies such as spatial flows of energy, materials, and organisms across the boundaries [19], low-order streams are widely distributed and play fundamental roles in the cycles of C and nutrients [20,21]. Streams are detrital-based, with plant litter, particularly foliar litter, being a predominant component of stream food webs and ecosystem functioning in forest systems [22,23]. Likewise, forest riparian zones, which are usually small size wetlands, are also an important component of the forest systems. Forest riparian zones are commonly transitional zones that low-order streams feed, playing a key role in connecting the forest land and higher-order streams or forest river [24]. As plant litter is one of the most important subsidies, elucidating the dynamics of cellulose during litter decomposition in the individual ecosystems within a forest meta-ecosystem would be useful for understanding the similarities/differences of this process between terrestrial and aquatic ecosystems. Such knowledge may also useful for revealing the underlying mechanics of the connections among individual ecosystems of the forest meta-ecosystem. The objective of this study was to assess if and how the ecosystem type and litter quality (i.e., litter species) drive the degradation of cellulose, which is one of the main components of litter, at different stages of the foliar litter decomposition process.
To do so, a two-year field litter decomposition experiment was conducted in an alpine forest meta-ecosystem on the eastern Tibetan Plateau, where large amounts of plant litter accumulate and frequent freeze-thaw events are common in winter [25]. We measured the remaining cellulose masses, cellulose concentrations, and degradation rates in the decomposing foliar litters of four species, which differed widely in initial chemical traits, from the dominant species of willow (Salix paraplesia), azalea (Rhododendron lapponicum), cypress (Sabina saltuaria), and larch (Larix mastersiana) incubated in forest floors, streams, and riparian zones. We hypothesized that (1) cellulose is degraded at varying rates in different ecosystems in the order of streams > riparian > forest floor; and (2) the degradation rate of cellulose will be controlled by the same hierarchy of factors (i.e., litter species and local-scale environmental factors) across ecosystem types.

2. Materials and Methods

2.1. Study Area

We conducted the experiment in the Long-term Research Station of Alpine Forest Ecosystems, which is located in the Miyaluo Nature Reserve (31°14’–31°19’ N, 102°53’–102°57’ E, 2458–4619 m above the sea level), southwestern China. This region is a transitional reserve area along the upper reaches of the Yangtze River, and is a typical winter-cold zone regularly exposed to subfreezing temperature. The mean annual temperature is approximately 3 °C ranging from −18 °C to 23 °C, and the annual precipitation is approximately 850 mm. Details about the study area such as vegetation and soil were described elsewhere [6,26].

2.2. Experimental Design and Litterbag Incubation

We established three plots (25 m × 25 m), which were at least 1 km from each other, on the forest floor in the study area (31°14’ N, 102°53’ E, c. 3600 m above the sea level). The forest floor plots had similar slopes, aspects and closed tree canopies. Meanwhile, three forest streams and riparian zones were established as incubation plots adjacent to each of the forest floor plots. The selected streams have lengths of approximately 200 m and widths ranging from 30 to 160 cm. The riparian zones are typical forest fens with a similar area of approximately 1 ha each.
Freshly fallen foliar litters from four dominant woody species (i.e., willow, azalea, cypress, and larch) were collected between 5 and 8 October 2013. The collected foliar litter was first air dried to constant weight, and then a mass of the air-dried foliar litter equivalent to 10.0 g of oven-dried was weighed and placed into 20 cm × 20 cm litterbags (0.5 mm mesh size) for each litter species. To calculate a moisture correction factor between air-dried and oven-dried samples, subsamples of the air-dried litter (10.0 g with nine replicates) for each species were oven dried at 65 °C to a constant weight to determine the moisture content. In total, 1080 litterbags (4 litter species × 3 plots × 3 replicates × 10 sampling events × 3 ecosystem types) were constructed, and were placed in the established plots on 13 November 2013. Litterbags were first tied to ropes and then placed in the stream and riparian zone plots, and the ropes were fastened with stainless steel rods encased by polyvinyl chloride tubes. Litterbags were directly placed on the soil surface of the forest floor plots.
To quantify the temporal dynamics of cellulose degradation and its relationship with the local-scale environmental factors in each individual ecosystem, we designated a whole year into five periods (i.e., the pre-freezing period, the freezing period, the thawing period, the growing season, and the late growing season) according to Olsson et al. [27] and our previous studies [25,28]. Details about the criteria for period division have been described elsewhere [29,30]. Litterbags were retrieved successively at the end of each designated period, i.e., after 40, 107, 162, 264, 365, 399, 484, 528, 631, and 732 days of field incubation.

2.3. Local-Scale Environmental Factors

Temperature dynamics during litter decomposition process in each individual ecosystem were monitored using DS 1923-F5 iButton loggers (Maxim Integrated Products Inc., San Gabriel Drive Sunnyvale, CA, USA), which were placed in one litterbag for each ecosystem type. The temperatures were measured every 2 h. For determining soil characteristics in the forest floor plots, we randomly took three soil cores (5 cm × ø10 cm, the organic layer) within each plot at each sampling event. Soil samples were sieved for determining pH and the concentrations of total organic C, nitrogen (N), and phosphorus (P). Carbon concentration was determined using dichromate oxidation method, N concentration using the Kjeldahl method, and P concentration using the phosphomolybdenum yellow spectrophotometry method [25]. For determining water characteristics in the stream and riparian zone plots, we tested the pH (pH 320, WTW GmbH, Weilheim, Germany) and flow velocity (Martin Marten Z30, Current-meter, Barcelona, Spain) at each sampling event in situ. Meanwhile, water samples with three replicates from each plot were collected using polyethylene bottles and transported to laboratory for further analysis. Water samples were first filtered (GF/F glass fiber filter with 0.7-μm retention; Whatman International, Florham Park, NJ, USA) upon arrival at the laboratory, and the filtered samples were then used for determination of the concentrations of bicarbonate (HCO3), phosphate (PO43), nitrate (NO3), and ammonium (NH4+) using the double indicator-neutralization method, molybdate method, capillary ion electrophoresis, and indophenols blue method, respectively [31]. The means of these variables across the two-year experiment are presented in Table 1, and the temporal dynamics of these variables have been shown elsewhere [28].

2.4. Measurements of Litter Initial Traits and Cellulose Degradation

For litter initial chemical traits, we determined the concentrations of total organic C, total N, total P, cellulose, and lignin (Table 2). The concentrations of C, N, and P were tested using the methods similar to those for the soil, and cellulose and lignin concentrations were analyzed using the widely used acid detergent solution method, which has been described in detail elsewhere [32,33]. Upon litterbag retrieval at each sampling event, litter materials were gently rinsed with deionized water for removing soil particles and animal feces, and then dried at 65 °C to constant mass and weighed. The weighed litter material was ground to fine powder with a ball mill of 0.3 mm mesh, and the powder was then used to determine cellulose concentration. The remaining cellulose mass (Rc) was calculated as follows:
R c = C t × M t   ( t = 0 , 1 , 2 , 3 , 4 , 5 , 6 , 7 , 8 , 9 , 10 )
where Ct is the cellulose concentration in remaining litter at sampling time t, and Mt is the mass of remaining litter (g) at sampling time t. Cellulose degradation rate (percent initial mass per month, %/month) for each period was calculated as follows:
D t ( % ) = M t 1 C t 1 M t C t M 0 C 0 Δ T t × 100 %   ( t = 1 , 2 , 3 , 4 , 5 , 6 , 7 , 8 , 9 , 10 )
where Mt−1 and Mt are the remaining litter dry mass at the sampling times of t − 1 and t, respectively; Ct−1 and Ct represent cellulose concentration (%) at the sampling times of t − 1 and t, respectively; M0 and C0 are the initial dry mass and cellulose concentration; and ΔTt is the decomposition time in months between the sampling times of t−1 and t.

2.5. Statistical Analyses

A repeated-measure general linear model (GLM) was used to test the individual and interactive effects of ecosystem type, litter species, and decomposition period on cellulose degradation rate across the two-year experiment. To determine the differences in litter initial chemical traits among different litter species, litter mass loss and cellulose mass remaining between each ecosystem type, and cellulose concentration and degradation rate among different decomposition periods, we used one-way ANOVAs to explicitly evaluate the effects of litter species, ecosystem type and decomposition period. When ANOVA results were significant at the 0.05 level, Tukey’s HSD test was used to assess the differences among averages. A stepwise regression analysis was conducted to test the relationship between litter initial chemical traits and cellulose degradation rate, and univariate regression analyses with cellulose degradation rate as a response variable and local-scale environmental factors as predictor variables were conducted. We tested for homoscedasticity, normality of residuals, and independence of errors to assess whether our data met the assumptions of analysis. The statistical analyses were performed using the SPSS software package version 18.0 (SPSS Inc., Chicago, IL, USA) for Microsoft Windows.

3. Results

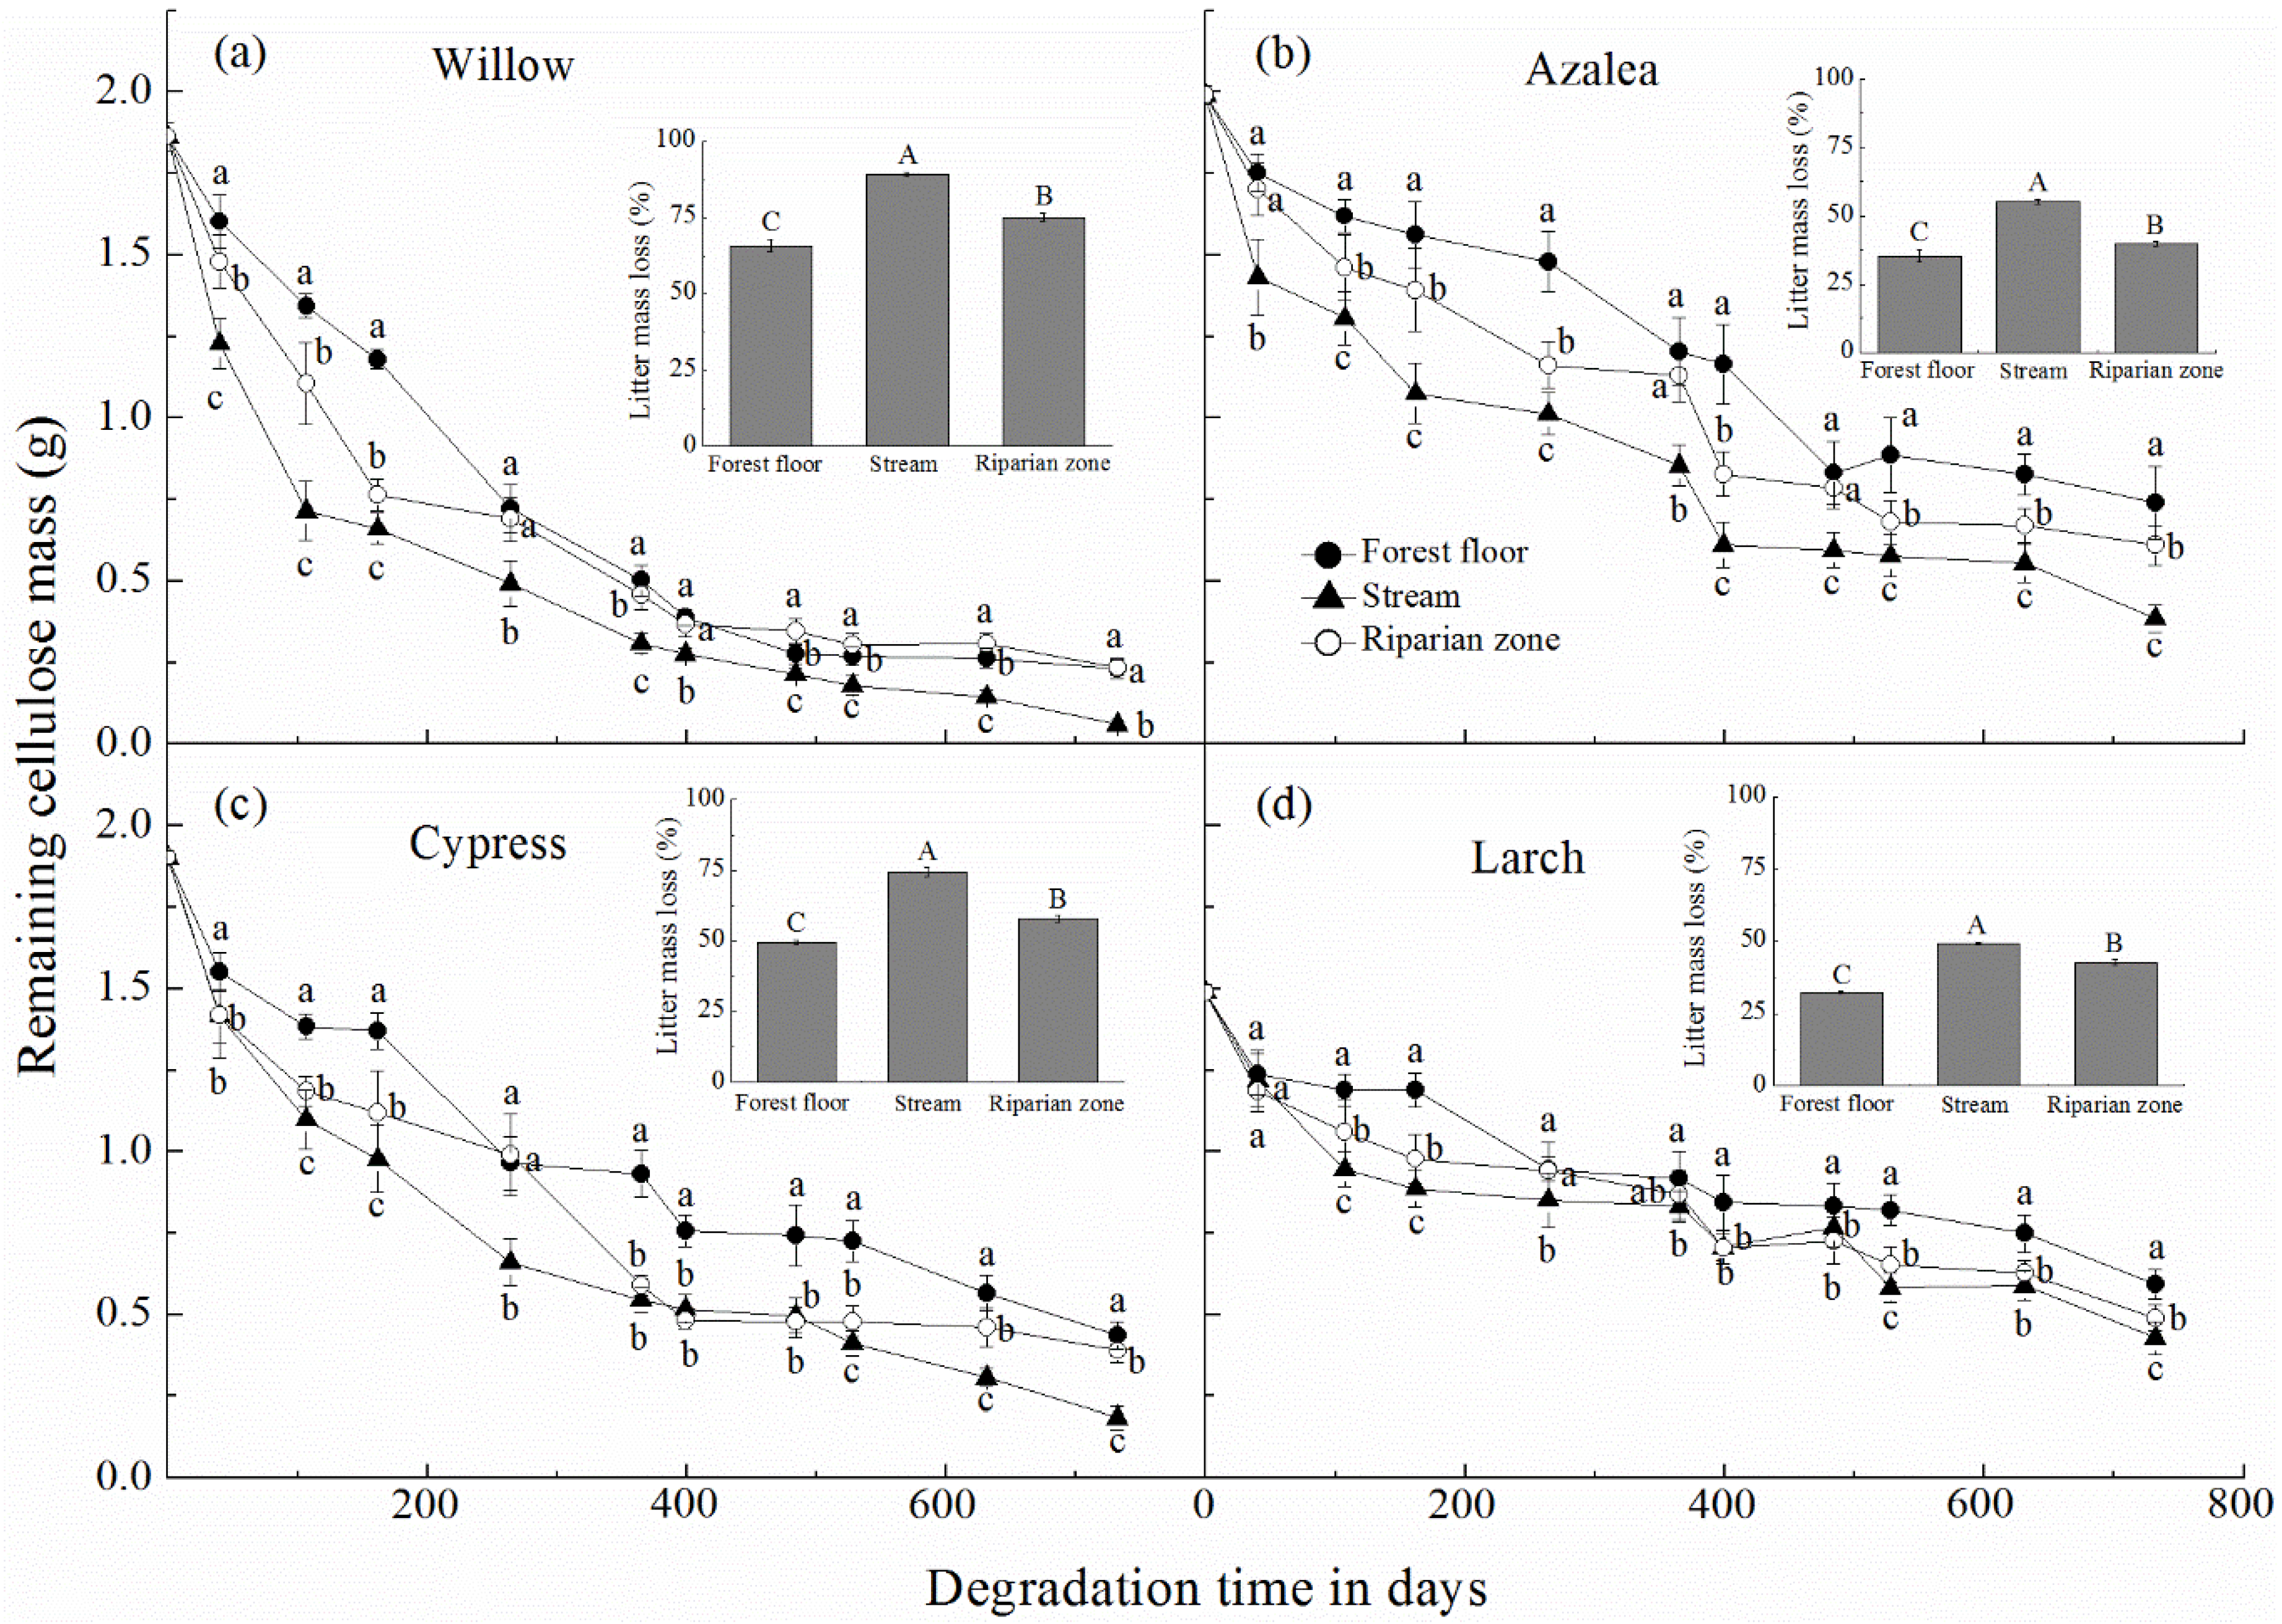
3.1. Litter Mass Loss and Cellulose Mass Remaining

At the end of the experiment, foliar litter had lost 32.2%–89.2% of the initial dry mass depending on litter species and ecosystem type, and litter mass loss for a specific litter species varied significantly among different ecosystems, with an order of stream > riparian zone > forest floor (Figure 1). Overall, cellulose absolute mass in the decomposing foliar litter showed a consistent decrease pattern over time regardless of litter species and ecosystem type (Figure 1). After two years’ degradation, cellulose had lost 60.1%–96.8% of the initial mass, decreasing from 2.0 g to 0.1 g depending on litter species and ecosystem type. Cellulose mass remaining was the lowest in streams for a comparable period, while the remaining mass was very similar in the riparian zone and forest floor plots. For a specific ecosystem type, cellulose was degraded much faster in willow and cypress litters, with lower remaining mass than in azalea and larch litters after two years’ degradation.

3.2. Cellulose Concentration

Cellulose concentration showed a general trend of decrease over time, but differed among different litter species and ecosystem types (Figure 2). For a specific litter species, cellulose concentration was the lowest in the litter incubated in streams followed by riparian zones and forest floors over two years’ degradation. For a specific ecosystem type, changes in cellulose concentration were the largest in willow litter followed by cypress and azalea litter, and the lowest in larch litter. Moreover, cellulose concentration showed significant (p < 0.05) variations among different decomposition periods for a specific litter species incubated in a specific ecosystem type.

3.3. Cellulose Degradation Rate

As revealed by the repeated-measure GLM, cellulose degradation rate was significantly (p < 0.001) affected by both the individual and interactive effects of litter species, ecosystem type, and decomposition period (Table 3). Although the cellulose degradation rate varied significantly among different decomposition periods, a very high degradation rate was observed in the first pre-freezing period regardless of litter species and ecosystem type (Figure 3), indicating a substantial cellulose degradation in the early stage of litter decomposition. For a specific litter species, cellulose degradation rates were usually higher in streams and riparian zones than on forest floors for a comparable period. The stepwise regression analysis suggested that cellulose degradation rate was closely correlated with litter initial chemical traits, and was mainly controlled by initial concentrations of P and lignin as well as N/P ratio (Table 4). Moreover, local-scale environmental factors such as temperature in riparian zones and forest floors, soil N and P concentrations in forest floor plots, and water nutrient availability in streams and riparian zones can have significant influences on cellulose degradation rate (Table 5).

4. Discussion

In accordance with our hypotheses, both cellulose mass and concentration showed consistent decrease patterns during the two-year experiment regardless of litter species and ecosystem type, and cellulose degradation rate was significantly (p < 0.001) affected by litter species, ecosystem type, decomposition period, and their interactions, with a general trend for the degradation rate in the order of stream > riparian zone > forest. Litter decomposition is a complex biological process that is strongly affected by litter initial quality (i.e., litter chemical traits) [2]. The important role of litter quality for the process of litter decomposition has long been recognized [8], and was recently found to be much more significant than we previously thought both in terrestrial [10,11] and aquatic [34] ecosystems. The degradation of cellulose in decomposing litter is usually thought to be mainly driven by numerous species of microorganisms, including both bacteria and fungi, which rely on extracellular enzymes either secreted into their immediate surroundings or located on the cell surface [2]. Microbial community and activity are closely related to labile plant constituents and nutrients that could be utilized more efficiently by microbes [35]. The availability of relatively abundant soluble nutrients in decomposing litter at the early decomposition stage can support a rich microbial community, accelerating the degradation of cellulose. This may be a possible mechanism for the high degradation rate observed in the first pre-freezing period in the present study (Figure 3).
On the other hand, as cellulose is usually shaded by lignin in plant litter, the degradation of cellulose can be significantly affected by lignin concentration [36]. A recent study found that a certain proportion of lignin can be degraded on the early stage of litter decomposition, and such degradation is controlled by the availability of easily decomposable carbon sources [37]. If lignin degradation occurs in the initial phase of litter decomposition when easily decomposable carbon sources are abundant, the lignin-shaded cellulose would be much easier to be attacked by microbial decomposers, thus high cellulose degradation is likely in the early decomposition stage. This was confirmed by the results of our analysis that a significant (p < 0.05) negative relationship was observed between cellulose degradation rate and lignin concentration (Table 4). It is, therefore, easy to understand that a litter species with lower lignin concentration showed higher cellulose degradation rate within a specific ecosystem type. Moreover, cellulose degradation rate was found to be significantly moderated by litter initial P concentration, which can explain up to 64.4%–74.8% of the variation depending on ecosystem types (Table 4). This may be attributed to the fact that P is an important nutrient for microorganisms and the enzymes related to cellulose degradation [38]. Apart from the influences of litter quality on cellulose degradation, ecosystem type, and decomposition period, which were expressed as local-scale environment factors in the present study, appeared to be of significance as well.
While a large amount of research has investigated the effects of climate and litter quality on litter decomposition in terrestrial ecosystems [2,16] or in aquatic ecosystems [15,34] independently, only few studies [39,40] have investigated this process in a common litter decomposition framework, e.g., in a forest meta-ecosystem. Some common drivers, both biotic and abiotic factors, on litter C and N loss [39] have been found across different ecosystem types. Still, to develop common models across aquatic and terrestrial ecosystem or even within one ecosystem type at a broad spatial scale is still challenging, as local-scale environmental factors appear to be much more significant for litter decomposition process than we previously thought [12,34]. For instance, although we found that the concentrations of P and lignin were the dominant litter chemical traits affecting cellulose degradation regardless of ecosystem type, cellulose degradation rate for a specific litter species varied significantly among different ecosystems and decomposition periods, indicating the importance of environmental factors for this process. The effects of within-site litter trait variation are usually thought to be larger than between-site variation across both local and large spatial scales [10,11], but we instead found that ecosystem type and decomposition period had higher effects on cellulose degradation than litter traits (Table 3). This may be attributed to the fact that the local-scale environmental factors can vary significantly among different ecosystem types during different decomposition periods. For example, in streams, the buffered water temperature in winter and the constant water flow and continuous nutrient supply from upstream sources can sustain microbial communities related to cellulose degradation over the entire year [15,18]. Thus, cellulose in decomposing litter incubated in streams had a higher degradation rate than in other ecosystems, showing an order of stream > riparian zone > forest floor. These results were in accordance with litter mass loss, which showed similar mass-loss pattern to cellulose degradation.
Likewise, the fluctuating environmental factors during different decomposition periods can also greatly affect cellulose degradation rate. Temperature in both forest floor and riparian zone can vary strongly with the seasonal dynamics and freeze-thaw cycles, while it is buffered in the streams, thus the temperatures in the forest floors and riparian zones significantly, but negatively, influenced cellulose degradation rate (Table 5). The negative effect on temperature showed during litter decomposition may be attributed to the fact that more recalcitrant material is formed at higher temperatures [41,42]. Ecosystem pH typically reflects basic lithology and background biogeochemistry [17], its effect on cellulose degradation in decomposing litter appeared to be consistent in all the investigated individual ecosystems. In addition, nutrient availability in the environment was also an important moderator of cellulose degradation, as it is directly related to the community and activity of microorganisms that degrade cellulose during litter decomposition [34,43]. However, the relative importance for different nutrients varied depending on litter species and ecosystem type.

5. Conclusions

Foliar litter lost 32.2%–89.2% of its initial dry mass depending on litter species and ecosystem type, and litter mass loss for a specific litter species varied significantly among different ecosystems. Cellulose degradation was significantly (p < 0.001) affected by litter initial chemical traits (litter quality), ecosystem type, decomposition period, and their interactions. Specifically, both cellulose mass and concentration showed general trends of decrease during the two-year experiment, with a degradation rate in the order of stream > riparian zone > forest floor. Cellulose degradation rate was the highest in the first pre-freezing period regardless of ecosystem type and litter species, indicating substantial cellulose loss in the early phase of litter decomposition. Litter initial concentrations of P and lignin were found to be the dominant chemical traits controlling cellulose degradation regardless of ecosystems type. Local-scale environmental factors such as temperature, pH and nutrient availability were important moderators of cellulose degradation rate. Our results indicated that the identification of common litter chemical traits (e.g., P and lignin concentrations) on cellulose degradation in both terrestrial and aquatic ecosystems may be useful for generating a reliable predictive framework for the effects of litter quality on cellulose degradation at a global scale. However, the complexity of local-scale environmental factors such as temperature and nutrient availability in different types of ecosystems should also be considered in addition to litter quality, as the present study has shown that these factors are even more important in the present study. Moreover, the significance of microbial community and activity on cellulose degradation during litter decomposition in different types of ecosystems should be paid more attention in further investigations and modeling studies.

Acknowledgments

We are indebted to Björn Berg for his critical and constructive comments that improved our manuscript. We also thank two anonymous reviewers for providing insightful comments and useful suggestions. Kai Yue acknowledges the China Scholarship Council for supporting a joint Ph.D. program grant (201506910002). This research was financially supported by the National Natural Science Foundation of China (31270498, 31570445, 31500509, and 31500358) and the Doctoral Scientific Fund Project of the Ministry of Education of China (20135103110002). The funding sponsors had no role in the design of the study, the collection, analyses, or interpretation of the data; in the writing of the manuscript, or in the decision to publish the results.

Author Contributions

F.W., W.Y., C.H., and K.Y. conceived and designed this study; All the authors performed the field experiments; K.Y. and Y.P. conducted the laboratory analyses; K.Y. and C.H. analyzed and interpreted the data; F.W., W.Y., and C.H. contributed reagents, materials, and analysis tools; K.Y. and C.H. wrote the paper; All the authors critically reviewed and revised the paper.

Conflicts of Interest

The authors declare no conflict of interest.

References

  1. ACIA. Arctic Climate Impact Assessment-Scientific Report; Cambridge University Press: Cambridge, UK, 2005. [Google Scholar]
  2. Berg, B.; McClaugherty, C. Plant Litter: Decomposition, Humus Formation, Carbon Sequestration, 3rd ed.; Springer: Berlin/Heidelberg, Germany, 2014. [Google Scholar]
  3. Prescott, C. Decomposition and mineralization of nutrients from litter and humus. In Nutrient Acquisition by Plants: An Ecological Perspective; BassirRad, H., Ed.; Springer-Verlag: Berlin, Germany, 2005; pp. 125–141. [Google Scholar]
  4. Berg, B.; Laskowski, R. Litter decomposition: A guide to carbon and nutrient turnover. In Advances in Ecological Research; Elsevier: Amsterdam, The Netherlands, 2006. [Google Scholar]
  5. Fioretto, A.; Di Nardo, C.; Papa, S.; Fuggi, A. Lignin and cellulose degradation and nitrogen dynamics during decomposition of three leaf litter species in a mediterranean ecosystem. Soil Biol. Biochem. 2005, 37, 1083–1091. [Google Scholar] [CrossRef]
  6. Li, H.; Wu, F.; Yang, W.; Xu, L.; Ni, X.; He, J.; Tan, B.; Hu, Y. Effects of forest gaps on litter lignin and cellulose dynamics vary seasonally in an alpine forest. Forests 2016, 7. [Google Scholar] [CrossRef]
  7. Talbot, J.M.; Treseder, K.K. Interactions among lignin, cellulose, and nitrogen drive litter chemistry-decay relationships. Ecology 2012, 93, 345–354. [Google Scholar] [CrossRef] [PubMed]
  8. Coûteaux, M.-M.; Bottner, P.; Berg, B. Litter decomposition, climate and liter quality. Trends Ecol. Evol. 1995, 10, 63–66. [Google Scholar] [CrossRef]
  9. Hättenschwiler, S.; Jørgensen, H.B. Carbon quality rather than stoichiometry controls litter decomposition in a tropical rain forest. J. Ecol. 2010, 98, 754–763. [Google Scholar] [CrossRef]
  10. Cornwell, W.K.; Cornelissen, J.H.C.; Amatangelo, K.; Dorrepaal, E.; Eviner, V.T.; Godoy, O.; Hobbie, S.E.; Hoorens, B.; Kurokawa, H.; Pérez-Harguindeguy, N.; et al. Plant species traits are the predominant control on litter decomposition rates within biomes worldwide. Ecol. Lett. 2008, 11, 1065–1071. [Google Scholar] [CrossRef] [PubMed]
  11. Makkonen, M.; Berg, M.P.; Handa, I.T.; Hättenschwiler, S.; van Ruijven, J.; van Bodegom, P.M.; Aerts, R. Highly consistent effects of plant litter identity and functional traits on decomposition across a latitudinal gradient. Ecol. Lett. 2012, 15, 1033–1041. [Google Scholar] [CrossRef] [PubMed]
  12. Bradford, M.A.; Berg, B.; Maynard, D.S.; Wieder, W.R.; Wood, S.A. Understanding the dominant controls on litter decomposition. J. Ecol. 2016, 104, 229–238. [Google Scholar] [CrossRef]
  13. Bradford, M.A.; Warren, R.J., II; Baldrian, P.; Crowther, T.W.; Maynard, D.S.; Oldfield, E.E.; Wieder, W.R.; Wood, S.A.; King, J.R. Climate fails to predict wood decomposition at regional scales. Nat. Clim. Chang. 2014, 4, 625–630. [Google Scholar] [CrossRef]
  14. Wardle, D.A.; Bardgett, R.D.; Klironomos, J.N.; Setälä, H.; van der Putten, W.H.; Wall, D.H. Ecological linkages between aboveground and belowground biota. Science 2004, 304, 1629–1633. [Google Scholar] [CrossRef] [PubMed]
  15. Boyero, L.; Pearson, R.G.; Gessner, M.O.; Barmuta, L.A.; Ferreira, V.; Graça, M.A.S.; Dudgeon, D.; Boulton, A.J.; Callisto, M.; Chauvet, E.; et al. A global experiment suggests climate warming will not accelerate litter decomposition in streams but might reduce carbon sequestration. Ecol. Lett. 2011, 14, 289–294. [Google Scholar] [CrossRef] [PubMed] [Green Version]
  16. García-Palacios, P.; Maestre, F.T.; Kattge, J.; Wall, D.H. Climate and litter quality differently modulate the effects of soil fauna on litter decomposition across biomes. Ecol.Lett. 2013, 16, 1045–1053. [Google Scholar] [CrossRef] [PubMed]
  17. Graça, M.A.; Ferreira, V.; Canhoto, C.; Encalada, A.C.; Guerrero-Bolaño, F.; Wantzen, K.M.; Boyero, L. A conceptual model of litter breakdown in low order streams. Int. Rev. Hydrobiol. 2015, 100, 1–12. [Google Scholar] [CrossRef]
  18. Wagener, S.M.; Oswood, M.W.; Schimel, J.P. Rivers and soils: Parallels in carbon and nutrient processing. BioScience 1998, 48, 104–108. [Google Scholar] [CrossRef]
  19. Loreau, M.; MOuquet, N.; Holt, R.D. Meta-ecosystems: A theoretical framework for a spatial ecosystem ecology. Ecol. Lett. 2003, 6, 673–679. [Google Scholar] [CrossRef]
  20. Battin, T.J.; Kaplan, L.A.; Findlay, S.; Hopkinson, C.S.; Marti, E.; Packman, A.I.; Newbold, J.D.; Sabater, F. Biophysical controls on organic carbon fluxes in fluvial networks. Nat. Geosci. 2008, 1, 95–100. [Google Scholar] [CrossRef]
  21. Battin, T.J.; Luyssaert, S.; Kaplan, L.A.; Aufdenkampe, A.K.; Richter, A.; Tranvik, L.J. The boundless carbon cycle. Nat. Geosci. 2009, 2, 598–600. [Google Scholar] [CrossRef]
  22. Gessner, M.O.; Swan, C.M.; Dang, C.K.; McKie, B.G.; Bardgett, R.D.; Wall, D.H.; Hättenschwiler, S. Diversity meets decomposition. Trends Ecol. Evol. 2010, 25, 372–380. [Google Scholar] [CrossRef] [PubMed]
  23. Wallace, J.B.; Eggert, S.L.; Meyer, J.L.; Webster, J.R. Multiple trophic levels of a forest stream linked to terrestrial litter inputs. Science 1997, 277, 102–104. [Google Scholar] [CrossRef]
  24. Chapin, F.S., III; Matson, P.A.; Vitousek, P. Principles of Terrestrial Ecosystem Ecology, 2nd ed.; Springer: New York, NY, USA, 2011. [Google Scholar]
  25. Zhu, J.; He, X.; Wu, F.; Yang, W.; Tan, B. Decomposition of abies faxoniana litter varies with freeze–thaw stages and altitudes in subalpine/alpine forests of southwest China. Scand. J. For. Res. 2012, 27, 586–596. [Google Scholar] [CrossRef]
  26. Yue, K.; Yang, W.; Peng, Y.; Zhang, C.; Huang, C.; Wu, F. Chromium, cadmium, and lead dynamics during winter foliar litter decomposition in an alpine forest river. Arct. Antarct. Alp. Res. 2016, 48, 79–91. [Google Scholar] [CrossRef]
  27. Olsson, P.Q.; Sturm, M.; Racine, C.H.; Romanovsky, V.; Liston, G.E. Five stages of the alaskan arctic cold season with ecosystem implications. Arct. Antarct. Alp. Res. 2003, 35, 74–81. [Google Scholar] [CrossRef]
  28. Yue, K.; Yang, W.; Peng, C.; Peng, Y.; Zhang, C.; Huang, C.; Tan, Y.; Wu, F. Foliar litter decomposition in an alpine forest meta-ecosystem on the eastern Tibetan plateau. Sci. Total Environ. 2016, 566–567, 279–287. [Google Scholar] [CrossRef] [PubMed]
  29. Wu, F.; Peng, C.; Zhu, J.; Zhang, J.; Tan, B.; Yang, W. Impact of freezing and thawing dynamics on foliar litter carbon release in alpine/subalpine forests along an altitudinal gradient in the eastern Tibetan plateau. Biogeosciences 2014, 11, 6471–6481. [Google Scholar]
  30. Yue, K.; Yang, W.; Peng, Y.; Zhang, C.; Huang, C.; Xu, Z.; Tan, B.; Wu, F. Dynamics of multiple metallic elements during foliar litter decomposition in an alpine forest river. Ann. For. Sci. 2016, 73, 547–557. [Google Scholar] [CrossRef]
  31. American Public Health Association; American Water Works Association; Water Environment Federation. Standard Methods for the Examination of Water and Wastewater, 22nd ed.; American Public Health Association: Washington, DC, USA, 2012. [Google Scholar]
  32. He, W.; Wu, F.; Yang, W.; Tan, B.; Zhao, Y.; Wu, Q.; He, M. Lignin degradation in foliar litter of two shrub species from the gap center to the closed canopy in an alpine fir forest. Ecosystems 2016, 19, 115–128. [Google Scholar] [CrossRef]
  33. Lovett, G.M.; Arthur, M.A.; Weathers, K.C.; Fitzhugh, R.D.; Templer, P.H. Nitrogen addition increases carbon storage in soils, but not in trees, in an eastern US deciduous forest. Ecosystems 2013, 16, 980–1001. [Google Scholar] [CrossRef]
  34. Boyero, L.; Pearson, R.G.; Hui, C.; Gessner, M.O.; Pérez, J.; Alexandrou, M.A.; Graça, M.A.; Cardinale, B.J.; Albariño, R.J.; Arunachalam, M. Biotic and abiotic variables influencing plant litter breakdown in streams: A global study. Proc. R. Soc. B 2016, 283. [Google Scholar] [CrossRef] [PubMed] [Green Version]
  35. Cotrufo, M.F.; Wallenstein, M.D.; Boot, C.M.; Denef, K.; Paul, E. The microbial efficiency-matrix stabilization (mems) framework integrates plant litter decomposition with soil organic matter stabilization: Do labile plant inputs form stable soil organic matter? Glob. Chang. Biol. 2013, 19, 988–995. [Google Scholar] [CrossRef] [PubMed]
  36. Herman, J.; Moorhead, D.; Berg, B. The relationship between rates of lignin and cellulose decay in aboveground forest litter. Soil Biol. Biochem. 2008, 40, 2620–2626. [Google Scholar] [CrossRef]
  37. Klotzbücher, T.; Kaiser, K.; Guggenberger, G.; Gatzek, C.; Kalbitz, K. A new conceptual model for the fate of lignin in decomposing plant litter. Ecology 2011, 92, 1052–1062. [Google Scholar] [CrossRef] [PubMed]
  38. Halvorson, H.M.; Scott, E.E.; Entrekin, S.A.; Evans-White, M.A.; Scott, J.T. Light and dissolved phosphorus interactively affect microbial metabolism, stoichiometry and decomposition of leaf litter. Freshw. Biol. 2016, 61, 1006–1019. [Google Scholar] [CrossRef]
  39. García-Palacios, P.; McKie, B.G.; Handa, I.T.; Frainer, A.; Hättenschwiler, S. The importance of litter traits and decomposers for litter decomposition: A comparison of aquatic and terrestrial ecosystems within and across biomes. Funct. Ecol. 2016, 30, 819–829. [Google Scholar] [CrossRef]
  40. Nakajima, T.; Asaeda, T.; Fujino, T.; Nanda, A. Leaf litter decomposition in aquatic and terrestrial realms of a second-order forested stream system. J. Freshw. Ecol. 2006, 21, 259–263. [Google Scholar] [CrossRef]
  41. Berg, B.; Kjønaas, O.; Johansson, M.-B.; Erhagen, B.; Åkerblom, S. Late stage pine litter decomposition: Relationship to litter N, Mn, and acid unhydrolyzable residue (aur) concentrations and climatic factors. For. Ecol. Manag. 2015, 358, 41–47. [Google Scholar] [CrossRef]
  42. Dalias, P.; Anderson, J.; Bottner, P.; Coûteaux, M.-M. Long-term effects of temperature on carbon mineralisation processes. Soil Biol. Biochem. 2001, 33, 1049–1057. [Google Scholar] [CrossRef]
  43. Štursová, M.; Žifčáková, L.; Leigh, M.B.; Burgess, R.; Baldrian, P. Cellulose utilization in forest litter and soil: Identification of bacterial and fungal decomposers. FEMS Microbiol. Ecol. 2012, 80, 735–746. [Google Scholar] [CrossRef] [PubMed]
Figure 1. Dynamics of remaining cellulose mass (g) in decomposing foliar litters of (a) willow; (b) azalea; (c) cypress; and (d) larch in different ecosystem types during the two-year experiment (mean ± SD, n = 9). Inserted figures are the foliar litter mass loss at the end of the two-year experiment. Different lowercase letters indicate statistically significant (p < 0.05) differences of cellulose mass among different ecosystem types at each sampling event for a specific litter species; different uppercase letters indicate significant (p < 0.05) differences of litter mass loss for a specific litter species among different ecosystem types.
Forests 07 00176 g001
Figure 2. Dynamics of cellulose concentration (%) in decomposing foliar litter of (a) willow; (b) azalea; (c) cypress; and (d) larch in different ecosystem types during the two-year experiment (mean ± SD, n = 9). Different lowercase letters indicate statistically significant (p < 0.05) differences of cellulose concentration among different decomposition periods for a given litter species in a specific type of ecosystem. IV: initial value; PP: pre-freezing period; FP: freezing period; TP: thawing period; GS: growing season; LGS: late growing season; 1: the first year; 2: the second year.
Forests 07 00176 g002
Figure 3. Dynamics of cellulose degradation rate (percent initial mass per month, %/month) in decomposing foliar litter of (a) willow; (b) azalea; (c) cypress; and (d) larch in different ecosystem types during the two-year experiment (mean ± SD, n = 9). Different lowercase letters indicate statistically significant (p < 0.05) differences of cellulose degradation rate among different decomposition periods for a given litter species in a specific type of ecosystem. IV: initial value; PP: pre-freezing period; FP: freezing period; TP: thawing period; GS: growing season; LGS: late growing season; 1: the first year; 2: the second year.
Forests 07 00176 g003
Table 1. Mean values for the characteristics of the local-scale environmental variables in the three types of studied ecosystems during the two-year experiment.
EcosystemVariable
DAT (°C)C (g/kg)N (g/kg)P (g/kg)pH
Forest floor2.0 (5.2)126 (26)5.8 (1.1)1.2 (0.2)6.6 (0.1)
DAT (°C)HCO3 (mg/L)NH4+ (mg/L)NO3 (mg/L)PO43− (μg/L)pHFV (m/s)
Stream5.1 (2.6)13.9 (1.96)0.10 (0.05)0.29 (0.07)7.85 (0.38)6.6 (0.4)0.53 (0.15)
Riparian zone4.8 (3.4)19.7 (1.33)0.04 (0.02)0.34 (0.08)7.84 (0.41)6.9 (0.3)0.05 (0.01)
DAT: daily average temperature; C: total organic carbon; N: total nitrogen; P: total phosphorus; FV: flow velocity. Values represent the means with standard deviations in parentheses across the two-year experiment (n = 90).
Table 2. Initial chemical traits of willow, azalea, cypress, and larch foliar litters.
SpeciesC (%)N (%)P (%)Lignin (%)Cellulose (%)C/NC/PN/PLignin/N
Willow34.82.64 0.17 24.7 18.613.2 20715.79.38
(0.9) c(0.15) a(0.01) a(1.3) d(0.4) c(0.8) d(20) c(1.7) a(0.84) c
Azalea38.6 0.69 0.10 29.8 19.957.2 375 6.75 44.3
(1.0) b(0.10) d(0.02) d(0.8) b(0.3) a(10.2) a(54) a(1.5) c(8.3) a
Cypress46.91.050.1528.119.045.13046.7926.9
(1.8) a(0.06) c(0.01) b(0.8) c(0.2) b(3.9) b(13) b(0.7) c(1.8) b
Larch37.51.590.1237.814.923.632013.630.1
(0.5) b(0.11) b(0.01) c(0.9) a(0.2) d(1.8) c(25) b(0.8) b(2.1) b
Values represent means with standard deviations in parentheses (n = 9). Different lowercase letters in the same column indicate significant (p < 0.05) differences among different litter species for a given variable.
Table 3. The effects of litter species, ecosystem type, decomposition period, and their interaction on cellulose degradation rate (%/month) during foliar litter decomposition which were tested by a repeated-measure general linear model.
Factord.f.F-Valuep-Value
Species323.439<0.001
Ecosystem283.765<0.001
Period91334.260<0.001
Species × ecosystem65.932<0.001
Species × period2717.349<0.001
Ecosystem × period2719.603<0.001
Species × ecosystem × period546.276<0.001
d.f.: degree of freedom.
Table 4. Regression model of the stepwise regression analysis between cellulose degradation rate (%/month) during two years and foliar litter initial chemical traits.
EcosystemRegression Model
Step 1 Step 2 Step 3 Step 4
a0a1X1R12a2X2R22a3X3R32a4X4R42
Forestŷ =2.438+8.091 P(0.687)−0.028 lignin(0.795)+0.035 N/P(0.866)
Streamŷ =−1.895+6.927 P(0.748)+0.055 N/P(0.899)+0.173 cellulose(0.922)+0.019 C(0.937)
Riparian zoneŷ =2.164+3.466 P(0.644)−0.026 lignin(0.771)+0.050 N/P(0.855)+0.021 C(0.881)
Data in parentheses represent the coefficient of determination (R2) at each step; P: total phosphorus; C: total organic carbon; N/P: nitrogen to phosphorus ratio; n = 36.
Table 5. F-values for the regression analysis between cellulose degradation rate (%/month) and local-scale environmental factors during litter decomposition in each ecosystem type across the two-year experiment.
SpeciesDATCNPpH
Forest floor
Willow(−) 14.809 ***1.316(−) 19.318 ***0.636(+) 5.923 *
Azalea(−) 10.701 **3.3013.5831.0732.196
Cypress(−) 9.890 **0.909(−) 9.663 **(−) 8.960 **2.474
Larch3.5960.464(−) 12.819 **(−) 17.690 ***3.391
DATHCO3NH4+NO3PO43−pHFV
Stream
Willow3.5510.0190.331(+) 5.567 *1.6962.1123.036
Azalea1.784(+) 10.305 **(+) 8.100 **1.8460.026(+) 10.514 **0.322
Cypress2.6380.8371.794(+) 7.335 **0.0580.0950.001
Larch1.8641.2680.4400.2270.571(+) 5.835 *0.550
Riparian zone
Willow(−) 27.150 ***3.069(−) 13.888 ***(+) 9.471 **0.3472.042(−) 14.576 ***
Azalea(−) 34.288 ***0.424(−) 12.601 **0.3561.014(+) 7.886 **2.420
Cypress(−) 16.155 ***(+) 4.815 *(−) 10.753 **3.7910.2150.082(−) 12.630 **
Larch(−) 22.839 ***0.802(−) 10.324 **1.3050.0072.010(−) 4.679 *
DAT: daily average temperature; C: soil total organic carbon; N: soil total nitrogen; P: soil total phosphorus; FV: flow velocity; significantly positive and negative correlations are indicated by (+) and (−) respectively; n = 90, * p < 0.05, ** p < 0.01, *** p < 0.001.

