Article

C Stocks in Forest Floor and Mineral Soil of Two Mediterranean Beech Forests

1
Department of Biology, Complesso Universitario di Monte Sant’Angelo, Via Cintia, 21, 80126 Napoli, Italy
2
Department of Environmental, Biological and Pharmaceutical Sciences and Technologies, Second University of Naples, Via Vivaldi, 43, 81100 Caserta, Italy
3
Department of Life Sciences, University of Parma, Via Farini, 90, 43124 Parma, Italy
*
Author to whom correspondence should be addressed.
Forests 2016, 7(8), 181; https://doi.org/10.3390/f7080181
Submission received: 19 May 2016 / Revised: 15 August 2016 / Accepted: 16 August 2016 / Published: 22 August 2016

Abstract

:
This study focuses on two Mediterranean beech forests located in northern and southern Italy and therefore subjected to different environmental conditions. The research goal was to understand C storage in the forest floor and mineral soil and the major determinants. Relative to the northern forest (NF), the southern forest (SF) was found to produce higher amounts of litterfall (4.3 vs. 2.5 Mg·ha−1) and to store less C in the forest floor (~8 vs. ~12 Mg·ha−1) but more C in the mineral soil (~148 vs. ~72 Mg·ha−1). Newly-shed litter of NF had lower P (0.4 vs. 0.6 mg·g−1) but higher N concentration (13 vs. 10 mg·g−1) than SF. Despite its lower Mn concentration (0.06 vs. 0.18 mg·g−1), SF litter produces a Mn-richer humus (0.32 vs. 0.16 mg·g−1) that is less stable. The data suggest that decomposition in the NF forest floor is limited by the shorter growing season (178 days vs. 238 days) and the higher N concentrations in newly shed litter and forest floor. Differences in C stock in the mineral soil reflect differences in ecosystem productivity and long-term organic-matter accumulation. The vertical gradient of soluble and microbial fractions in the soil profile of SF was consistent with a faster turnover of organic matter in the forest floor and greater C accumulation in mineral soil relative to NF. With reference to regional-scale estimates from Italian National Forest Inventory data, the C stock in the mineral soil and the basal area of Italian beech forests were found to be significantly related, whereas C stock in the forest floor and C stock in the mineral soil were not.

1. Introduction

Forests play a key role in mitigating climate change as they may act as carbon sinks [1]. A substantial portion of Earth biosphere carbon (C) is stored in forest aboveground and belowground biomass, dead wood and soil, the last being the major carbon stock [2]. Factors such as tree species [3,4,5] and climate [6], influence the size of the forest soil C stocks. Common beech (Fagus sylvatica L.) forests are found in Europe from temperate to mountainous Mediterranean areas with a wide range of climatic conditions and soil types, and are of utmost importance for C sequestration on a continental scale. In Italy, beech is the most common tree species and is first-rank in terms of growing stock [7]. The considerable diversity of climatic conditions and soil types in the Italian territory may result in differences in beech litter chemical composition, which in turn are likely to affect organic-matter dynamics and soil C stocks. The size of organic C stock in forest soil is the result of the balance between two main processes: the annual input of C with litter fall and C output through decomposition.
Litter decomposition primarily depends on litter chemical composition, interactions with soil biota community, and site properties [8]. Litter concentration of essential nutrients, such as nitrogen (N) and phosphorus (P), and litter stoichiometry (C: nutrient ratios) have been used as litter decay predictors. The initial litter N concentration has been found to be negatively related to the limit value, i.e., the stage at which decomposition virtually stops or proceeds very slowly, thus leading to humus accumulation and C sequestration. In Pinus litters, the limit value is positively related to initial Mn concentration, which therefore may be used to predict the accumulation of humus [9,10]. Mn is important for litter decomposition mainly because fungi use Mn peroxidase for lignin degradation [11]. The causal relationship between Mn concentration and litter decay has recently been demonstrated in a litter bag study using beech litter experimentally enriched in Mn [12]. Litter quality affects not only the rate of litter mass loss, but also nutrient dynamics. During litter decomposition, the nutrients are taken up by the microorganisms and only after microbial demand has been met is the surplus released and made available to plants. N and P releases are positively related to the initial concentration of these elements and therefore negatively related to litter C:N and C:P, respectively [13]. Climate [14,15] and site characteristics [16] may induce within-species differences in litter chemical composition and hence in litter decay and the size of soil organic C stocks. Across a wide climatic gradient, N and P concentrations of newly-shed pine needle have been found to be significantly and positively related to the mean annual temperature (MAT), while Mn concentration showed a significant negative exponential relationships with MAT [17]. The concentration of some nutrients, e.g., Mn and Ca, in litter also varies with soil pH, which influences their mobility [8]. C accumulation in soil is affected by forest age and productivity. As a parameter that integrates the number and size of trees, basal area is considered a good predictor of aboveground biomass C [18]. Accordingly, soil C in Italian forests is significantly correlated with aboveground C stocks and with basal area [4].
In the last few years, several studies have investigated size and types of soil carbon pools in beech forests of central Europe [3,19] including soluble and microbial fractions, which are both pivotal to soil organic-matter formation and accumulation [20,21,22]. Very little information is presently available for beech forests of the Mediterranean region [23], in spite of the fact that this is one of the world areas most dramatically threatened by climate change [24].
Italian beech forests are found at 900–1900 m altitude and are distributed from the Alps to Sicily across two biogeographical regions, the Central-European and the Mediterranean, separated by a boundary running along the Apennines from Northern Liguria to Southern Emilia-Romagna [25]. Mean annual temperatures are lower in the Middle-European than in the Mediterranean biogeographic region (9–13 °C vs. 14–18 °C). Beech forests cover approximately 1,000,000 hectares, are present in 20 of Italy’s 21 administrative regions and, according to the Italian National Forest Inventory (INFI), store at country-scale 195.3 Mg of carbon ha−1, of which 4.5 is in litter and 96.6 is in soil [4]. Soil C stock per hectare is higher in beech forests in the Mediterranean than in the Central-European biogeographic region (about 115 vs. 80 Mg·ha−1) [26]. Estimates of regional C stocks in Italian beech forests are in the range of 2.1–9.3 Mg·ha−1 for litter, 1.2–26.5 Mg·ha−1 for organic horizons, and 29.5–171.6 Mg·ha−1 for mineral soil up to the fixed 30-cm depth. Such large ranges are likely to reflect major environmental constraints over forest productivity, litter quality, litter decomposition and C accumulation in soil.
This paper presents a detailed study of soil C and N stocks, soluble C and N fractions, and the microbial-biomass C fractions in the forest floor-mineral soil continuum of two beech forests with relevant differences in climatic and edaphic conditions, located in northern and southern Apennines (Italy), respectively. We also focused on the amount of litterfall and its N, P and Mn contents. Nitrogen and P are the most common limiting nutrients in forest ecosystems, [8]. Phosphorus mainly affects the early phase of litter decomposition, which is dominated by fast-growing microorganisms with high demands for P [27]. Nitrogen and Mn are known to control late-stages of litter decomposition [8,12] and may contribute to regulate the primary sequestration of C in the organic layer [28]. The primary goal of our work was to understand C storage at the short and long time scale in a northern and a southern Italian beech forest; thus, we investigated differences between the two forests for C and N stocks in forest floor and in the mineral soil and the putative major drivers of litter decomposition and organic-matter dynamics. A second goal was to compare the results of our study with the pattern, if any, of C distribution in the organic layers and mineral soil of beech forests of the whole Italian territory and their relationship with basal area. To do this, we used the regional-scale estimates reported by INFI.

2. Materials and Methods

2.1. Study Sites

The two study sites had similar stand age and management history. They were located in mountain areas of high environmental relevance: (a) “Guadine Pradaccio” Biogenetic Natural Reserve (Corniglio, PR, Italy) on Tosco-Emiliano Apennines (henceforth referred to as northern forest, NF) and (b) Laceno, an internal part of Regional Natural Reserve of Monti Picentini (Bagnoli Irpino, AV, Italy), Campania Apennines (henceforth referred to as southern forest, SF). The study sites, with a surface area of about 3000 m2, were covered by 75-year-old coppiced beech trees (Fagus sylvatica L.) and had never been affected by fire, grazing or clear-cutting during this time span (information provided by the staff of the two Natural Reserves and Author’s check of charcoal remains). Basal area (BA; m2 ha−1), defined as the sum of cross-sectional areas at breast height (1.3 m) of all trees in a stand, was obtained by measuring the stem diameter at breast height (DBH) on the trees standing in 10 plots of 100 m2 each.
The soil was an Umbric Leptosols in NF and a Haplic Andosol in SF (FAO Soil Classification System).
Data about climatic conditions were obtained from the Meteorological Station of Lagdei (Pradaccio) for NF and the Meteorological Station of Piano Laceno for SF. Temperature data were adjusted for altitude relative to the location of meteorological stations. The length of the growing season was calculated as growing degree days (GDD) i.e., the number of days with minimum temperature over 5 °C [29].

2.2. Litter Fall Collection

Litter fall from trees was collected in two consecutive years (2010 and 2011) using 9 circular litter traps, each with a sampling area of 0.5 m2, placed under the canopy at about 1 m above the ground. The collector was a loosely-hanging polyester net with a mesh size of 5 mm × 8 mm. This method underestimates certain litter fractions such as large branches and bark [30]. Litter collection was carried out every two weeks during the period of litter fall. The litter was dried at 75 °C until constant weight and weighed in order to calculate the annual litter input per unit area. Samples of the leaf fraction collected in the traps (newly-shed leaves) were used to determine the litter chemical composition as described below.

2.3. Forest Floor Litter and Mineral Soil Sampling

Samples of the forest floor litter and underlying mineral soil were collected in autumn 2010 at the peak of litter fall and in Spring 2011 with the recovery of vegetative growth so to include temporal variations of the investigated parameters. Litter and soil were sampled in six plots randomly selected within the study areas and spaced at least 10 m apart from each other in order to avoid spatial autocorrelation [31]. In each plot, forest floor litter was collected using a 20 cm × 20 cm steel frame. The litter from the OL layer, consisting of plant residues easily discernible by naked eye, was manually separated from strongly fragmented and amorphous material belonging to the OF + OH layer. The samples of OL and OF + OH layers were weighed and dried at 75 °C to constant weight.
In each sampling plot, the soil underlying the forest floor was collected by means of a steel core, 4.8 cm in diameter, from the 0 to 40 cm layer; the soil cores were divided into four sections, 0–5, 6–15, 16–30 and 31–40 cm, that were processed separately for chemical analyses after sieving through a 2-mm mesh.
Fresh samples of forest floor and mineral soil layers were stored at 4 °C and used within 24 h to determine fungal biomass, microbial biomass and potential mineralization.

2.4. Litter and Soil Analyses

Litter and soil pH was measured by the potentiometric method in distilled water (1.0/2.5, litter or soil/water). The water content was measured gravimetrically by oven-drying of samples at 75 °C to constant weight. Cation Exchange Capacity (CEC) was determined on the fine fraction according to the protocol by Ministero delle Politiche Agricole e Forestali, Milan, Italy, 2000 [32]. Soil texture was determined measuring particle size distribution by gravitational liquid sedimentation using a fixed position pipette apparatus (protocol by Ministero delle Politiche Agricole e Forestali) [32].
The chemical composition of litter and mineral soil was determined on oven-dried (75 °C) samples powdered by a Fritsch Pulverisette (type 00.502, Oberstein, Germany) equipped with agate mortar and ball mill. The organic matter concentration (OM) was determined as difference between the residual and the initial mass of the sample after heating at 550 °C for 2 h. Organic C and N were determined by gas chromatography (CNS analyzer—Thermo Finnigan, Flash 112 Series EA Strumentazione, Milan, Italy). Water-soluble organic matter was extracted from the litter and mineral soil according to Garcìa et al. (modified) [33]. Oven-dried samples (0.5 g for litter and 20 g for soil) were soaked in distilled water (70 mL and 200 mL respectively) and incubated for 24 h under stirring (Universal Table-Shaker 709, 130 rpm) with two sonications. The water extracts were centrifuged at 5000 rpm for 15 min and filtered (Whatman Ø 15µm). The concentrations of soluble C and N were evaluated by gas chromatography (CNS analyzer—Thermo Finnigan, Flash 112 Series EA Strumentazione, Milan, Italy) after lyophilisation of water extracts.
To calculate the size of C and N stocks in each layer (OL and OF + OH) of the forest floor, C and N content per gram of sample was multiplied by the mass of material per unit area. As the whole mass of material had been dried at room temperature, a correction factor for converting air dried to water-free dry mass was calculated using subsamples dried to constant weight at 75 °C. The stocks of C and N in mineral soil were calculated from C and N content per gram of sample multiplied by the bulk density of the corresponding soil layer. Bulk density was calculated as mass/volume after drying at 75 °C samples collected with a corer of known volume.
Mn and P concentrations were determined after dry mineralization in a muffle furnace at 480 °C for 16 h. Ashes were rehydrated with 1 mL 1:3 HNO3 diluted with 9 mL double-distilled water, filtered and then analyzed by inductively-coupled plasma atomic emission spectrometry (ICP-AES) without ultrasonic nebulization [34].

2.5. Determination of Active Fungal Mycelium, Microbial C and Potential Mineralization

The hyphal length of microfungi in forest floor and mineral soil was determined by the intersection method of Olson [35]. Each sample (1 g) was suspended in 100 mL of 60 mM phosphate buffer at pH 7.5 and homogenized at 6000 rpm for 2 min. Aliquots (0.5 mL) of suspension were collected and filtered under vacuum on nitrocellulose filter with a pore size of 0.45 μm. Membrane filters were prepared according to Sundman and Sivelä [36] and treated with a fluorescein diacetate solution to detect active fungal mycelium. The values were reported as mg dry fungal biomass g−1 organic matter, assuming an average hyphal cross section of 9.3 μm2, a density of 1.1 g·mL−1 and a dry mass of 15% [37]. Fungal C was calculated from active-mycelium mass on the basis of mean fungal values of C/N ratio [38] and N content [39]. Microbial carbon (Cmic) was evaluated by the method of substrate-induced respiration (SIR) according to Anderson and Domsch [40] based on the measurement of CO2 evolution from litter/soil (25 °C, 55% of water-holding capacity) in response to addition of glucose, an easily mineralizable substrate. The magnitude of respiratory response was converted to mg of microbial biomass carbon using the conversion factor introduced by Sparling [41]. Potential mineralization of litter and soil samples was estimated as CO2 evolution after adding 3 mL distilled water to 3 g of sample [42]. CO2 evolution was measured after incubation (25 °C, 55% of water-holding capacity) in tight containers for 10 days by NaOH trapping followed by two-phase titration with HCl [43].

2.6. Statistics

Differences between sites for chemical composition of newly-shed leaves and for C stocks were assessed by t-test (overall significance level = 0.05). Two-way ANOVA was applied to get a distinct view of the influence of site and season on the variability of soluble fractions and microbial parameters. Pairwise multiple comparisons were performed by means of the post-hoc Holm-Šídák method (overall significance level = 0.05). Simple linear regression analyses were performed to evaluate relationships among C stocks of organic and mineral layers and basal area of Italian beech forests using regional scale estimates from the Italian NFI (National Inventory of Forests and forest Carbon pools—INFC). Such data are available on the website “inventarioforestale.org”. Data were checked for normality and heteroscedasticity and when necessary log-transformed.
The statistical analyses were performed using Systat_SigmaPlot_12.2 software (Jandel Scientific, San Jose, CA, USA).

3. Results

3.1. Site Features

The two sites differed for mean annual temperature as well as for mean temperature of the coldest and the warmest month, that were both lower at the northern site (Table 1). The length of the growing season was 178 and 238 days for the northern and southern site, respectively (Table 1). As expected, soil pH was higher on the southern site which coincided with the larger cation exchange capacity (CEC; Table 1).

3.2. Stand Features

The basal area (BA) in the northern forest was 75% of the value measured for the southern forest; the tree density was higher and mean diameter at breast height was smaller in the northern forest (Table 2).
In line with lower BA values, the annual litter input to the ground in the northern forest was only 58% that of the southern forest. In both cases, the leaves accounted for nearly 90% of the whole litter mass reaching the forest floor (Table 2). In contrast, the mass of forest floor litter was quite similar in the southern and the northern forests, i.e., 21.18 vs. 23.89 Mg·ha−1 (Table 2). The ratio organic-matter stock to organic-matter input was 4.9 and 9.6, respectively, in the southern and northern forest (Table 2).

3.3. Nutrients

Newly-shed leaves from the southern forest had higher P content but were poorer in N and Mn relative to the northern forest, with mean concentrations differing by a factor of 1.6, 1.3 and 2.3, respectively, for P, N, and Mn (Table 2, Figure 1).
Forest floor in the southern forest had higher P and lower N concentrations relative to the northern counterpart (Figure 1). In both forests, the N content increased whereas the P content decreased from the OL to OF + OH layer, i.e., with progressing litter decay (Figure 1). Different patterns of variation of Mn concentration were found in the two forests. In the southern forest, Mn concentration increased 5 times from newly-shed leaves, through the OL to the OF + OH layer, whereas it remained virtually unchanged in the northern forest (Figure 2). C/nutrient ratio was higher in the northern site, with the exception of C/N that was higher in the southern site (Table 2). In the southern forest, N and P fluxes with litterfall (leaf litter mass × litter nutrient concentration) were larger (factors 1.3 and 2.7, respectively) whereas Mn return was smaller (factor 0.7) (Table 2). Mineral soil of the southern forest had higher pH, CEC, N and P concentrations, and lower C/nutrient ratios, whereas the OM and water content were similar in the two forests (Table 1).
In both sites, C and N concentrations typically declined with soil depth (Figure 1). In contrast with forest floor, soil N concentration was higher at the southern site (Table 1 and Table 2; Figure 1). As expected, the C/N ratio declined with depth in both sites (Supplementary Materials Figure S1).

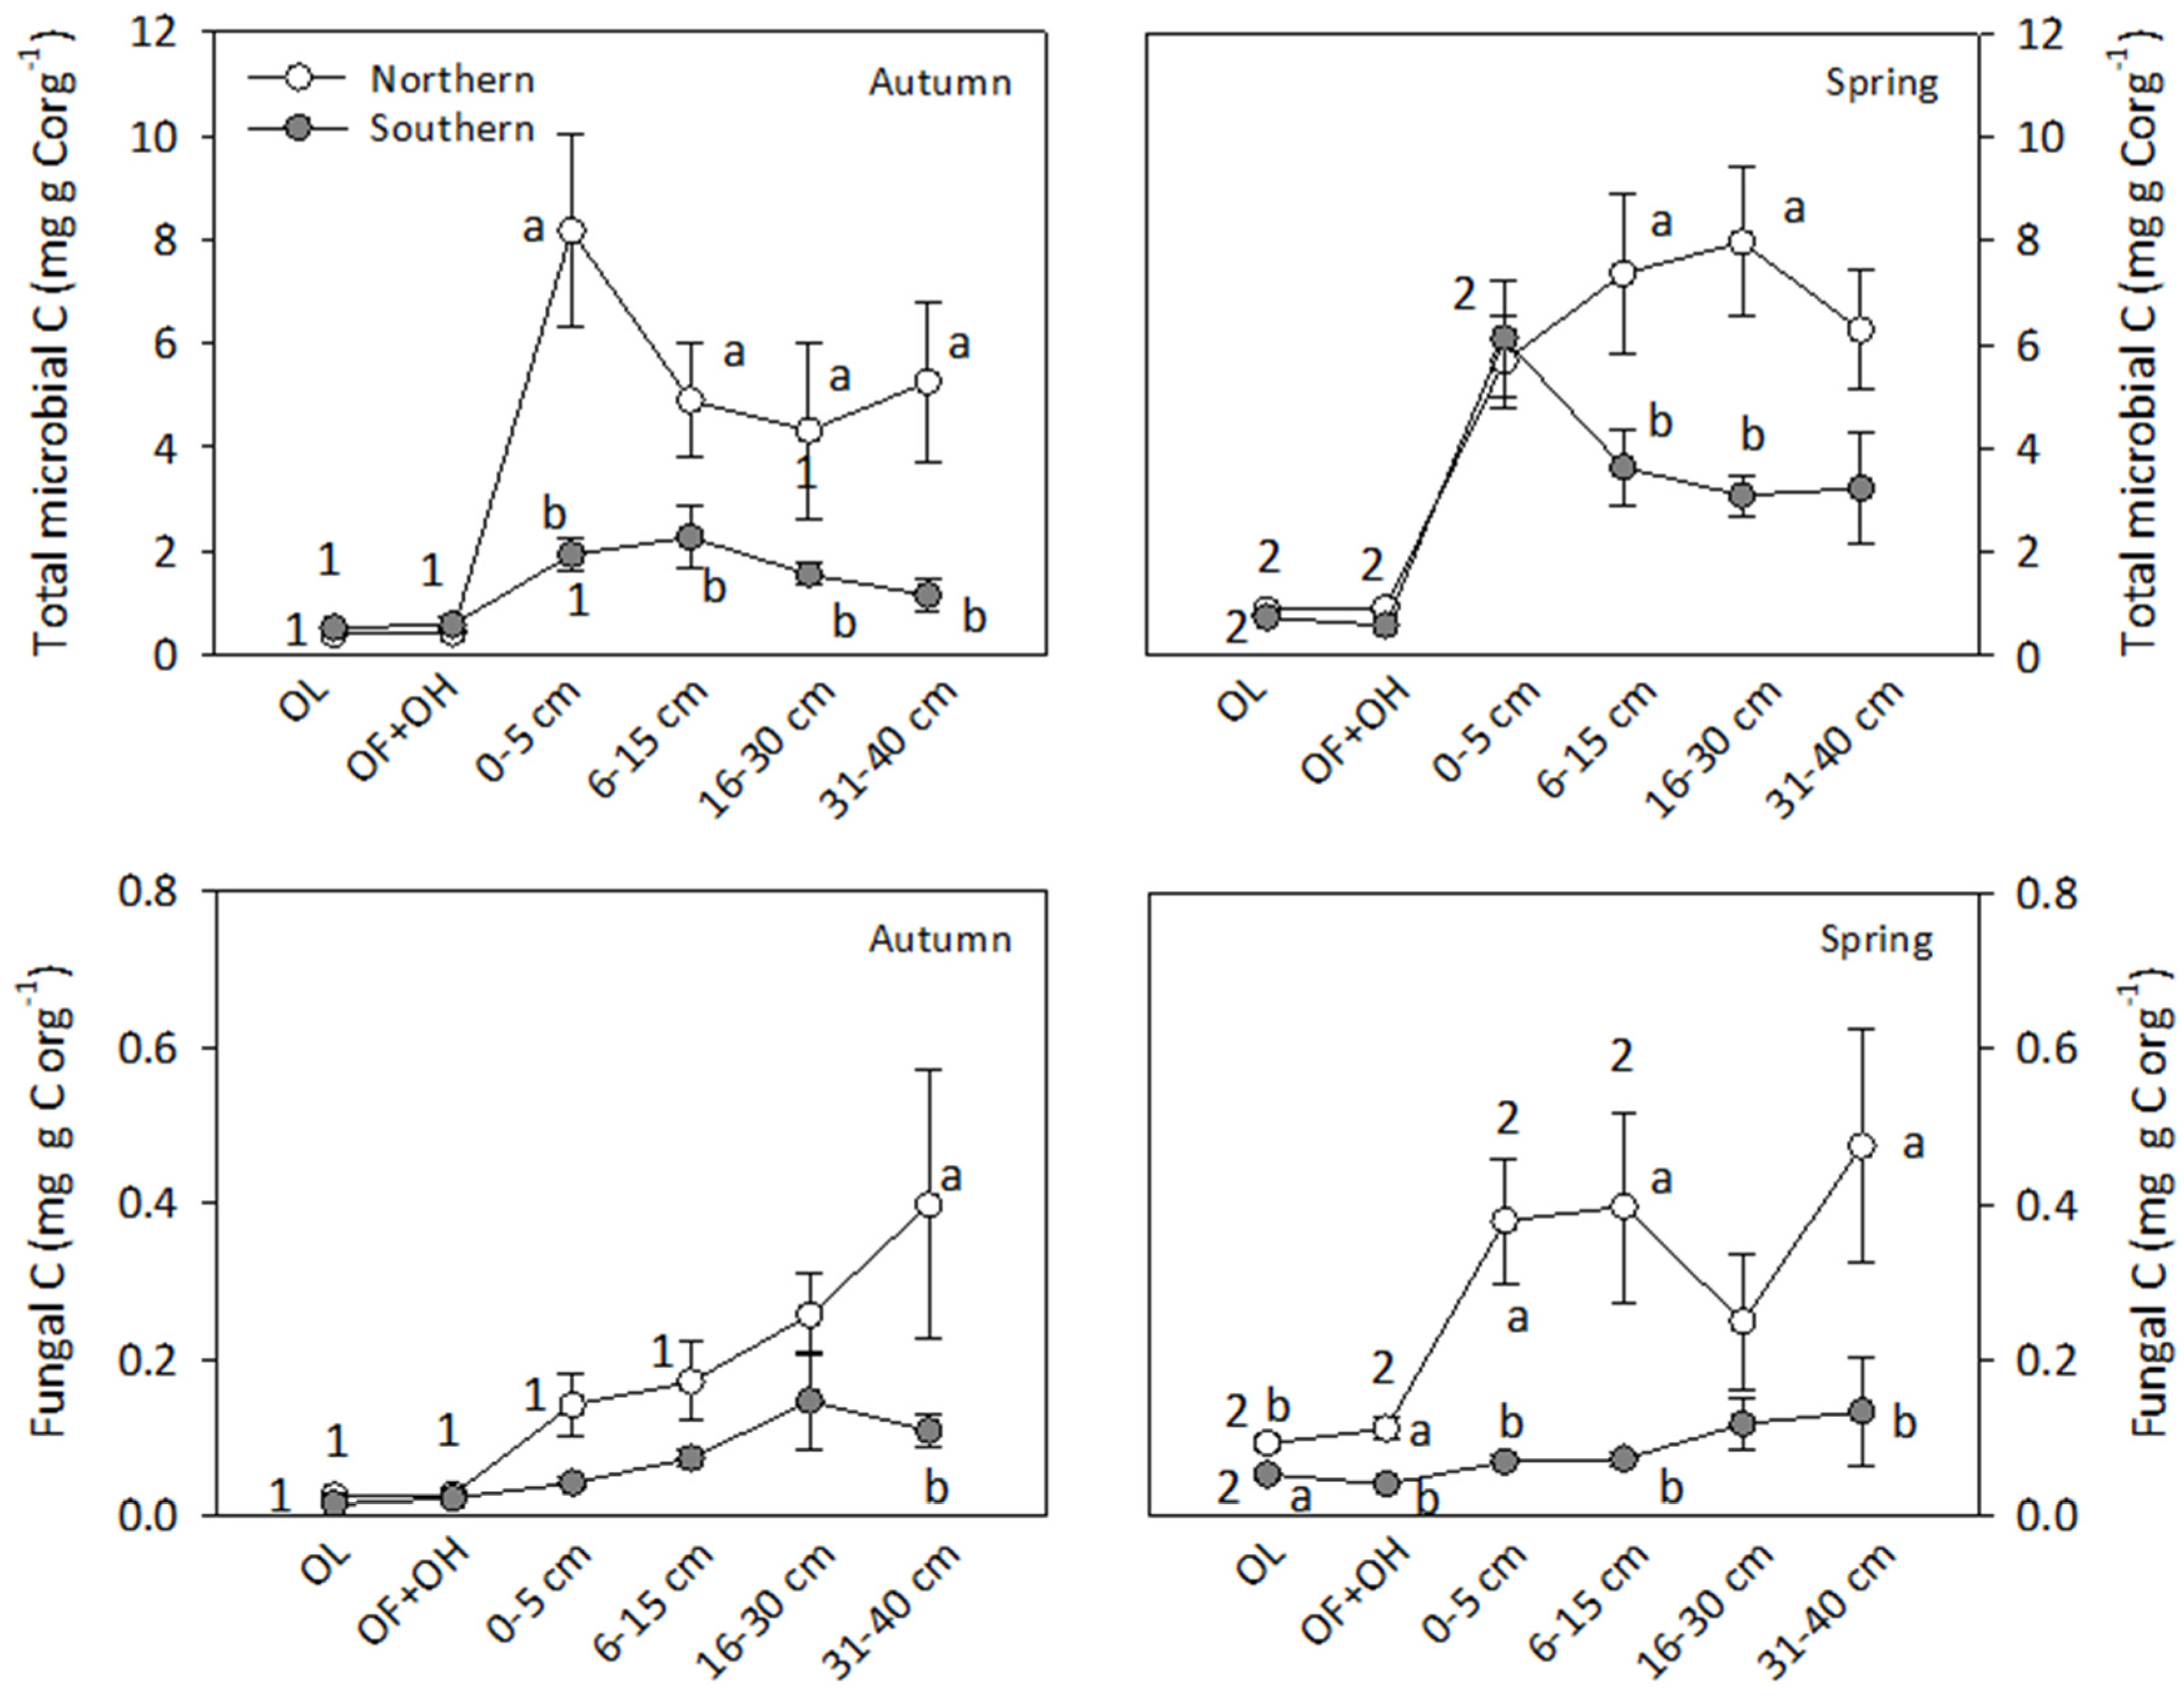
3.4. Stocks of Organic C and N, Water Soluble C and N, Microbial and Fungal C

The organic C and N pools in the forest floor of SF were smaller than in the northern forest (Figure 3 and Figure 4, and Table 2).
Although C and N concentrations in mineral soil were lower than in forest floor (Figure 1), the mineral soil stored much larger absolute amounts of C and N (Figure 3 and Figure 4) due to its greater thickness. The organic C stock in the 0–40 cm mineral layer was one order of magnitude higher than in forest floor (Figure 4). In contrast with the pattern observed for forest floor, the stocks of C and N in the mineral soil were higher in the southern forest (Figure 3 and Figure 4).
The concentrations of water-soluble C and N per gram litter/soil were one order of magnitude higher in the forest floor than in the mineral soil (Supplementary Materials Figure S2). When expressed as a fraction of total C and N, however, water-soluble C and N in the forest floor and in the mineral soil had more similar values (Figure 5). The soluble fractions of C and N in forest floor were higher in SF than in NF, with the exception of soluble N fraction in spring (Figure 5). In contrast, the fractions of water-soluble C and N in mineral soil were higher in NF than in SF (Figure 5). In both forests the soluble fractions increased from OL to OF + OH in the forest floor and from the 0 to 5 cm layer to deeper layers in mineral soil (Figure 5). Significant differences between seasons for soluble C fraction were found only in the mineral soil of NF. The soluble N fraction was significantly higher in spring than in autumn both in forest floor and in mineral soil of the northern forest. In the forest floor of SF, soluble N decreased significantly from autumn to spring, while in mineral soil no significant change was observed.
Similar concentrations of microbial and fungal C (Supplementary Materials Figure S3) were found in forest floor and in mineral soil, with a peak in the top mineral layer (0–5 cm). In contrast, when expressed as a fraction of total organic C, both fungal and microbial C significantly increased from forest floor to mineral soil at both sites; fungal and microbial C fractions of forest floor and top mineral layers significantly increased from autumn to spring at both sites (Figure 6). Differences between sites were recorded only for the mineral soil, which in the northern forest had higher amounts of microbial and fungal C relative to the southern counterpart (Figure 6). However, fungal C increased significantly from autumn to spring in the forest floor and in the top mineral soil of NF; in spring fungal C in the forest floor was higher in NF than in SF (Figure 6).
Potential mineralization was similar in the two forests and declined from forest floor to mineral soil (Figure 7). The metabolic quotient was always slightly lower in spring than in autumn and a significant difference was found in autumn between the two forests in mineral soil (Figure 7).

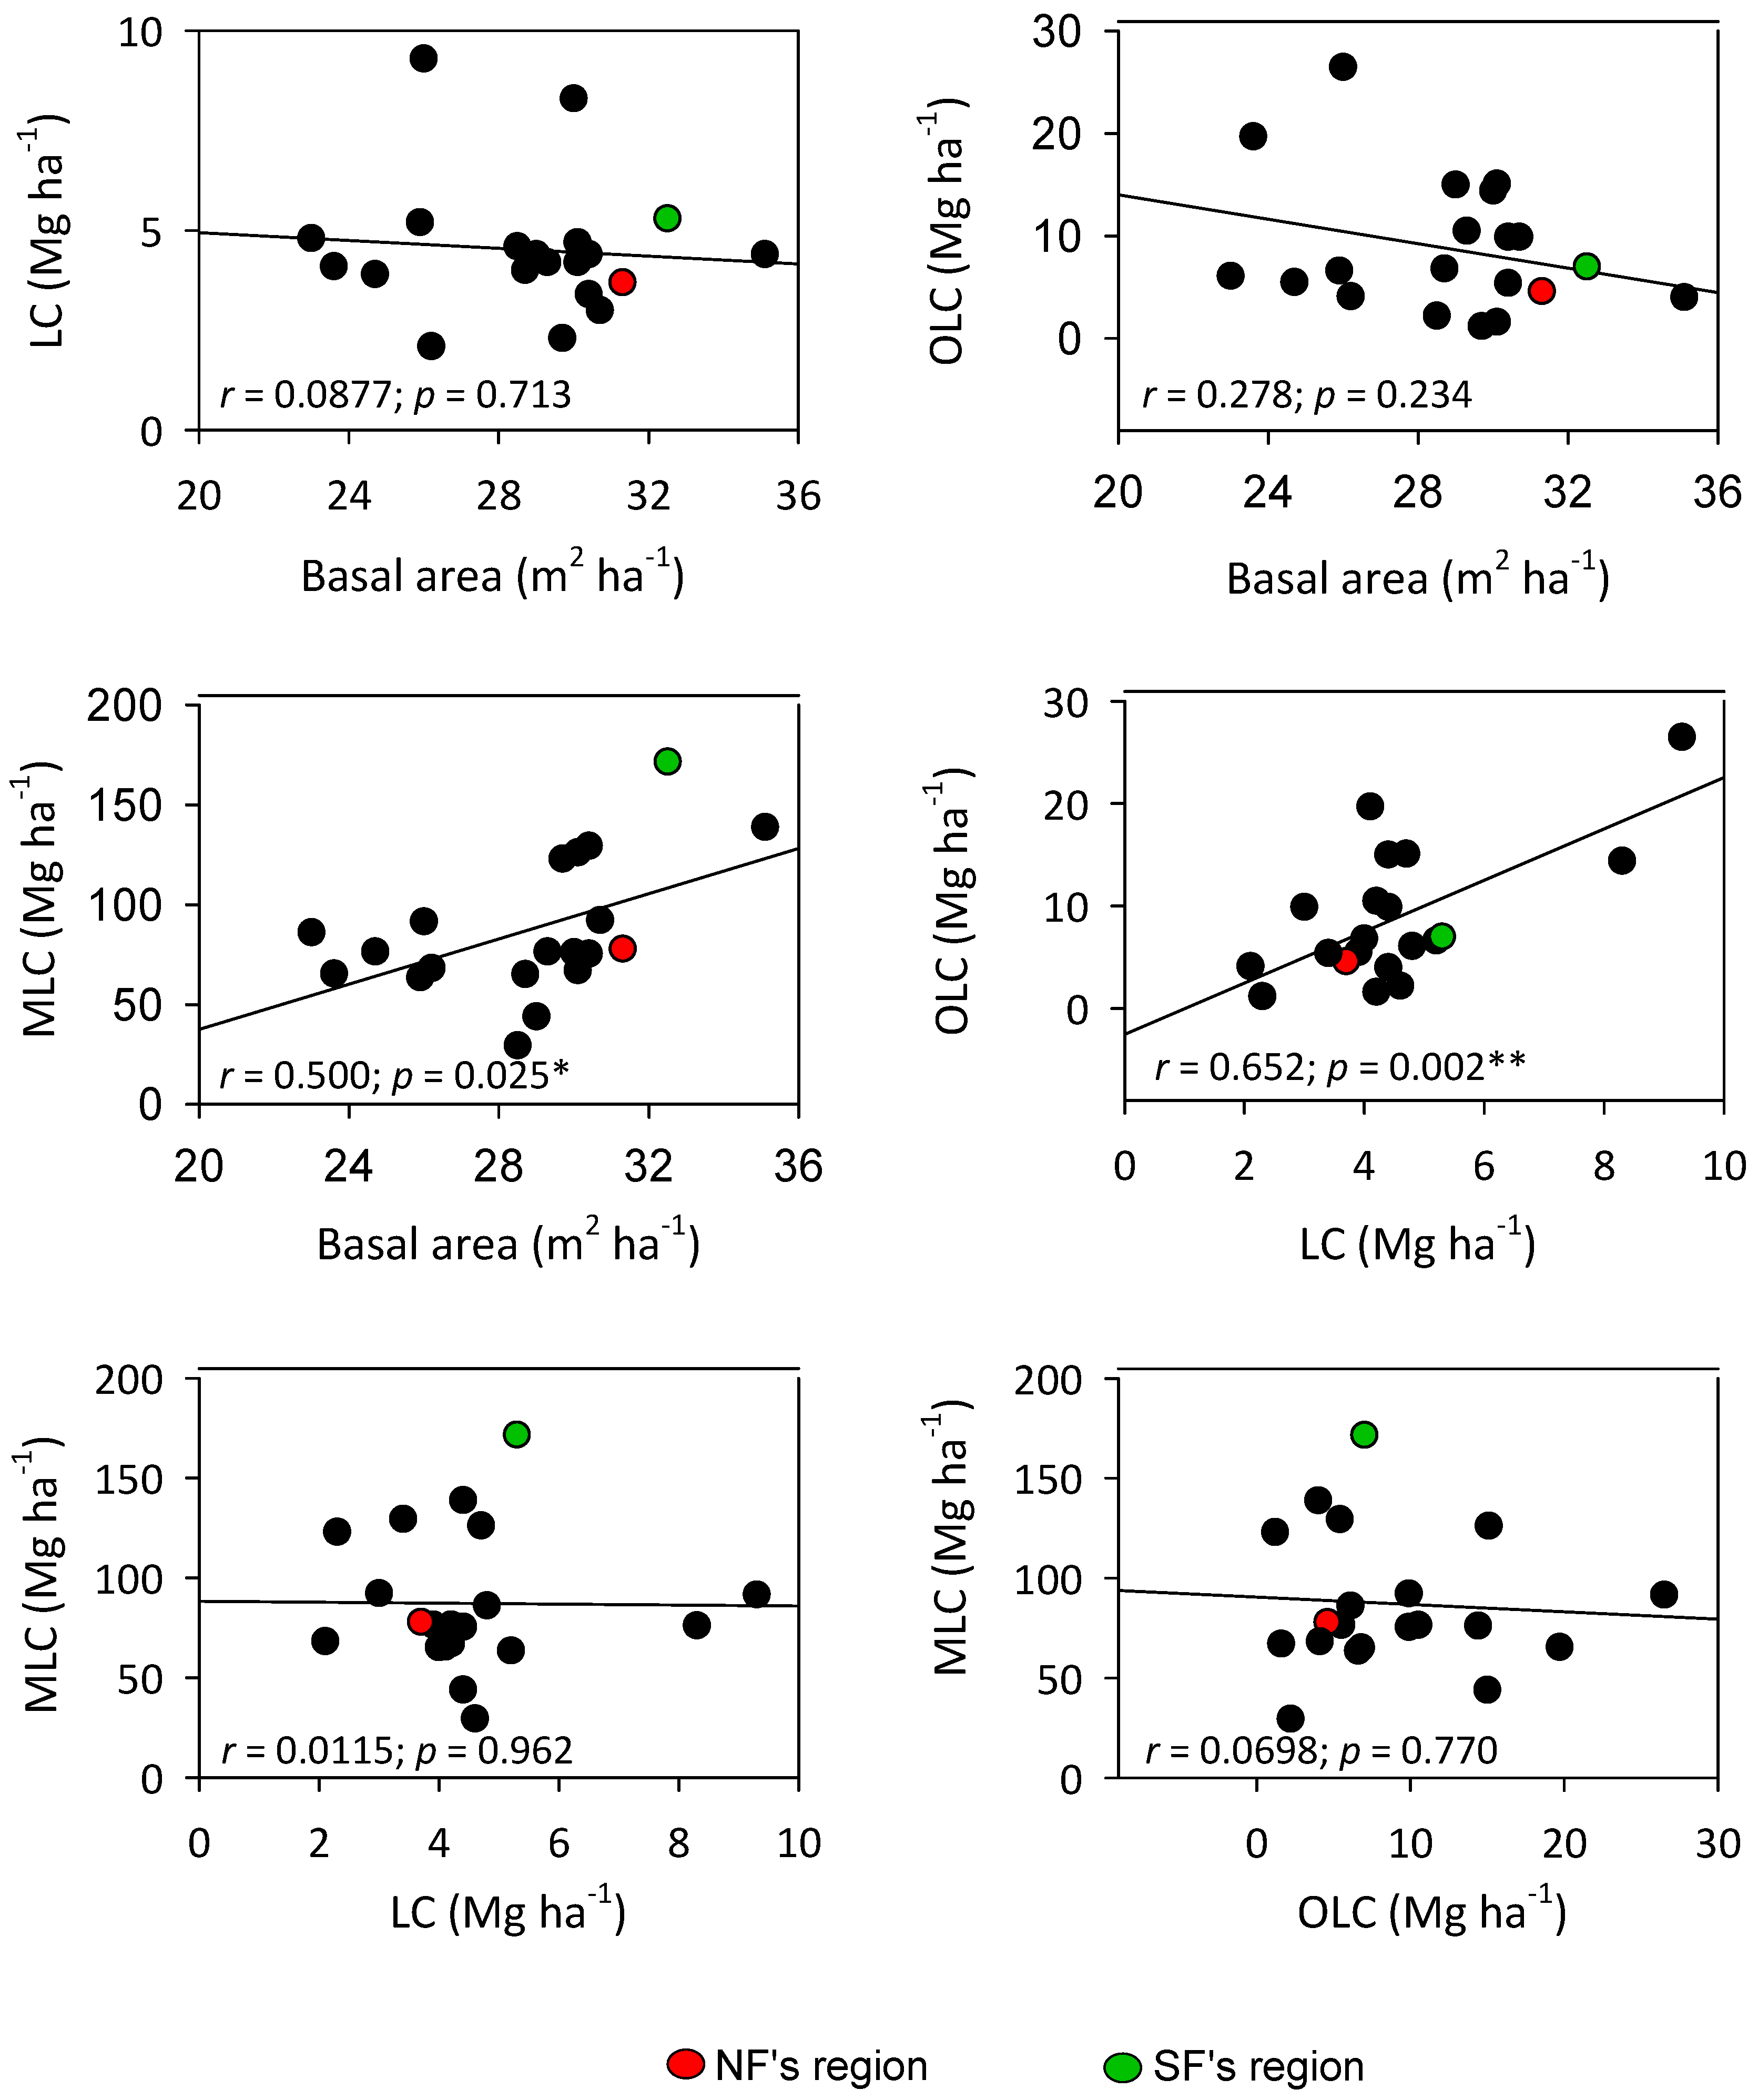
3.5. Distribution of C Stocks and Relationships with Basal Area in Italian Beech Forests (INFI Data)

We used data from the INFI to assess relationships between BA and C stocks in forest floor and mineral soil, and between forest floor C stock and mineral-soil C stock in Italian beech forests. The results (Figure 8) indicate that the mineral-soil C stock is significantly correlated with BA, whereas there is no significant correlation between litter and/or organic layer C stocks and BA, or between litter and/or organic layer and mineral-soil C stocks.
The C stock amounts measured in the present study were all at the top of the range for Italian beech forests (Figure 4 and Figure 8).

4. Discussion

4.1. Basal Area, Litterfall and C and N Stocks

The differences observed in the present study between two natural beech forests of similar age, but growing under different climatic and soil conditions, provide useful clues into the role and relative importance of major biotic and abiotic determinants of C and N accumulation in soil [3,9,10,13,17].
Major differences were found in the basal area, a proxy of aboveground biomass C and in the amount of annual litterfall, a general proxy of primary productivity. Both BA and annual litterfall were higher in SF than in NF (Table 2).
Aboveground biomass C generally shows a non-linear relationship with BA. In two oak-pine forests with similar BA, more biomass C was found in the forest with higher trees [44]. In this study, the higher density and smaller sizes of trees in NF gave a lower BA value than in SF, possibly implying lower values of aboveground biomass C. Recent work [45] has produced quantitative evidence that crowding increases competition between beech trees and that this effect is enhanced by lower resource availability and higher abiotic stress. CEC values (Table 1) are suggestive of lower nutrient availability in NF. Moreover, the lower number of growing days (178 vs. 238; Table 1) likely reduces the forest stem diameter growth and consequently also the productivity and C stock of aboveground biomass. Relationships between the length of the growing season and productivity are well established [46]. In the present study, forest productivity was inferred from annual litterfall. Most likely, this was an underestimation, as belowground litter should also have been considered. Indeed, according to Vogt et al. [47] and Rasse et al. [48], root litter contribution to soil C pool is equivalent to C input from foliar litter.
Based on the higher litter input measured in SF (Table 2), we anticipated higher C and N stocks in this site. The results were consistent with expectations for the mineral soil but were quite the reverse as for the pattern of C and N accumulation in the forest floor (Figure 4). As emphasized by Berg et al. [28], C sequestration into the organic layers (primary sequestration) and mineral soil (secondary sequestration) are two distinct processes, the former based on foliar litter fall and the latter mainly depending on root litter and on material leached from the organic layers.
Despite a lower annual litter fall, in NF, C stock in forest floor was higher than in the southern counterpart (Figure 4). Moreover the ratio organic-matter stock to organic-matter input from annual litter fall, an indicator of organic-matter turnover [49], was about two times higher in the NF (Table 2). This indicates that a relatively higher residual mass of the incoming organic matter is accumulated in the organic layer of the northern forest, a behavior probably dependent on harsher climatic conditions, notably a longer and colder winter season. The temperature exerts a paramount role in the control of ecosystem processes and it has been shown that organic-matter decomposition may be predicted from models incorporating the degree day concept [50]. Furthermore, the fact that lower temperature impairs decomposition more than photosynthesis may contribute to enhancing C accumulation under colder climates [51].

4.2. Nutrients

Differences in litter nutrient concentration have a relevant role in C sequestration. Compared to the SF, newly-shed leaves in NF had lower P but higher N and Mn concentration (Table 2). As N concentration in soil (Table 1) and N return with litterfall (Table 2) were lower in NF, the higher N content of newly-shed leaves and forest floor in NF is likely to reflect the larger atmospheric deposition relative to the southern Apennines [52]. High N concentration in litter favors the formation of stable complexes that slow down decomposition at late stages [9,53,54,55,56]. Michel and Matzner [57] found that respiration of samples from Oa layers of 15 different forest floors under Norway spruce decreased significantly with increasing N content under standardized laboratory conditions. In line with these reports, our data suggest that slowing down of litter decomposition due to high N content may be a major driver of C accumulation in the NF forest floor.
Mn is an important factor in litter decomposition, as fungi use Mn-peroxidase for lignin degradation [11]. Mn concentration in litter depends on tree species, soil richness and pH, and for pine species it has been found to be negatively related to site climate, especially MAT [58]. In the present study, higher Mn concentrations in the northern litter could be related to the acidic soil pH in the northern forest, as Mn mobility is enhanced by low pH [8]. A litter bag study using beech litter experimentally enriched in Mn [12] has demonstrated that beech litter decomposition is controlled by Mn concentration. Mn concentration was over two times lower in newly-shed litter of SF compared to NF (Figure 2) and this may limit decomposition. Our data show that Mn concentration in the southern site progressively increased from newly-shed litter to the OL and then to the OF + OH layer, where it attained a level twice as high as in the northern site, thus likely offsetting possible Mn constraints on decomposition. Our results are consistent with a former litter bag study in the same sites, showing an increase in the absolute amount of Mn during litter decomposition in the southern site [59] and with the report of a strong Mn increase from L1 to F1 layer of the decomposition-continuum in an acidic beech forest [60]. This indicates that in the southern forest Mn can be effectively immobilized during litter decomposition, possibly by a microbial community adapted to low Mn concentrations. We have no information on Mn availability to trees but it is possible that Mn immobilization in the organic layers of the southern forest reduces Mn availability to trees, which in turn would account for the lower Mn content of newly-shed leaf litter and the lower flux into the soil with litter fall (Table 2). Considering the importance of Mn for photosynthesis [61], an alternative explanation for the lower Mn content of newly-shed SF leaves could be in more efficient Mn resorption (i.e., the percentage of the foliar nutrient pool withdrawn before leaf abscission) in SF beech trees. The overall picture, therefore, would be a Mn-conserving strategy in the forest floor controlled by the microbial community working in parallel with a Mn-conserving strategy in the above ground-biomass controlled by the plants.
Interestingly, it has been reported [58] that higher Mn concentration in a humus layer decreases its stability and results in a lower amount of stored C. The lower stability of the organic layers in SF than in NF is consistent with the higher C soluble fraction, the lower C stock (despite the higher litterfall) and the lower ratio of litter stock in forest floor to litter input.
Phosphorus concentration was higher throughout the profile from forest floor to the deepest layer of mineral soil in the southern forest but the pattern of change with depth, i.e., a top-to-bottom decrease, was similar in the two forests (Figure 1). Most likely P concentrations in the observed range are not limiting in either forest. Besides modulating the rate and extent of microbial growth in terrestrial systems [62], litter P concentration also influences the microbial community structure. It has been found that the fungi account for a higher proportion of litter microbial community under low P concentration, possibly due to their lower P requirements relative to bacteria [63,64]. The higher proportion of fungal C detected in the northern site is consistent with this finding, although this may also depend on the more acidic soil pH, which is known to favor fungal growth [65].

4.3. Soluble and Microbial C Fractions

Water-soluble organic C and N originate from a variety of sources including plant litter, root exudates, microbial biomass and soil humus [66]. The degradation of water-soluble organic matter produces precursors for microbial metabolism or, alternatively, may lead to complete mineralization [67].
In temperate forest ecosystems, changes in resource availability (e.g., root exudates, nutrient uptake by plants during the growing period and litterfall in autumn) and in soil temperature and humidity control microbial activity and hence they affect the dynamics of organic matter. Our samplings in autumn, after litterfall and in spring at the recovery of plant growth, aimed at detecting changes in microbial activity associated with changes in resource availability and temperature in the two forest sites. Consistent with the notion that litter decomposition in the forest floor is the major source of soluble organic matter [68], in both forests the concentrations of soluble C and N were high in the forest floor and very low in the mineral layers where fresh-C inputs are smaller in comparison to the forest floor (Figure S2).
The vertical gradients in the soil profile of soluble C and N as a fraction of organic carbon (Figure 5) show a contrasting pattern between forest floor and mineral soil of NF and SF. Soluble C and N fractions in forest floor were higher in SF with the only exception of soluble N that in spring was higher in NF, possibly depending on lower N uptake by trees due to late recovery of vegetative growth. The differences between NF and SF for the size of soluble C fraction in forest floor reflect the higher amount of leaf litter that enters the soil and probably the greater abundance of root exudates in SF. Moreover, the higher proportions of soluble C and N fractions coincide with the faster turnover of organic matter in the forest floor of the southern forest (Figure 4 and Figure 5).
In contrast with the forest floor, the mineral soil of NF had higher soluble C and N fractions than SF. In mineral layers, a large proportion of soil organic C is stabilized by interaction with mineral surfaces and only small amounts of organic C are easily accessible for microorganisms [69,70,71]. It is worth noting that the soil of SF originated from volcanic ashes. This type of soil is known to preserve organic matter by chemical interactions with non-crystalline inorganic material and physical protection by micro-aggregation [72]. Lower fractions of soluble C and N in the mineral soil of SF (Figure 5) were associated with lower fractions of total microbial C and fungal C (Figure 6) and a higher metabolic quotient (Figure 7). The higher metabolic quotient reflects a less efficient use of organic substrate by the microbial biomass [73] suggesting that microorganisms degrade more stable soil organic matter to obtain new available substrates.
The increase from autumn to spring of soluble C and microbial C fractions down to the whole profile of NF but not of SF suggests a tight control of environmental factors. A previous litterbag-study [59] has showed that, in the field, northern beech litter decomposed more slowly than southern beech litter; however, under stable conditions in microcosms, this trend reversed. More rigid temperatures (mean temperature of the autumn–winter period: 0.7 vs. 3.7 in the southern forest) and freezing prevent decomposition in the northern forest while decomposition in the southern forest slows down but does not stop during the winter months [59]. The differences observed in the present study between autumn and spring data for soluble and microbial C fractions are consistent with the results of Innangi et al. [59], and point to a remarkable sensitivity to temperature of microbial processes in the northern forest.
Unlike the decline of microbial presence with soil depth reported by other authors [74,75], we found similar concentrations of total microbial C and fungal C down through soil profile both in NF and SF (Figure S3), with the exception of peaks in the forest floor or in the top mineral soil . Abiotic factors, primarily microclimatic conditions, structure of the substrate (litter at various stages of decomposition/soil) and associated features (pH, water content, nutrient concentrations, soluble C and N fractions) sharply change from forest floor to mineral soil (Table 1 and Table 2). Thus, the even distribution of total microbial C and fungal C concentrations in the profile suggests a shift from microbial populations adapted to more variable microclimatic conditions and preferably using labile carbon forms, to microbial populations adapted to more stable and temperate conditions and capable of using higher proportions of stable carbon.

4.4. Comparison of C Stocks in NF and SF with Regional Estimates of C Stocks from National Forest Inventory

Our results highlight the need for further studies of beech forests under a large range of climatic and edaphic conditions in order to derive a comprehensive model of C storage through the soil profile and of its main controlling factors.
The analysis of INFI data has helped to identify the pattern of relationships between C stocks in organic layers and C stocks in mineral layers as well as the pattern of relationships between BA and C stocks in soil. INFI data refer to the whole Italian territory covered by beech forests, i.e., 1,000,000 hectares distributed from the Alps to Sicily across two biogeographical regions and under large climatic and edaphic gradients. Consistent with the notion that C sequestration into organic layers (primary sequestration) and mineral soil (secondary sequestration) are two distinct processes [28], we found no correlation between C stocks in organic layers and in mineral soil. Moreover, only the amount of C in the mineral soil was significantly correlated to BA. These findings corroborate our hypothesis that the dynamics of organic matter in the forest floor is primarily influenced by environmental constraints, including the length of growing season and the level of atmospheric N deposition, whereas C stock in the mineral soil better reflects the annual input of C with litterfall and the ability of the soil to preserve organic matter.

5. Conclusions

The present study provides a novel insight into ecological mechanisms underlying C and N accumulation in beech forest soil. In particular, our comparative analysis of two natural beech forests in northern and southern Italy reveals that the southern forest produces a higher amount of litterfall and stores less C in the forest floor (primary sequestration) but more C in mineral soil (secondary sequestration) than the northern forest. Differences in the absolute size of C stocks in forest floor may be may be explained by:
(1)
the shorter growing season and the higher N concentration in litterfall, due to N deposition, that limit organic matter decay in the northern forest;
(2)
the tendency of the southern forest to produce a humus more rich in Mn, which enhances organic-matter decay.
Differences in the C stocks in mineral soil reflect differences in ecosystem productivity and long-term organic-matter accumulation.
The relationships between C accumulation in the organic and the mineral layers, and BA of the Italian beech forests, drawn from the INFI data, support the above conclusions. Using the mean estimates for the 20 administrative regions, we show that C stocks in forest floor and mineral soil are not correlated, hence, they most likely depend on different determinants of C accumulation. Moreover, the analysis of INFI data reveals that C stock in mineral soil, unlike carbon stock in forest floor, is correlated to BA.
The present study provides the first data about Mn in the litterfall–forest floor continuum of Mediterranean beech forests, which have never been investigated in this regard. Indeed, most of the data currently available on the topic concern coniferous forests and a few deal with temperate beech forests [58]. As beech forests are of utmost importance for C sequestration in the Mediterranean area, and Mn concentration controls humus stability, our results call for further research on Mn dynamics in these ecosystems.

Supplementary Materials

The following are available online at www.mdpi.com/1999-4907/7/8/181/s1, Figure S1: C/N ratios on the forest floor–mineral soil continuum of a northern and a southern beech forest. Figure S2: Concentrations of water-extractable C and N, and C/N ratios for water-extractable fractions on the forest floor–mineral soil continuum of a northern and a southern beech forest in autumn and in spring. Figure S3: Concentrations of microbial and fungal C on the forest floor–mineral soil continuum of a northern and a southern beech forest in autumn and in spring.

Acknowledgments

This research was supported by grant No. 2008NMFWYS-002 awarded to A. De Marco within the national project PRIN (Research Projects of Relevant National Interest financed by the Italian Ministry for Education) coordinated by A. Fioretto (grant No. 2008NMFWYS-001). We are grateful to the staff of the Guadine Pradaccio Biogenetic Natural Reserve—Parco Nazionale dell’Appennino Tosco-Emiliano and to the staff of the Regional Natural Reserve of Monti Picentini, for logistic support and technical assistance in the field work. In this paper we used data of C stocks in litter and soil of beech forests provided by the Italian NFI (website “inventarioforestale.org”). We thank Roberto Ligrone for English editing.

Author Contributions

A.D.M., A.F. and A.V.D.S. conceived and designed the experiments; M.G., M.I. and S.P. performed the experiments; A.D.M., A.F. and A.V.D.S. analysed the data; C.M. provided information about history and management of the northern forest and participated to sampling campaigns; A.D.M. and A.F. contributed reagents/materials/analysis tools; A.D.M. and A.V.D.S. wrote the paper. All authors have read and approved the final manuscript.

Conflicts of Interest

The authors declare no conflict of interest.

References

  1. Jobbágy, E.G.; Jackson, R.B. The vertical distribution of soil organic carbon and its relation to climate and vegetation. Ecol. Appl. 2000, 10, 423–436. [Google Scholar] [CrossRef]
  2. Pan, Y.; Birdsey, R.A.; Fang, J.; Houghton, R.; Kauppi, P.E.; Kurz, W.A.; Phillips, O.L.; Shvidenko, A.; Lewis, S.L.; Canadell, J.G.; et al. A large and persistent carbon sink in the world’s forests. Science 2011, 333, 988–993. [Google Scholar] [CrossRef] [PubMed]
  3. Vesterdal, L.; Schmidt, I.K.; Callesen, I.; Ola Nilsson, L.; Gundersen, P. Carbon and nitrogen in forest floor and mineral soil under six common European tree species. For. Ecol. Manag. 2008, 255, 35–48. [Google Scholar] [CrossRef]
  4. Gasparini, P.; Di Cosmo, L. Forest carbon in Italian forests: Stocks, inherent variability and predictability using NFI data. For. Ecol. Manag. 2015, 337, 186–195. [Google Scholar] [CrossRef]
  5. Hobbie, S.E.; Reich, P.B.; Oleksyn, J.; Ogdahl, M.; Zytkowiak, R.; Hale, C.; Karolewski, P. Tree species effects on decomposition and forest floor dynamics in a common garden. Ecology 2006, 87, 2288–2397. [Google Scholar] [CrossRef]
  6. Davidson, E.A.; Janssens, I.A. Temperature sensitivity of soil carbon decomposition and feedbacks to climate change. Nature 2006, 440, 165–173. [Google Scholar] [CrossRef] [PubMed]
  7. FRA. Global Forest Resources Assessment Country Report Italy; FRA 2010/101 Forestry Department, Food and Agriculture Organization of the United Nations: Rome, Italy, 2010. [Google Scholar]
  8. Berg, B.; McClaugherty, C. Plant Litter Decomposition, Humus formation, Carbon Sequestration, 3rd ed.; Springer-Verlag: Berlin, Germany, 2014. [Google Scholar]
  9. Berg, B.; Johansson, M.B.; Ekbohm, G.; McClaugherty, C.; Rutigliano, F.A.; Virzo De Santo, A. Maximum decomposition limits of forest litter types: A synthesis. Can. J. Bot. 1996, 74, 659–672. [Google Scholar] [CrossRef]
  10. Berg, B.; Davey, M.P.; De Marco, A.; Emmett, B.; Faituri, M.; Hobbie, S.E.; Johansson, M.-B.; Liu, C.; McClaugherty, C.; Norell, L.; et al. Factors influencing limit values for pine needle litter decomposition: A synthesis for boreal and temperate pine forest system. Biogeochemistry 2010, 100, 57–73. [Google Scholar] [CrossRef]
  11. Hofrichter, M. Review: Lignin conversion by manganese peroxidase (MnP). Enzyme Microb. Technol. 2002, 30, 454–466. [Google Scholar] [CrossRef]
  12. Trum, F.; Titeux, H.; Ponette, Q.; Berg, B. Influence of manganese on decomposition of common beech (Fagus sylvatica L.) leaf litter during field incubation. Biogeochemistry 2015, 125, 349–358. [Google Scholar] [CrossRef]
  13. Mooshammer, M.; Wanek, W.; Schnecker, R.G.; Wild, B.; Leitner, S.; Hofhans, F.; Blo, A.; Hammerle Frank, A.H.; Fuchslueger, L.; Keiblinger, K.M.; et al. Stoichiometric controls of nitrogen and phosphorus cycling in decomposing beech leaf litter. Ecology 2012, 93, 770–782. [Google Scholar] [CrossRef] [PubMed]
  14. Berg, B.; Meentemeyer, V. Litter quality in a north European transect versus carbon storage potential. Plant Soil 2002, 242, 83–92. [Google Scholar] [CrossRef]
  15. Liu, C.J.; Berg, B.; Kutsch, W.; Westman, C.J.; Ilvesniemi, H.; Shen, X.; Shen, G.; Chen, X. Leaf litter nitrogen concentration as related to climatic factors in Eurasian forests. Glob. Ecol. Biogeogr. 2006, 15, 438–444. [Google Scholar] [CrossRef]
  16. Staaf, H. Plant nutrient changes in beech leaves during senescence as influenced by site characteristics. Acta Oecol. Plant 1982, 3, 161–170. [Google Scholar]
  17. Berg, B.; Erhagen, B.; Johansson, M.; Vesterdal, L.; Faituri, M.; Sanborn, P.; Nilsson, M. Manganese dynamics in decomposing needle and leaf litter—A synthesis. Can. J. For. Res. 2013, 43, 1127–1136. [Google Scholar] [CrossRef]
  18. Burrows, W.H.; Hoffmann, M.B.; Compton, J.F.; Back, P.V.; Tait, L.J. Allometric relationships and community biomass estimates for some dominant eucalypts in Central Queensland woodlands. Aust. J. Bot. 2000, 48, 707–714. [Google Scholar] [CrossRef]
  19. Guckland, A.; Jacob, M.; Flessa, H.; Thomas, F.M.; Leuschner, C. Acidity, nutrient stocks, and organic-matter content in soils of a temperate deciduous forest with different abundance of European beech (Fagus sylvatica L.). J. Plant Nutr. Soil Sci. 2009, 172, 500–511. [Google Scholar] [CrossRef]
  20. Keiblinger, K.M.; Schneider, T.; Roschitzki, B.; Schmid, E.; Eberl, L.; Hämmerle, L.I.; Leitner, S.; Richter, A.; Wanek, W.; Riedel, K.; et al. Effects of stoichiometry and temperature perturbations on beech leaf litter decomposition, enzyme activities and protein expression. Biogeosciences 2012, 9, 4537–4551. [Google Scholar] [CrossRef] [Green Version]
  21. Koranda, M.; Kaiser, C.; Fuchslueger, L.; Kitzler, B.; Sessitsch, A.; Zechmeister-Boltenstern, S.; Richter, A. Seasonal variation in functional properties of microbial communities in beech forest soil. Soil Biol. Biochem. 2013, 60, 95–104. [Google Scholar] [CrossRef] [PubMed]
  22. Malý, S.; Fiala, P.; Reininger, D.; Obdržálková, E. The relationships among microbial parameters and the rate of organic matter mineralization in forest soils, as influenced by forest type. Pedobiologia 2014, 57, 235–244. [Google Scholar] [CrossRef]
  23. Buzek, F.; Paces, T.; Jackova, I. Production of dissolved organic carbon in forest soils along the north–south European transect. Appl. Geochem. 2009, 24, 1686–1701. [Google Scholar] [CrossRef]
  24. IPCC. Good Practice Guidance for Land Use, Land Use Change and Forestry; Institute for Global Environmental Strategies: Hayama, Japan, 2003; Available online: http://www.ipcc-nggip.iges.or.jp/public/gpglulucf/gpglulucf.html (accessed on 25 April 2016).
  25. Pignatti, S. I piani di vegetazione in Italia. G. Bot. Ital. 1979, 113, 411–428. [Google Scholar] [CrossRef]
  26. Gasparini, P.; Di Cosmo, L.; Pompei, E. IL contenuto di carbonio delle foreste italiane. In Inventario Nazionale delle Foreste e dei Serbatoi Forestali di Carbonio INFC 2005; CRA, Ed.; Metodi e risultati dell’indagine integrative; Consiglio per la Ricerca e la sperimentazione in Agricoltura: Trento, Italy, 2013. [Google Scholar]
  27. Fontaine, S.; Mariotti, A.; Abbadie, L. The priming effect of organic matter: A question of microbial competition? Soil Biol. Biochem. 2003, 35, 837–843. [Google Scholar] [CrossRef]
  28. Berg, B.; McClaugherty, C.; De Virzo Santo, A. Practicalities of estimating carbon sequestration—Boreal coniferous forests. CAB Rev. Perspect. Agric. Vet. Sci. Nutr. Nat. Resour. 2008, 3, 84. [Google Scholar] [CrossRef]
  29. Sykes, M.T.; Prentice, I.C.; Cramer, W. A bioclimatic model for the potential distributions of north European tree species under present and future climates. J. Biogeogr. 1996, 23, 203–233. [Google Scholar]
  30. Berg, B.; Laskowski, R. Litter Decomposition: A Guide to Carbon and Nutrient Turnover; Elsevier: San Diego, CA, USA, 2006. [Google Scholar]
  31. Klironomos, J.N.; Rillig, M.C.; Allen, M.F. Designing belowground field experiments with the help of semi-variance and power analyses. Appl. Soil Ecol. 1999, 12, 227–238. [Google Scholar] [CrossRef]
  32. Ministero delle Politiche Agricole e Forestali—Osservatorio Nazionale Pedologico e per la Qualità del Suolo. Metodi Ufficiali di Analisi Chimica del Suolo; Violante, P., International Union of Soil Science, Società Italiana della Scienza del Suolo, Eds.; Franco Angeli Milano: Milan, Italy, 2000. (In Italian) [Google Scholar]
  33. García, C.; Hernández, T.; Costa, F. Study on water extract of sewage sludge composts. Soil Sci. Plant Nutr. 1991, 37, 399–408. [Google Scholar] [CrossRef]
  34. Bussotti, F.; Prancrazi, M.; Matteucci, G.; Gerosa, G. Leaf morphology and chemistry in Fagus sylvatica (beech) trees as affected by site factors and ozone: Results from CONECOFOR permanent monitoring plots in Italy. Tree Physiol. 2005, 25, 211–219. [Google Scholar] [CrossRef] [PubMed]
  35. Olson, F.C.W. Quantitative estimates of filamentous algae. Trans. Am. Microsc. Soc. 1950, 69, 272–279. [Google Scholar] [CrossRef]
  36. Sundman, V.; Sivelä, S. A comment on the membrane filter technique for estimation of length of fungal hyphae in soil. Soil Biol. Biochem. 1978, 10, 399–401. [Google Scholar] [CrossRef]
  37. Berg, B.; Söderström, B. Fungal biomass and nitrogen in decomposing Scots pine needle litter. Soil Biol. Biochem. 1979, 11, 339–341. [Google Scholar] [CrossRef]
  38. Killham, K. Soil Ecology; Cambridge University Press: Cambridge, UK, 1994. [Google Scholar]
  39. Swift, M.J.; Heal, O.W.; Anderson, J.M. Decomposition in Terrestrial Ecosystem; Blackwell Scientific Publications: Oxford, UK, 1979. [Google Scholar]
  40. Anderson, T.H.; Domsch, K.H. A physiological method for the quantitative measurements of microbial biomass in soil. Soil Biol. Biochem. 1978, 10, 215–221. [Google Scholar] [CrossRef]
  41. Sparling, G.P. The soil biomass. In Soil Organic Matter and Biological Activity; Vaughan, D., Malcolm, R.E., Eds.; Nijhoff/Junk: Dordrecht, The Netherlands, 1995. [Google Scholar]
  42. Degens, B.P.; Schipper, L.A.; Sparling, G.P.; Vojvodic-Vukovic, M. Decreases in organic C reserves in soils can reduce the catabolic diversity of soil microbial communities. Soil Biol. Biochem. 2000, 32, 189–196. [Google Scholar] [CrossRef]
  43. Froment, A. Soil respiration in a mixed oak forest. Oikos 1972, 23, 273–277. [Google Scholar] [CrossRef]
  44. Balderas Torres, A.; Jon, C.; Lovett, J.C. Using basal area to estimate aboveground carbon stocks in forests: La Primavera Biosphere’s Reserve, Mexico. Forestry 2012, 86, 267–281. [Google Scholar] [CrossRef]
  45. Fichtner, A.; Sturm, K.; Rickert, C.; Hȁrdtle, W.; Schrautzer, J. Competition response of European beech Fagus sylvatica L. varies with tree size and abiotic stress: Minimizing anthropogenic disturbances in forests. J. Appl. Ecol. 2012, 49, 1306–1315. [Google Scholar] [CrossRef]
  46. Leith, H. Primary productivity in ecosystems: Comparative analysis of global patterns. In Unifying Concepts in Ecology; van Dobben, W.H., McConnel, L., Eds.; Junk: The Hague, The Netherlands, 1975. [Google Scholar]
  47. Vogt, K.A.; Grier, C.C.; Vogt, D.J. Production, turnover, and nutrient dynamics of above- and belowground detritus of world forests. Adv. Ecol. Res. 1986, 15, 303–377. [Google Scholar]
  48. Rasse, D.P.; Rumpel, C.; Dignac, M.-F. Is soil carbon mostly root carbon? Mechanisms for a specific stabilisation. Plant Soil 2005, 269, 341–356. [Google Scholar] [CrossRef]
  49. Olsen, J.S. Energy storage and the balance of producers and decomposers in ecological systems. Ecology 1963, 44, 322–331. [Google Scholar] [CrossRef]
  50. Andrén, O.; Paustian, K. Barley straw decomposition in the field: A comparison of models. Ecology 1987, 68, 1190–1200. [Google Scholar] [CrossRef]
  51. Trumbore, S.E. Comparison of carbon dynamics in tropical and temperate soils using radiocarbon measurements. Glob. Biogeochem. Cycles 1993, 7, 275–290. [Google Scholar] [CrossRef]
  52. Mosello, R.; Brizzio, M.C.; Kotzias, D.; Marchetto, A.; Rembges, D.; Tartari, G. The chemistry of atmospheric deposition in Italy in the framework of the National Programme for Forest Ecosystems Control (CONECOFOR). J. Limnol. 2002, 61, 77–92. [Google Scholar] [CrossRef]
  53. Coûteaux, M.M.; Bottner, P.; Berg, B. Litter decomposition, climate and litter quality. Trends Ecol. Evol. 1995, 10, 63–66. [Google Scholar] [CrossRef]
  54. Coûteaux, M.M.; McTiernan, K.; Berg, B.; Szuberla, D.; Dardenner, P. Chemical composition and carbon mineralisation potential of Scots pine needles at different stages of decomposition. Soil Biol. Biochem. 1998, 30, 583–595. [Google Scholar] [CrossRef]
  55. Tian, X.; Takeda, H.; Azuma, J. Dynamics of organic chemical components in leaf litters during a 3.5-year decomposition. Eur. J. Soil Biol. 2000, 36, 81–89. [Google Scholar] [CrossRef]
  56. Fioretto, A.; Di Nardo, C.; Papa, S.; Fuggi, A. Lignin and cellulose degradation and nitrogen dynamics during decomposition of three leaf litter species in a Mediterranean ecosystem. Soil Biol. Biochem. 2005, 37, 1083–1091. [Google Scholar] [CrossRef]
  57. Michel, K.; Matzner, E. Nitrogen content of forest floor Oa layers affects carbon pathways and nitrogen mineralization. Soil Biol. Biochem. 2002, 34, 1807–1813. [Google Scholar] [CrossRef]
  58. Berg, B.; Erhagen, B.; Johansson, M.-B.; Nilsson, M.; Stendahl, J.; Trum, F.; Vesterdal, L. Manganese in the litter fall-forest floor continuum of boreal and temperate pine and spruce forest ecosystems—A review. For. Ecol. Manag. 2015, 358, 248–260. [Google Scholar] [CrossRef]
  59. Innangi, M.; Schenk, M.K.; d’Alessandro, F.; Pinto, S.; Menta, C.; Papa, S.; Fioretto, A. Field and microcosms decomposition dynamics of European beech leaf litter: Influence of climate, plant material and soil with focus on N and Mn. Appl. Soil Ecol. 2015, 93, 88–97. [Google Scholar] [CrossRef]
  60. Joergensen, R.G.; Scholle, G.A.; Wolters, V. Dynamics of mineral components in the forest floor of an acidic beech (Fagus sylvatica L.) forest. Eur. J. Soil Biol. 2009, 45, 285–289. [Google Scholar] [CrossRef]
  61. Liverness, J.; Smith, T.D. The role of manganese in photosynthesis. Biochemistry 1982, 48, 1–44. [Google Scholar]
  62. Cleveland, C.C.; Townsend, A.R.; Schmidt, S.K. Phosphorus limitation of microbial processes in moist tropical forests: Evidence from short-term laboratory incubations and field studies. Ecosystems 2002, 5, 680–691. [Google Scholar] [CrossRef]
  63. Güsewell, S.; Gessner, M.O. N: P ratios influence litter decomposition and colonization by fungi and bacteria in microcosms. Funct. Ecol. 2009, 23, 211–219. [Google Scholar] [CrossRef]
  64. Smith, V.H. Effects of resource supply ratios on the structure and function of microbial communities. Antonie van Leeuwenhoek 2002, 81, 99–106. [Google Scholar] [CrossRef] [PubMed]
  65. Rousk, J.; Brookes, P.C.; Bååth, E. Contrasting soil pH effects on fungal and bacterial growth suggest functional redundancy in carbon mineralization. Appl. Environ. Microb. 2009, 75, 1589–1596. [Google Scholar] [CrossRef] [PubMed]
  66. Kalbitz, K.; Solinger, S.; Park, J.H.; Michalzik, B.; Matzner, E. Controls on the dynamics of dissolved organic matter in soils: A review. Soil Sci. 2000, 165, 277–304. [Google Scholar] [CrossRef]
  67. Marschner, B.; Kalbitz, K. Controls of bioavailability and biodegradability of dissolved organic matter in soils. Geoderma 2003, 113, 211–235. [Google Scholar] [CrossRef]
  68. Nakanishi, T.; Atarashi-Andoha, M.; Koarashia, J.; Saito-Kokubub, Y.; Hiraic, K. Carbon isotopes of water-extractable organic carbon in a depth profile of forest soil imply a dynamic relationship with soil carbon. Eur. J. Soil Sci. 2012, 63, 495–500. [Google Scholar] [CrossRef]
  69. Schöning, I.; Kögel-Knabner, I. Chemical composition of young and old carbon pools throughout Cambisol and Luvisol profiles under forests. Soil Biol. Biochem. 2006, 38, 2411–2424. [Google Scholar] [CrossRef]
  70. Fontaine, S.; Barot, S.; Barré, P.; Bdioui, N.; Mary, B.; Rumpel, C. Stability of organic carbon in deep soil layers controlled by fresh carbon supply. Nature 2007, 450, 277–280. [Google Scholar] [CrossRef] [PubMed]
  71. Kögel-Knabner, I.; Guggenberger, G.; Kleber, M.; Kandeler, E.; Kalbitz, K.; Scheu, S.; Eusterhues, K.; Leinweber, P. Organo-mineral associations in temperate soils: Integrating biology, mineralogy, and organic matter chemistry. J. Plant Nutr. Soil Sci. 2008, 171, 61–82. [Google Scholar] [CrossRef]
  72. Matus, F.; Rumpel, C.; Neculman, R.; Panichini, M.; Mora, M.L. Soil carbon storage and stabilisation in andic soils: A review. Catena 2014, 120, 102–110. [Google Scholar] [CrossRef]
  73. Anderson, T.H. Microbial ecophysiological indicators to assess soil quality. Agric. Ecosyst. Environ. 2003, 98, 285–293. [Google Scholar] [CrossRef]
  74. Taylor, J.P.; Wilson, B.; Mills, M.S.; Burns, R.G. Comparison of microbial numbers and enzymatic activities in surface soils and subsoils using various techniques. Soil Biol. Biochem. 2002, 34, 387–401. [Google Scholar] [CrossRef]
  75. Sotomayor-Ramirez, D.; Espinoza, Y.; Acosta-Martinez, V. Land use effects on microbial biomass C, β-glucosidase and β-glucosaminidase activities, and availability, storage, and age of organic C in soil. Biol. Fertil. Soils 2009, 45, 487–497. [Google Scholar] [CrossRef]
Figure 1. Nutrient concentrations in newly-shed leaves, floor litter (OL and OF + OH layers) and mineral soil at different depths in a northern and a southern beech forest. Values are means ± standard error; n = 36 (6 sampling plots, 2 sampling seasons, 3 replicate analyses). Different lower-case letters indicate significant differences between sites (t-test; overall significance level = 0.05).
Forests 07 00181 g001
Figure 2. Mn concentrations in newly-shed leaves and floor litter in a northern and a southern beech forest. Values for newly-shed litter are means ± standard error; n = 9. Values for forest floor are means ± standard error; n = 36 (6 sampling plots, 2 sampling seasons, 3 replicate analyses); different lower-case letters indicate significant differences between sites (t-test; overall significance level = 0.05).
Forests 07 00181 g002
Figure 3. C and N pools in the continuum forest floor -mineral soil of a northern and a southern beech forest. Values are means ± standard error; n = 36 (6 sampling plots, 2 sampling seasons, 3 replicate analyses). Different lower-case letters indicate significant differences between sites (t-test; overall significance level = 0.05).
Forests 07 00181 g003
Figure 4. C stocks in forest floor and mineral soil in a northern and a southern beech forest. C stocks in the mineral soil 0–30 cm depth are reported for comparison with INFI data. Values are means ± standard error; n = 36 (6 sampling plots, 2 sampling seasons, 3 replicate analyses). Different lower-case letters indicate significant differences between sites (t test; overall significance level = 0.05).
Forests 07 00181 g004
Figure 5. Soluble C and N fractions % of total C and N in the continuum forest floor -mineral soil of a northern and a southern beech forest. Values are means ± standard error; n = 18 samples (6 sampling plots, 3 replicate analyses). Different lower-case letters indicate significant differences between sites; differences between seasons are indicated by different numbers (two-way ANOVA followed by post-hoc Holm-Šídák method; overall significance level = 0.05).
Forests 07 00181 g005
Figure 6. Total microbial and fungal biomass as C fractions % of total organic matter in the continuum forest floor -mineral soil in a northern and a southern beech forest. Values are means ± standard error; n = 18 (6 sampling plots, 3 replicate analyses). Different lower-case letters indicate significant differences between sites; differences between seasons are indicated by different numbers (two-way ANOVA followed by post-hoc Holm-Šídák method; overall significance level = 0.05).
Forests 07 00181 g006
Figure 7. Potential mineralization (mg·CO2·g−1·h−1) and metabolic quotient (mg·C-CO2·g·Cmic−1) in forest floor (OL + OF + OH) and mineral soil (0–40 cm) in a northern and a southern beech forest. Values are means ± standard = error; n = 36 for forest floor (6 sampling plots, 2 layers, 3 replicate analyses); n = 72 for mineral soil (6 sampling plots, 4 layers, 3 replicate analyses). Different lower-case letters indicate significant differences between sites; differences between seasons are indicated by different numbers (two-way ANOVA followed by post-hoc Holm-Šídák method; overall significance level = 0.05).
Forests 07 00181 g007
Figure 8. Relationships among C pools in litter (LC), organic layer (OLC) and mineral soil (MLC) and between basal area and C pools in Italian beech forests. Points are mean estimates for the twenty administrative regions, reported in the National Forest Inventory (website “inventarioforestale.org”). Points in color refer to the two regions where the forests investigated in this paper are located.
Forests 07 00181 g008
Table 1. Location, climate and soil features of two 75-year-old beech forests in the Apennines mountains (Italy).
Northern ForestSouthern Forest
Latitude/Longitude43°23′ N; 10°01′ E40°48′ N; 15°07′ E
Altitude (meters above sea level)13501150
* Mean annual temperature (MAT)6.0 °C8.7 °C
* Mean temperature of the warmest month (TM)15.4 °C17.4 °C
* Mean temperature of the coldest month (Tm)−2.7 °C0.3 °C
* Mean annual precipitation (MAP)2900 mm2300 mm
* Maximum monthly precipitation (PM)415 mm430 mm
* Minimum monthly precipitation (Pm)42 mm31 mm
Number of growing degree days178238
Soil parental substrateArenaceous, Lithological formation: MacignoCalcareous covered by pyroclastic material
Soil 0–15 cm depth
Texture (%):
Sand34.229.7
Silt40.447.4
Clay25.422.8
water content (% d.w.)72.4 ± 10.778.2 ± 2.6
bulk density (g·cm−3)1.06 ± 0.060.99 ± 0.05
organic matter content (%)20.2 ± 1.022.8 ± 1.2
CEC (cmol·kg−1)29.4 ± 3.635.7 ± 2.8
pH (H2O)3.9 ± 0.15.6 ± 0.1
N (mg·g−1 d.w.)6.52 ± 1.759.38 ± 0.58
P (mg·g−1 d.w.)0.04 ± 0.0070.16 ± 0.01
C/N14.7 ± 2.112.7 ± 0.7
C/P3742 ± 3481118 ± 247
* Observation period 2008–2013. Data for the southern forest from Meteorological Station of Piano Laceno and for the northern forest from Meteorological Station of Lagdei (Pradaccio) located at 1110 m and 1256 m a.s.l., respectively. Temperature data adjusted for altitude and the actual location of meteorological stations. The values for soil parameters are mean ± standard error; n = 36 (6 sampling plots, 2 sampling seasons, 3 replicate analyses).
Table 2. Stand, litterfall and forest floor features of two 75-year-old beech forests in the Apennines mountains (Italy).
Northern ForestSouthern Forest
Slope (degree)13.98°12.13°
Tree density (number·ha−1)1100 ± 55800 ± 40
Diameter at breast height (cm)25.4 ± 1.334.4 ± 2.2
Basal area (m2·ha−1)55.774.3
Litter input (Mg·ha−1) (n = 9)2.50 ± 0.184.31 ± 0.43
Forest floor litter stock (Mg·ha−1)23.89 ± 2.1221.18 ± 2.69
Ratio litter stock to litter input9.64.9
Nutrient content of newly shed leaves (mg·g−1) (n = 9)
C472.0 ± 1.45466.7 ± 0.90
N13.06 ± 0.0510.17 ± 0.22
C/N3646
P0.40 ± 0.060.62 ± 0.06
Mn0.14 ± 0.0050.06 ± 0.001
Nutrient fluxes with litterfall (kg·ha−1)
N32.6543.83
P1.002.67
Mn0.350.26
Main features of forest floor litter (OL and OF + OH) *
pH (H2O)5.82 ± 0.106.18 ± 0.03
water content (% d.w.)191.4 ± 13.0224.7 ± 21.3
OM (mg·g−1 d.w.)910.1 ± 15.4728.1 ± 30.9
N (mg·g−1 d.w.)21.21 ± 1.4215.68 ± 1.27
P (mg·g−1 d.w.)0.18 ± 0.010.38 ± 0.03
Mn (mg g−1 d.w.)0.16 ± 0.020.25 ± 0.03
C/N2432
C/P29251328
C/Mn36902184
C/Ca5326
* The values for soil parameters are mean ± SE; n = 36 (6 sampling plots, 2 sampling seasons, 3 replicate analyses) for each of the two layers.

