Article

Analysing Atmospheric Processes and Climatic Drivers of Tree Defoliation to Determine Forest Vulnerability to Climate Warming

by
Raúl Sánchez-Salguero
1,2,*,
J. Julio Camarero
1,
José M. Grau
3,
Ana C. De la Cruz
3,
Paula M. Gil
3,
Mayte Minaya
3 and
Ángel Fernández-Cancio
3
1
Pyrenean Institute of Ecology (IPE-CSIC), Avenida Montañana 1005, 50059 Zaragoza, Spain
2
Department of Physical, Chemical and Natural Systems, Universidad Pablo de Olavide, Ctra. Utrera km. 1, 41013 Seville, Spain
3
Department of Ecology and Forest Genetics, INIA—Forest Research Center, Ctra. de la Coruña km 7.5, 28040 Madrid, Spain
*
Author to whom correspondence should be addressed.
Forests 2017, 8(1), 13; https://doi.org/10.3390/f8010013
Submission received: 31 October 2016 / Revised: 12 December 2016 / Accepted: 20 December 2016 / Published: 26 December 2016
(This article belongs to the Special Issue Forest Growth Response to Environmental Stress)

Abstract

:
Crown defoliation is extensively monitored across European forests within the International Co-operative Programme (ICP) as a proxy of forest health. Climate warming and drought are assumed to be the major drivers of tree growth and crown defoliation, particularly in seasonally dry areas such as the Mediterranean Basin. Here we analyse how climate, drought, and atmospheric processes are related to defoliation time series of five oak and five pine species that are dominant across Spanish ICP monitoring forest plots. We found that warmer and drier conditions during April were linked to enhanced defoliation. Warm April conditions were also related to high values of the Atlantic Multi-decadal Oscillation (AMO), thereby indicating large-scale links between atmospheric processes, temperature, and defoliation patterns. The temperature-defoliation association was species-specific since some tree species from wet sites showed a weak association (e.g., Quercus robur L.) whereas others from dry sites (e.g., Quercus ilex L.) presented the strongest associations. The latter tree species could be considered vulnerable to heat stress in terms of leaf shedding. We also explored if defoliation was related to radial growth and found negative associations in relatively dry areas. Warmer and drier conditions linked to increasing AMO values are connected to the post-1990s rise of defoliation in Spanish ICP forest plots. Combined incorporation of defoliation and growth into mortality models can provide insights into assessments of forest vulnerability.

1. Introduction

The frequency and intensity of droughts and heat waves is expected to increase throughout the 21st century as climates warm [1,2]. Dry spells and heat waves during the early growing season cause rapid morphological responses in affected trees as leaf shedding (defoliation), early senescence, and canopy dieback leading to short- to long-term reductions in leaf area and growth, thus decreasing forest productivity [3,4]. The negative effects of heat stress on trees are exacerbated by water shortage and can lead to widespread forest dieback, as has been observed in most drought-prone forest biomes [5,6]. In fact, severe canopy defoliation in response to drought or heat stress reflects irreversible tree damage and portends forest dieback [7].
The timing of the exposure to heat and drought stress is critical for understanding morphological, developmental, and growth responses of trees [8]. For instance, excessively warmer conditions in spring can trigger leaf abscission of recently formed leaves as observed in Acer saccharum Marshall growing in a temperate forest [9] or reduce budburst and increased phenological asynchrony as detected in Mediterranean holm oak (Quercus ilex L.) trees [10]. On the other side, warm autumn conditions can affect bud dormancy and hardening processes, and delay budburst and leaf-out in the following spring affecting canopy defoliation in the case of boreal tree species [11].
In Mediterranean, temperate, and boreal forests, summer drought has been identified as a major driver of tree defoliation [12,13,14,15,16]. However, very warm early-spring conditions have also been identified as triggers of leaf fall since both spring temperatures and defoliation series follow similar increasing trends [17,18]. The processes leading to tree defoliation and the subsequent responses in tree vigour (vulnerability) are still poorly understood regarding defoliation-climate associations at large scales. We still lack robust analyses assessing which are the major climatic drivers of tree defoliation. These analyses should evaluate if heat and drought stress are related to pronounced leaf shedding, growth decline, and a loss of vigour. A better understanding of long-term changes in tree vigour can be obtained by relating defoliation and radial-growth data (tree-ring width), which reflect different performance aspects [7,19,20]. Moreover, since large-scale atmospheric processes control local climate conditions and forest growth and productivity, climate-defoliation associations can be compared to these processes as has been done with growth [21,22]. Therefore, we hypothesize that the timing and intensity of warming and drought should differently affect tree species defoliation depending on the vulnerability of each species to water shortage. We also expect that climate-defoliation associations are connected to large-scale atmospheric processes. Specifically, we hypothesize that tree species dominant in sites subjected to seasonal water shortage (e.g., Pinus halepensis Mill., P. pinaster Ait., Quercus ilex L., Q. faginea Lam., or Q. suber L.) will be the most vulnerable to heat and drought stress in terms of crown defoliation, whereas forests of tree species dominant in mesic sites where water shortage is rare (e.g., Quercus robur L.) will be less vulnerable [14,17].
Iberian forests are suitable to address the aforementioned statements and to evaluate climate-defoliation relationships for several reasons. First, Mediterranean forests, which predominate in Spain, constitute hot spots of climate change because they are vulnerable to hotter droughts and increasingly warmer conditions [5]. Dry spells and hotter conditions have been linked to increased percentages of defoliation across the Mediterranean Basin [14]. Second, forest dieback and severe defoliation episodes have been particularly frequent across Spanish forests since the 1980s [10,17,23,24,25,26,27]. Here we use a retrospective approach based on assessments of crown defoliation condition, here considered as a surrogate of forest vulnerability to climate, measured in long-term monitoring plots [28] from ten tree species dominant in Spanish forests and relate the series of mean annual defoliation to atmospheric processes, climate variables, and a drought index. We use such a wide species-based approach to ascertain if warmer temperatures or drier conditions are the main drivers of increasing defoliation trends observed in some species and to establish if this is connected to changes in atmospheric processes controlling climate conditions over the Iberian Peninsula. Finally, we compare defoliation and radial-growth data in selected locations and species to explore the relationships between crown condition and wood formation.

2. Materials and Methods

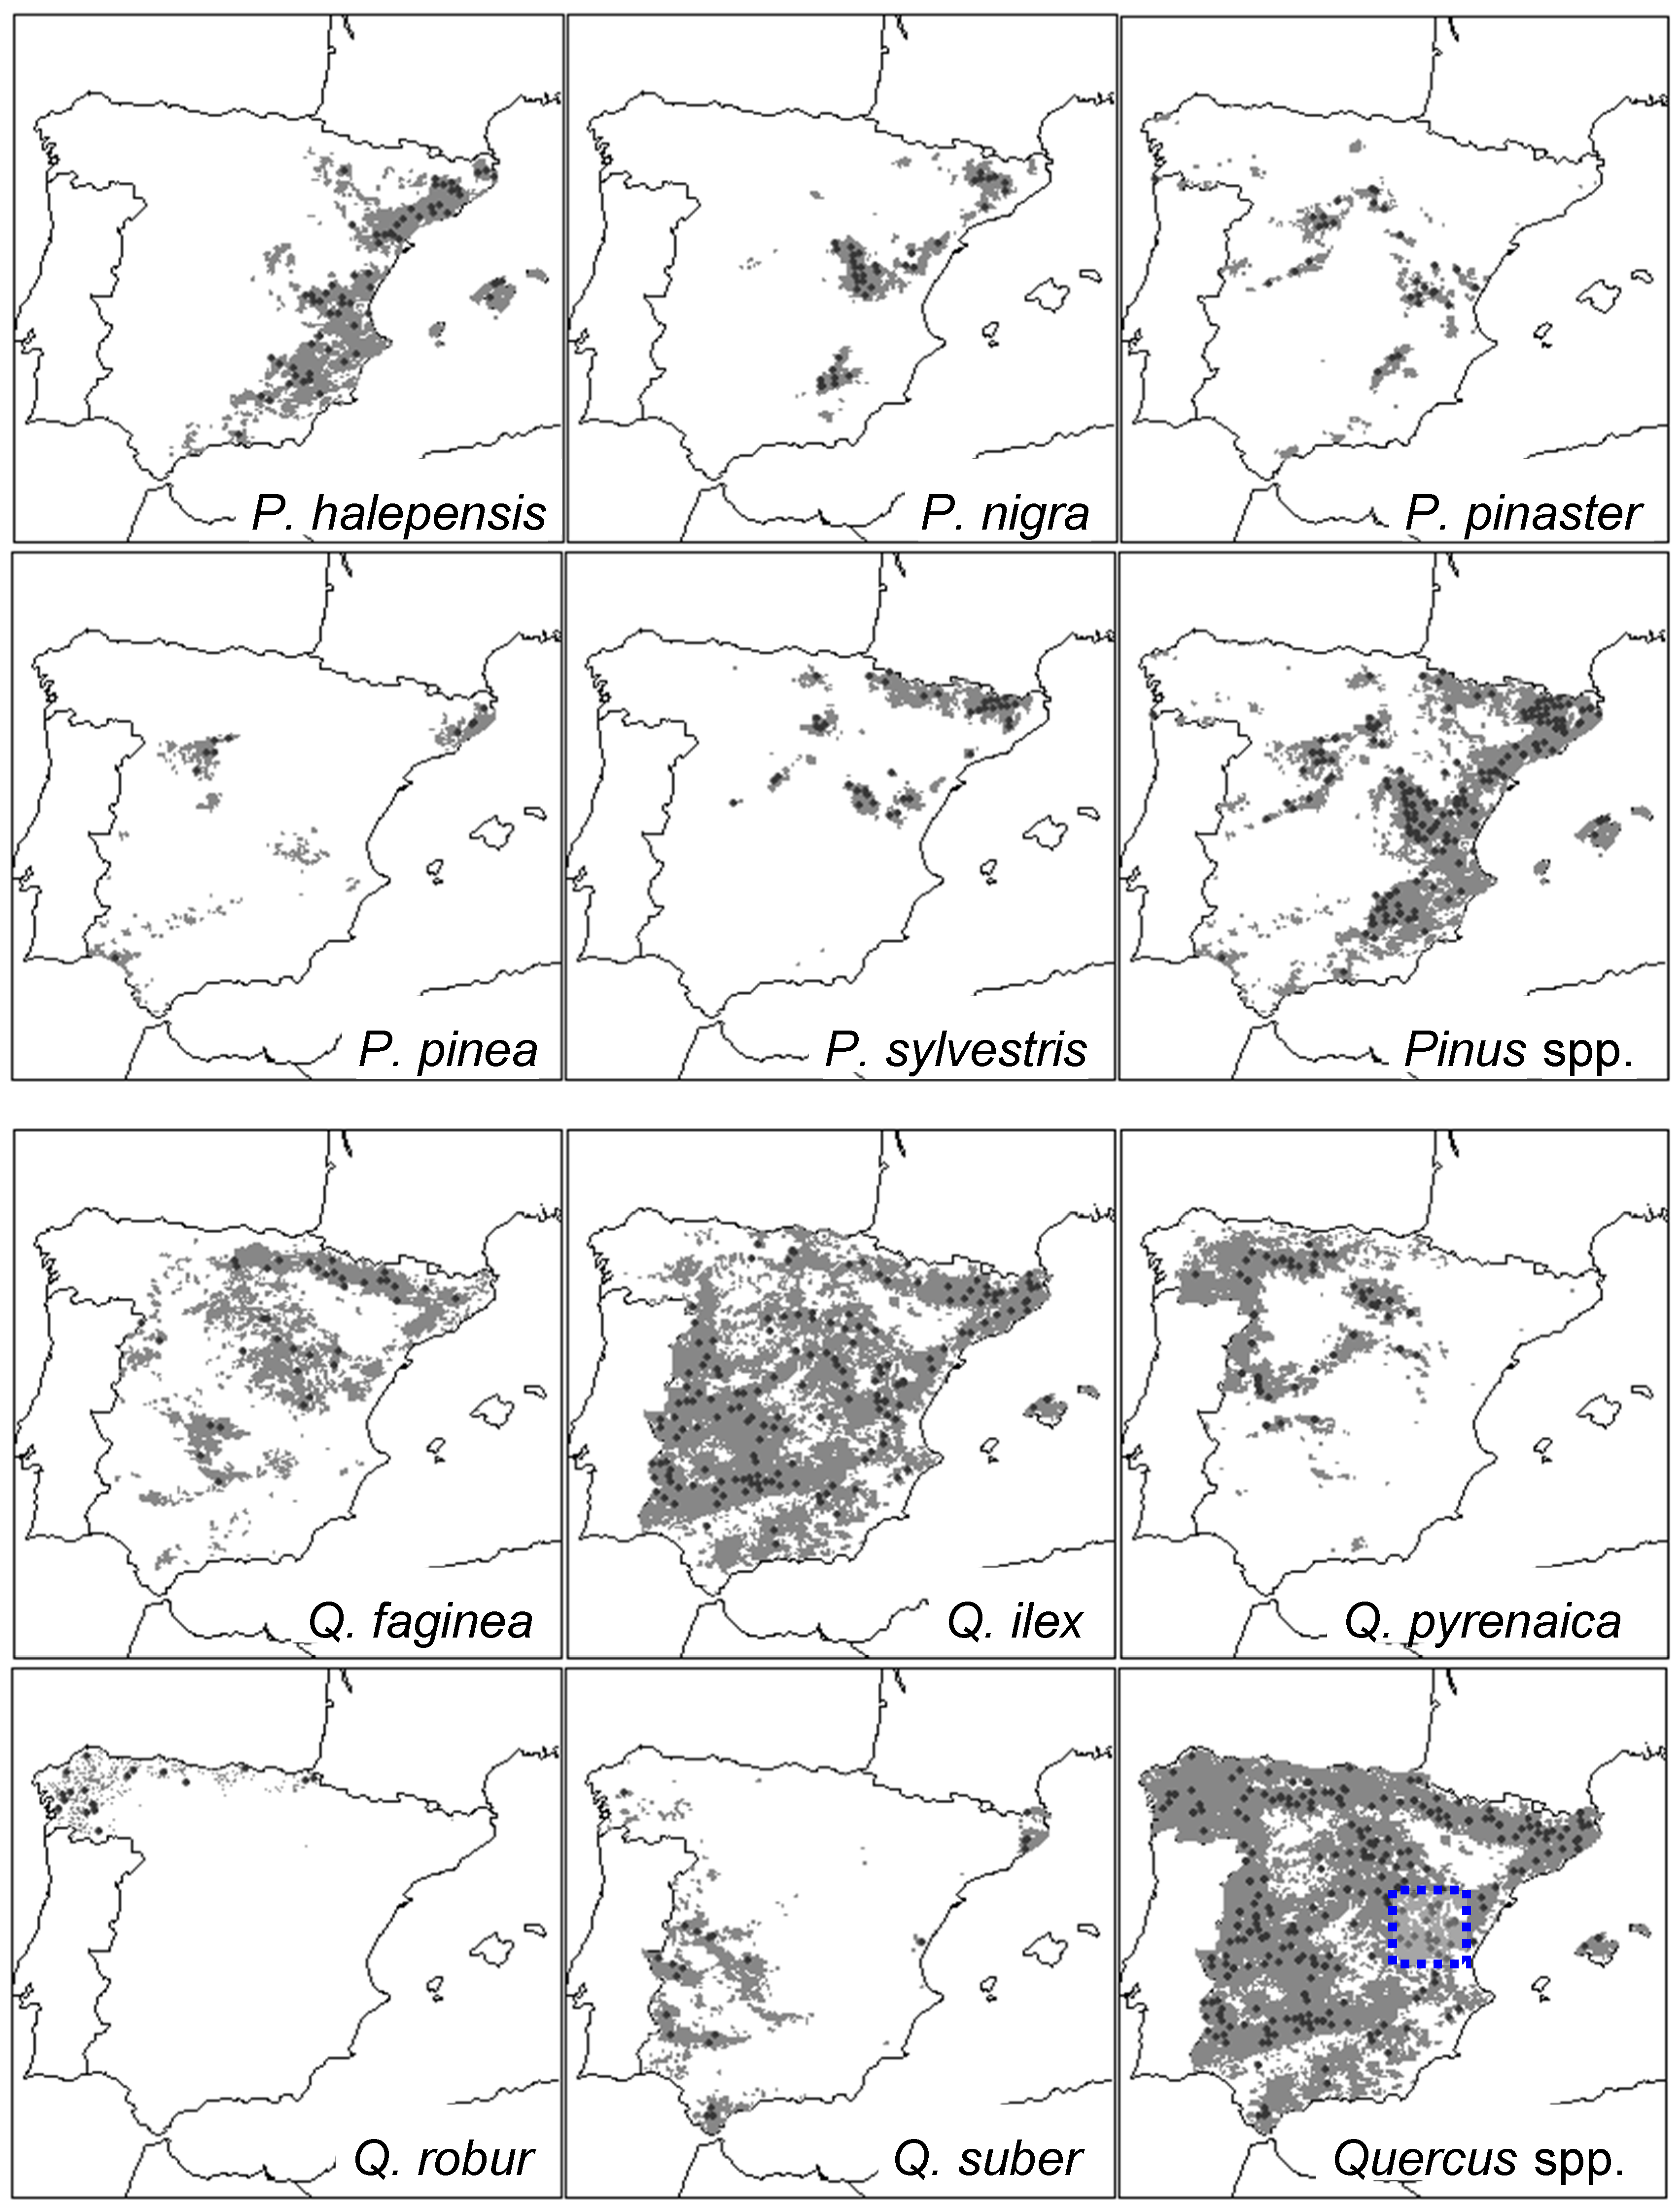
2.1. Study Area and Tree Species

The study area encompasses Iberian Spain and the Balearic islands (Figure 1). This area includes varied topographic, edaphic, and climatic conditions corresponding to mountain, temperate, and Mediterranean forest types [29]. In north-western and western Spain, the Atlantic influence is dominant and temperate oak forests abound (e.g., Quercus robur L.). In southern and eastern Spain, the Mediterranean influence (summer drought) prevails and most tree species are able to withstand dry conditions (e.g., Pinus halepensis Mill.). In mountain areas and continental inland ranges (Central and Iberian Systems, Pyrenees), cold conditions are linked to the dominance of some pine (e.g., P. sylvestris L.) and oak species (Q. pyrenaica Willd.). Mean annual temperatures vary from 2.5 °C at high elevations in the Pyrenees to 19 °C in coastal areas of southern Spain, whilst total annual rainfall oscillates between ca. 2000 mm in northern Spain to 196 mm in the semi-arid south-eastern Spain [30].
We selected the most abundant and widely distributed pine and oak species which have been intensively sampled regarding defoliation in Spain. They corresponded to five pine species (P. halepensis Mill., P. nigra J.F. Arnold, P. pinaster Ait., P. pinea L., and P. sylvestris L.) and five oak species (Q. ilex L., Q. faginea Lam., Q. pyrenaica Willd., Q. suber L., and Q. robur L.) (Table 1 and Figure 1).

2.2. Defoliation Data

Annual crown defoliation was assessed for all considered species during the 1989–2010 period. This was done using all available Level I and Level II monitoring plots of the ICP Forests [29] European network located in Spain (Table 1). Tree defoliation was annually recorded during summer and early autumn by two observers according to international guidelines [31]. Crown defoliation corresponds to the percentage of foliage missing in comparison with the expected amount for a healthy tree at the site [7]. In the Level I systematic network, defoliation is measured in 24 dominant trees per plot with a minimum height of 60 cm [29]. The Level I circular plots are distributed on 16 × 16 km grids throughout Europe encompassing 620 plots in Spain (Figure 1). The Level II plots correspond to an intensive monitoring network of forest health within 54 plots, each one with a 2500 m2 area, located across Spain [29]. In this study, defoliation was averaged for each plot, year, and species. Since the 10 considered species correspond to two distinct taxonomic and ecological groups (oaks and pines), we also calculated the mean defoliation for each of these groups at the plot level.

2.3. Radial Growth Data

To investigate the relationship between defoliation and growth, we considered at least five ICP-Forests plots for each of the three tree species situated in the drought-prone eastern Spain, where a high density of defoliation plots exists (Figure 1). These sites were selected because of their proximity (less than 10 km apart, similar elevation) with ICP-Forests plots having complete defoliation survey records to compare with mean plot growth data. Tree-ring width series of three tree species (P. pinaster, P. sylvestris, and Q. ilex) which are widely spread across Spain were obtained from a previous study [32] and updated until 2010 (see sites’ features in Table 2). We used dendrochronology to cross-date the tree-ring width series and to obtain growth data. In each plot, at least 15 dominant trees were sampled in a 0.5-ha large area by extracting two radial cores per tree at 1.3 m using a Pressler increment borer. Cores were air dried, sanded, and visually cross-dated. Individual tree-ring width series were measured to the nearest 0.01 mm with a LINTAB measuring device (Rinntech, Heidelberg, Germany). Cross-dating quality was checked using the software COFECHA [33] by assessing the coherence of the different ring-width series obtained from trees sampled in each site.

2.4. Climate Data, Atmospheric Processes, and SPEI Drought Index

Monthly climate data (T, mean temperature; P, total precipitation) were obtained and checked for homogeneity from 6130 local meteorological stations of the Spanish Meteorological Agency that covered the entire study area. We characterized the climate of plots dominated (>50% trees) by each tree species by averaging (temperature) and summing (precipitation) climate data for the period 1989–2010 using only stations located not further than 20 km from each study plot [17]. We also considered climate data in seasons as follows: winter (DJF), spring (MAM), summer (JJA), and autumn (SON). Climate data were transformed into normalized deviations to give them the same weight in further analyses. To detect changes in drought severity we used the Standardized Precipitation-Evapotranspiration Index (SPEI), which is a multi-scalar drought index based on the effect of temperatures and evapotranspiration on water availability [34]. The SPEI quantifies monthly cumulative drought stress at different time scales (e.g., a two-month April SPEI considers drought severity from March to April). The SPEI is able to quantify drought severity according to its intensity and duration. The SPEI monthly values were obtained for the period 1989–2010 at 0.5° resolution and for 1- to 12-long month scales. For our study, we used data from the 0.5° grids where each species was present according to its current distribution (Figure 1). The SPEI data were downloaded from the SPEI Global Drought Monitor webpage [35].
Lastly, we selected three indices which summarize the major atmospheric processes affecting climate in Spain. The Atlantic Multi-decadal Oscillation (AMO) is calculated from long-duration changes in the sea surface temperature of the North Atlantic Ocean and it is connected to temperature and precipitation patterns on North America and Europe [36,37]. The North Atlantic Oscillation (NAO) is an atmospheric mode characterized by a north-south dipole across the North Atlantic determined by the position of the Iceland low and the Azores region [38]. The NAO characterizes the direction and strength of westerly winds reaching the Iberian Peninsula where high NAO indices are linked to the prevalence of the Azores high, and thus, dry and warm winter/early-spring conditions [39]. Such conditions are associated with reduced forest growth across Spain [21]. The Southern Oscillation Index (SOI) is based on the sea-level pressure and temperature differences between the tropical eastern and western Pacific Ocean and periods of negative SOI values correspond to very wet and warm conditions over South America (El Niño episodes), but dry winter-spring conditions over eastern Spain [40]. Atmospheric indices (AMO, NAO, SOI) were downloaded at a monthly scale from the Earth System Research Laboratory (ESRL-NOAA) web page [41].

2.5. Statistical Analyses

The associations between climate, the SPEI drought index, atmospheric indices, and defoliation variables were assessed using the Pearson (r) correlation coefficient and considering the 1989–2010 period (n = 22 years). These relationships were further modelled by applying stepwise linear regressions with forward selection to identify the main climate and atmospheric indices driving changes on the observed defoliation data. We used the function “step” of the package “stats” to fit these models and selected the most parsimonious model by minimizing the Akaike Information Criterion [42]. We calculated the Variance Inflation Factor (VIF) for each term in the selected model and discarded those models with variables showing VIFs higher than 4 which indicate multicollinearity among explanatory variables [42]. We also included the coefficient of variation and the first-order autocorrelation to quantify the variability and persistence (usually first-order autocorrelation) in the defoliation series. The temporal trends of defoliation for each plot were quantified using the Mann-Kendall tau (τ) statistic.
Pearson correlations were calculated between defoliation and tree-ring width for selected species where both datasets were available. Since most compared variables present first-order autocorrelation, we calculated corrected significance levels (Pcorr) using bootstrap estimates of 95% confidence intervals with an average block length proportional to the maximum estimated autocorrelation of the data [43]. The monthly climate and indices data are indicated in the results section by three-letter codes and the “t − 1” subscript indicates the previous year. All statistical analyses were done with the R statistical software [44].

3. Results

3.1. Patterns and Trends of Defoliation Data

Oak and pine species showed similar mean maximum defoliation values (24.5%) and variability (coefficient of variation was 0.21) for the 1989–2010 period (Table 3). The species with lowest and highest maximum defoliation values were P. sylvestris (19%) and Q. suber (32%), respectively. The maximum annual defoliation values (29%–32%) were observed during warm and dry periods in 1995–1996 and 2005–2006. All tree species and groups showed positive first-order autocorrelation values and significant positive trends, particularly P. pinaster (Table 3).
The combined defoliation series of oak and pine species were highly correlated (r = 0.95, Pcorr < 0.001) indicating a common response to external drivers (Table 4). Considering the individual species defoliation data, most of these series were positively related, excepting Q. robur (Table 4).

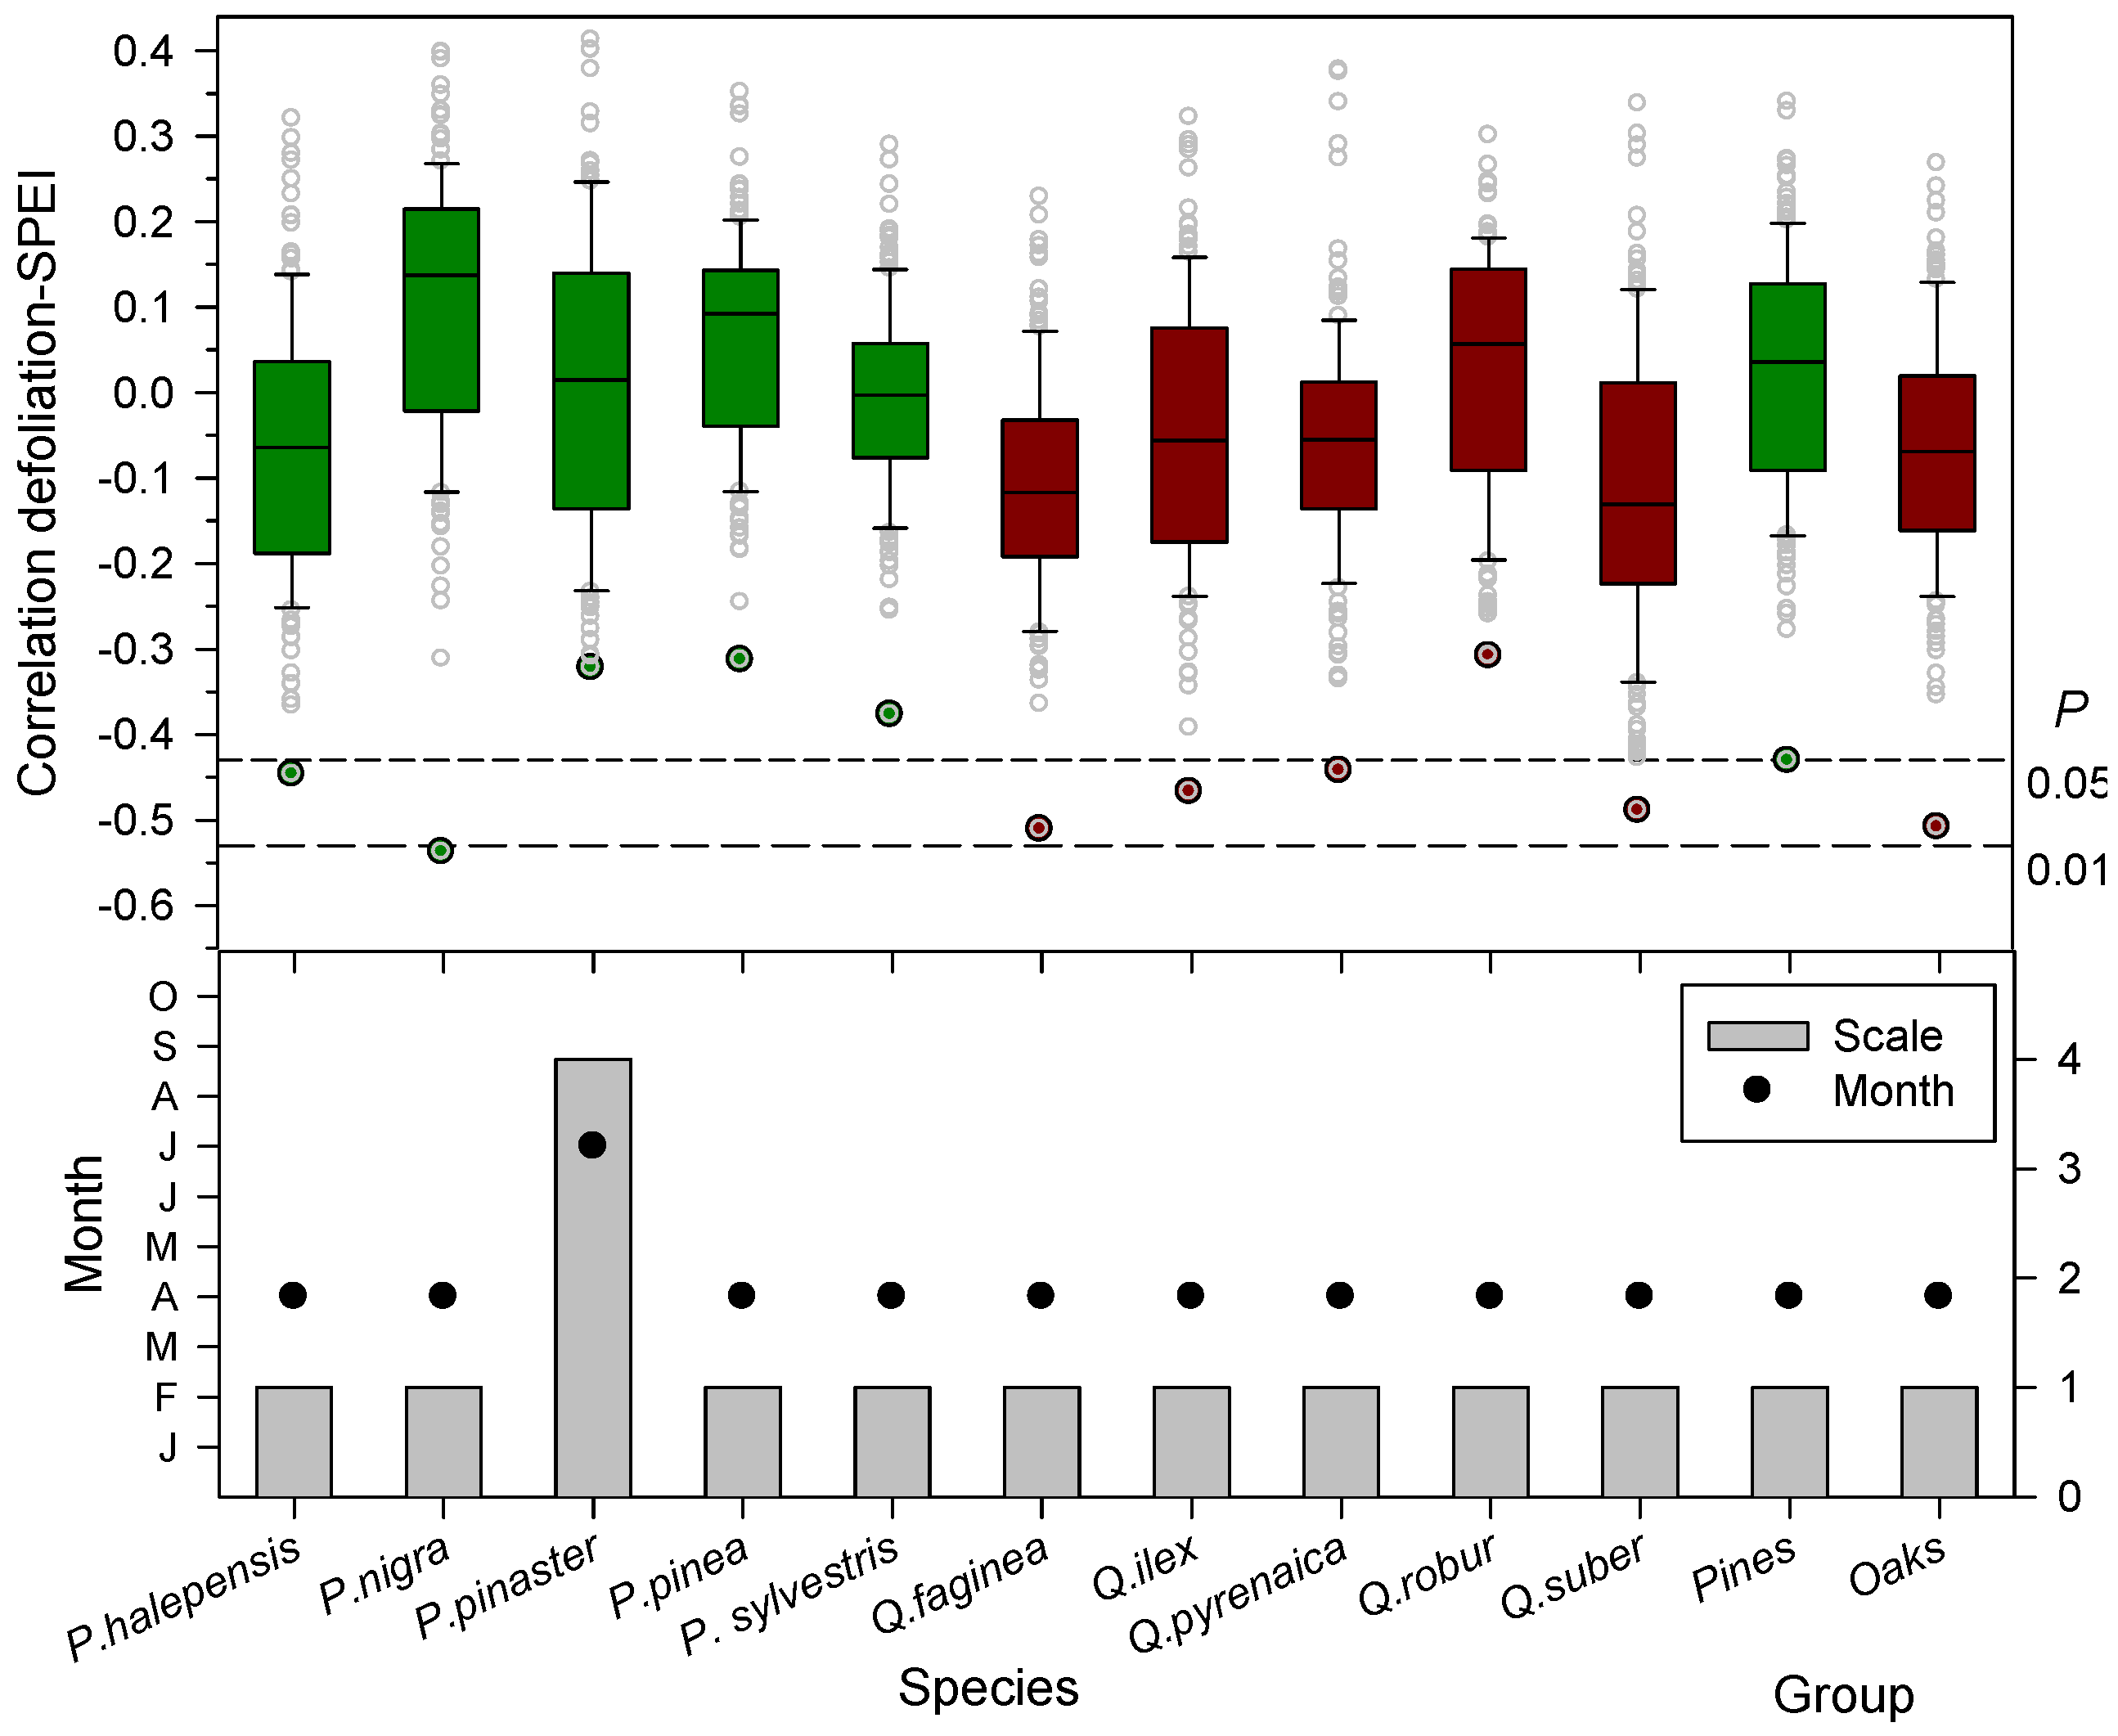
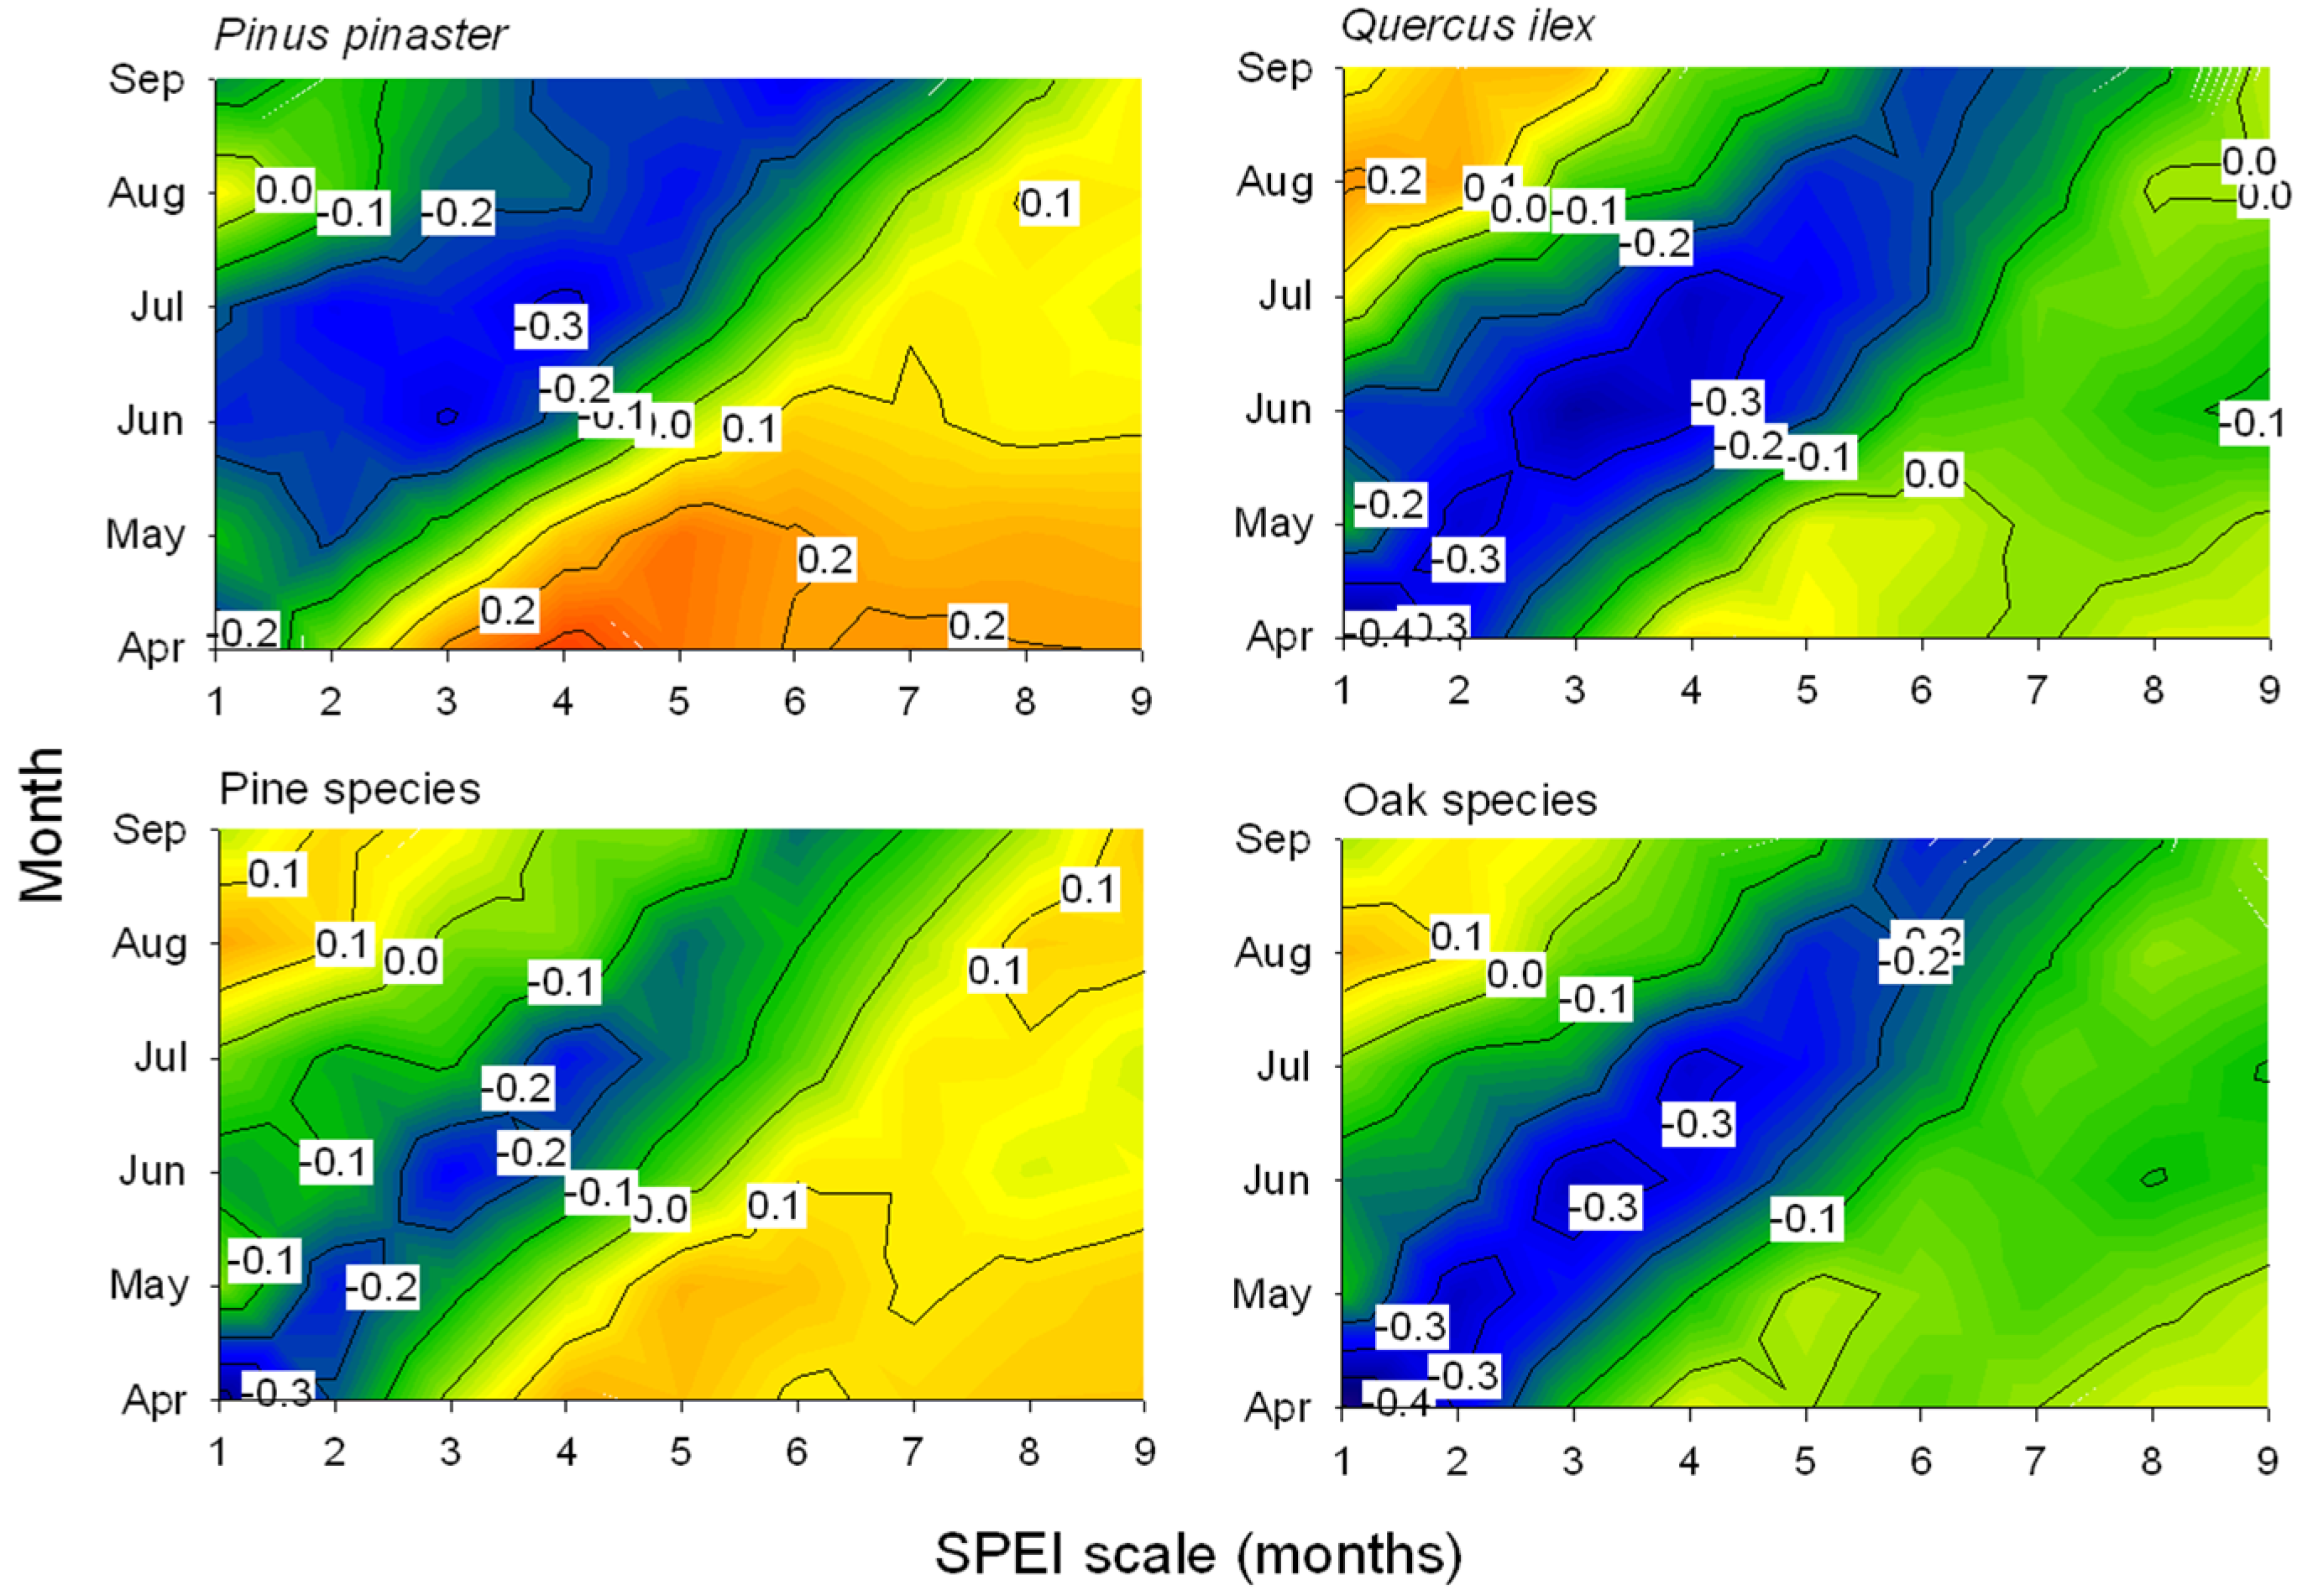
3.2. Associations between Defoliation, Climate and Drought

April temperature was positively and significantly (Pcorr < 0.0001) related to pine (r = 0.65) and oak (r = 0.63) defoliation data. This association with April temperature reached maximum values in P. nigra (r = 0.69) and Q. ilex (r = 0.67) and minimum values in P. pinaster (r = 0.55) and Q. robur (r = 0.46) (Table 5). No significant association was observed between defoliation and precipitation. Regression models selected April and June temperatures as the main explanatory climatic variables of defoliation, with April average temperatures being the most important particularly for Q. ilex, P. halepensis, P. nigra, P. pinea, P. pinaster, and Q. suber (Table 5).
Drier (lower SPEI values) spring conditions were linked to increased leaf loss since defoliation was inversely related to the April SPEI calculated at one-month long scales (Figure 2 and Figure 3), except in P. pinaster which showed the most negative association for the July SPEI index calculated at four-month long scales. Note that in these species, P. pinea, P. sylvestris, and Q. robur, the most negative SPEI-defoliation correlations were not significant at the 0.05 level for 12-month scale (Figure 3). The negative correlations between the one-month April SPEI and the mean defoliation series reached minimum values in the case of P. nigra, Q. faginea, and Q. suber (Figure 3).

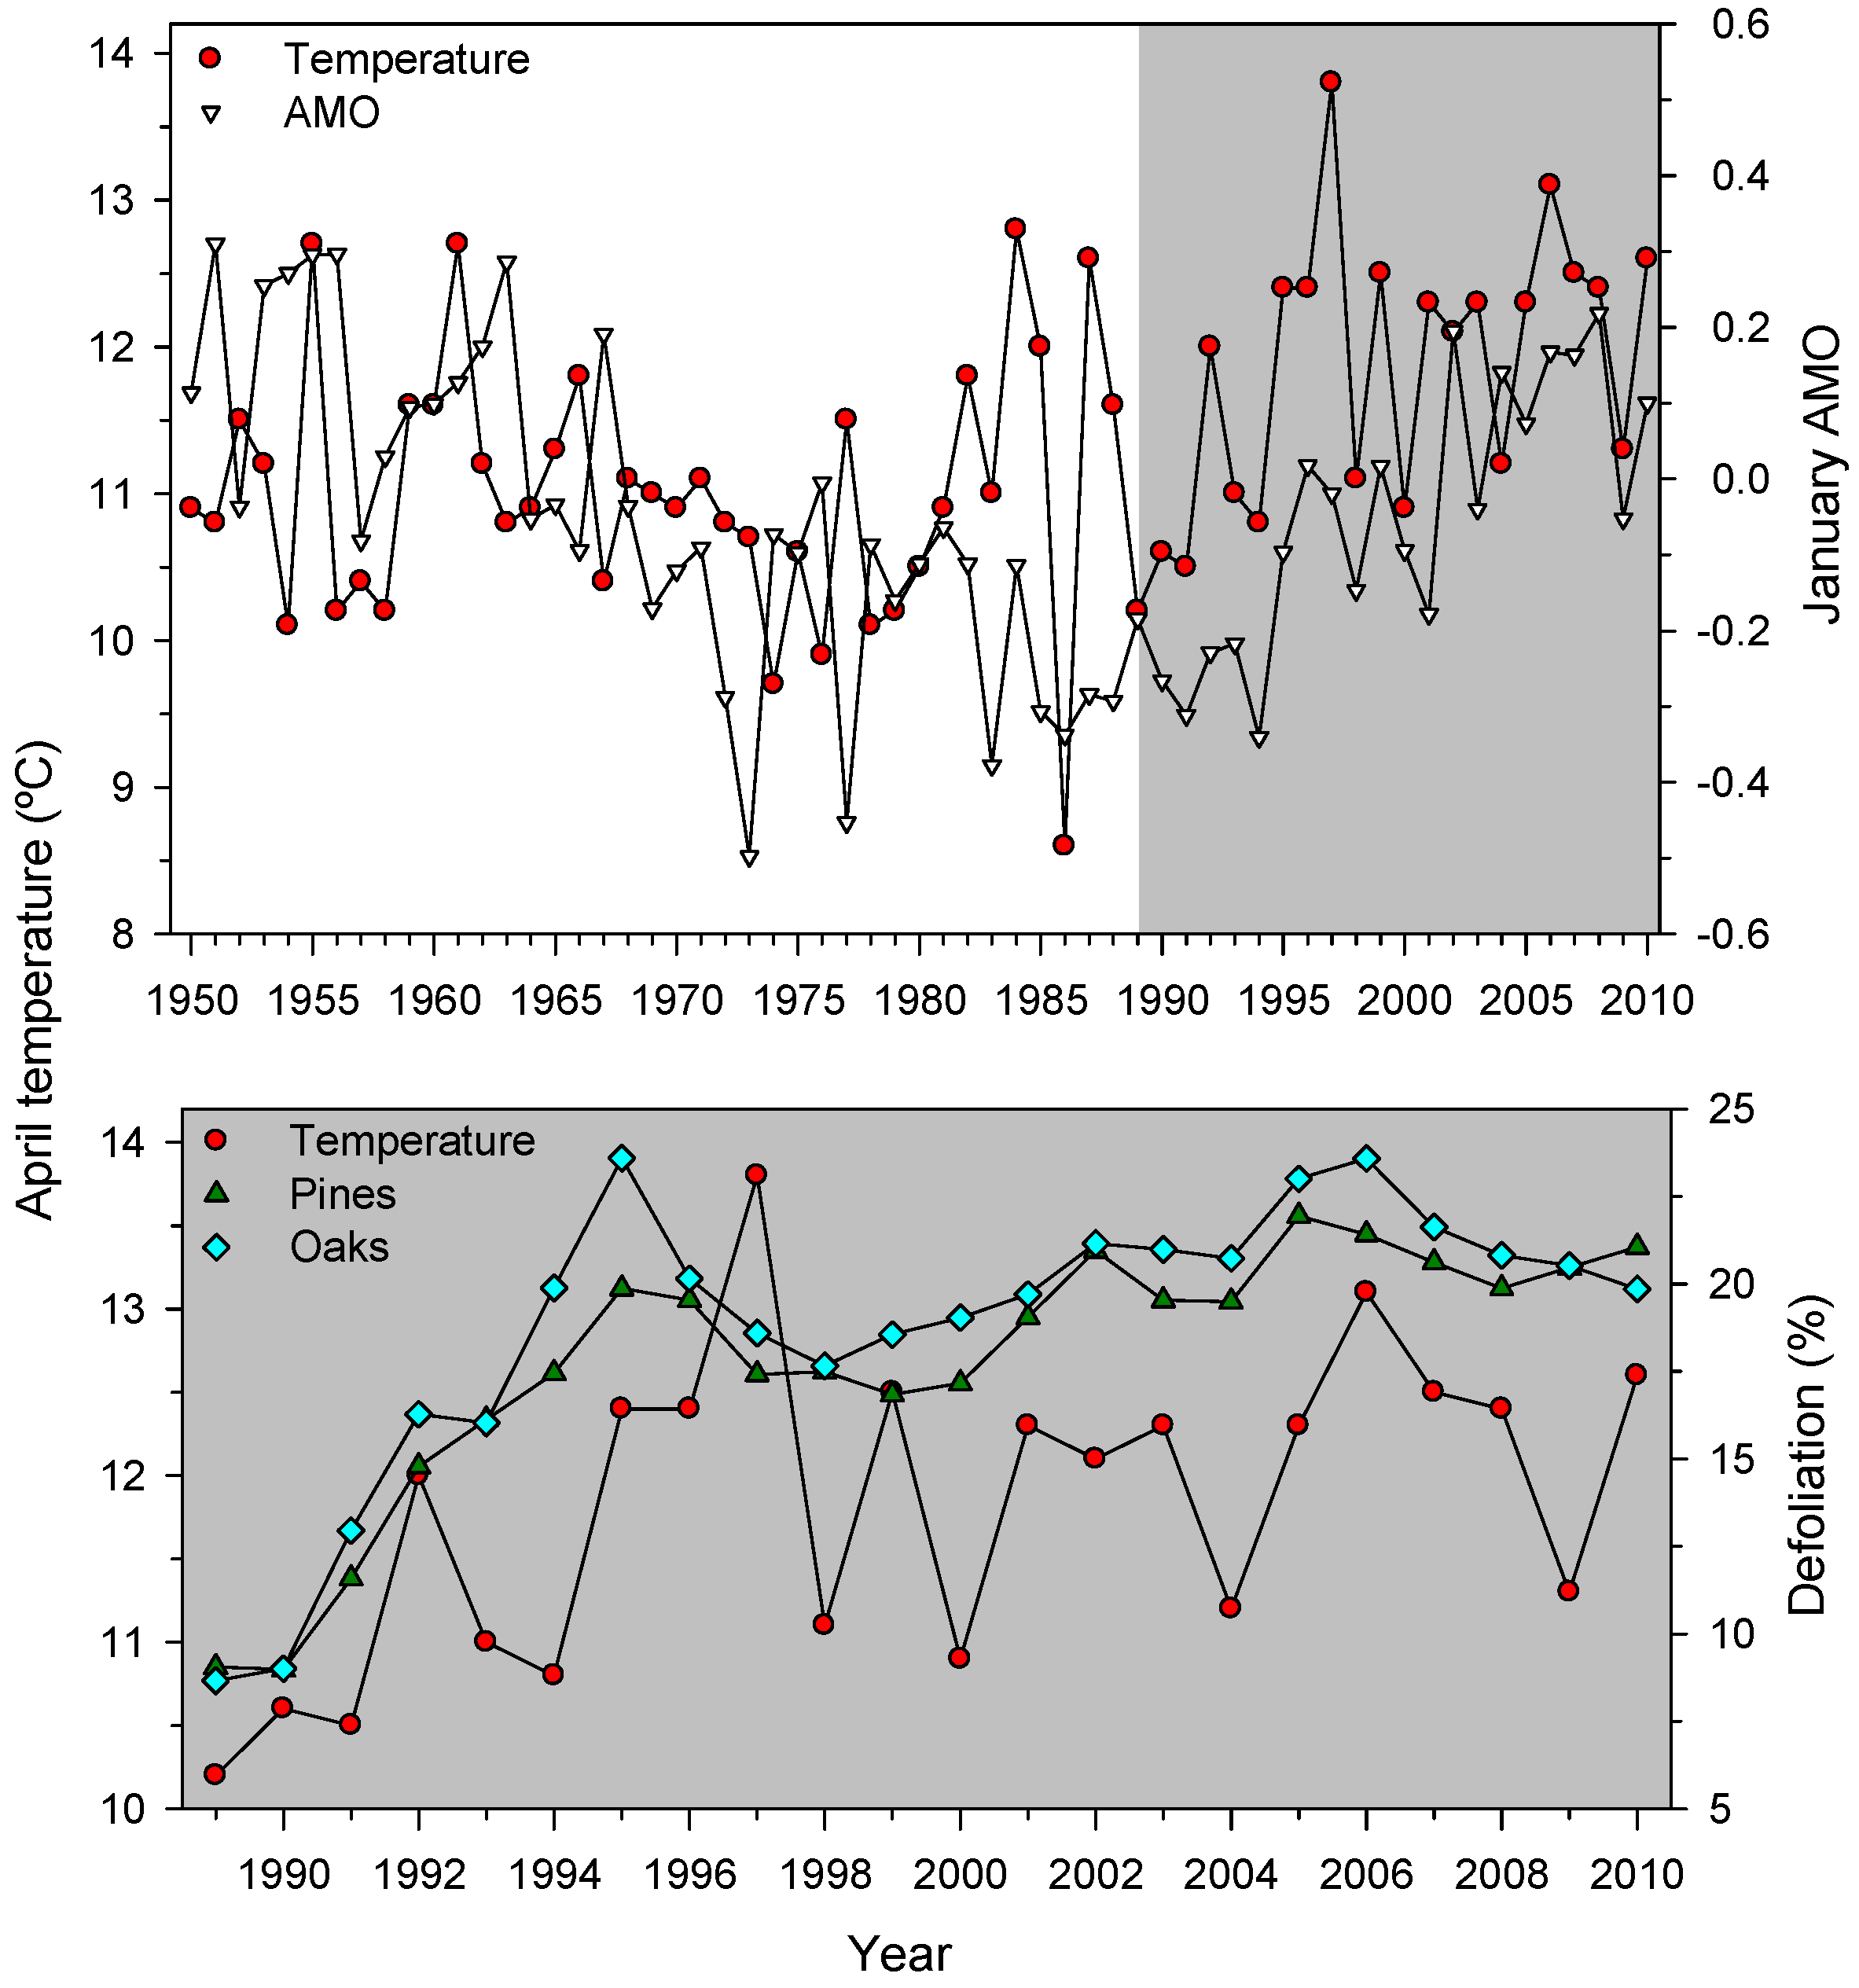
3.3. Associations between Defoliation and Atmospheric Processes

Regarding atmospheric processes and related indices (AMO, NAO, SOI) the strongest associations were found between the AMO January (pines, r = 0.77; oaks, r = 0.71; Pcorr < 0.001 in both cases) and April (pines, r = 0.76; oaks, r = 0.72; Pcorr = 0.032 in both cases) indices and the pine and oaks defoliation data. These January and April AMO indices were positively associated to April temperatures (r = 0.54, Pcorr < 0.010; Figure 4). This explains why the multiple regression models selected the January (six species) and April (four species) AMO indices as the most important variables related to defoliation (Table 6).
Defoliation series were also negatively associated to the February (pines, r = −0.58, Pcorr = 0.005; oaks, r = −0.46, Pcorr = 0.032) and August NAO indices (pines, r = −0.62, Pcorr < 0.0001; oaks, r = −0.61, Pcorr < 0.0001) (Table 6). Considering several months, pine (r = −0.63, Pcorr < 0.0001) and oak (r = −0.53, Pcorr = 0.002) defoliation were negatively associated to the mean January to March NAO index. In the case of SOI, only a marginally significance was found between oak defoliation and the May index (r = −0.41, Pcorr = 0.062). All the aforementioned correlations remained significant when calculated with the atmospheric indices of the previous year because of the important first-order autocorrelation of defoliation series (Table 3).

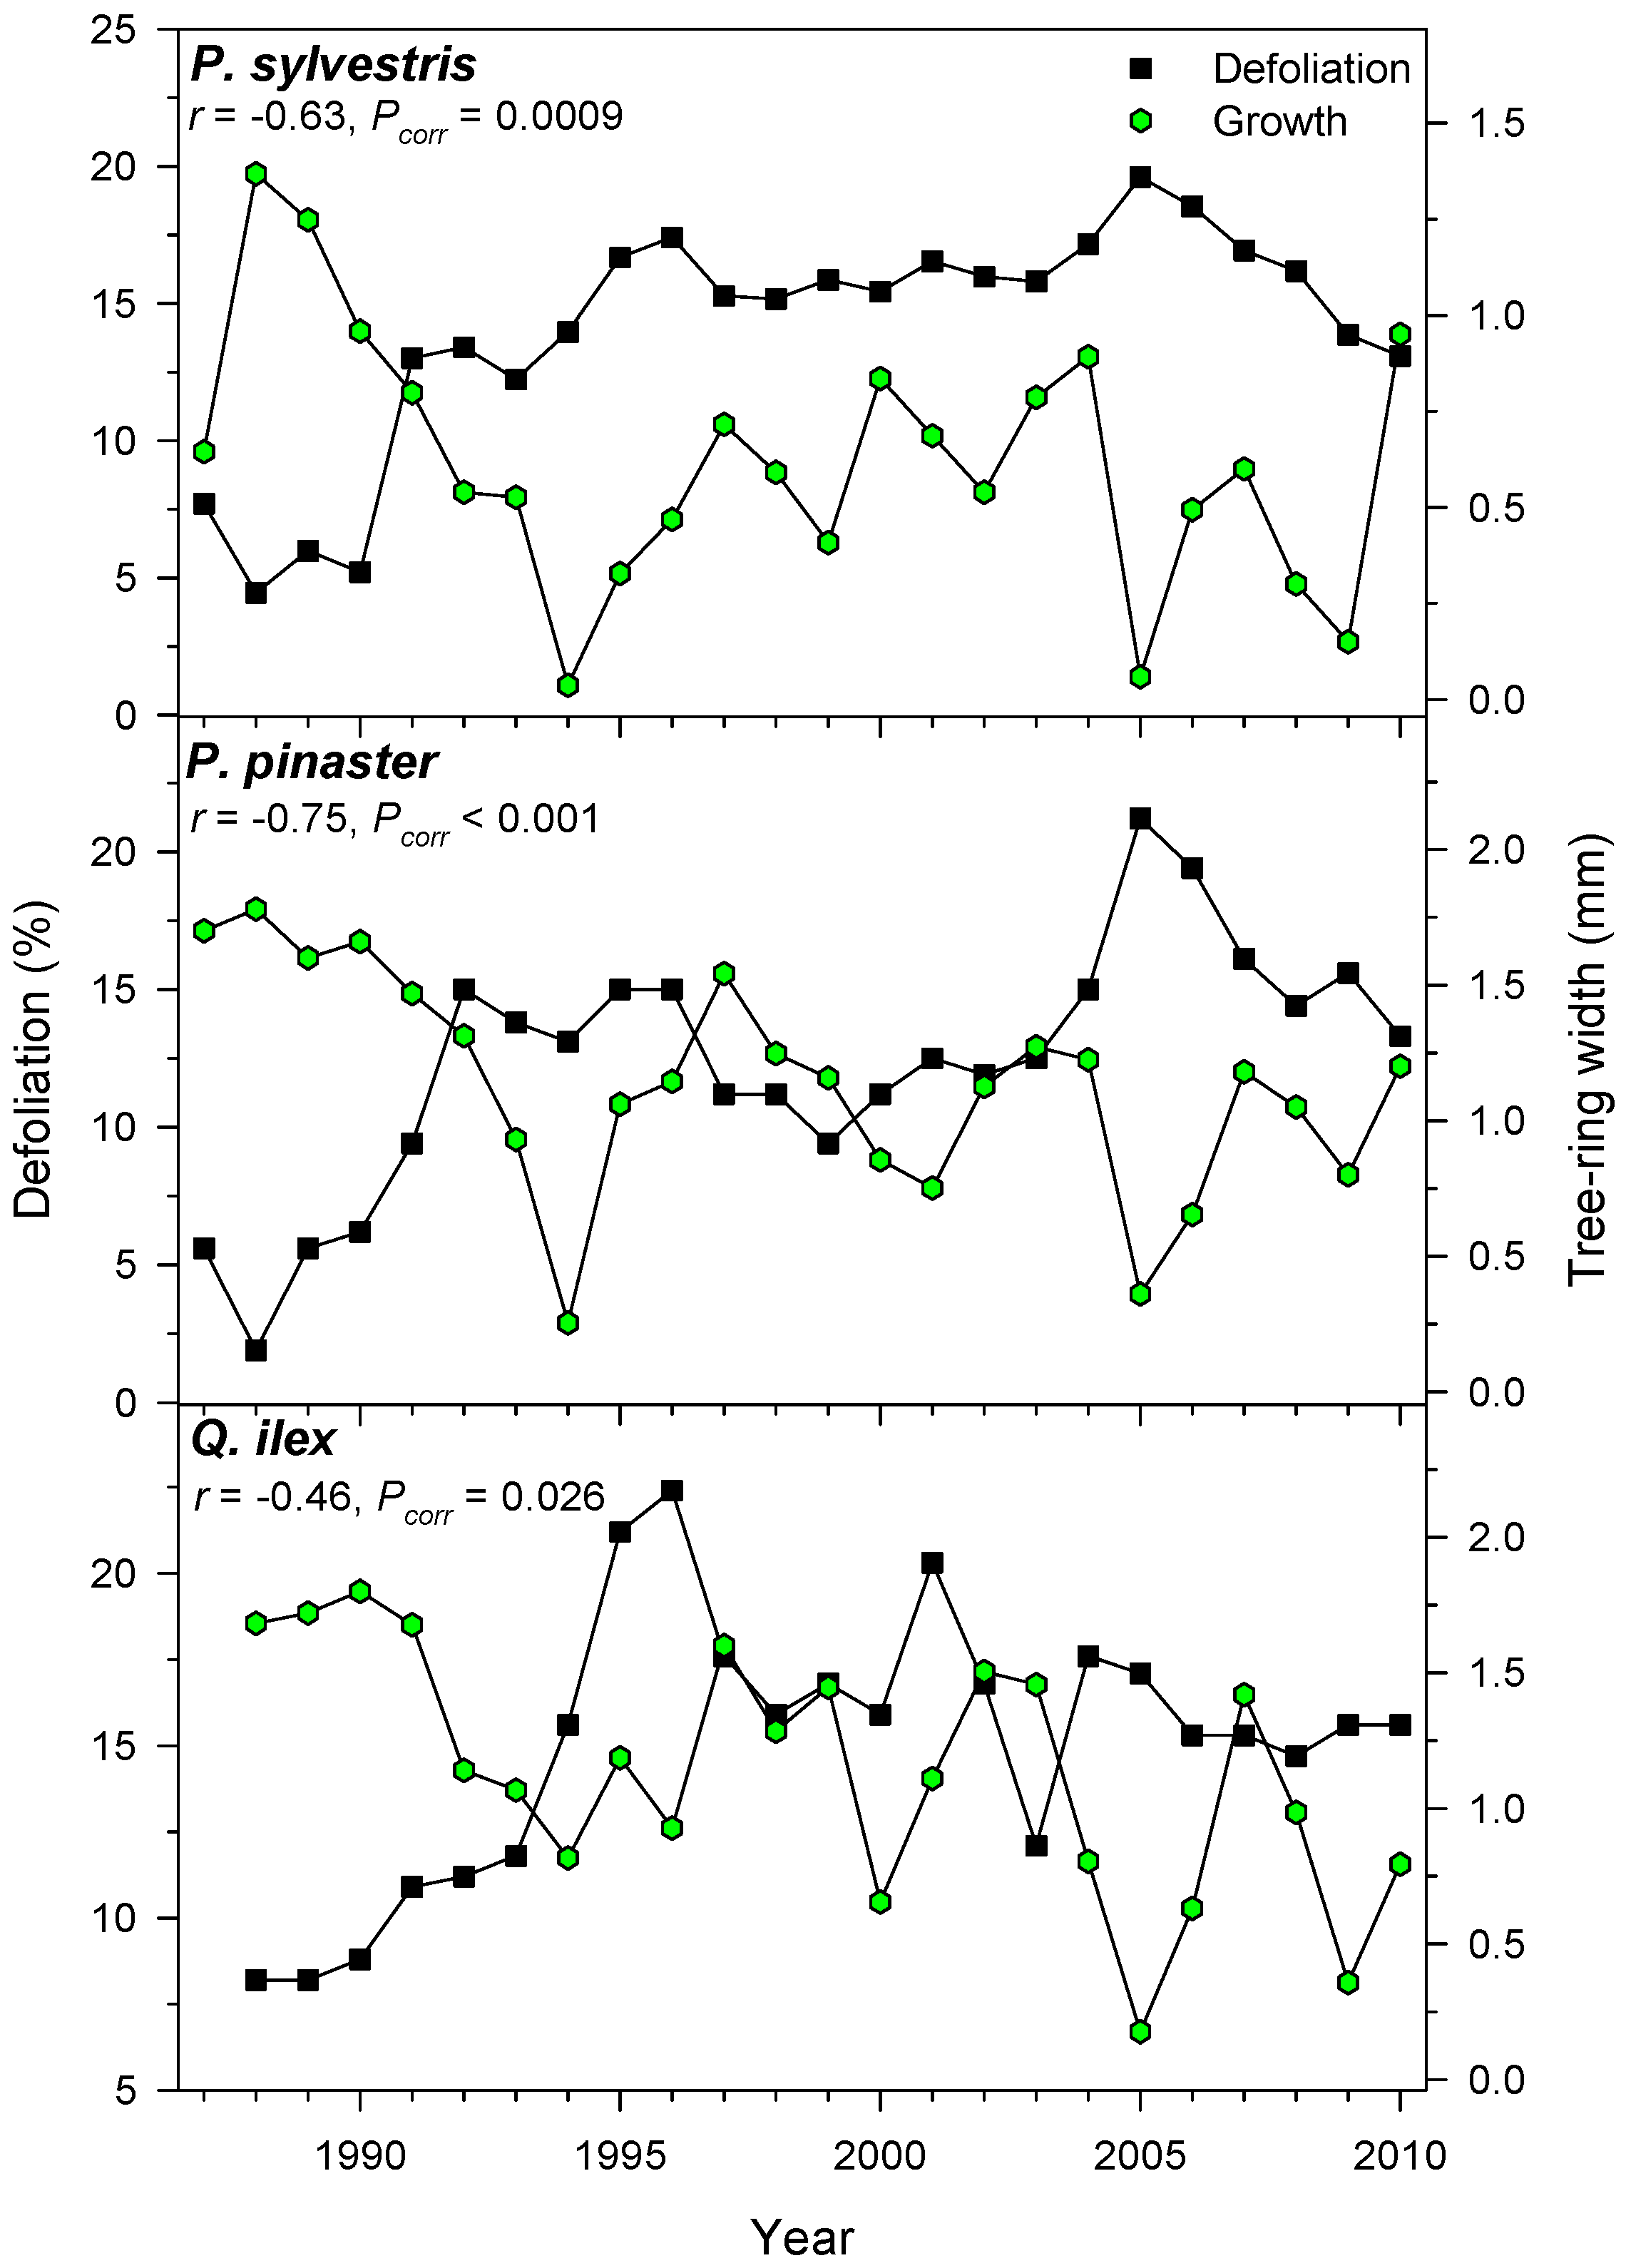
3.4. Associations between Defoliation and Tree Growth

Growth and defoliation were negatively related, but this inverse association was stronger in the case of P. pinaster or P. sylvestris than in Q. ilex selected plots (Figure 5).

4. Discussion

We found that warm spring (April) to summer (June) conditions explained to a high degree increased defoliation levels in most tree species of the sampled Spanish ICP-Forests plots. In all species, April temperature was a more important predictor of defoliation than June temperature (Table 5). Warm April conditions corresponding to high January and April AMO indices are associated to increased defoliation in Spanish forests. This finding is explained by the climatic links existing between winter sea surface temperatures over the North Atlantic Ocean and spring temperatures over the Iberian Peninsula [36]. The response of defoliation to April temperatures was general, but each species presented a different sensitivity with species dominant at mesic (e.g., Q. robur, P. nigra) and xeric (e.g., Q. ilex, P. pinaster) sites presenting low and high defoliation responses, respectively, to temperature.
Some pine (e.g., P. halepensis, P. nigra) and oak (e.g., Q. faginea, Q. ilex, Q. suber) species were very sensitive in terms of crown defoliation to warm and dry April conditions (Figure 3). These pine species are dominant in the driest regions of eastern Spain, whereas the aforementioned oak species appear in the driest and warmest areas where oak forests prevail. Most tree species showed similar defoliation trends and patterns except Q. robur, which is present in mesic forests situated in wet areas of northern and north-western Spain (Figure 1 and Table 4). This could explain why this species presented the weakest association of defoliation data with April temperature. In the case of pine species, the P. pinaster defoliation degree was linked to the summer water balance (Figure 3). This finding agrees with the pronounced sensitivity of radial growth to water shortage observed in P. pinaster [32].
Warm April conditions and severe summer drought have been already recognised as triggers of crown defoliation in Spanish forests [17,23]. Summer dry spells have been related to crown leaf shedding, dieback, and increased mortality across Mediterranean forests [14]. In a Mediterranean holm oak forest, aboveground biomass was positively associated with wet late-summer conditions as reflected by positive September SPEI values, whilst warmer spring-to-summer conditions induced dieback [45]. In southern Norway, summer drought enhanced the shedding of brown needles of Norway spruce in the following autumn, but warm winter and spring conditions were stronger drivers of green needle fall which peaked in May [12,19].
The finding that warm and dry April conditions trigger defoliation (Figure 3) indicates that high temperatures may induce leaf abscission shortly after bud break and enhance evapotranspiration in the early growing season. Heat and drought stress in spring induces leaf shedding which aids in preventing xylem embolism through segmentation of the vascular system [46]. Spring heat waves, without co-occurring dry spells, seem to be especially harmful for shade-tolerant tree species which exhibit pronounced abscission of recently formed leaves and are often less drought tolerant [8,9]. However, the study species show similar shade tolerance, except oaks, which are in general more shade tolerant than pines; this difference could explain the defoliation sensitivity to temperature of some species as Q. ilex (Table 5). Additional phenological features, such as bud-burst timing, could also explain differences between species. For instance, Q. faginea usually shows an earlier bud burst than Q. ilex when they coexist [47], which could explain why the former species responded to April drought more than the later (Figure 3). We speculate that early-flushing, shade-tolerant tree species dominating xeric sites will be very vulnerable in terms of canopy defoliation to spring heat and related drought stress. Nevertheless, this speculation does not preclude that prolonged and severe droughts cause massive leaf shedding and dieback in widely distributed drought-tolerant species as Q. ilex, as occurred after the Spanish 1994–1995, 2004–2005 (Table 3) and 2012 dry spells [27,48]. In many Spanish inland forests, trees face a double climatic stress characterized by winter coldness and summer drought [49] making trees very dependent on adequate thermal conditions and water availability during spring and fall, the two seasons most favourable to tree growth [50]. The presented results suggest that heat and drought stress during spring and summer could constrain forest productivity by enhancing leaf fall shortly after bud bursting even if leaf fall is delayed. In addition, if climate warming promotes an earlier leaf unfolding and increased synchronization of bud bursting some Iberian tree species may become more prone to heat-induced leaf damage during spring [51,52]. Finally, the stronger relationships observed between defoliation and temperatures (Table 5), as compared with those found with precipitation or the SPEI (Figure 2 and Figure 3), indicate that defoliation is being triggered by temperature effects on soil water availability through changes in evapotranspiration. Since the major primary-growth processes of Mediterranean tree species (budburst, shoot elongation, leaf development, cambium reactivation) occur in spring [47], heat and drought stress could alter those processes leading to the formation of canopy components (buds, shoots, leaves, branches) prone to show dieback. In addition, late-summer heat and drought stress could constrain fruit maturation and bud development, two phenological processes occurring during the late growing season in Mediterranean tree species [47].
We detected negative defoliation-growth associations in the selected xeric sites (Figure 5). Considering punctual defoliation estimates, it is often observed that trees with defoliation above 50%–60% thresholds reach a point-of-no-return and start showing growth decline [19,25,53]. Through time, negative, albeit weak to moderate, correlations between growth and defoliation have been reported for Norway spruce [54] and Scots pine [15]. In theory, the leaf transpiring area is related to the sapwood conducting area through hydraulic and carbon-related functional links [55]. However, this does not mean that defoliation and radial growth are necessarily related. First, defoliation does not represent the actual leaf biomass of a tree since disturbances (insect outbreaks, pollution, wind storms) can sharply modify leaf biomass and uncouple defoliation and growth [56]. Second, defoliation is a variable often showing first-order temporal autocorrelation which may show lagged responses to heat and drought stress. Third, wood formation constitutes an important carbon pool, but primary growth (bud, shoot and leaf development) has a superior rank within the tree as carbon sink [7]. In any case, longer time series of defoliation and growth data at several spatial scales (tree, plot, country) from very different forest types are required to improve further assessments of climate-defoliation-growth relationships. Nonetheless, at country and continental scales peaks in defoliation percentages, such as the one detected in 1990s (Figure 4), has also been observed across European ICP plots [57]. This suggests that large-scale factors such as temperature are plausible drivers of crown defoliation patterns. In fact, in Spain pine species show synchronous year-to-year changes in radial growth up to 300 km apart as temperature variations occur [58], and defoliation patterns present a similar range of spatial coherence [17]. Such large-scale patterns confirm the positive links found between defoliation and positive January and April AMO indices which correspond to warm spring conditions (Figure 4 and Table 6). The negative association between defoliation and January to March NAO indices could be explained by wet conditions inducing an earlier or more abundant leaf unfolding [22], which could be linked to reduced defoliation; albeit defoliation-rainfall correlations were not significant.
Additional environmental stressors could explain the analysed defoliation patterns such as air pollution, nitrogen deposition, insect outbreaks, and fungal pathogens. However, climatic factors seem the most plausible cause of country-wide synchronized defoliation patterns since pollution, nitrogen and sulphur deposition, elevated ozone levels, and pests play local and minor roles as defoliation drivers [59,60,61]. In addition, crown condition poses some limitations to assess changes in forest vitality since defoliation estimates depend on site conditions (e.g., soil texture), disturbance history (e.g., storms), forest management (e.g., thinning), tree features (e.g., tree size and dominance), and defoliation estimates may be biased by methodological uncertainties (e.g., different crown assessment between countries or field teams) [62,63,64]. After considering these shortcomings, we argue that crown defoliation in Spanish forests reflects climatic factors (spring temperatures, drought as represented by the SPEI) rather than air pollution. Our results allow tree species to be classified according to their vulnerability to climate warming based on their temperature-defoliation associations. Furthermore, the presented findings reinforce the value of extensive sampling programs for country-wide analyses such as the ICP Forests monitoring network of crown defoliation [20]. In drought-prone Spanish forests, climate stress plays a very relevant role to explain defoliation geographical patterns, as well as forest productivity patterns [20,25,26]. A similar role was also suggested for drought in mesic central European forests where the “Waldsterben” phenomenon was initially attributed to air pollution [65]. Further research efforts could integrate defoliation and growth data into models of forest mortality so as to determine the degree to which climate warming is important for the future health of forests. Recent studies indicate that warmer temperatures, rather than punctual droughts, represent the ultimate driver of long-term changes in tree mortality, as has been described in several forest biomes [66,67,68]. Since dry and heat spells co-occur, more effort should be focused to disentangle their effects on defoliation and forest growth vigour given the multiple climate alterations occurring during droughts (increased radiation, land heating, elevated amplified vapour pressure deficit). In this perspective, the presented results can provide basic knowledge to support the elaboration of adaptive management strategies under future climate scenarios.

5. Conclusions

To conclude, we confirmed that warmer and drier climate conditions during April are linked to enhanced defoliation in Spanish ICP-monitored forest plots. Such climate conditions were linked to elevated values of the Atlantic Multi-decadal Oscillation (AMO), suggesting the existence of large-scale links between atmospheric processes, April temperature, and forest defoliation patterns. The rise in AMO values is connected to warmer and drier conditions over the Iberian Peninsula and coincided with a defoliation increase after the 1990s. The observed temperature-defoliation associations changed between tree species because species dominant at wet sites showed the weakest association (e.g., Quercus robur L.), whilst congeneric species dominant at drier sites (e.g., Quercus ilex L.) showed the strongest associations. This sensitive tree species presented pronounced leaf shedding in response to heat stress during the early growing season. We also found negative associations between defoliation and radial growth in dry forests. Crown defoliation represents extensive information on tree vigour which could be used, in combination with long-term monitoring data and retrospective growth assessments, to better evaluate forest vulnerability in response to climate warming.

Acknowledgments

We thank the support of projects CGL2015-69186-C2-1-R, CGL2013-48843-C2-1-R, and RTA 2010-00065 (Spanish Ministry of Economy and Competitiveness and FEDER funds). We thank the Forest Health and Biological Balance (SSF-MAGRAMA) team (G. Sánchez, B. Torres, M. Prieto, P. García, and J. Martinez-Saavedra) and the Spanish ICP-Forests field teams (ESMA, Tecmena). We thank useful comments provided by the Editor and four anonymous reviewers.

Author Contributions

J.J.C. and R.S.-S. wrote the manuscript and share first authorship. All authors contributed to study design, discussion, and to the final writing of the manuscript. J.J.C. performed field dendrochronological sampling and analysis the tree-ring data. J.M.G., A.C.d.l.C., M.M., P.M.G., and Á.F.-C. compiled and refined the raw defoliation data and selected a reliable database for ICP-Forests network in Spain. J.J.C and R.S.-S conducted the statistical analyses.

Conflicts of Interest

The authors declare no conflict of interest.

References

  1. Intergovernmental Panel on Climate Change. Managing the Risks of Extreme Events and Disasters to Advance Climate Change Adaptation; Field, C.B., Barros, V., Stocker, T.F., Qin, D., Dokken, D.J., Ebi, K.L., Mastrandrea, M.D., Mach, K.J., Plattner, G.-K., Allen, S.K., et al., Eds.; A Special Report of Working Groups I and II of the Intergovernmental Panel on Climate Change; Cambridge University Press: Cambridge, UK; New York, NY, USA, 2012; pp. 1–582. [Google Scholar]
  2. Yao, Y.; Luo, Y.; Huang, J.; Zhao, Z. Comparison of monthly temperature extremes simulated by CMIP3 and CMIP5 models. J. Clim. 2013, 26, 7692–7707. [Google Scholar] [CrossRef]
  3. Ciais, P.; Reichstein, M.; Viovy, N.; Granier, A.; Ogée, J.; Allard, V.; Aubinet, M.; Buchmann, N.; Bernhofer, Chr.; Carrara, A.; et al. Europe-wide reduction in primary productivity caused by the heat and drought in 2003. Nature 2005, 437, 529–533. [Google Scholar] [CrossRef] [PubMed]
  4. Bréda, N.; Huc, R.; Granier, A.; Dreyer, E. Temperate forest trees and stands under severe drought: A review of ecophysiological responses, adaptation processes and long-term consequences. Ann. For. Sci. 2006, 63, 625–644. [Google Scholar] [CrossRef]
  5. Allen, C.D.; Macalady, A.K.; Chenchouni, H.; Bachelet, D.; McDowell, N.; Vennetier, M.; Kitzberger, T.; Rigling, A.; Breshears, D.D.; Hogg, E.H.; et al. A global overview of drought and heat-induced tree mortality reveals emerging climate change risks for forests. For. Ecol. Manag. 2010, 259, 660–684. [Google Scholar] [CrossRef]
  6. Allen, C.D.; Breshears, D.D.; McDowell, N.G. On underestimation of global vulnerability to tree mortality and forest die-off from hotter drought in the Anthropocene. Ecosphere 2015, 6, 129. [Google Scholar] [CrossRef]
  7. Dobbertin, M. Tree growth as indicator of tree vitality and of tree reaction to environmental stress: A review. Eur. J. For. Res. 2005, 124, 319–333. [Google Scholar] [CrossRef]
  8. Teskey, R.; Wertin, T.; Bauweraerts, I.; Ameye, M.; McGuire, M.A.; Steppe, K. Responses of tree species to heat waves and extreme heat events. Plant. Cell Environ. 2015, 38, 1699–1712. [Google Scholar] [CrossRef] [PubMed]
  9. Filewod, B.; Thomas, S.C. Impacts of a spring heat wave on canopy processes in a northern hardwood forest. Glob. Chang. Biol. 2014, 20, 360–371. [Google Scholar] [CrossRef] [PubMed]
  10. Camarero, J.J.; Franquesa, M.; Sangüesa-Barreda, G. Timing of drought triggers distinct growth responses in holm oak: Implications to predict warming-induced forest defoliation and growth decline. Forests 2015, 6, 1576–1597. [Google Scholar] [CrossRef]
  11. Heide, O.M. High autumn temperature delays spring bud burst in boreal trees, counterbalancing the effect of climatic warming. Tree Physiol. 2003, 23, 931–936. [Google Scholar] [CrossRef] [PubMed]
  12. Solberg, S. Summer drought: A driver for crown condition and mortality of Norway spruce in Norway. For. Pathol. 2004, 34, 93–104. [Google Scholar] [CrossRef]
  13. Seidling, W. Signals of summer drought in crown condition data from the German Level I network. Eur. J. For. Res. 2007, 126, 529–544. [Google Scholar] [CrossRef]
  14. Carnicer, J.; Coll, M.; Ninyerola, M.; Pons, X.; Sánchez, G.; Peñuelas, J. Widespread crown condition decline, food web disruption, and amplified tree mortality with increased climate change-type drought. Proc. Natl. Acad. Sci. USA 2011, 108, 1474–1478. [Google Scholar] [CrossRef] [PubMed]
  15. Seidling, W.; Ziche, D.; Beck, W. Climate responses and interrelations of stem increment and crown transparency in Norway spruce, Scots pine, and common beech. For. Ecol. Manag. 2012, 284, 196–204. [Google Scholar] [CrossRef]
  16. Ferretti, M.; Nicolas, M.; Bacaro, G.; Brunialti, G.; Calderisi, M.; Croisé, L.; Frati, L.; Lanier, M.; Maccherini, S.; Santi, E.; et al. Plot-scale modelling to detect size, extent, and correlates of changes in tree defoliation in French high forests. For. Ecol. Manag. 2014, 311, 56–69. [Google Scholar] [CrossRef]
  17. De la Cruz, A.C.; Gil, P.M.; Fernandez-Cancio, A.; Minaya, M.; Navarro-Cerrillo, R.M.; Sanchez-Salguero, R.; Grau, J.M. Defoliation triggered by climate induced effects in Spanish ICP Forests monitoring plots. For. Ecol. Manag. 2014, 331, 245–255. [Google Scholar] [CrossRef]
  18. Solberg, S.; Aamlid, D.; Tveito, O.E.; Lystad, S. Increased needle fall and defoliation in Norway spruce induced by warm and dry weather. Boreal Environ. Res. 2015, 20, 335–349. [Google Scholar]
  19. Drobyshev, I.; Linderson, H.; Sonesson, K. Relationship between crown condition and tree diameter growth in Southern Swedish oaks. Environ. Monit. Assess. 2007, 128, 61–73. [Google Scholar] [CrossRef] [PubMed]
  20. Sánchez-Salguero, R.; Camarero, J.J.; Dobbertin, M.; Fernández-Cancio, A.; Vilà-Cabrera, A.; Manzanedo, R.D.; Zavala, M.A.; Navarro-Cerillo, R.M. Contrasting vulnerability and resilience to drought-induced decline of densely planted vs. natural rear-edge Pinus nigra forests. For. Ecol. Manag. 2013, 310, 956–967. [Google Scholar] [CrossRef]
  21. Camarero, J.J. Direct and Indirect Effects of the North Atlantic Oscillation on Tree Growth and Forest Decline in Northeastern Spain. In Hydrological, Socioeconomic and Ecological Impacts of the North Atlantic Oscillation in the Mediterranean Region; Vicente-Serrano, S.M., Trigo, R.M., Eds.; Advances in Global Change Research; Springer: Berlin/Heidelberg, Germany, 2011; Volume 46, pp. 129–152. [Google Scholar]
  22. Gordo, O.; Sanz, J.J. Impact of climate change on plant phenology in Mediterranean ecosystems. Glob. Chang. Biol. 2010, 16, 1082–1106. [Google Scholar] [CrossRef]
  23. Peñuelas, J.; Lloret, F.; Montoya, R. Severe drought effects on Mediterranean woody flora in Spain. For. Sci. 2001, 47, 214–218. [Google Scholar]
  24. Lloret, F.; Siscart, D.; Dalmases, C. Canopy recovery after drought dieback in holm-oak Mediterranean forests of Catalonia (NE Spain). Glob. Chang. Biol. 2004, 10, 2092–2099. [Google Scholar] [CrossRef]
  25. Sánchez-Salguero, R.; Navarro-Cerillo, R.M.; Camarero, J.J.; Fernández-Cancio, A. Selective drought-induced decline of pine species in southeastern Spain. Clim. Chang. 2012, 113, 767–785. [Google Scholar] [CrossRef]
  26. Camarero, J.J.; Gazol, A.; Sangüesa-Barreda, G.; Oliva, J.; Vicente-Serrano, S.M. To die or not to die: Early-warning signals of dieback in response to a severe drought. J. Ecol. 2015, 103, 44–57. [Google Scholar] [CrossRef]
  27. Camarero, J.J.; Sangüesa-Barreda, G.; Vergarechea, M. Prior height, growth, and wood anatomy differently predispose to drought-induced dieback in two Mediterranean oak species. Ann. For. Sci. 2016, 73, 341–351. [Google Scholar] [CrossRef]
  28. ICP Forests. International Co-Operative Programme on Assessment and Monitoring of Air Pollution Effects on Forests Operating under the UNECE Convention on Long-Range Transboundary Air Pollution, 2016. Available online: http://icp-forests.net/ (accessed on 12 October 2016).
  29. Blanco-Castro, E.; Casado González, M.A.; Costa Tenorio, M. Los Bosques Ibéricos: Una Interpretación Geobotánica; GeoPlaneta: Barcelona, Spain, 1997. [Google Scholar]
  30. Ninyerola, M.; Pons, X.; Roure, J.M. Monthly precipitation mapping of the Iberian peninsula using spatial interpolation tools implemented in a geographic information system. Theor. Appl. Climatol. 2006, 89, 195–209. [Google Scholar] [CrossRef] [Green Version]
  31. Eichhorn, J.; Roskams, P.; Ferretti, M.; Mues, V.; Szepesi, A.; Durrant, D. Visual Assessment of Crown Condition and Damaging Agents. Manual Part IV, In Manual on Methods and Criteria for Harmonized Sampling, Assessment, Monitoring and Analysis of the Effects of Air Pollution on Forests. UNECE ICP Forests Programme Coordinating Centre, Hamburg, 2010. Available online: http://www.icp-forests.org/Manual.htm (accessed on 12 October 2016).
  32. Camarero, J.J.; Gazol, A.; Tardif, J.C.; Conciatori, F. Attributing forest responses to global-change drivers: Limited evidence of a CO2-fertilization effect in Iberian pine growth. J. Biogeogr. 2015, 42, 2220–2233. [Google Scholar] [CrossRef]
  33. Holmes, R.L. Computer-assisted quality control in tree-ring dating and measurement. Tree-Ring Bull. 1983, 43, 69–78. [Google Scholar]
  34. Vicente-Serrano, S.M.; Beguería, S.; López-Moreno, J.I.A. Multi-scalar drought index sensitive to global warming: The Standardized Precipitation Evapotranspiration Index—SPEI. J. Clim. 2010, 23, 1696–1718. [Google Scholar] [CrossRef]
  35. Beguería, S.; Latorre, B.; Reig, F.; Vicente-Serrano, S.M. SPEI Global Drought Monitor. Available online: http://sac.csic.es/spei/map/maps.html (accessed on 12 October 2016).
  36. Enfield, D.B.; Mestas-Nunez, A.M.; Trimble, P.J. The Atlantic Multidecadal Oscillation and its relationship to rainfall and river flows in the continental US. Geophys. Res. Lett. 2001, 28, 2077–2080. [Google Scholar] [CrossRef]
  37. Trenberth, K.; Shea, D.J. Atlantic hurricanes and natural variability in 2005. Geophys. Res. Lett. 2006, 33, L12704. [Google Scholar] [CrossRef]
  38. Hurrell, J. Decadal trends in North Atlantic Oscillation and relationship to regional temperature and precipitation. Science 1995, 269, 676–679. [Google Scholar] [CrossRef] [PubMed]
  39. Sáenz, J.; Rodríguez-Puebla, C.; Fernández, J.; Zubillaga, J. Interpretation of interannual winter temperature variations over southwestern Europe. J. Geophys. Res. 2001, 106, 20641–20651. [Google Scholar] [CrossRef]
  40. Rodó, X.; Baert, E.; Comin, F. Variations in seasonal rainfall in Southern Europe during the present century: Relationships with the North Atlantic Oscillation and the El Niño-Southern Oscillation. Clim. Dyn. 1997, 13, 275–284. [Google Scholar] [CrossRef]
  41. ESRL-NOAA. Earth System Research Laboratory. Available online: http://www.esrl.noaa.gov/psd/ (accessed on 12 October 2016).
  42. Venables, W.N.; Ripley, B.D. Modern Applied Statistics with S; Springer: New York, NY, USA, 2002. [Google Scholar]
  43. Mudelsee, M. Estimating Pearson’s correlation coefficient with bootstrap confidence interval from serial dependent time series. Math. Geol. 2002, 35, 651–665. [Google Scholar] [CrossRef]
  44. R Development Core Team. R: A Language and Environment for Statistical Computing; R Foundation for Statistical Computing: Vienna, Austria, 2016. [Google Scholar]
  45. Ogaya, R.; Barbeta, A.; Basnou, C.; Penuelas, J. Satellite data as indicators of tree biomass growth and forest dieback in a Mediterranean holm oak forest. Ann. For. Sci. 2015, 72, 135–144. [Google Scholar] [CrossRef]
  46. Tyree, M.T.; Cochard, H.; Cruizat, P.; Sinclair, B.; Ameglio, T. Drought-induced leaf shedding in walnut: Evidence for vulnerability segmentation. Plant Cell Environ. 1993, 16, 879–882. [Google Scholar] [CrossRef]
  47. Montserrat-Martí, G.; Camarero, J.J.; Palacio, S.; Pérez-Rontomé, C.; Milla, R.; Albuixech, J.; Maestro, M. Summer-drought constrains the phenology and growth of two co-existing Mediterranean oaks with contrasting leaf habit: Implications for their persistence and reproduction. Trees Struct. Funct. 2009, 23, 787–799. [Google Scholar] [CrossRef] [Green Version]
  48. Corcuera, L.; Camarero, J.J.; Gil-Pelegrín, E. Effects of a severe drought on Quercus ilex radial growth and xylem anatomy. Trees Struct. Funct. 2004, 18, 83–92. [Google Scholar]
  49. Sánchez-Salguero, R.; Camarero, J.J.; Hevia, A.; Madrigal-González, J.; Linares, J.C.; Ballesteros-Canovas, J.A.; Sánchez-Miranda, A.; Alfaro-Sánchez, R.; Sangüesa-Barreda, S.; Galván, J.D.; et al. What drives growth of Scots pine in continental Mediterranean climates: Drought, low temperaturas or both? Agric. For. Meteorol. 2015, 206, 151–162. [Google Scholar] [CrossRef]
  50. Camarero, J.J.; Olano, J.M.; Parras, A. Plastic bimodal xylogenesis in conifers from continental Mediterranean climates. New Phytol. 2010, 185, 471–480. [Google Scholar] [CrossRef] [PubMed]
  51. Peñuelas, J.; Filella, I.; Comas, P. Changed plant and animal life cycles from 1952 to 2000 in the Mediterranean region. Glob. Chang. Biol. 2002, 8, 531–544. [Google Scholar] [CrossRef]
  52. Gordo, O.; Sanz, J.J. Long-term temporal changes of plant phenology in the Western Mediterranean. Glob. Chang. Biol. 2009, 15, 1930–1948. [Google Scholar] [CrossRef]
  53. Fischer, R.; Barbosa, P.; Bastrup-Birk, A.; Becher, G.; Dobbertin, M.; Ferretti, M.; Flot, J.L.; Garcia-Fernandez, P.; Gerosa, G.; Gilbert, J.-M.; et al. The Conditions of Forests in Europe; 2004 Executive Report; United Nations Economic Commission for Europe (UNECE): Geneva, Switzerland, 2004; pp. 1–52. [Google Scholar]
  54. Solberg, S. Crown condition and growth relationships within stands of Picea abies. Scand. J. For. Res. 1999, 14, 320–327. [Google Scholar] [CrossRef]
  55. Mencuccini, M.; Grace, J. Climate influences the leaf area/sapwood area ratio in Scots pine. Tree Physiol. 1995, 15, 1–10. [Google Scholar] [CrossRef] [PubMed]
  56. Sander, C.; Eckstein, D. Foliation of spruce in the Giant Mts. and its coherence with growth and climate over the last 100 years. Ann. For. Sci. 2001, 58, 155–164. [Google Scholar] [CrossRef]
  57. Michel, A.; Seidling, W.; Lorenz, M.; Becher, G. (Eds.) Forest Condition in Europe: 2013 Technical Report of ICP Forests; Report under the UNECE Convention on Long-Range Transboundary Air Pollution (CLRTAP); Thünen Working Paper 19; Johann Heinrich von Thünen-Institut: Eberswalde/Hamburg, Germany, 2014; p. 134.
  58. Shestakova, T.A.; Gutiérrez, E.; Kirdyanov, A.V.; Camarero, J.J.; Génova, M.; Knorre, A.A.; Linares, J.C.; Resco de Dios, V.; Sánchez-Salguero, R.; Voltas, J. Forests synchronize their growth in contrasting Eurasian regions in response to climate warming. Proc. Natl. Acad. Sci. USA 2016, 113, 662–667. [Google Scholar] [CrossRef] [PubMed]
  59. Hódar, J.A.; Castro, J.; Zamora, R. Pine processionary caterpillar Thaumetopoea pityocampa as a new threat for relict Mediterranean Scots pine forests under climatic warming. Biol. Conserv. 2003, 110, 123–129. [Google Scholar] [CrossRef]
  60. Sanz, M.J.; Calatayud, V.; Sánchez-Peña, G. Ozone concentrations measured by passive sampling at the intensive monitoring plots of South Western Europe. Environ. Pollut. 2007, 145, 620–628. [Google Scholar] [CrossRef] [PubMed]
  61. Molina, J.; Sánchez, G.; Prieto, M.; Soriano, A.; García, P.; Minaya, M.; de la Cruz, A.C. Caracterización de la Deposición Atmosférica en Varios Ecosistemas Forestales Españoles a Través de la Red CE de Nivel II, 6th ed.; Spanish Forest Congress: Vitoria-Gasteiz, Spain, 2013. [Google Scholar]
  62. Innes, J.L. Forest Health: Its Assessment and Status; Commonwealth Agricultural Bureau: Wallingford, CT, USA, 1993. [Google Scholar]
  63. Ferretti, M. Potential and limitations of visual indices of tree condition. Chemosphere 1998, 36, 1031–1036. [Google Scholar] [CrossRef]
  64. Johnson, J.; Jacob, M. Monitoring the effects of air pollution on forest condition in Europe: Is crown defoliation an adequate indicator? iForest 2010, 3, 86–88. [Google Scholar] [CrossRef]
  65. Cramer, H.H. On the predisposition to disorders of Middle European forests. Planzenshutz-Nachr. Bayer 1984, 2, 97–207. [Google Scholar]
  66. Phillips, O.L.; Baker, T.R.; Arroyo, L.; Higuchi, N.; Killeen, T.J.; Laurance, W.F.; Lewis, S.L.; Lloyd, J.; Malhi, Y.; Monteagudo, A.; et al. Pattern and process in Amazon tree turnover, 1976–2001. Philos. Trans. R. Soc. Lond. Ser. B Biol. Sci. 2004, 359, 381–407. [Google Scholar] [CrossRef] [PubMed]
  67. Williams, A.P.; Allen, C.D.; Macalady, A.K.; Griffin, D.; Woodhouse, C.A.; Meko, D.M.; Swetnam, T.W.; Rauscher, S.A.; Seager, R.; Grissino-Mayer, H.D.; et al. Temperature as a potent driver of regional forest drought stress and tree mortality. Nat. Clim. Chang. 2013, 3, 292–297. [Google Scholar] [CrossRef]
  68. Luo, Y.; Chen, H.Y.H. Climate change-associated tree mortality increases without decreasing water availability. Ecol. Lett. 2015, 18, 1207–1215. [Google Scholar] [CrossRef] [PubMed]
Figure 1. Distribution maps of the ten tree species studied in Spain (five pines and five oaks) and location of the International Co-operative Programme (ICP) forest plots used to obtain defoliation data (black circles). The maps for the combined distribution and plots of pine and oak species are also shown. The dotted box drawn in the Quercus spp. map shows the location of sites where the relationship between defoliation and growth was analysed (southern Teruel, Iberian System) (see Section 2.3).
Forests 08 00013 g001
Figure 2. Contour plots showing the correlations (Pearson coefficients) calculated by relating the mean defoliation series of two selected pine and oak species or the means for all pine and oak species and the Standardized Precipitation-Evapotranspiration Index (SPEI) drought index. Correlations were obtained for SPEI indices calculated for one- to nine-month long scales (x-axes) during the growing season from April to September (y-axes). Correlation values which are higher than |0.25| are significant at p < 0.05.
Forests 08 00013 g002
Figure 3. Box plots showing the correlations (Pearson coefficients) calculated by relating the mean defoliation series of each tree species or group and the April SPEI drought index considering 1- to 12-month long time scales. Different colours correspond to pine (dark-green boxes and symbols); and oak (dark-red boxes and symbols) species, respectively. The SPEI was calculated considering all months and 12-long month scales. The lowermost figure show the most negative correlations observed for specific SPEI temporal scales (bars, right y-axis) and months (symbols, left y-axis). In the uppermost plot the dashed lines show the 0.05 and 0.01 significance levels.
Forests 08 00013 g003
Figure 4. Temporal trends of mean April temperature (left y-axis) across Spain and the January AMO index (right y-axis, top figure). The lowermost plot shows the positive association observed between April temperature and the mean defoliation series of pine and oak species. The grey background highlights the 1989–2010 study period.
Forests 08 00013 g004
Figure 5. Defoliation and radial growth are negatively related. Plots show selected results for three stands of three different tree species. The Pearson correlation coefficient (r) and its corrected significance level (Pcorr) are shown.
Forests 08 00013 g005
Table 1. Mean (±SD, standard deviation) topographic, climatic, and structural characteristics of the ICP Forests plots (Levels I and II) where crown defoliation was assessed across Spain for ten tree species during the 1989–2010 period. Climate data was averaged (temperature) or summed (precipitation) for the 1989–2010 period. The number of plots and trees correspond to size samples used in the following analyses.
Tree Species or GroupElevation (m)Slope (°)No. Plots (No. Trees)Mean Annual Temperature (°C)Total Annual Precipitation (mm)DBH (cm) *
Pinus halepensis675 ± 33424 ± 17118 (3193)14.2 ± 1.7502 ± 13324.5 ± 10.4
Pinus nigra1022 ± 31623 ± 1883 (1863)11.7 ± 1.4610 ± 13124.2 ± 9.9
Pinus pinaster671 ± 39516 ± 1599 (3092)13.2 ± 1.6840 ± 43330.4 ± 11.4
Pinus pinea574 ± 29313 ± 1134 (750)14.4 ± 2.2551 ± 11827.2 ± 8.9
Pinus sylvestris1250 ± 32431 ± 2084 (2126)9.6 ± 1.9825 ± 26626.1 ± 10.2
Quercus faginea873 ± 28727 ± 1956 (643)12.3 ± 1.9610 ± 15021.5 ± 11.6
Quercus ilex722 ± 30020 ± 18213 (4465)13.8 ± 2.2584 ± 12926.2 ± 14.3
Quercus pyrenaica978 ± 23218 ± 1755 (1366)11.1 ± 2.0749 ± 19421.2 ± 10.3
Quercus robur455 ± 28532 ± 2636 (545)12.6 ± 1.51225 ± 24331.2 ± 19.6
Quercus suber425 ± 23519 ± 1542 (716)15.6 ± 1.3661 ± 15835.6 ± 19.5
Oaks720 ± 32523 ± 19402 (7735)13.1 ± 1.8765 ± 17526.1 ± 14.9
Pines837 ± 41322 ± 18418 (11024)12.6 ± 1.9666 ± 21626.4 ± 10.7
* Diameter at breast height (DBH) measured at 1.3 m in 2008.
Table 2. Features of the study sites where tree-ring data was collected in eastern Spain (south Teruel) selected for analysing mean defoliation-growth associations. The mean tree-ring width and defoliation (±SD, standard deviation) were calculated for the common 1989–2010 period. Defoliation data were obtained from the ICP plots located nearest to the sampling sites (see Figure 1).
Tree SpeciesSite (Code)Latitude (N)Longitude (W)Elevation (m)No. Trees
(No. Cores)
Mean Tree-Ring Width (mm)Defoliation (%)
P. pinasterValle de Cabra (VC)40°18′0°47′116515 (30)1.25 ± 0.6011.8 ± 4.7
P. sylvestrisAlcalá de la Selva (AL)40°21′0°46′135022 (44)0.65 ± 0.3321.9 ± 13.9
Q. ilexMora de Rubielos (MR)40°16′0°48′105015 (26)1.22 ± 0.6315.0 ± 3.9
Table 3. Descriptive statistics of crown defoliation of the tree species and taxonomic groups (oaks, pines) calculated for the 1989–2010 study period. The sample size is specified in Table 1.
Tree Species or GroupMaximum Defoliation (Year)Mean ± SD Defoliation (%)Coefficient of VariationFirst-Order AutocorrelationTrend, Kendall τ (p)
Pinus halepensis24.2 (2005)18.3 ± 4.40.240.740.61 (<0.001)
Pinus nigra21.0 (1996)17.7 ± 2.80.160.540.43 (0.005)
Pinus pinaster19.9 (2005)14.8 ± 3.30.220.860.73 (0.0001)
Pinus pinea28.6 (2010)17.9 ± 5.30.290.680.72 (0.0001)
Pinus sylvestris19.0 (2006)15.4 ± 3.20.210.780.49 (0.001)
Quercus faginea29.5 (1995)20.7 ± 4.90.240.650.46 (0.003)
Quercus ilex24.2 (1995)19.2 ± 4.10.210.750.47 (0.002)
Quercus pyrenaica22.1 (2006)17.6 ± 3.70.210.670.64 (<0.001)
Quercus robur23.0 (2004)18.4 ± 3.30.180.610.38 (0.012)
Quercus suber32.1 (1995)21.6 ± 6.00.280.700.45 (0.004)
Oaks24.7 (1995)19.5 ± 4.10.210.740.72 (0.0001)
Pines24.2 (2005)16.8 ± 3.50.210.780.72 (0.0001)
Table 4. Mean correlations calculated between the crown defoliation series of each tree species and taxonomic group considering the common 1989–2010 period. All correlations have significance levels lower than p = 0.01 except those shown as grey characters which had 0.01 < p < 0.20.
Tree Species or GroupP. sylvestrisP. nigraP. pinasterP. pineaP. halepensisQ. roburQ. pyrenaicaQ. fagineaQ. ilexQ. suberPines
P. sylvestris
P. nigra0.65
P. pinaster0.870.77
P. pinea0.820.640.92
P. halepensis0.760.720.900.89
Q. robur0.670.670.620.560.48
Q. pyrenaica0.810.560.870.590.900.40
Q. faginea0.870.610.810.800.830.430.82
Q. ilex0.680.700.770.760.920.450.780.80
Q. suber0.750.580.780.770.880.310.780.810.83
Pines0.760.720.900.890.950.480.890.860.920.88
Oaks0.850.690.850.840.940.610.860.970.900.840.94
Table 5. Selected statistics of multiple stepwise regression models of tree defoliation (based on forward selection) as a function of monthly significant climatic variable (T, mean temperature; P, precipitation). Months are indicated by three-letter codes and the “t − 1” subscript indicates the previous year. Analysed data correspond to the 1989–2010 period.
Tree Species or GroupSelected Model of Tree Defoliationt Ratio of First-Selected Variable (p)R2 Adj
Pinus halepensis−53.60 + 3.88 TApr + 1.50 TJun − 0.25 PJulTApr, 5.67 (<0.0001)0.64
Pinus nigra−19.95 + 2.98 TApr + 0.65 TJun − 0.03 PNovt−1TApr, 5.60 (<0.0001)0.61
Pinus pinaster−42.18 + 2.66 TApr + 1.43 TJun − 0.19 PJulTApr, 5.45 (<0.0001)0.67
Pinus pinea−56.31 + 2.74 TApr + 1.22 TJun − 0.37 PJulTApr, 5.46 (<0.0001)0.56
Pinus sylvestris−29.59 + 1.98 TApr + 1.07 TJunTApr, 3.50 (0.003)0.42
Quercus faginea−43.51 + 2.71 TApr + 1.31 TJunTApr, 4.82 (0.0001)0.40
Quercus ilex−27.14 + 3.90 TApr + 1.69 TJun − 1.25 TSept−1TApr, 6.02 (<0.0001)0.71
Quercus pyrenaica−0.31 + 2.46 TApr + 1.46 TMar − 0.14 PAugTApr, 4.52 (0.0003)0.52
Quercus robur7.45 + 1.54 TApr + 1.21 TJun − 1.39 TJulTApr, 2.43 (0.0256)0.35
Quercus suber−23.73 + 2.91 TApr + 2.37 TJun − 2.51 TSept−1TApr, 5.42 (<0.0001)0.63
Oaks−21.97 + 3.07 TApr + 1.67 TJun − 0.04 PNovt−1TApr, 5.70 (<0.0001)0.69
Pines−40.82 + 3.23 TApr + 1.14 TJun − 0.21 PJulTApr, 5.92 (<0.0001)0.66
Table 6. Selected statistics of multiple stepwise forward regression models of tree defoliation as a function of monthly values of indices reflecting atmospheric processes (NAO, AMO, SOI). Months are indicated by three-letter codes and the “t − 1” subscript indicates the previous year.
Tree Species or GroupSelected Model of Tree Defoliationt Ratio of First-Selected Variable (p)R2Adj
Pinus halepensis14.62 + 15.46 AMOAprAMOApr, 5.08 (<0.0001)0.54
Pinus nigra17.05 + 5.22 AMOJan − 1.11 SOIMay − 0.73 NAOJanAMOJan, 5.22 (0.0007)0.74
Pinus pinaster13.63 + 7.94 AMOJan + 1.40 AMOSept−1 − 0.57 NAOFebAMOJan, 4.84 (<0.0001)0.82
Pinus pinea15.42 + 14.70 AMOApr − 0.84 NAOFebAMOApr, 4.03 (0.0007)0.61
Pinus sylvestris14.34 + 7.32 AMOJan − 0.94 SOIMay − 0.47 NAOFebAMOJan, 4.37 (0.0004)0.67
Quercus faginea17.82 + 13.22 AMOJan − 0.58 SOIMayAMOJan, 5.04 (0.0005)0.64
Quercus ilex15.38 + 14.62 AMOApr − 0.95 SOIMayAMOApr, 5.77 (<0.0001)0.65
Quercus pyrenaica16.55 + 8.04 AMOJan − 0.99 SOIMay − 0.65 NAOFebAMOJan, 4.22 (0.0005)0.68
Quercus robur16.85 + 9.05 AMOJan − 1.16 SOIApr − 0.86 NAOMarAMOJan, 5.93 (<0.0001)0.75
Quercus suber17.33 + 17.50 AMOApr − 0.67 NAOAprAMOApr, 3.52 (0.0023)0.40
Oaks15.79 + 13.68 AMOApr − 1.30 SOIMayAMOApr, 5.58 (<0.0001)0.66
Pines16.28 + 8.18 AMOJan − 0.74 NAOFeb − 0.64 NAOAprAMOJan, 4.76 (0.0002)0.74

