
Spread of the Introduced Sitka Spruce (Picea sitchensis) in Coastal Norway

1
Department of Forest Genetics and Biodiversity, Norwegian Institute of Bioeconomy Research, Ås 1431, Norway
2
Coastal Forestry, Bredsgården Bryggen, Bergen 5003, Norway
*
Author to whom correspondence should be addressed.
Forests 2017, 8(1), 24; https://doi.org/10.3390/f8010024
Submission received: 28 October 2016
/
Revised: 4 January 2017
/
Accepted: 8 January 2017
/
Published: 14 January 2017
(This article belongs to the Special Issue The Effects of Invasive and Exotic Plants on Forests)
Abstract
:Positive and negative effects on ecosystem services from plantation forestry in Europe have led to conflicts regarding non-native tree species. Sitka spruce (Picea sitchensis (Bong.) Carr.) is the most common plantation species in northwest Europe, covering 1.3 Mha. In costal Norway, Sitka spruce was intentionally introduced and is currently occupying about 50,000 ha. Sitka spruce was blacklisted in Norway in 2012, mainly based on the risk for invasive spreading, but little quantitative documentation exists on spread. Here we quantify spread from plantations into abandoned heathland and pastures in thirteen sites where natural regeneration occurs. Spread distances and zero-square distributions related to the nearest edge of the parent stand were fitted by use of Weibull. The median expansion rate was 0.8 m·year−1 in north Norway and 4.4 m·year−1 in west Norway. The maximum establishment distance measured was 996 m. A peak in sapling density occurred within 50 m from the edge, and there was a general decrease in saplings with increasing distance. Conversely, increase in zero-squares percentages occurred with increasing distance. We argue that inclusion of abundance in assessing spread is necessary to define invasiveness. Based on spread models and prevailing forestry practices we recommend that the establishment of new Sitka spruce plantations within 200 m of protected areas should be avoided.
1. Introduction
There is considerable debate on the effects of introduced tree species on ecosystem services and landscapes [1,2,3,4]. Increased afforestation during the 20th century has resulted in the establishment of non-native plantation forests in many parts of the world [5]. Invasions of tree species like Lodgepole pine (Pinus contorta Dougl.) in New Zealand and Monterey pine (Pinus radiata D. Don) in Australia and southern Africa have been reported [6,7,8]. However, most of the non-native conifer invasions have so far been reported from the southern hemisphere, while there is limited evidence from the northern hemisphere, and in particular from Europe [9]. The introduction of non-native tree species within European forestry dates back to the 17th century during the industrialization period [10,11,12]. Even if the use of non-native tree species has a long tradition in Europe, it was not until the 20th century that extensive plantings were carried out. Plantation forestry has changed the distribution of tree species within and beyond their natural distribution range [13]. Today about 5.2% or 8 million ha of the total European forest area is covered by non-native tree species [14]. The most important non-native conifer tree species for timber production in Europe are Douglas fir (Pseudotsuga menziesii Mirb. Franco), Sitka spruce (Picea sitchensis Bong. Carr.), Lodgepole pine, and Larches (Larix spp.).
The problems caused by introduced and invasive species from plantation forestry are suggested to increase over the next upcoming decades [15,16]. The most conflict-generating species are those which are both useful and invasive [4]. Still, there is little scientific consensus about what is meant by an invasive species [17,18,19,20,21]. “Introduced species that spread rapidly in a new region” and “Introduced species that have harmful environmental impacts on native species” are often used by ecologists or in legislation papers, respectively. The inclusion of impacts of the introduced species in the definition of invasive species has been questioned [22]. Many non-native tree species never become invasive, but persist in small self-sustaining populations or disappear without any management. On the other hand, native species can also become invasive after disturbances like storm fellings, fire, cutting, or outbreak of insects. Other tree species cause interspecific facilitation or no detectable interactions in new environments [3]. Based on the definition of Pyšek [19], an observed spread distance of 100 m within 50 years has been proposed as a benchmark criterion for being an invasive tree species. A more quantitative approach including abundance and spread is needed for definition and monitoring of tree invasions, as proposed by Wilson et al. [20].
Sitka spruce is the most common introduced non-native tree species in Atlantic Europe, and covers about 1.3 million hectares mainly on the British Isles, but also in France, Norway, Denmark, Germany, Sweden, and Iceland [23]. Sitka spruce was first introduced to Norway in the 1870s. The bulk of the seed material for Sitka spruce applied in coastal forestry originates from southeast Alaska [24]. The tree species is of great commercial value in the coastal area of Norway. Its normal rotation period in plantation forestry is 60 years. Unlike many other conifers, Sitka spruce is a rather slow starter and has a late age of maximum mean annual increment of 70–160 years [25,26]. It is able to produce three to four times more volume than pine or birch on comparable sites [26,27]. Sitka spruce is the most important non-native tree species in Norway and covers 0.4% or 50,000 ha of forest land and 3% of the coastal forest area. Unlike other countries in northwest Europe, Sitka spruce has been blacklisted in Norway [28,29]. However, the blacklisting is mainly based as a precaution [30]. The reason behind the blacklisting is in regards to the potential risk for harmful impacts on biodiversity outside plantations and the risk for further spreading [31]. The large size, great biomass production, and frequent seed production has suggested a high potential for enhanced ecosystem functioning. Up until now, to the best of our knowledge, harmful effects on biodiversity outside the plantations have not been documented from Norway, and little is known about the spread on a landscape level in Norway except for a few case studies [32,33,34]. In Norway, the coastal heathland as a selected landscape type was red-listed in 2011 and is now given priority as a threatened landscape type in 2015. The risk for spread of Sitka spruce within the heathland and the ongoing transformation of this cultural landscape is probably the underlying reason for the blacklisting of Sitka spruce in Norway.
The main objective of this work was to investigate the invasion potential of Sitka spruce from plantations into open coastal landscapes. We present empirical quantitative data for establishment spread, predictions based on modelling, and discuss invasiveness, invasibility, and management control. To be clear, by spread and spread rate, we mean dispersal leading to established regeneration of Sitka spruce and not germinant or seed.
2. Materials and Methods
Sites were selected from trial records held by the Norwegian Institute of Bioeconomy Research (NIBIO). The area outside 29 middle-aged and older trials in coastal areas in west and north Norway comprising Sitka spruce was assessed for natural regeneration. Sites influenced by more than one spread focus were rejected. Sixteen sites were excluded due to no or less than 20 saplings in the recipient area. The plots we rejected because of limited natural regeneration were characterized by: parent Sitka spruce stand age below 25 years, heavy grazing of sheep or cattle in the surroundings, and a well-developed continuous field layer dominated by clonal species like heather (Calluna vulgaris ((L.) Hull), bilberry (Vaccinium myrtillus (L.)), and graminids.
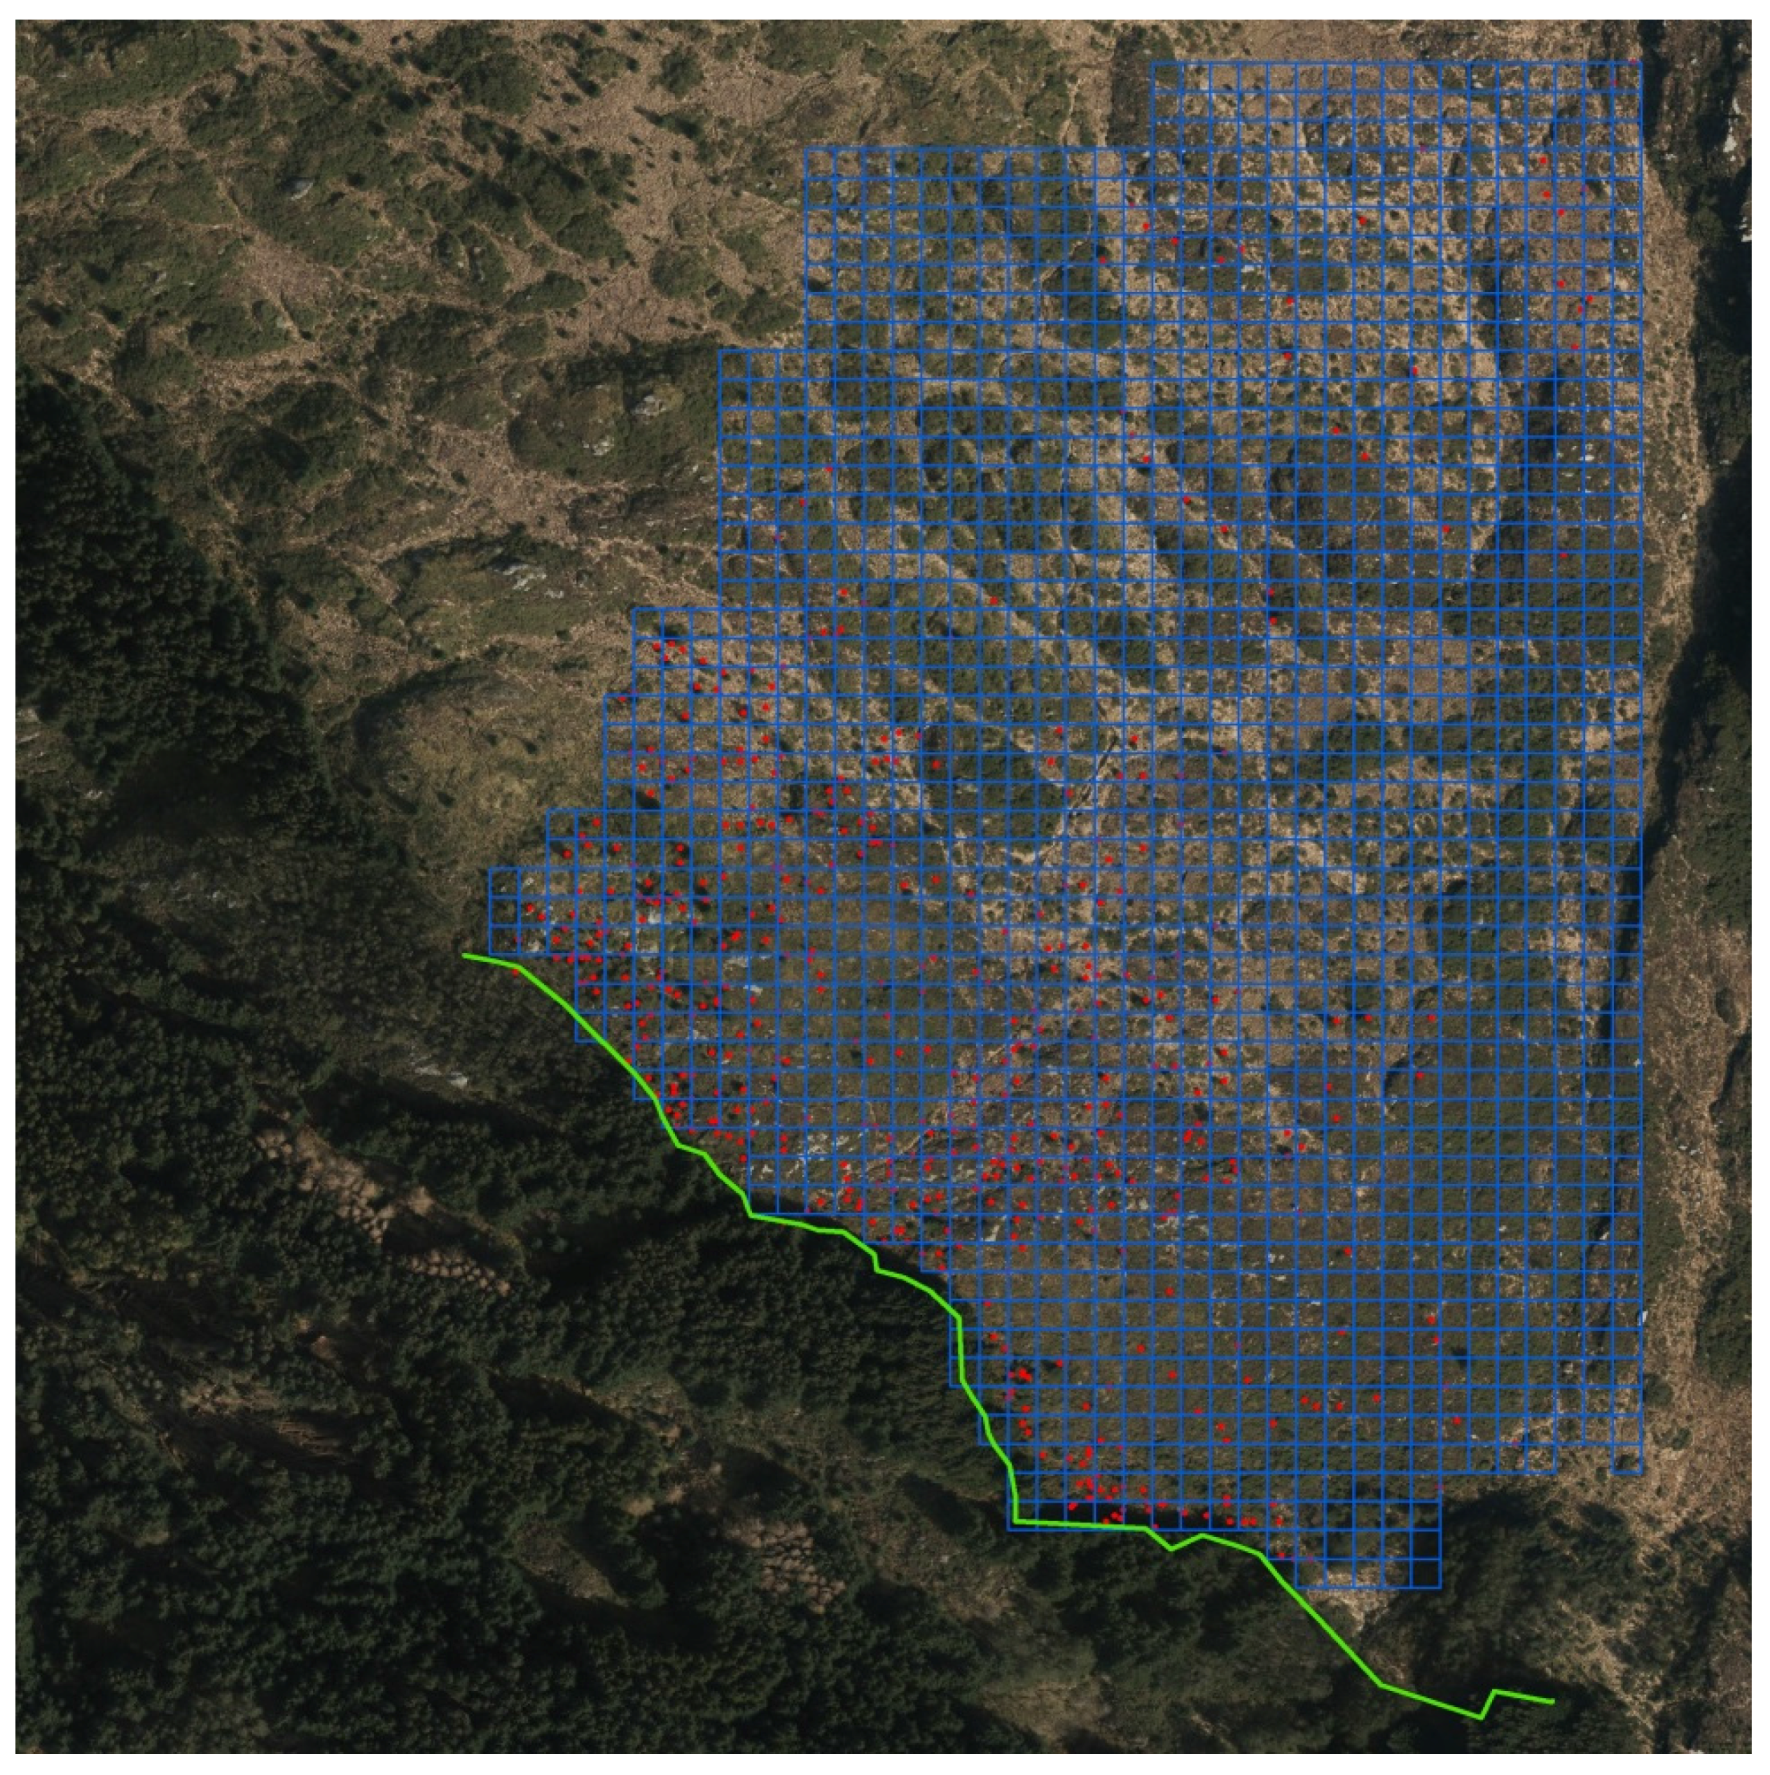
Thus, for heathland/pasture conditions, in total, 13 regeneration stands with 3461 saplings with tree heights from 0.1 m to 10 m were identified and mapped in 2009 and 2010. Some selected properties for the sites are shown in Table 1. The total inventory area was near 240 hectares, and after correcting for ponds, streams, and bare rock the recipient area was determined to be 206 hectares. The thirteen sites were inspected for Sitka spruce recruits. Saplings of Sitka spruce were recorded by visual inspection from the edge facing the spread sector of the parent stand and 100 m past to the outermost sapling (Figure 1).
Geographic position (UTM32/WGS84) was taken by handheld GPS (TDS) for each sapling ≥0.1 m, and these data were mapped into the landscape by GIS (geographical information systems). Each site was gridded in a 10 × 10 m grid covering all the observations by Hawt’s Analysis Tools for Arc GIS. A 10 × 10 m grid corresponds to an area of projected crown of an open grown mature Sitka spruce. Based on this grid, zero square percentage (ZS), the number of squares without Sitka spruce in percent of total number of squares, was calculated [35]. The percentage abundance or area of occupancy (AOO) is given by 100-ZS. The extent of occurrence (EOO) was estimated as the total number of grid cells. Patches of several saplings within 1 m2 were given the same coordinates. Sapling total height was measured by a level rod and for trees higher than 2.5 m a Vertex hypsometer was applied.
In order to describe parent stand conditions, three relascope plots were subjectively selected within the stand margins. Stand volumes (over bark) were estimated using a stand volume function for Sitka spruce in Norway [36] by applying average basal area and Lorey’s mean height from the relascope plots. Planting time was either determined from coring of one tree per plot or identified in stand records listed in a forestry plan for the property. Site index (H40) base age 40 years for the parent stand was determined using height and breast height age according to functions in Orlund [36] and rounded to the nearest 3 m class. Eight of the plots were located on sloped terrain while five of the plots were located on rather flat terrain.
Spread Distributions and Spread Rates
Median spread distance (MSD) for the inventory plots was calculated as the median minimum distance from seeding edge to the sapling. Maximum spread distance (MaxSD) was calculated directly as the shortest distance from seeding edge to the outermost observation. As estimates for spreading rates we used wave expansion rate (WER), which is MSD/(parent stand age—25 years), and frontier expansion rate (FER) which is MaxSD/(parent stand age—25 years). We applied a fecundity age of 25 years for Sitka spruce, following investigations in USA/Canada [37] and observations from Norway [38].
Based on the site-wise distribution pattern we parameterized Weibull distributions for the observed establishment distances (OED) occurring in our data [39].
We started with the OED xij for established seedling No. j and plot No. i.
i = 1, …, m and j = 1, …, n.
We applied a Weibull distribution where the parameter range for α (<0,3) and β (10,400), where α = form-parameter and β = scale parameter, giving the following likelihood-function:
Equation (1) was transformed into a log-likelihood:
We calculated alpha and beta to achieve maximum log-likelihood for all observations. Further, we determined alpha and beta for the various models:
where z is a contrast matrix for a maximum complexity for all plots with different parameters, and, given a minimal complexity setting, a constant alpha and beta for all plots. The stratification implies nine potential models. We used the Akaike’s information criterion (AIC) and log-ratio statistics to illustrate the fit. When alpha = 1 the Weibull-distribution is identical to an exponential distribution. The distance which covers 95 and 99 percent of the saplings is given by:
and
3. Results
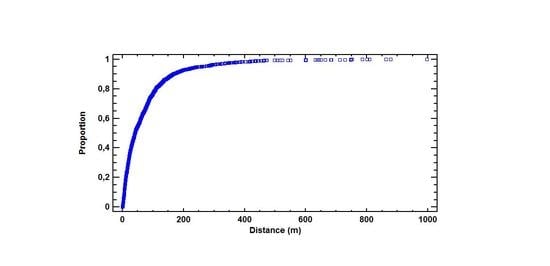
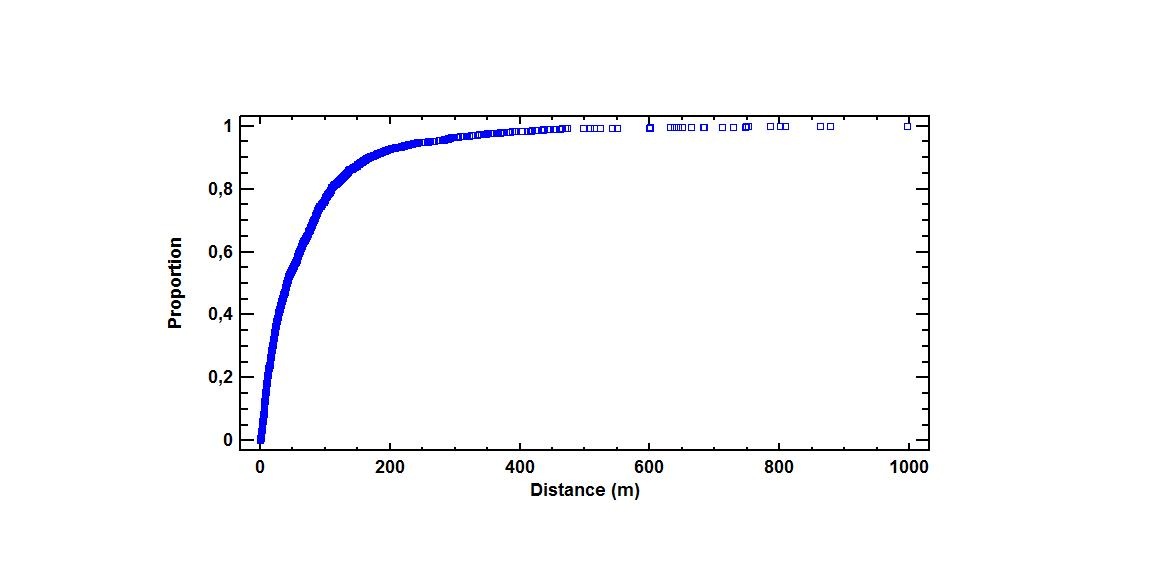
The selected 13 sites covered a total plantation area of 28 hectares, and c. 40,000 Sitka spruce trees. We mapped 3461 established Sitka spruce saplings distributed over a recipient area of 206 hectares. The overall mean and median distance from edge were 74 m and 41 m, respectively (Figure 2a). The maximum spread distance observed was 996 m.
Sapling height varied from 0.1 m up to 10 m with a mean of 1.3 m. Some of the trees higher than 4 m were cone bearing.
Zero-squares, expansion rates, and spread distances showed a great variety from site to site (Table 2). Median distance from the edge to the saplings ranged from 9 m in north Norway and up to a maximum 200 m in west Norway (Table 2). The maximum spread distance recorded in this study was 996 m, in Store Karlsøy.
The majority of saplings were found in Våkendalen2 (n = 1027) and Strandafjellet (n = 812) in west Norway, while the least number of saplings (20 < n < 50) occurred in the plots of Andøya, Anstad 2, and Ballstad in north Norway. The highest area of occupancy (AOO) above 60% was found in Mjøs, Andøya, and Ballstad. The lowest AOO, below 10%, was found in Store Karlsøy and Haramsøy.
Median expansion rate (WER) along the main spread direction was calculated to be 4.4 m per year in west Norway and 0.8 m per year in north Norway, when a fecundity age of 25 years is applied. Considering the long-distance establishment events, the frontier speed (FER) increased to 1.6 and 20.5 m per year in north and west Norway, respectively.
The zero-square percentage within the extent of occurrence was above 75% for all the sites in west Norway except for Mjøs. The zero-square percentage was lower in north Norway, with an average of 56%. In total, with equal weight to all the grids; 7.4% of the grid cells had one or more Sitka spruce-saplings, and 92.6% of the grid cells had no occurrences of Sitka spruce. The empirical models and goodness of fit reflect a great variation from site to site (Table 3, Model 1). However, a slightly different spread pattern was identified in west Norway compared to north Norway (Table 3, Model 2). The estimated spread curves comprised the highest numbers of saplings 0–40 m from the edge and a rapid decrease of the tail thereafter. The distribution in the west was more right-hand skewed compared to the north (Figure 3 and Figure 4). In north Norway the spread was restricted to a distance of 50 m. The Ballstad site had a road close to the edge, thereby influencing the spread opportunities, and was therefore not included in the empirical modelling.
The coefficients for the models revealed great variability for Beta in west Norway and for Alpha in north Norway (Table 4).
For the sites in north Norway the probability for successful establishment for at least one sapling per 10 ×10 m square was in the range of 0.35–0.60 at 25 m from the edge, with a large decrease at 100 m. For the sites in west Norway; Bontveit and Strandafjellet, the probability for successful establishment at 200 m decreased to approximately one quarter compared to 100 m (Table 5). For Strandafjellet and Våkendalen 1 and 2, the models predicted a smooth tail at distances above 200 m.
4. Discussion
The establishment pattern revealed that the spread of Sitka spruce into abandoned heathland and pastures in coastal Norway (Figure 2) seems to follow the model of “stratified diffusion” [40]. In such a model we have assumed that the chain of dispersal-establishment events occurs by a combination of local diffusion and long-distance jumps; as peripheral colonies grow in size and number, their influence will gradually increase and second order regeneration starts. This results in a spread that does not move continuously across the landscape [41]. We envision range expansions as having three stages: (1) establishment and lag stage (0–25 years); (2) period of rapid population growth rate (25–60 years); and (3) reduced population growth and slowed spread of the geographic area occupied (>60 years). Due to the stand ages represented we emphasize that only the two first stages are covered in our work. The dominance of rather young plantations corresponds with the current situation in coastal Norway, as approximately 95% of the Sitka spruce stands are below 60 years of age.
Our study revealed that 93% of the spread of established saplings was located closer than 200 m from the edge (Figure 2a) and that invasion by long-distance jumps appear to be rare. A peak in establishment was observed at distances 30–100 m from the edge and not close to the edge, which may be expected. These patterns are partly due to the tree height, but also sever competition from the edge vegetation. Moreover, the spatial and temporal pattern of disturbance in the spread sector is of great importance. The zero-square percentages reflect the percentage area of occupancy. The zero-square variation was in the range from 30% up to 98%, with the lowest values in the north. The number of saplings lower than 0.2 m is regarded as being a minimum number. An accurate recording of such saplings in a dense field layer is extremely time consuming and expensive. This has led to an overestimation of zero square percentages. In this study the applied plot size was 100 m2. A smaller plot size would probably result in higher zero-square percentages. The stability of zero-square percentage will also be sensitive to mortality because a lot of plots contain one single sapling. It may look contradictory that the area of occupancy increases (AOO) with decreasing number of saplings in the north, but this is mainly due to restriction in extent of occurrence (EOO). The pattern of barriers due to land use and topography in north Norway demarcated the area searched against sea, dense forest, or field in a different way compared to west Norway. Shorter edge lengths in the north might also explain the different pattern of establishment compared to the west, but we did not find any connection. A combination of AOO and EOO reflects pattern and dynamics of spread in a better way, as pointed out by Wilson et al. [20]. However, the probability for establishment within 100 m is much higher in the west than compared to the north (Table 5). Within a distance of 200 m in the west the probability for establishment is lower than 0.1, except for the site at Strandafjellet; p = 0.12. Southern wind and special topography has probably increased spread and establishment at longer distances. Under Norwegian conditions, seed-fall in Sitka spruce can normally be expected from October to April. Low air moisture levels encourage the openings of cones. Therefore, the most important winds for seed dispersal in Norway are the continental Easterlies and dominant winds from southeast towards northwest. The major portion of the study sites in west Norway are orientated with a prevailing spread direction to the west. However, wind spread in coastal areas with islands, valleys, and hills is rather complex; Strandafjellet, with a northeast spread direction showed a pretty similar establishment pattern as Bontveit, with a west spread direction. “Take off” conditions for the seed and potential for wind spread on snow crust vary from site to site. A fine scale spatial landscape analysis of establishment would probably have given more information, but our digital elevation model (DEM) was too rough for such an analysis.
It is generally accepted that the process of natural regeneration passes through several biological and temporally distinct stages; sexual reproduction, seed production, seed dispersal, seed germination, and seedling establishment. The variation in spread is probably linked to abiotic and biotic filters acting on these different stages [42]. Vegetation-type, diversity of vascular plants, disturbance, resource availability (in particular N and P), topography, time since first fecundity, and local wind-conditions acting alone or in concert are important structuring factors. The invasibility of the habitats or communities of the surroundings may be more decisive for spread than earlier regarded. In particular, the timing between mast year and when a community is invasible seems to be crucial [43]. Sites dominated by Calluna vulgaris seems to have restricted establishment probably because these sites are more resistant against small scale disturbance, but also because of the competition and allelopatic effects from Calluna. We have explored establishment patterns for Sitka spruce saplings in spreading borders of Sitka spruce plantations located in a south-north gradient from 59° to 69° N. The distance from the vicinity of Bergen to the northernmost plot in this study is approximately 1320 km. Over such a distance the average summer temperature (tetraterm) decreases from ~13.0 °C in Bergen (190 growth days), and down to 10.0 °C in Andøya (130 growth days) [44]. We therefore consider that seed production is a key factor that may cause differences in establishment rates between the north and the west, which is in agreement with other seed studies for conifers in northern Europe and the Pacific Northwest [37,45,46]. In west Norway mast years of Sitka spruce are reported to occur in intervals of three to five years [38], whereas in north Norway mast years occur on a far more irregular basis. During the years 1950–2010 only four successful Sitka spruce cone collections were made in the northernmost districts [47]. Løken [48] found that, although quantity of cones and Sitka spruce seed produced in costal Norway were sometimes high, this could be offset by low viability. Low summer temperature in northern latitudes leads to non-viable seed generally being empty, because of pollination failure or embryo abortion.
We found an expansion rate in the range from 0.3 to 11.1 m·year−1. The rate in the north is approximately one sixth compared to rate in the west. The figures in north Norway are approximately 1/1000 of the expansion rates for early-successional Sitka spruce calculated in primary successions near glaciers in Alaska. The much lower rates observed in our work can be explained by the difference between secondary and primary succession, where spread and establishment into existing vegetation is the bottleneck. Based on the interpretations of Chapin et al. [49], Nathan et al. [50] suggest spread rates for Sitka spruce of 300–500 m·year−1. Such a result corresponds nicely with the interpretation of fossil data suggesting that rapid migration of the order of 100–1000 m·year−1 was typical for important tree species responding to postglacial warming in Europe and North-America. For instance, the spread of Norway spruce in a southwest-direction from the eastern parts of Finland to the fjords of western Norway, a distance of 3000 km, has taken almost 2000 years, thereby representing an average speed of 150 m·year−1. Literature about expansion rates into climax forests and cultivated land show more modest spread rates. Kuparinen et al. [51] calculated expansion rates of 4–8 m·year−1 for major tree species in North America with a terminal wind velocity of 1 m·s−1. Such figures are within the same range as our results with “advancing frontiers” in a coastal cultural landscape from 1.6 to 20.5 m·year−1.
Our results indicate that the consideration of case studies might be of restricted value when aiming to up-scale results, and furthermore that the underlying mechanisms of spread and establishment is complex and site specific. This study reveals great differences in expansion rates and that the invasiveness of Sitka spruce vary on a regional scale in Norway. It is also important to note that the empirical models had moderate fits. Our models aimed merely to describe the numerical relationship between distance from edge and establishment. Due to the exclusion of 16 sites with limited or no spread we regard our results on spread rates to be overestimates.
So, how invasive is Sitka spruce in Norway? If we apply the benchmark criteria of 100 m spread within 50 years to our observations the choice of maximum spread distance or median spread distance will be decisive. For instance, in north Norway we recognize the spread rates (WER) of Sitka spruce to be below the threshold value for all sites, whereas the same is true for west Norway in three of seven sites. We propose that whether a tree species should be regarded as invasive or not must also emphasize abundance [24]. Once successfully established, and followed by individual growth and ingrowth, the competition is likely to become more intense and further recruitment will decrease because of density dependent limitations. Based on our figures for Sitka spruce in coastal Norway we suggest that non-native trees displaying area of occupancies greater than 40 percent should be regarded as invasive. A threshold value of 40 is suggested since it will result in a stand structure with a dominating canopy cover.
By using gridded data and repeated monitoring, time series will shed new light on spatio-temporal dynamics of spread, and provide better guidance for management. As most of our recordings are small saplings, mortality will probably decrease the area of occupancy. Continuous canopy area will only be established close to the seeding edge within several decades. However, the propagule pressure for Sitka spruce is likely to increase in the coming decades as the biomass production and coning will increase. More stands will reach fecundity age. Management of the recipient areas, heathland, and pastures is likely to change. On one hand, climate scenarios for coastal Norway predict a more oceanic climate which probably will increase the fitness of Sitka spruce; on the other hand, conventional forest plantation management implies cutting and will partly counteract the spread in coastal Norway. Some shelterbelts and neglected unprofitable stands of Sitka spruce established in the 1960s–80s will probably not be cut. Such patches will serve as important spread foci for the future and should be identified. Established regeneration outside plantations can be felled before coning within planned operations of pre-commercial thinning and cleaning by motor-manual cutting. It is likely that the open coastal heathlands in Norway will continue to change character, as they gradually will revert to woodlands, and become dominated by Downy birch and Scots pine according to succession, and later Norway spruce/Sitka spruce, as long as no or limited browsing and burning occur. The fate of this cultural landscape will depend on management. For protected areas and hot spots in Norway we recommend, based on the presented empirical data and modelling, a buffer zone of 200 m for the establishment of new Sitka spruce plantations. The presented study is restricted to a few abandoned heathland and pastures sites in Norway, and the model should not be extrapolated to other landscapes. However, we think this study reveals some generality and has application for the Sitka spruce in Atlantic northwest Europe.
5. Conclutions
Analysis of the spread of Sitka spruce throughout the Norwegian coastal environments showed great variation in spread and expansion rate at the landscape scale between the west and the north of Norway, but variation on finer scales between sites was also observed. Number of mast years and the timing between mast year and disturbance seems to play a critical role in the spread of this species. Our study proved that the monitoring of spread should include estimates of abundance to identify the invasiveness of a species. Forest practice in coastal areas should adapt to the risks associated with the spreading close to plantations. Establishment of new Sitka spruce plantations within 200 m of protected areas should be avoided. Further, more empirical data is needed specifically with fine scale landscape analysis and long-term repeated monitoring, would increase our understanding of the pattern and processes related to spread thus providing significant value for management. In particular the identification of outliers which crucially act as foci for spreading should be identified and controlled.
Acknowledgments
The authors would like to thank Hans Nyeggen and Roald Brean for assistance in fieldwork, and Einar Heegaard for suggesting the Weibull model. We also thank Micky Allen for helping to improve the English and for providing valuable comments. The work presented in this paper has been performed within the strategic institute program: Spread of exotic species in Norway, financed by the Norwegian Forest and Landscape Institute.
Author Contributions
P.H.N. and B.-H.Ø. conceived and designed the study. B.-H.Ø. provided site data and the statistical analysis on forest and modelling. P.H.N. carried out GIS analysis and fieldwork. B.-H.Ø. and P.H.N. wrote the manuscript.
Conflicts of Interest
The authors declare no conflicts of interest.
References
- Richardson, D.M.; Rejmánek, M. Trees and shrubs as invasive alien species—A global review. Divers. Distrib. 2011, 17, 788–809. [Google Scholar] [CrossRef]
- Richardson, D.M.; van Wilgen, B.W.; Nunez, M.A. Alien conifer invasions in South-America: Short fuse burning? Biol. Invasions 2008, 10, 573–577. [Google Scholar] [CrossRef]
- Sax, D.F.; Stachowicz, J.J.; Gaines, S.D. Species Invasions: Insights into Ecology, Evolution and Biogeography; Sinauer Associates Incorporated: Sunderland, MA, USA, 2005. [Google Scholar]
- Van Wilgen, B.W.; Richardson, D.M. Challenges and trade-offs in the management of invasive alien trees. Biol. Invasions 2014, 16, 721–734. [Google Scholar] [CrossRef]
- Zobel, B.J.; Wyk, G.V.; Stahl, P. Growing Exotic Forests; John Wiley & Sons: New York, NY, USA, 1987. [Google Scholar]
- Haysom, K.; Murphy, S. The status of invasiveness of forest tree species outside their natural habitat: A global review and discussion paper. For. Genet. Resour. 2004, 31, 5–8. [Google Scholar]
- Richardson, D.M.; Williams, P.; Hobbs, R.J. Pine invasions in the southern hemisphere: Determinants of spread and invadability. J. Biogeogr. 1994, 21, 511–527. [Google Scholar] [CrossRef]
- Richardson, D.; Brown, P. Invasion of mesic mountain fynbos by Pinus radiata. S. Afr. J. Bot. 1986, 52, 529–536. [Google Scholar] [CrossRef]
- Carrillo-Gavilán, M.A.; Vila, M. Little evidence of invasion by alien conifers in Europe. Divers. Distrib. 2010, 16, 203–213. [Google Scholar] [CrossRef]
- Bolle, C. Andeutungen über die Freiwillige Baum-und Strauchvegetation der Provinz Brandenburg; Verlag des Märkisches Provinzial-Museum: Berlin, Germany, 1887. [Google Scholar]
- Kowarik, I.; Säumel, I. Biological flora of Central Europe: Ailanthus altissima (Mill.) Swingle. Perspect. Plant Ecol. Evol. Syst. 2007, 8, 207–237. [Google Scholar] [CrossRef]
- Wein, K. Die erste Einführung nordamerikanischer gehölze in Europa. Mitt. Deutch. Dendrol. Ges. 1930, 42, 137–163. [Google Scholar]
- Spiecker, H. Norway Spruce Conversion: Options and Consequences; European Forest Institute Research Report 18; Brill: Leiden, The Netherlands, 2004. [Google Scholar]
- State of Europe’s Forests 2007: The MCPFE report on sustainable forest management in Europe. Available online: http://foresteurope.org/wp-content/uploads/2016/08/FE-EN.pdf (accessed on 22 November 2015).
- Higgins, S.I.; Richardson, D.M. Pine invasions in the southern hemisphere: Modelling interactions between organism, environment and disturbance. Plant Ecol. 1998, 135, 79–93. [Google Scholar] [CrossRef]
- Peterken, G. Ecological effects of introduced tree species in Britain. For. Ecol. Manag. 2001, 141, 31–42. [Google Scholar] [CrossRef]
- Colautti, R.I.; MacIsaac, H.J. A neutral terminology to define ‘invasive’ species. Divers. Distrib. 2004, 10, 135–141. [Google Scholar] [CrossRef]
- Pyšek, P. On the terminology used in plant invasion studies. Plant Invasions: Gen. Aspects Spec. Probl. 1995, 71–81. [Google Scholar]
- Pyšek, P.; Richardson, D.M.; Rejmánek, M.; Webster, G.L.; Williamson, M.; Kirschner, J. Alien plants in checklists and floras: Towards better communication between taxonomists and ecologists. Taxon 2004, 53, 131–143. [Google Scholar] [CrossRef]
- Wilson, J.R.; Caplat, P.; Dickie, I.A.; Hui, C.; Maxwell, B.D.; Nunez, M.A.; Pauchard, A.; Rejmánek, M.; Richardson, D.M.; Robertson, M.P. A standardized set of metrics to assess and monitor tree invasions. Biol. Invasions 2014, 16, 535–551. [Google Scholar] [CrossRef]
- Collen, B.; Pettorelli, N.; Baillie, J.E.; Durant, S.M. Biodiversity Monitoring and Conservation: Bridging the Gap between Global Commitment and Local Action; Wiley-Blackwell: Oxford, UK, 2013. [Google Scholar]
- Simberloff, D. How common are invasion-induced ecosystem impacts? Biol. Invasions 2011, 13, 1255–1268. [Google Scholar] [CrossRef]
- Mason, W.L.; Perks, M.P. Sitka spruce (Picea sitchensis) forests in Atlantic Europe: Changes in forest management and possible consequences for carbon sequestration. Scand. J. For. Res. 2011, 11, 72–81. [Google Scholar] [CrossRef]
- Magnesen, S. Trials and experiments with coniferous trees and provenances in western Norway. Res. Notes Skogforsk 2001, 1, 1–20. [Google Scholar]
- Øyen, B.-H. Growth Models for Sitka Spruce (Picea sitchensis Bong Carr.) Stands in Western Norway; Norwegian Forest Research Institute: Ås, Norway, 2005; pp. 1–46. [Google Scholar]
- Øyen, B.-H. Coastal Forestry. Potential and Challenges the Coming Decades; Norwegian Forest and Landscape Institute: Ås, Norway, 2008; pp. 1–84. [Google Scholar]
- Øyen, B.-H.; Tveite, B. A Comarison of Site Index and Potential Yield between Norway Spruce, Scots Pine, Downy Birch and Sitka Spruce on the Same Site in Western Norway; Norwegian Forest Research Institute: Ås, Norway, 2002; pp. 1–31. [Google Scholar]
- Gederaas, L.; Moen, T.L.; Skjelseth, S.; Larsen, L.-K. Fremmede Arter I Norge—Med Norsk Svarteliste 2012; Artsdatabanken: Trondheim, Norway, 2012. [Google Scholar]
- Sandvik, H.; Sæther, B.E.; Holmern, T.; Tufto, J.; Engen, S.; Roy, H.E. Generic ecological impact assessments of alien species in Norway: A semi-quantitative set of criteria. Biodivers. Conserv. 2013, 22, 37–62. [Google Scholar] [CrossRef] [Green Version]
- Jordan, A.; O’Riordan, T. The precautionary principle: A legal and policy history. In The Precautionary Principle: Public Health, and Sustainability; WHO: Rome, Italy, 2004. [Google Scholar]
- Kjær, E.D.; Lobo, A.; Myking, T. The role of exotic tree species in Nordic forestry. Scand. J. For. Res. 2014, 29, 323–332. [Google Scholar] [CrossRef]
- Nygaard, P.H.; Skre, O.; Brean, R. Naturlig Spredning av Utenlandske Treslag; Oppdragsrapport NISK 19/99; Norsk Institutt for Skogforskning: Ås, Norway, 1999. [Google Scholar]
- Berstad, Å.-B. Landscape Changes in Costal Western Norway Due to Afforestation and Natural Rejuvenation of Sitka Spruce (Picea sitchensis). A Landscape Ecological and Methological Study. Master’s Thesis, Høgskulen i Sogn og Fjordane, Førde, Norway, 2014. [Google Scholar]
- Saure, H.I.; Vandvik, V.; Hassel, K.; Vetaas, O.R. Effects of invasion by introduced versus native conifers on coastal heathland vegetation. J. Veg. Sci. 2013, 24, 744–754. [Google Scholar] [CrossRef]
- Braathe, P. Undersøkelser over utviklingen av glissen gjenvekst av gran. Medd. Nor. SkogforsVes 1953, 12, 213–301. [Google Scholar]
- Orlund, A. Bonitering av Plantet Gran (Picea abies L. Karst.) og Sitkagran (Picea sitchensis Bong. Carr.) på Vestlandet. Rapp. Skogforsk. 2001, 2, 1–17. [Google Scholar]
- Harris, A. Picea sitchensis (Bong.) Carr. Sitka spruce. Silv. N. Am. 1990, 1, 260–267. [Google Scholar]
- Fyrsto, I. Seed Supply in Forestry; Skogforlaget AS: Oslo, Norway, 1961; pp. 299–318. [Google Scholar]
- Weibull, W. Wide applicability. J. Appl. Mech. 1951, 103, 293–297. [Google Scholar]
- Shigesada, N.; Kawasaki, K.; Takeda, Y. Modeling stratified diffusion in biological invasions. Am. Nat. 1995, 146, 229–251. [Google Scholar] [CrossRef]
- Pyšek, P.; Hulme, P.E. Spatio-temporal dynamics of plant invasions: Linking pattern to process. Ecoscience 2005, 12, 302–315. [Google Scholar] [CrossRef]
- Keddy, P. A pragmatic approach to functional ecology. Funct. Ecol. 1992, 6, 621–626. [Google Scholar] [CrossRef]
- Davis, M.A.; Grime, J.P.; Thompson, K. Fluctuating resources in plant communities: A general theory of invasibility. J. Ecol. 2000, 88, 528–534. [Google Scholar] [CrossRef]
- Moen, A. National Atlas of Norway, Vegetation; Statens Kartverk: Hønefoss, Norway, 1998. [Google Scholar]
- Gordon, A.; Faulkner, R. Identification and Assessment of Cone and Seed Crops; Seed Manual for Forest Trees; Forestry Commission Bulletin 83: London, UK, 1992.
- Koski, V.; Tallqvist, R. Results of long-time measurements of the quantity of flowering and seed crop of forest trees. Folia For. 1978, 364, 1–60. [Google Scholar]
- The Norwegian Forest Seed Center. Available online: http://www.skogfroverket.no/artikkel.cfm?Id_art=16&kanal=1 (accessed on 18 May 2016).
- Løken, A. Seed ripening of Norwegian coniferous trees. Commun. For. Res. Station West Norway 1967, 42, 171–187. [Google Scholar]
- Chapin, F.S.; Walker, L.R.; Fastie, C.L.; Sharman, L.C. Mechanisms of primary succession following deglaciation at Glacier Bay, Alaska. Ecol. Monogr. 1994, 64, 149–175. [Google Scholar] [CrossRef]
- Nathan, R.; Horvitz, N.; He, Y.; Kuparinen, A.; Schurr, F.M.; Katul, G.G. Spread of North American wind-dispersed trees in future environments. Ecol. Lett. 2011, 14, 211–219. [Google Scholar] [CrossRef] [PubMed]
- Kuparinen, A.; Katul, G.; Nathan, R.; Schurr, F.M. Increases in air temperature can promote wind-driven dispersal and spread of plants. Proc. R. Soc. Lond. B Biol. Sci. 2009, 276, 3081–3087. [Google Scholar] [CrossRef] [PubMed]
Figure 1.
Orthophoto showing the Strandafjellet study site. The green line shows the seeding edge of the parent stand. Each spruce sapling position is shown as a red point. The grid size is 10 × 10 m. This mapping design was applied for all sites.
Figure 1.
Orthophoto showing the Strandafjellet study site. The green line shows the seeding edge of the parent stand. Each spruce sapling position is shown as a red point. The grid size is 10 × 10 m. This mapping design was applied for all sites.

Figure 2.
(a) Box- and whisker plot of spread distances distribution for Sitka spruce in coastal Norway. The box encloses the middle 50% of observations. The median is represented as a vertical line inside the box and + displays the mean. The left whisker is drawn from lower quartile to the smallest observation, while the right whisker is drawn from the upper quartile to the largest observation. Individual points are regarded as outliers; (b) Box- and whisker plot of height distribution for Sitka spruce saplings. The box encloses the middle 50% of observations. The median is represented as a vertical line inside the box and + shows the mean. The left whisker is drawn from lower quartile to the smallest observation, while the right whisker is drawn from the upper quartile to the largest observation. Individual points are regarded as outliers.

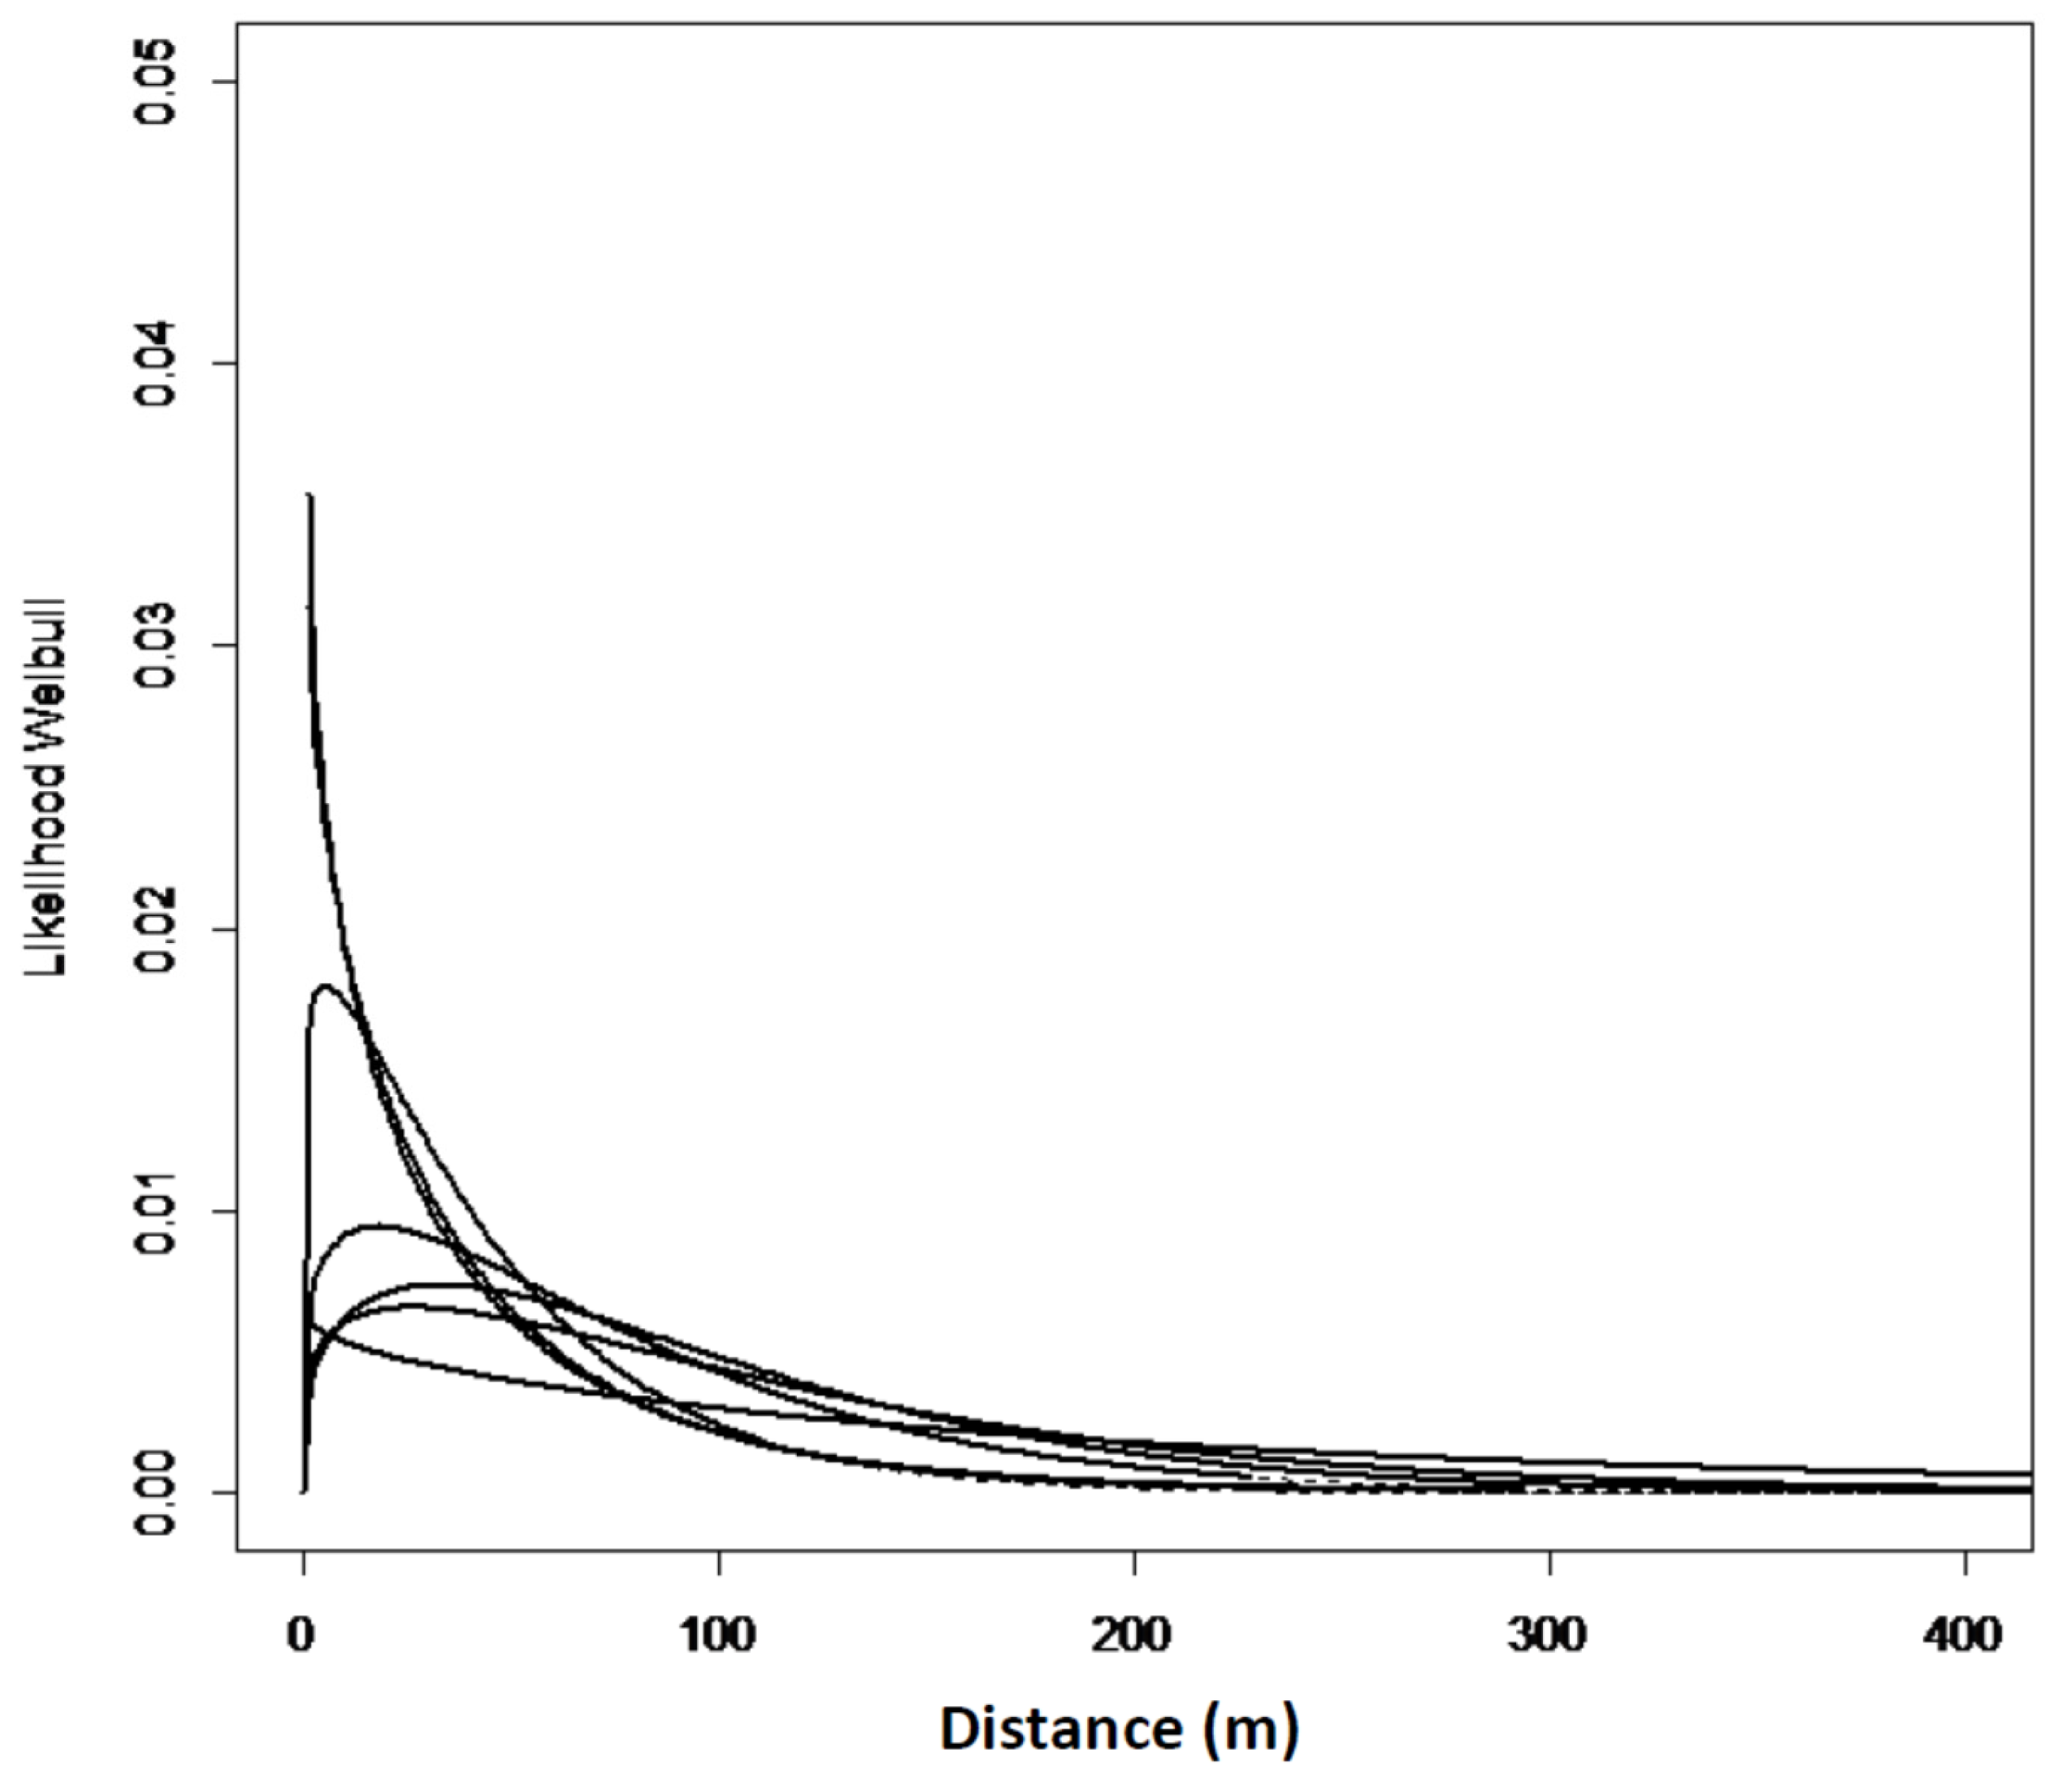
Figure 3.
Expected Weibull distribution for the seven sites in west Norway, Model No. 1.

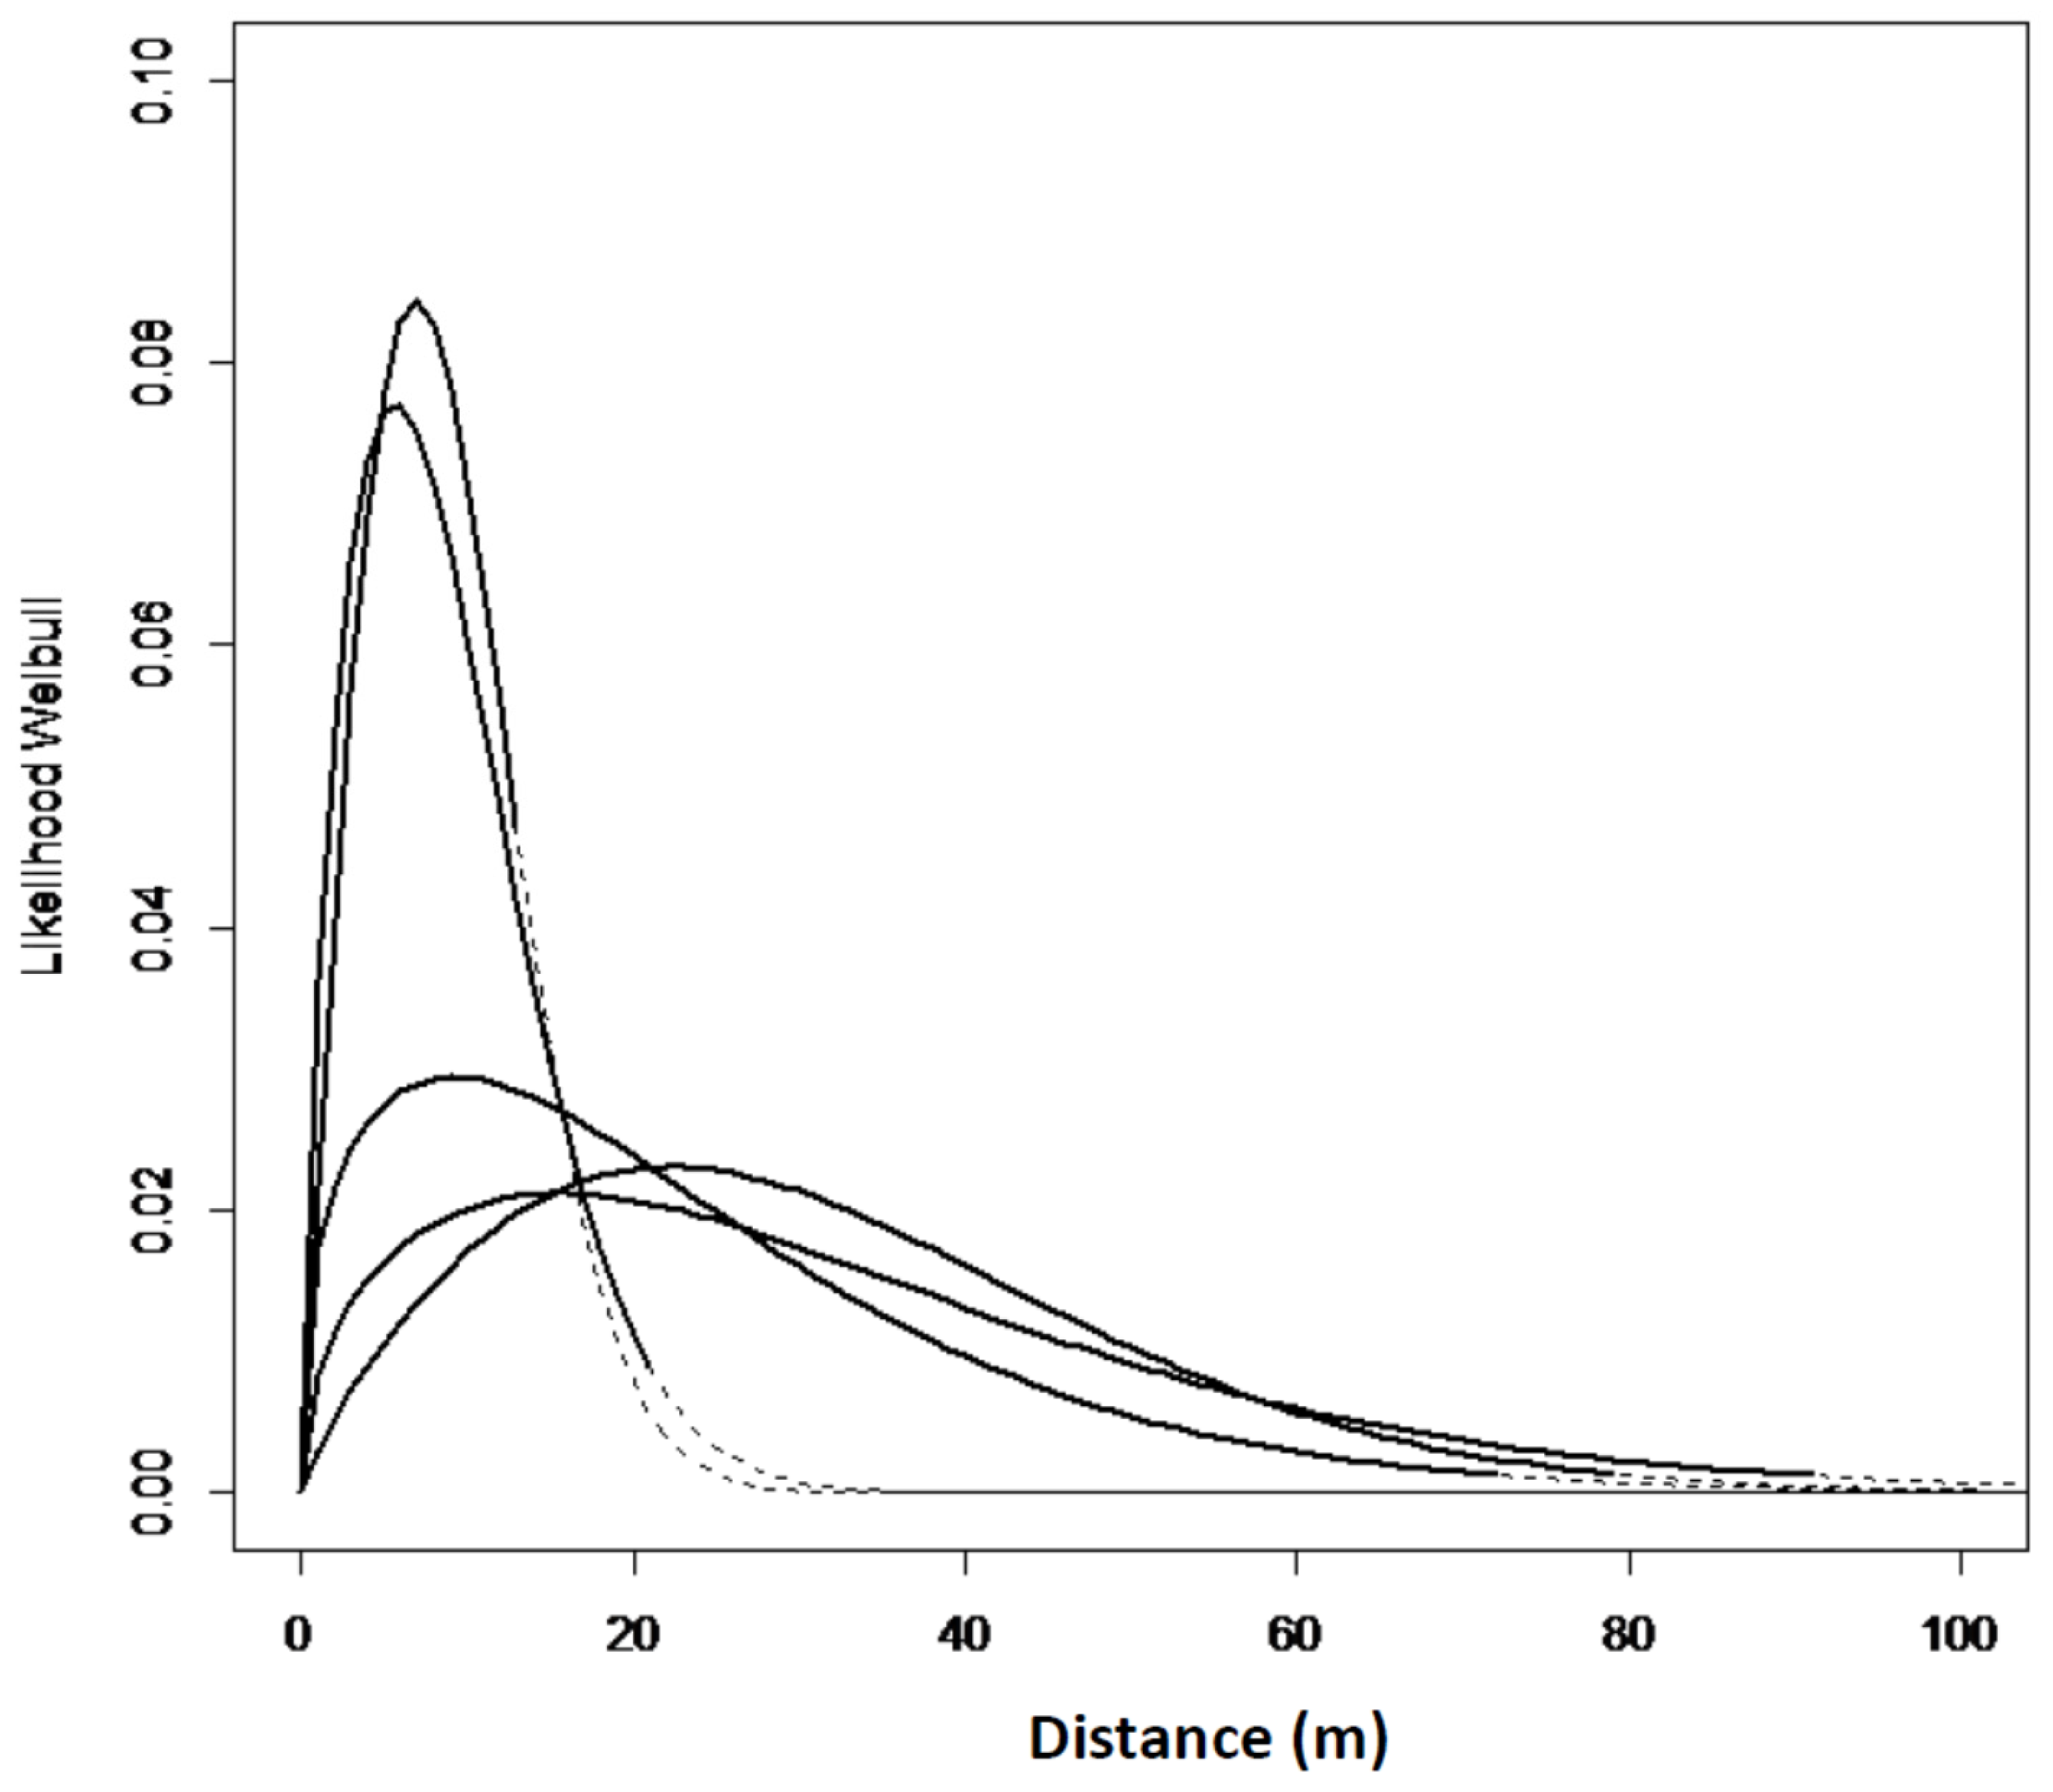
Figure 4.
Expected Weibull distribution for five sites in north Norway Model No. 1. The Hatched lines denote extrapolated values, outside max establishment distance.
Figure 4.
Expected Weibull distribution for five sites in north Norway Model No. 1. The Hatched lines denote extrapolated values, outside max establishment distance.


Table 1.
Sites included in the study and some characteristics. Region denotes north or west Norway. Elev. = elevation (meter above sea level). DSD = Dominant spread direction; E = east, W = west, N = north. Age = total age of parent stand in years from seed. SI = site index class (H40). Vol = Standing volume.
| Site | Region | East | North | Elev. | DSD | SI | Age | Vol |
|---|---|---|---|---|---|---|---|---|
| (m) | (m) | (Years) | (m3·ha−1) | |||||
| Andøya | North | 761994 | 7670420 | 35–70 | E | 17 | 55 | 430 |
| Anstad 1 | North | 757595 | 7637024 | 160–170 | E | 17 | 51 | 380 |
| Anstad 2 | North | 757886 | 7636843 | 125–180 | E | 17 | 49 | 380 |
| Ballstad | North | 688228 | 7558594 | 25–40 | E | 20 | 55 | 430 |
| Sandnes | North | 740937 | 7620082 | 50–90 | E | 20 | 52 | 410 |
| Steiro | North | 757084 | 7632104 | 230–285 | N | 20 | 53 | 445 |
| Bontveit | West | 305556 | 6494255 | 470–630 | W | 23 | 38 | 355 |
| Haramsøy | West | 358695 | 6948395 | 143–175 | W | 17 | 60 | 440 |
| Mjøs | West | 280165 | 6738073 | 25–30 | W | 29 | 49 | 720 |
| Store Karlsøy | West | 280418 | 6672010 | 1–30 | N | 23 | 43 | 425 |
| Strandafjellet | West | 283635 | 6680917 | 110–190 | N | 20 | 45 | 370 |
| Våkendalen 1 | West | 301230 | 6701315 | 320–435 | E | 26 | 55 | 435 |
| Våkendalen 2 | West | 300190 | 6701482 | 320–504 | W | 23 | 54 | 385 |
Table 2.
Zero-squares (ZS, 10 × 10 m), median spread distance (MSD), and maximum spread distance (MaxSD) for the inventory sites. WER = Wave expansion rate. FER = Frontier expansion rate. Standard deviation in brackets.
| Site | ZS | MSD | WER | MaxSD | FER |
|---|---|---|---|---|---|
| (%) | (m) | (m·year−1) | (m) | (m·year−1) | |
| Andøya | 36 | 10 | 0.3 | 20 | 0.7 |
| Anstad 1 | 77 | 25 | 1.0 | 71 | 2.7 |
| Anstad 2 | 30 | 10 | 0.4 | 13 | 0.5 |
| Ballstad | 61 | 9 | 0.3 | 19 | 0.7 |
| Sandnes | 62 | 40 | 1.5 | 91 | 3.4 |
| Steiro | 67 | 35 | 1.3 | 79 | 2.8 |
| Mean North-Norway | 56 (18) | 22 (14) | 0.8 (0.5) | 49 (35) | 1.6 (1.2) |
| Bontveit | 87 | 110 | 8.5 | 428 | 32.9 |
| Haramsøy | 96 | 75 | 2.1 | 227 | 6.5 |
| Mjøs | 74 | 45 | 1.9 | 110 | 4.6 |
| Store Karlsøy | 98 | 200 | 11.1 | 996 | 55.3 |
| Strandafjellet | 80 | 90 | 4.5 | 508 | 25.4 |
| Våkendalen 1 | 89 | 40 | 1.3 | 261 | 8.7 |
| Våkendalen 2 | 76 | 45 | 1.6 | 292 | 10.1 |
| Mean West-Norway | 93 (5) | 58 (25) | 4.4 (3.9) | 403 (292) | 20.5 (18.6) |
| Overall mean | 67(25) | 55 (53) | 2.7 (3.3) | 240 (278) | 11.8 (16.4) |
Table 3.
Optimalization process and goodness of fit of two empirical models, spread distances for Sitka spruce in coastal Norway. Alpha and Beta are the model coefficients. i denotes a parameter for each plot, k = parameter for north Norway and west Norway. For the models, Log, AIC, and L-ratio are test statistics. Degrees of freedom = Df; AIC = Akaike’s information criterion.
| Model | Alpha | Beta | Df | Log(Likelihood) | AIC | L-Ratio | p-Value |
|---|---|---|---|---|---|---|---|
| 1 | i | i | 24 | −17,462.18 | 34,972.36 | ||
| 2 | k | i | 14 | −17,561.03 | 35,150.06 | 98.85 | <0.001 |
Table 4.
Coefficients for alpha and beta for Model 1 and 2, spread distances. Model 2 with Alpha = 1 corresponds to a negative exponential model.
| Site | Reg. | Model 1 | Model 2 | ||
|---|---|---|---|---|---|
| Alpha | Beta | Alpha | Beta | ||
| Andøya | N | 1.65 | 10 | 1.55 | 10 |
| Anstad 1 | N | 1.35 | 25 | 1.55 | 25 |
| Anstad 2 | N | 1.95 | 10 | 1.55 | 10 |
| Sandnes | N | 1.45 | 35 | 1.55 | 40 |
| Steiro | N | 1.80 | 35 | 1.55 | 35 |
| Bontveit | W | 1.20 | 115 | 1.00 | 110 |
| Haramsøy | W | 1.20 | 80 | 1.00 | 75 |
| Mjøs | W | 1.10 | 45 | 1.00 | 45 |
| Store Karlsøy | W | 0.95 | 195 | 1.00 | 200 |
| Strandafjellet | W | 1.30 | 100 | 1.00 | 90 |
| Våkendal 1 | W | 0.90 | 40 | 1.00 | 40 |
| Våkendal 2 | W | 0.85 | 40 | 1.00 | 45 |
Table 5.
Distance from edge including 95% and 99% of the expected established saplings given by Model 1. p (estab) denotes the probability for one successful establishment per 10 × 10 m square estimated by Model 1 in distances 25, 100, and 200 m from the edge.
| Site | Reg. | Model 1 | p (estab) | |||
|---|---|---|---|---|---|---|
| 95% | 99% | 25 m | 100 m | 200 m | ||
| Andøya | N | 19 | 25 | 0.39 | - | - |
| Anstad 1 | N | 56 | 78 | 0.35 | 0.00 | - |
| Anstad 2 | N | 18 | 22 | - | - | - |
| Sandnes | N | 75 | 100 | 0.46 | 0.19 | - |
| Steiro | N | 64 | 82 | 0.60 | 0.02 | - |
| Bontveit | W | 287 | 411 | 0.21 | 0.30 | 0.07 |
| Haramsøy | W | 200 | 285 | 0.06 | 0.03 | 0.05 |
| Mjøs | W | 122 | 180 | - | - | - |
| Store Karlsøy | W | 618 | 972 | 0.15 | 0.06 | 0.04 |
| Strandafjellet | W | 232 | 323 | 0.51 | 0.42 | 0.12 |
| Våkendalen 1 | W | 136 | 219 | 0.09 | 0.14 | 0.10 |
| Våkendalen 2 | W | 145 | 242 | 0.39 | 0.17 | 0.08 |
© 2017 by the authors; licensee MDPI, Basel, Switzerland. This article is an open access article distributed under the terms and conditions of the Creative Commons Attribution (CC-BY) license (http://creativecommons.org/licenses/by/4.0/).
Share and Cite
MDPI and ACS Style
Nygaard, P.H.; Øyen, B.-H. Spread of the Introduced Sitka Spruce (Picea sitchensis) in Coastal Norway. Forests 2017, 8, 24. https://doi.org/10.3390/f8010024
AMA Style
Nygaard PH, Øyen B-H. Spread of the Introduced Sitka Spruce (Picea sitchensis) in Coastal Norway. Forests. 2017; 8(1):24. https://doi.org/10.3390/f8010024
Chicago/Turabian StyleNygaard, Per Holm, and Bernt-Håvard Øyen. 2017. "Spread of the Introduced Sitka Spruce (Picea sitchensis) in Coastal Norway" Forests 8, no. 1: 24. https://doi.org/10.3390/f8010024
Note that from the first issue of 2016, this journal uses article numbers instead of page numbers. See further details here.