Article

Temporal Change in Aboveground Culms Carbon Stocks in the Moso Bamboo Forests and Its Driving Factors in Zhejiang Province, China

1
State Key Laboratory of Subtropical Silviculture, Zhejiang A&F University, Lin’an 311300, Zhejiang, China
2
Key Laboratory of Carbon Cycling in Forest Ecosystems and Carbon Sequestration of Zhejiang Province, Zhejiang A&F University, Lin’an 311300, Zhejiang, China
3
School of Environmental and Resources Science, Zhejiang A&F University, Lin’an 311300, Zhejiang, China
*
Author to whom correspondence should be addressed.
The authors contributed equally to this study.
Forests 2017, 8(10), 371; https://doi.org/10.3390/f8100371
Submission received: 21 August 2017 / Revised: 27 September 2017 / Accepted: 28 September 2017 / Published: 30 September 2017
(This article belongs to the Collection Forests Carbon Fluxes and Sequestration)

Abstract

:
Moso bamboo (Phyllostachys pubescens) has high carbon sequestration potential and plays an important role in terrestrial carbon cycling. Quantifying the temporal change in Moso bamboo forest carbon stocks is important for understanding forest dynamics and global climate change feedback capacity. In 2009, 168 Moso bamboo forest sample plots were established in Zhejiang Province using National Forest Continuous Inventory protocols and enhanced measurements. These plots were revisited and remeasured in 2014. By comparing the two years, culms number in age classes 2 and 4 increased by 12.3% and 82.5%, respectively, while that in age classes 1 and 3 decreased by 14.7% and 0.03%, respectively. The total aboveground culms carbon stocks increased by 2.95 Mg C ha−1 in the sample plots. On average, age classes 2 and 4 contributed 25.5% and 86.7% of the change in total carbon stocks, respectively. The carbon sequestrated by aboveground culms was 0.42 Tg C year−1, accounting for 1.55 Tg CO2 year−1 in Moso bamboo over an area of 0.78 million hectares in Zhejiang Province. The change in Moso bamboo carbon stocks did not correlate with environmental factors, but significantly increased with increasing culms number and average diameter at breast height (DBH). Our study helps contribute to improvements in Moso bamboo forest management strategies and promote carbon sequestration capacity.

1. Introduction

Forests play an important role in the global terrestrial carbon cycle; their potential to sequester additional atmospheric carbon dioxide (CO2) is considered a mitigation strategy to reduce global climate warming [1,2,3,4,5,6]. Carbon dynamics in forests have received substantial attention from ecologists and governments [7,8]. Previous studies have revealed the significant and disproportionate contribution of bamboo forest to global carbon cycling [9,10,11,12,13,14,15,16,17]. Therefore, quantifying changes in bamboo forest carbon stocks and identifying the factors driving regional changes are important for understanding bamboo forest carbon dynamics and its feedback with climate change. Additionally, it will facilitate the implementation of bamboo forest carbon management strategies.
Bamboo belongs to the subfamily Bambusoideae in the family Gramineae with about 1500 species worldwide [18,19]. Bamboo forests are widely distributed in the subtropical regions of Asia, Africa, and Latin America, with a total area of 31.5 million hectares globally, accounting for about 0.8% of the world’s total forest area [20]. Because of its special characteristics of asexual reproduction and high economic value, bamboo forest area has gradually increased in many countries [21].
China, known as the “Kingdom of Bamboo”, has more than 500 bamboo species of 39 genera [9]. During the past 30 years, the bamboo industry has rapidly developed under China’s economic reforms [13]. The area of bamboo forest has reached about 6.01 million hectares, 73.8% of which is covered by Moso bamboo (Phyllostachys pubescens ) [22].
Moso bamboo is widely distributed in southern China and has the longest history of cultivation and utilization [23], the highest economic value, and the greatest carbon sequestration capability [10,24,25] relative to other bamboo species in China. Moso bamboo can reach its full height in 2–3 months [26] and accumulate three-fourths of its biomass for an entire yield period in only 40 days [27]; its developed rhizome system can transport carbon and nutrient from full-grown stems to young culms [28,29]. According to previous research, one-fifth of the biomass in subtropical regions and one-fourth of the biomass in tropical regions are represented by bamboo forest [30,31]. Most Moso bamboo ecosystems are within the broad band circumscribed by the Tropics of Cancer and Capricorn, thus its contribution to global carbon sequestration could be substantial [24].
Several studies investigating carbon cycling in bamboo and Moso bamboo forests have confirmed that Moso bamboo forests are important carbon sinks and have high carbon sequestration potential [10,24,32,33]. A comparison of the aboveground carbon sequestration of Moso bamboo and China fir (Cunninghamia lanceolate) indicated that the mean aboveground carbon sequestration of Moso bamboo (8.13 ± 2.15 Mg ha−1 year−1) was significantly higher than that in China fir (3.35 ± 2.02 Mg ha−1 year−1) [11]. However, the previous studies have mostly focused on carbon stocks in each part of the Moso bamboo forest ecosystem (e.g., vegetation, soil, and litter) and have largely ignored the dynamics of carbon stocks and their regional driving factors over time. Because growth and development is complex in multi-year culms of Moso bamboo, it is important to obtain baseline data on growth across many age classes and environments. In this study, we used a dataset that spans a large area and includes many diverse plots that were measured in 2009 and 2014, and addressed two goals: (1) quantify the change in carbon stocks between years and among different culm age groups; and (2) investigate the regional driving factors of changes in Moso bamboo forest carbon stocks.

2. Materials and Methods
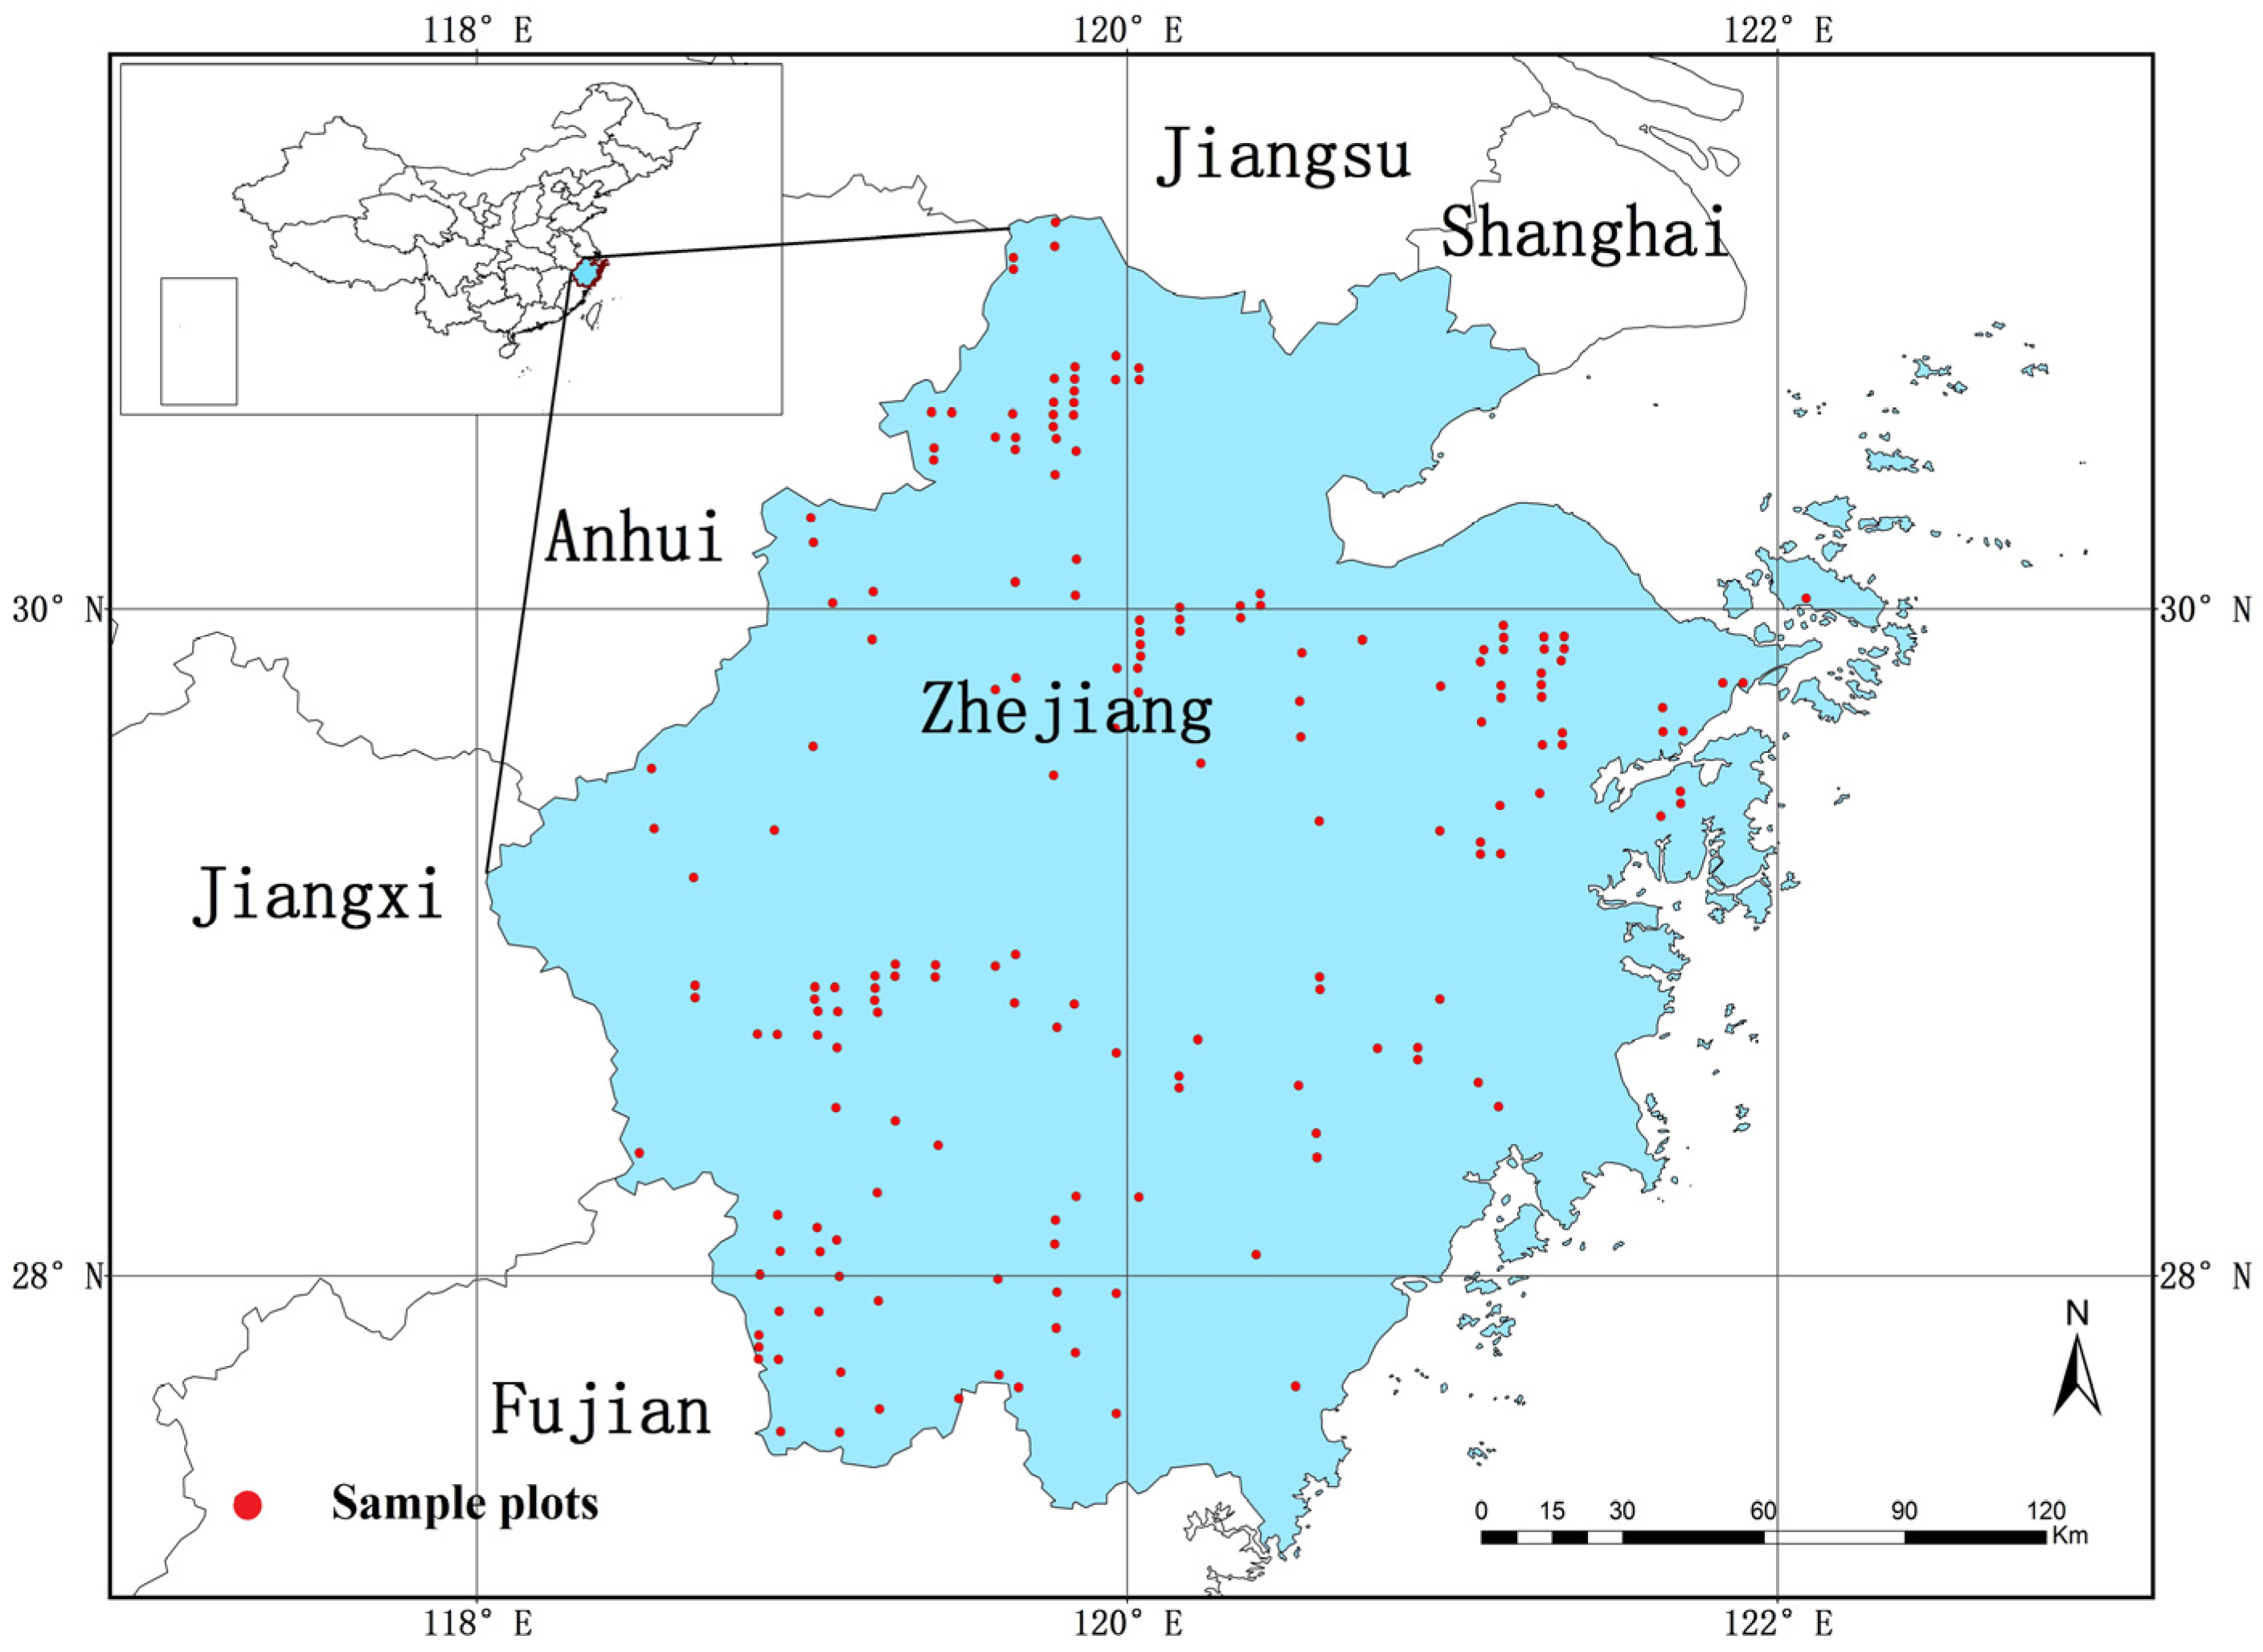
2.1. Research Area

The study area was located in Zhejiang Province (118°1′–123°10′ E, 27°6′–31°11′ N), on the southeast coast of China (Figure 1). The area covers approximately 105,500 km2, and the terrain varies from mountains, with an average altitude of 800 m in the southwest, to hills in the central areas and alluvial plains in the northeast [34]. The area has a subtropical monsoon climate, with average annual precipitation and an average temperature of 1319.7 mm and 15.6 °C, respectively. The primary vegetation types are coniferous evergreen, mixed coniferous, deciduous broad-leaved, and bamboo forest. The primary soil types are yellow and red soils (Chinese Soil Taxonomy), equivalent to Hapludult as per the U.S. Department of Agriculture Soil Survey Manual [35]. By the end of 2014, forest land covered 6.05 million hectares in Zhejiang Province, with live stumpage of 0.28 billion cubic meters, and a forest coverage rate of 60.91% [36]. The Moso bamboo forest accounted for 13.17% of the total forest area (0.78 million hectares) [36]. The average Moso bamboo density was 3026 culms per hectare in Zhejiang Province [36].

2.2. Field Measurements and Carbon Stocks Calculations

Field sample plot design and sampling method follow the National Forest Continuous Inventory Protocols [37]; the east-west interval between the adjacent plots was 6 km, the south-north interval between the adjacent plots was 4 km, and each plot covered an area of 800 m2. As shown in Figure 1, we collected data from a total of 168 sample plots. In each plot, abiotic factors (geomorphology, slope, aspect, slope position, altitude, and soil thickness) and biotic factors (diameter at breast height (DBH), canopy density, culms density, culms age) were recorded in 2009 and 2014. We categorized culms into four age classes: age class 1, one-year-old culms; age class 2, two- and three-year-old culms; age class 3, four- and five-year-old culms; and age class 4, culms greater than five years old [38]. It is important to point out that the belowground component of the Moso bamboo forest was not investigated in our study.
Based on our field data, the aboveground culms biomass (AGCB) (Mg C ha−1) of each plot was calculated as Equation (1) [39].
M T o t a l = ( 0.2404 × x 1 + 0.2525 × x 2 + 0.2405 × x 3 + 0.2517 × x 4 ) D g 1.7044 × N 1.0165
where MTotal represents the total biomass; x1, x2, x3, and x4 represent the number of culms in age classes 1, 2, 3, and 4, respectively, as the percentage of the total number of culms in the plot; Dg represents average DBH; and N represents culms density.
The aboveground culms carbon stocks of each plot were calculated using the MTotal multiplied by 0.5, which is the mean carbon concentration in Moso bamboo tissue [25]. We used the aboveground culms carbon stocks divided by plot area to calculate carbon density (Mg C ha−1).

2.3. Data Analysis

In our study, we calculated the carbon stocks of aboveground culms in all sample plots, and we used the average aboveground culms carbon stocks and the area of Moso bamboo forest to calculate the total aboveground culms carbon stocks in Zhejiang Province. A t-test was performed to compare the average values of aboveground culms carbon stocks of different age classes with the total aboveground culms carbon stocks (p ≤ 0.05). To detect regional patterns, we performed a type II (major axis) regression analysis to test correlations between changes in carbon stocks and biotic (change in culms number and average DBH) and abiotic factors (geomorphology, slope, aspect, slope position, altitude, and soil thickness) in all sample plots combined from 2009 to 2014. The statistical analyses were conducted with the R computing platform [40]. The package lmodel2 and Base R were used in our data analysis in R. Unless otherwise noted, the results were considered statistically significant at or above the 95% level.

3. Results

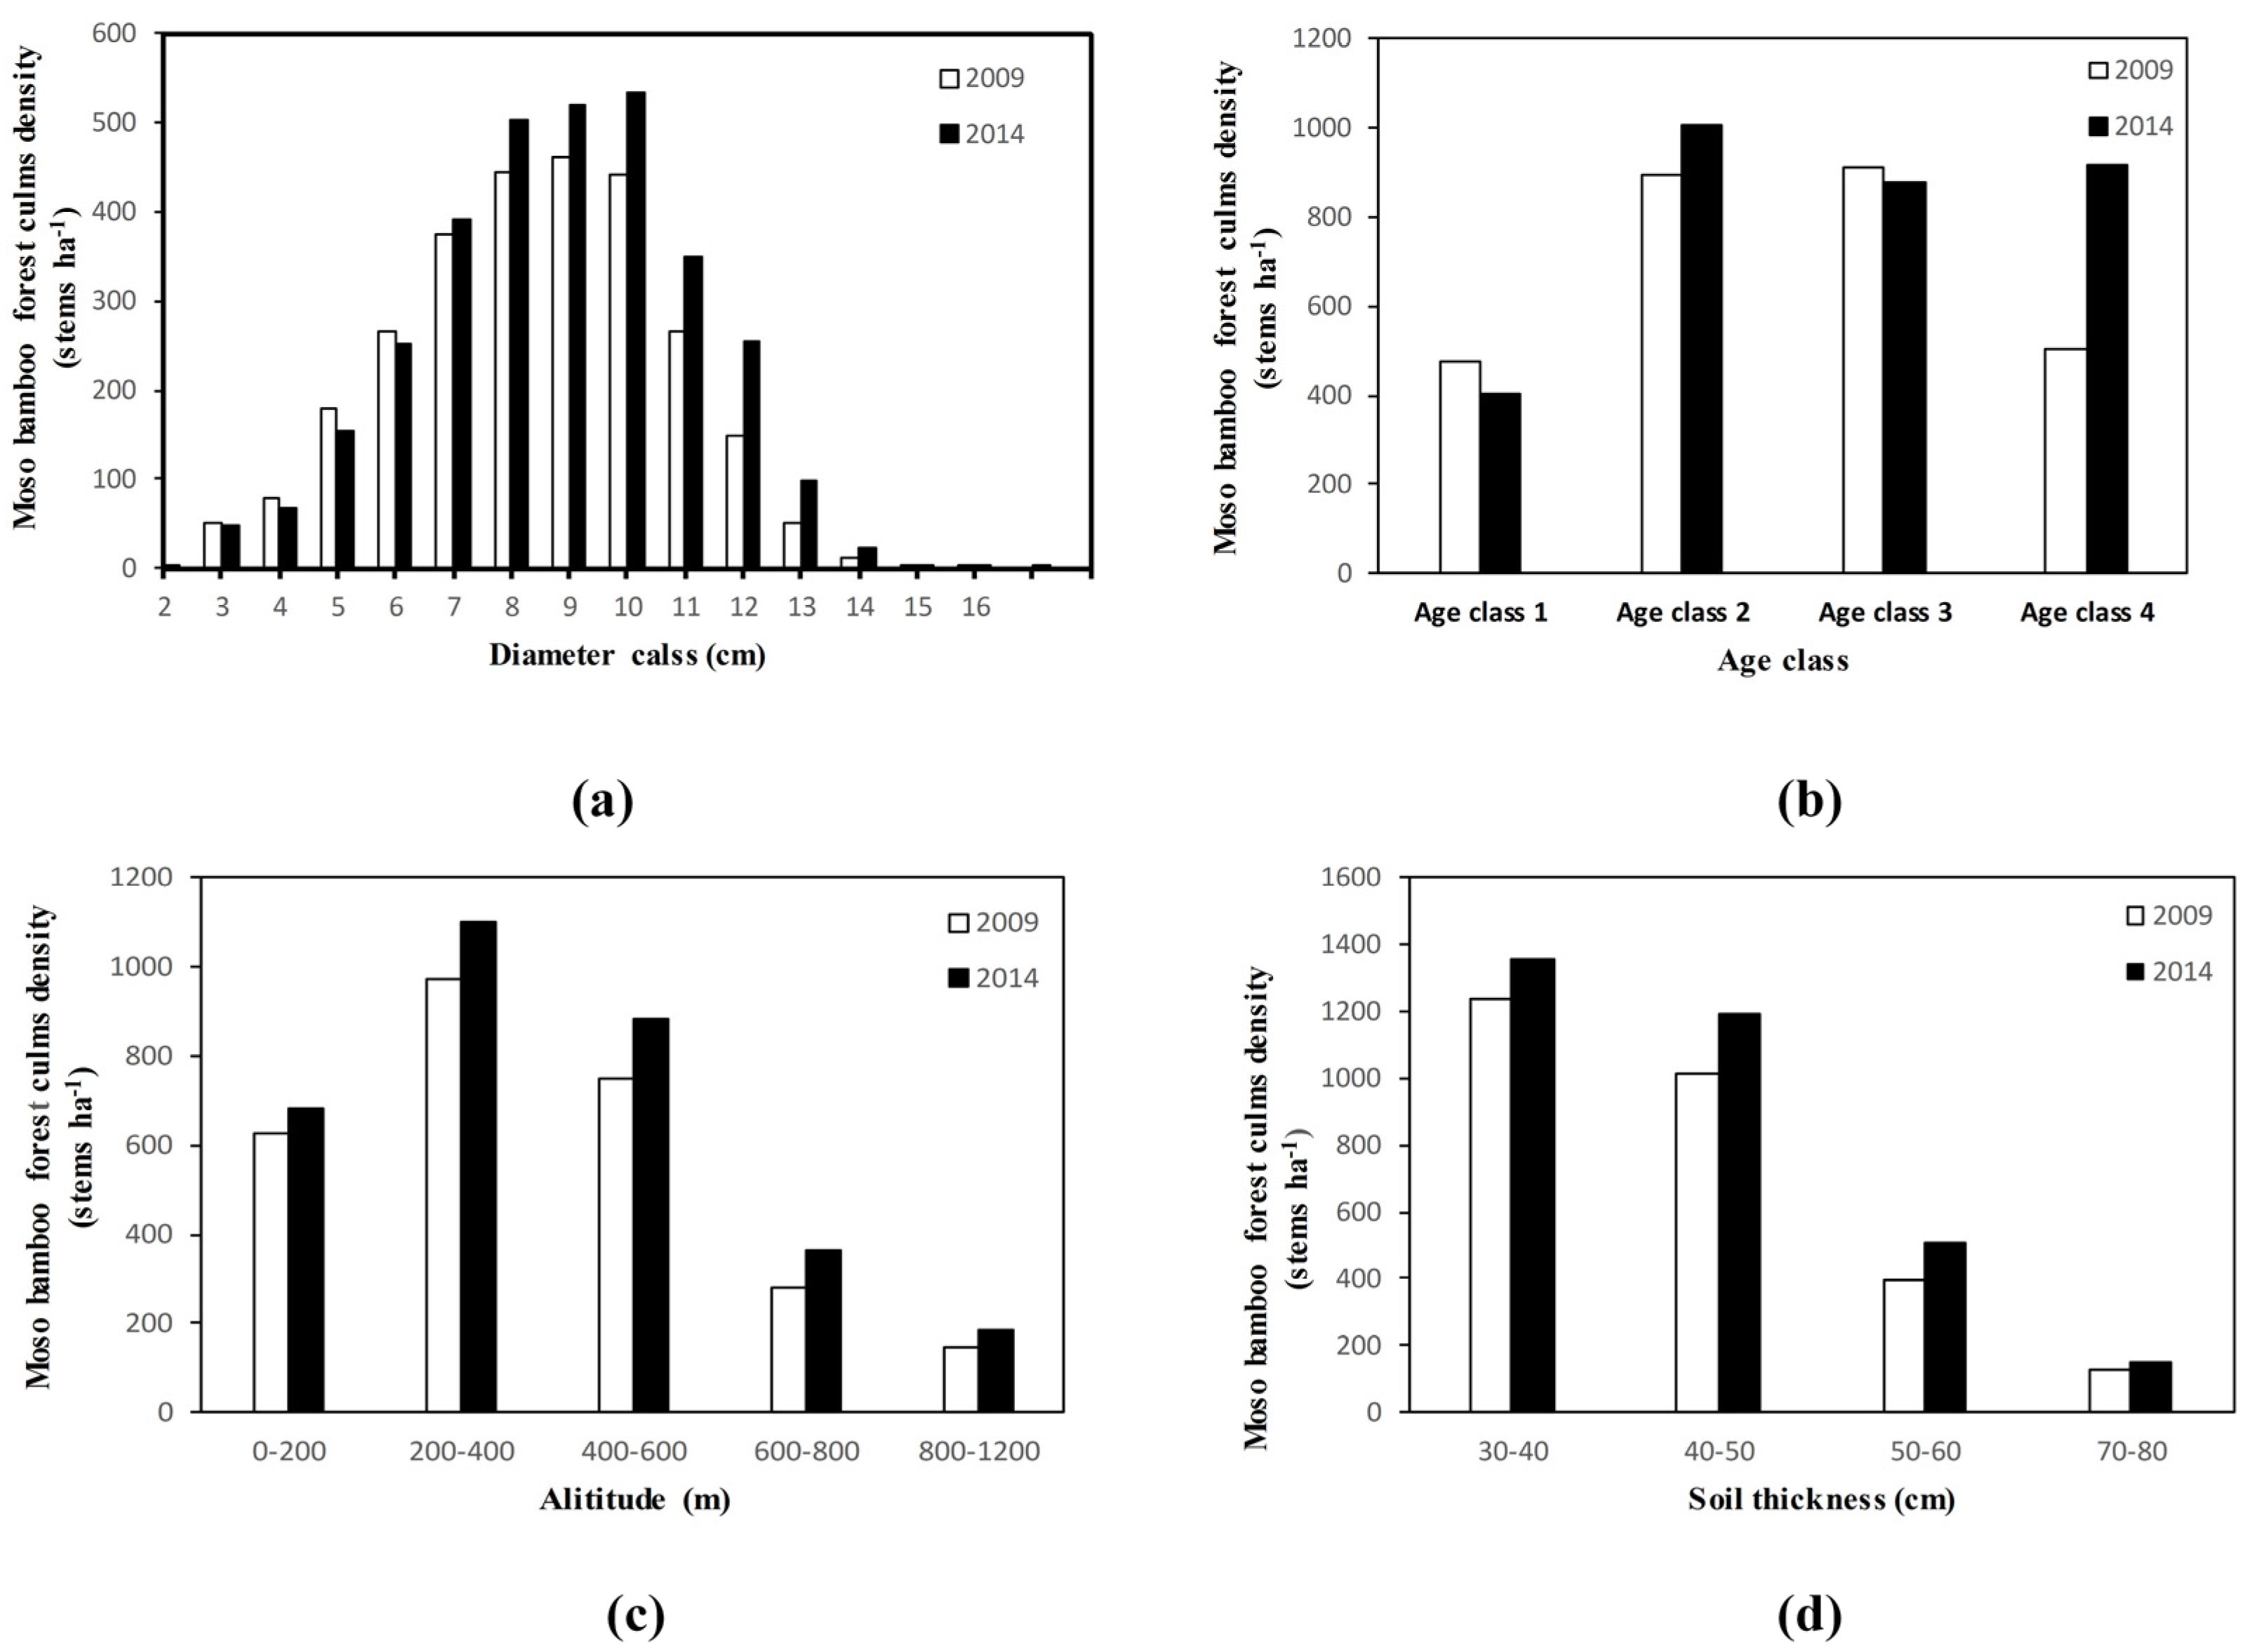
3.1. The Dynamic Distribution of Culms Density

Culms density was greater in 2014 than in 2009, with a 15.3% increase in density observed over this time period. For different diameter classes, density was lower in the 0 to 10 cm diameter class, but higher in the 10 to 20 cm diameter class in all plots in 2014 compared to 2009 (Figure 2a). For different age classes, culms in age classes 2 and 4 increased by 12.3% and 82.5%, respectively, from 2009 to 2014. On the contrary, culms in age classes 1 and 3 decreased by 14.7% and 0.03%, respectively (Figure 2b). Moreover, age class 4 culms density was significantly higher in 2014 than in 2009 (p < 0.001). For both years, we found that 61.9% of the culms were distributed at an altitude from 200 to 600 m (Figure 2c), and 80.2% were encountered in 30–50 cm soil thickness (Figure 2d).

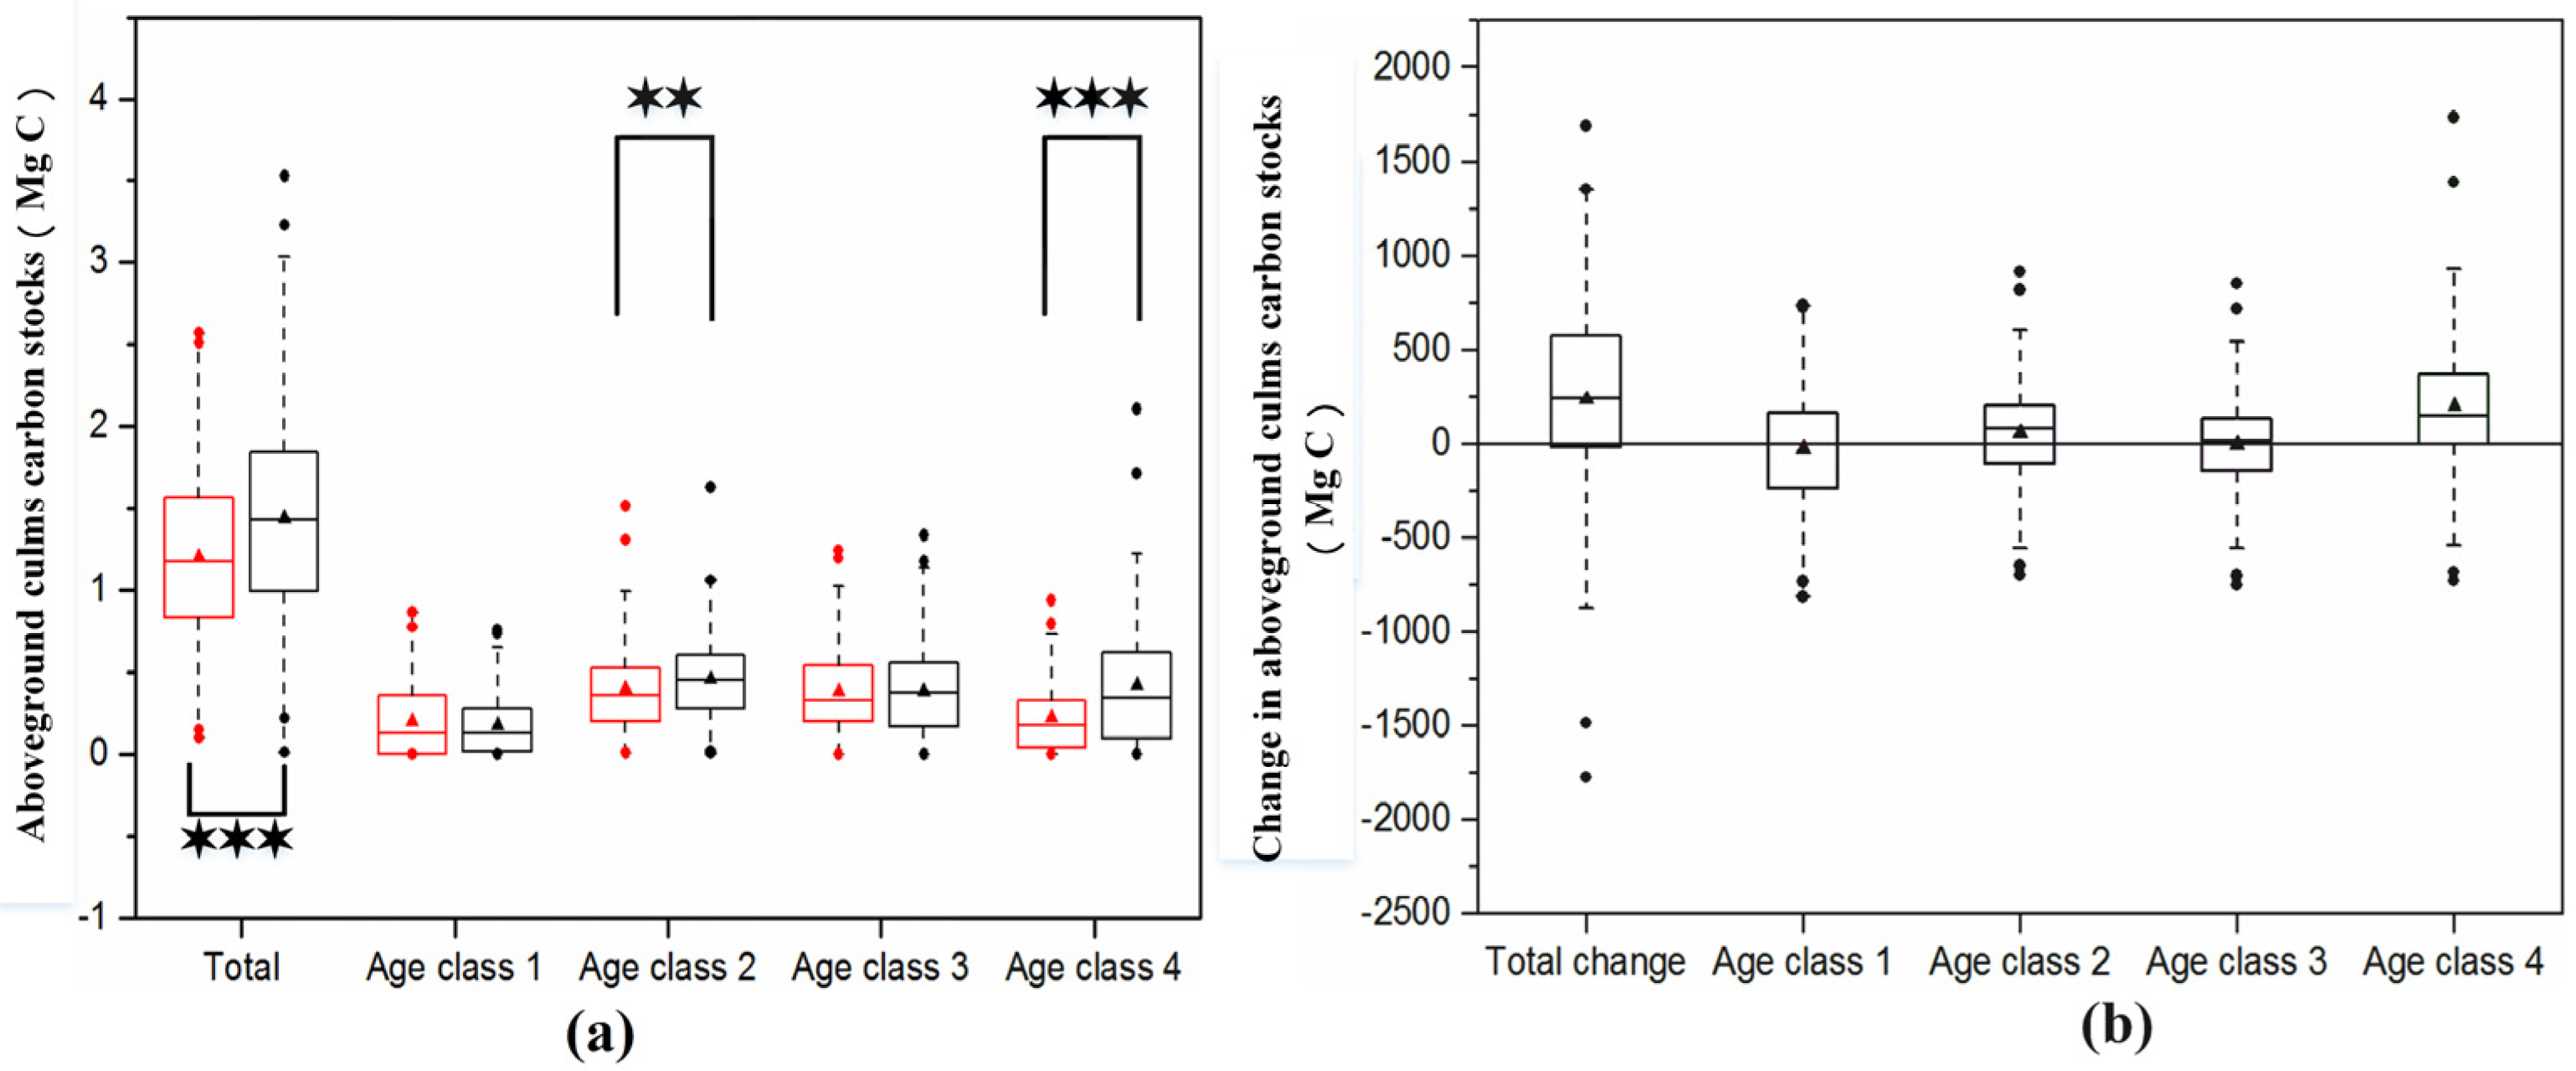
3.2. Change in Moso Bamboo Forest Carbon Stocks

For the 168 plots, the total aboveground culms carbon storage was 15.01 Mg C ha−1 in 2009, and 17.96 Mg C ha−1 in 2014 (Figure 3a). The change in total carbon stocks was 2.95 Mg C ha−1 over the five years; age classes 1 and 3 decreased by 0.32 and 0.04 Mg C ha−1, respectively, while age classes 2 and 4 increased by 0.75 and 2.57 Mg C ha−1 in all sample plots, respectively. The results of the t-test analysis showed that carbon stocks increased significantly in age classes 2 (t = −2.94, p = 0.004 **) and 4 (t = −7.07, p < 0.001 ***), but did not significantly decrease in age classes 1 (t = 1.069, p = 0.287) and 3 (t = 0.148, p = 0.883). Among all sample plots, age classes 2 and 4 were the main contributors to changes in total carbon stocks. On average, age classes 2 and 4 contributed positively (25.5% and 86.7%, respectively) to changes in the total aboveground culms carbon stocks, while age classes 1 and 3 contributed negatively (−10.9% and −0.1%, respectively) (Figure 3b).
Average aboveground culms carbon stocks increased from 15.01 Mg C ha−1 in 2009 to 17.96 Mg C ha−1 in 2014, an increase of 19.8%. Based on the average aboveground culms carbon stocks and the area of Moso bamboo forest in Zhejiang Province, we calculated that the total aboveground culms carbon stocks of Moso bamboo in Zhejiang province were 10.75 Tg C in 2009 and 14.11 Tg C in 2014. The net average aboveground culms carbon storage change between the two periods was 0.59 Mg C ha−1 year−1; the average annual aboveground culms carbon sequestration value was 0.42 Tg C year−1, accounting for 1.55 Tg CO2 year−1 for the entire Moso forests in the Zhejiang Province. Our results suggest that the Moso bamboo forest in Zhejiang Province has a strong carbon sequestration capacity and was a carbon sink from 2009 to 2014.

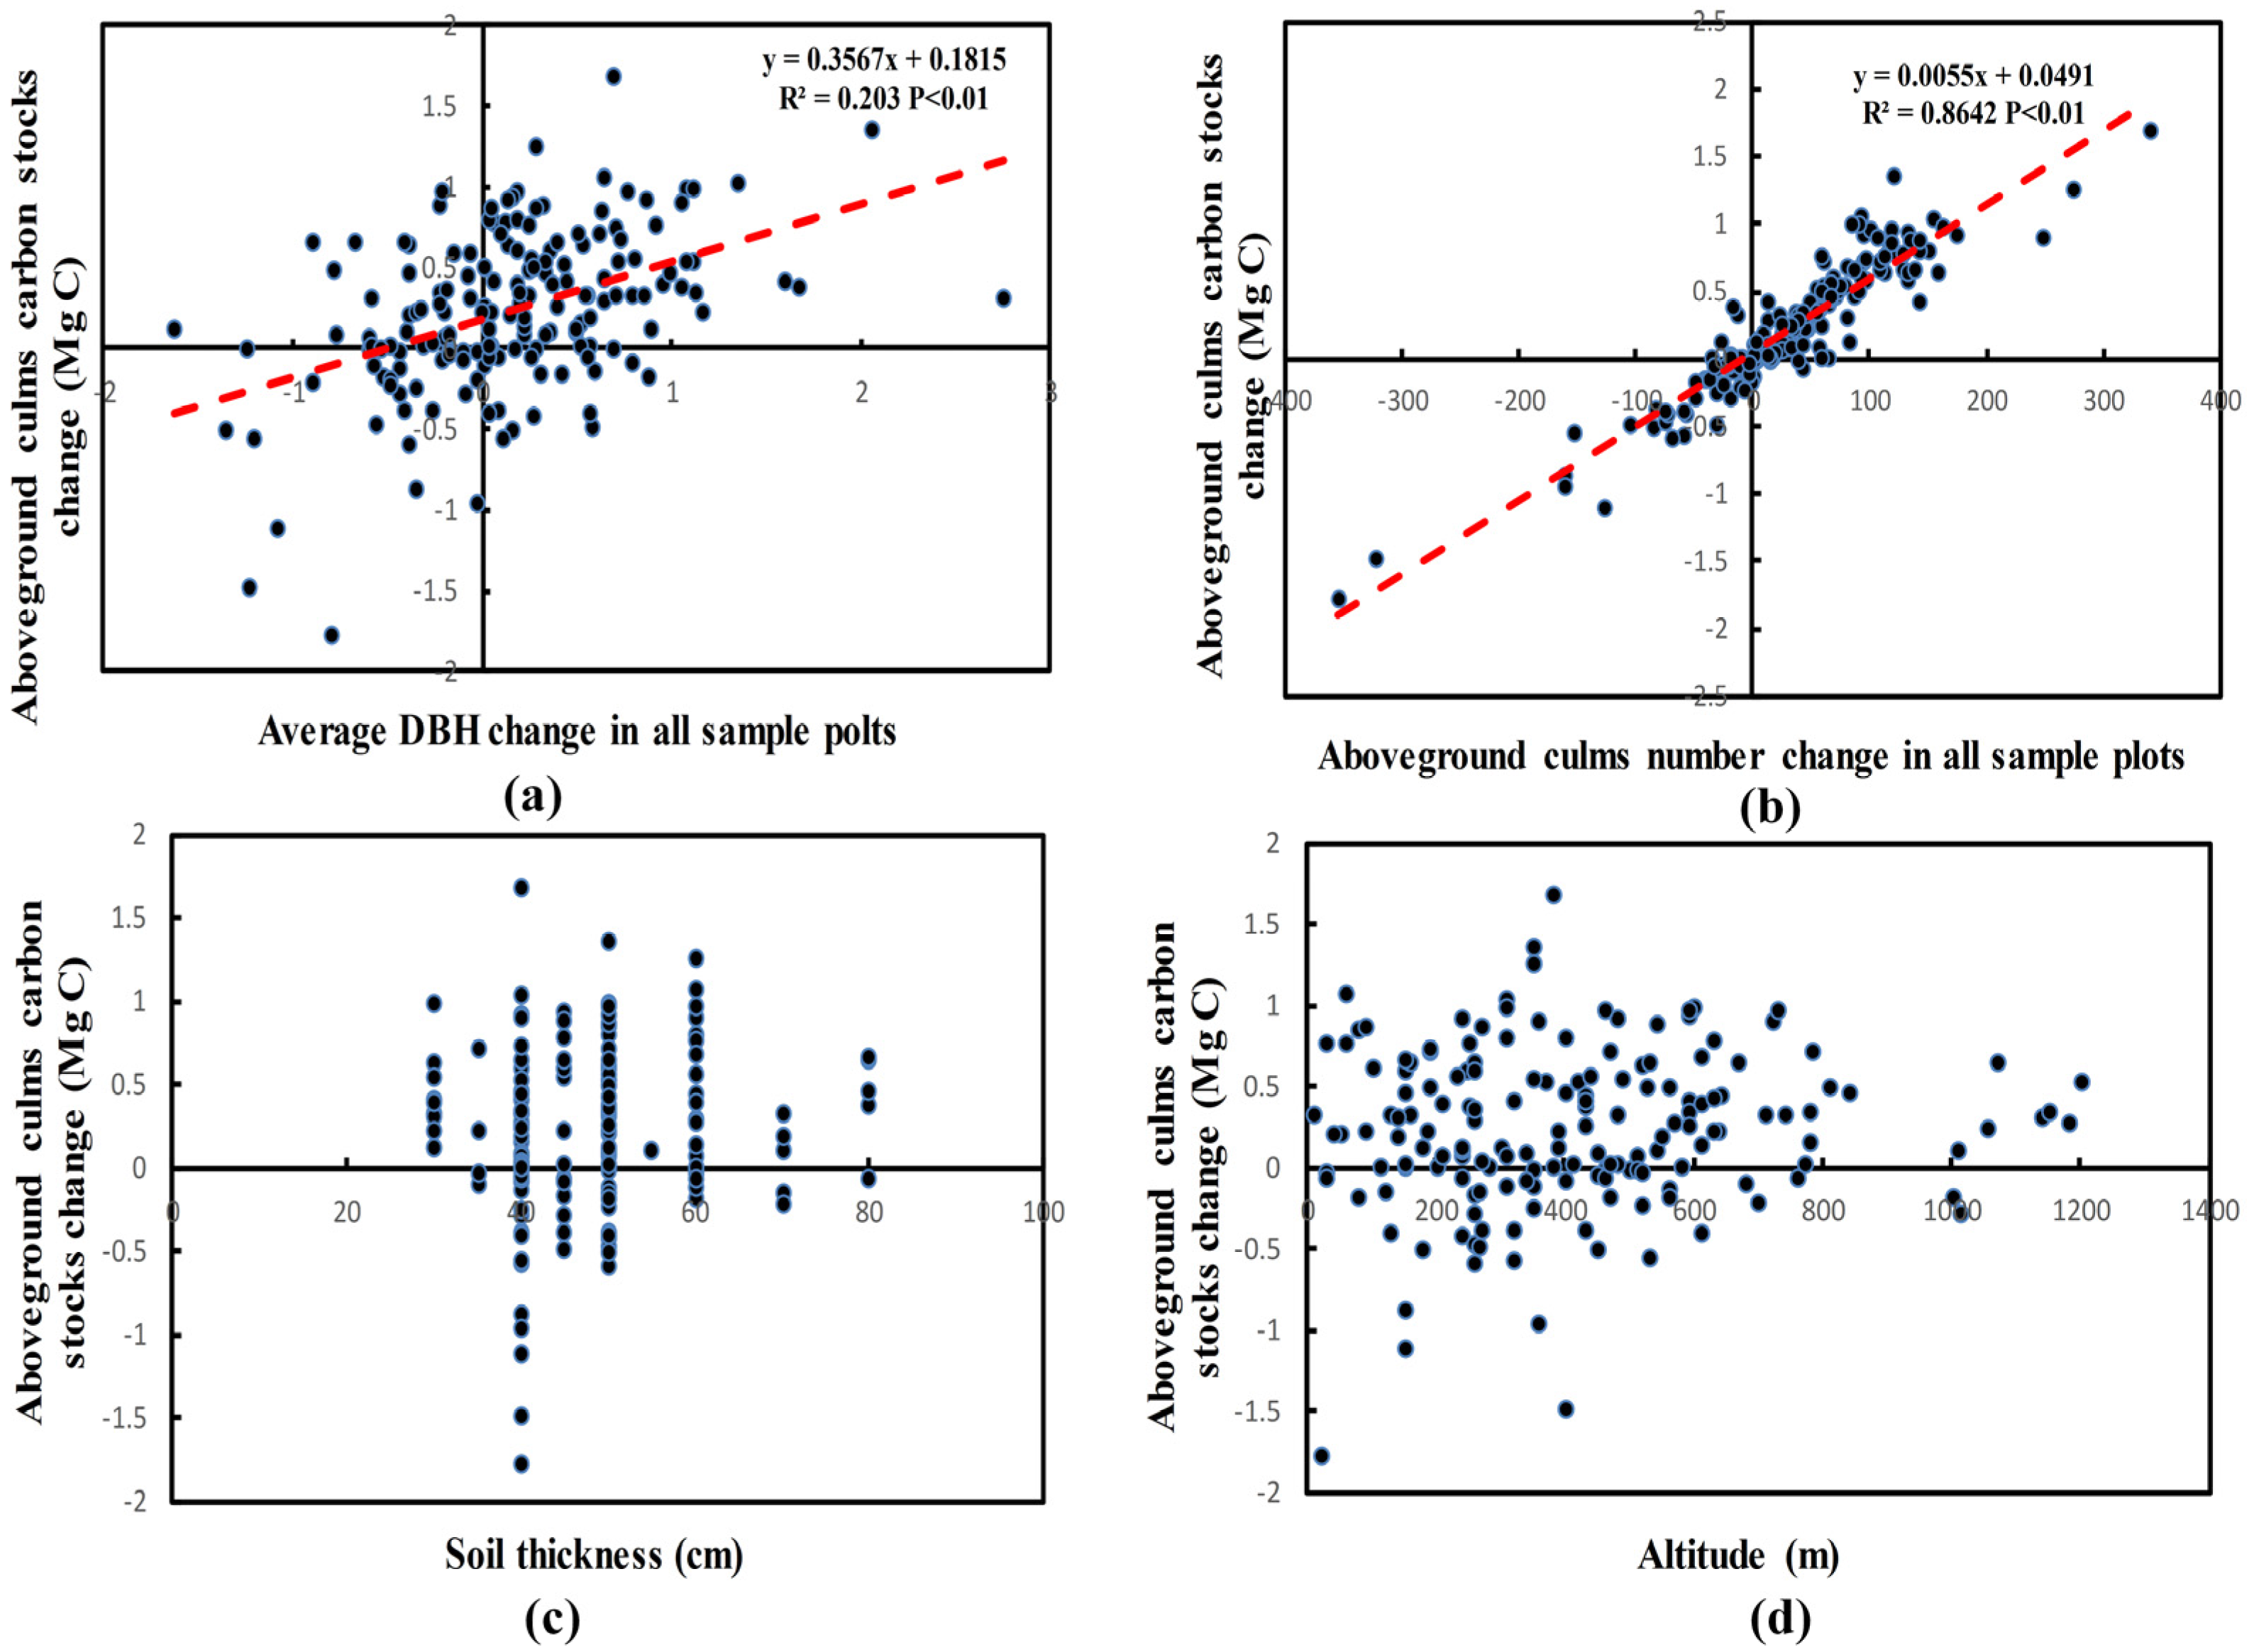
3.3. Driving Factors of Carbon Stocks Change

For all sample plots, type II (major axis) regression analysis showed that the change in aboveground culms carbon stocks was poorly correlated with abiotic factors (Table 1, Figure 4). Statistical significance (p values) of abiotic factors increased in the order: soil thickness < altitude < geomorphology < slope position < aspect < slope, respectively. However, stronger correlations were detected between carbon stocks change and biotic factors (change in culms number and average DBH). Carbon stocks change was significantly positively correlated with the change in culms number (R2 = 0.86, p < 0.001). The change in carbon stocks was also significantly correlated with change in average DBH (R2 = 0.20, p < 0.001) (Table 1, Figure 4). In contrast to other types of trees (gymnosperms and angiosperms), the culms density clearly varies over time and space, and the DBH of Moso bamboo does not substantially change over time in a stem, resulting in average DBH of a sample plot changing over time and space as the culms density changes.

4. Discussion

4.1. Change in Culms Density in the Moso Bamboo Forest

Culms number increased by 15.3% from 2009 to 2014. For different diameter classes, the number of culms in the 0–10 cm diameter class decreased, but that in the 10–20 cm diameter class increased from 2009 to 2014. This suggests that, compared to 2009, in 2014, the Moso bamboo forest was in a later successional stage. For different altitudes and soil thicknesses, we found that 61.9% of all culms were distributed at an altitude from 200 to 600 m (Figure 2c), with 80.2% in 30–50 cm soil thickness (Figure 2d). The distribution may be due to various abiotic factors such as soil nutrients, water, or microclimate conditions.
The number of culms in age classes 2 and 4 was higher in 2014 than in 2009, while there were fewer in age classes 1 and 3 (Figure 2b). Moreover, the number of culms in age class 4 significantly increased in 2014 (p < 0.001). This change in density may be due to on- and off-year phenomena and changes in selective cutting intensity in the Moso bamboo forest. The on- and off-year phenomena specifically affects the Moso bamboo forest ecosystem [13]. In off-years, Moso bamboo shooting is frequent, while the belowground rhizome grows slowly; in on-years, shooting is minimal, while the belowground rhizome grows quickly. This phenomenon usually alternates every two years. According to the change in age class density in our study, 2009 was probably an on-year and 2014 was likely an off-year. Thus, in 2014, the number of culms in age classes 2 and 4 was higher, while the number in age classes 1 and 3 was lower. Climate change [41], the regulation of endogenous phytohormone [42,43], the unique style of bamboo growth [44], the integral structure of the culms-rhizome system [45], and bamboo forest soil nutrients have been shown as reasons for this phenomenon [38]. Secondly, in recent years, with the increase in labor cost and the lower price of bamboo wood, the enthusiasm of farmers to harvest Moso bamboo has declined; this may have reduced the selective cutting intensity for age class 4 bamboo. We hypothesize that this was the main reason for the change in the number of culms in age class 4, which increased by 82.5% from 2009 to 2014.

4.2. Large Carbon Sink Potential in the Moso Bamboo Forest

Aboveground culms carbon stocks differed significantly between 2009 and 2014 (Figure 3a). The carbon stocks change decreased in age classes 1 and 3, but increased significantly in age classes 2 and 4 (Figure 3b). On average, age classes 2 and 4 contributed to 25.5% and 86.7%, respectively, of the change in the total aboveground culms carbon stocks, while age classes 1 and 3 contributed to −10.9% and −0.1%, respectively (Figure 3b). Our results suggest that age class 4 bamboo contributed the most to carbon accumulation in the Moso bamboo forest. However, other studies showed that the amount of carbon accumulation in older bamboo only accounted for about 6.32% [12,46]. The reason for the different results may be because previous studies focused on individual plants over a short period. Thus, these previous results cannot be applied to our long-term study on a regional scale in the Moso bamboo forest.
The change in carbon stocks for each age class was consistent with the change in culms number. The change in the number of culms in different age classes, with greater capability of carbon fixation by age class 4 plants [47], may be responsible for the change in carbon stocks. Our results showed that carbon stocks in each age class were not equal in 2009 and 2014. The carbon stocks were equally distributed among the age classes, which may only be applicable to bamboo forests with intensive management; extensive management stands displayed large variations in carbon stocks among each age class [38]. Therefore, our results indicate that the Moso bamboo forest was under extensive management from 2009 to 2014 in Zhejiang Province. This may be why the change in the average aboveground culms carbon stocks was low in Zhejiang Province.
The average aboveground culms carbon stocks in the Moso bamboo forest (15.01 and 17.96 Mg C ha−1 in 2009 and 2014, respectively) were greater than those reported previously for Moso bamboo in Zhejiang Province in 2004 (13.00 Mg C ha−1) [39] (Table 2). Our results indicated that carbon stocks in aboveground culms in Moso bamboo increased annually. The total aboveground culms carbon stocks (10.75 Tg C in 2009) were close to the results of Zhejiang Province’s Moso bamboo forest vegetation biomass assessment (10.37 Tg C) [48] (Table 2). However, the changes in the average aboveground culms carbon stocks and carbon stocks in our study were lower than those for Moso bamboo stands managed by farmers in the lower mountain areas of central Taiwan (40.6 Mg C ha−1 and 8.13 Mg C ha−1 year−1) [11,49] (Table 2). Our results show that the Moso bamboo forest has a large carbon sequestration potential through management strategies that could be implemented in the near future in Zhejiang Province. To our knowledge, this is the first study to confirm that Moso bamboo in Zhejiang province has a high carbon sequestration potential, from a management perspective.
According to the average carbon stocks change in our study from 2009 to 2014, we estimated that the carbon sequestrated by aboveground culms in the Moso bamboo forest was 0.42 Tg C year−1 in Zhejiang Province, which was far lower than the carbon sequestrated by bamboo forests (1.74 Tg C year−1) (Table 2), as simulated using a Boreal Ecosystem Productivity Simulator (BEPS) model [34]. Although the Moso bamboo forest occupies approximately 86% of the bamboo forest area in Zhejiang Province, we suspect that the simulation model overestimated the carbon sequestrated by bamboo forests.
In our study, we just considered the aboveground culms carbon stocks in Moso bamboo forests. However, we recommend that the ecosystem of Moso bamboo is important in regional and global carbon cycling. The study results showed that the total carbon storage in the ecosystems of Moso bamboo, Chinese fir, slash pine (Pinus elliottii), and Masson pine (Pinus massoniana) stands were 104.83, 95.66, 104.07, and 96.49 Mg C ha−1, respectively. The annual carbon sequestration of the Moso bamboo forest ecosystems were 1.69 and 1.63 times higher than the Chinese fir and Masson pine forest ecosystems [50,51]. Moreover, since age 4 class culms are cut down in alternate years and the thinned Moso bamboo biomass accounts for one-third of current total biomass, Moso bamboo forests stands are always in a dynamic equilibrium with the rate of growth [10]. Accordingly, the mean aboveground carbon sequestration of Moso bamboo is not dependent on cultivation years. Generally, it can be concluded that Moso bamboo forest may be one of the most important forest vegetation types for regional and global carbon sequestration.

4.3. Implications for Regional Carbon Sequestration and Moso Bamboo Forest Management

In the terrestrial ecosystem carbon cycle, Moso bamboo forests and products play a critical role in carbon sequestration [24]. Most of the previous studies have shown that the productivity and carbon sequestration capacity of the Moso bamboo forest are strongly correlated with management strategies [10,11,38]. Selective cutting is a necessary and essential method of maintaining forest productivity [11,12,52]. Many researchers have studied ways to improve the productivity of the Moso bamboo forest, and a common selective cutting strategy is that age classes 4 and below should not be harvested [53,54], as age classes 4 and below have high photosynthetic capacity, which is important for the following year’s Moso bamboo shoots [55,56,57]. Farmers usually harvest all the old culms (age classes 4) every 2 years during autumn in order to achieve the maximum economic return [58]. However, our results showed that Moso bamboo culms in age class 4 contributed to 86.7% of changes in the total aboveground culms carbon stocks in all sample plots. Therefore, existing selective cutting was decreasing the increase in carbon stocks of the Moso bamboo forest in Zhejiang Province. This may be one of the reasons for the lower change in the average aboveground culms carbon stocks in the Moso bamboo forest in Zhejiang Province. Our data suggests that a 30% of the 6-year-old culms, 80% of the 7-year-old culms, and 100% of the 8-year-old and older culms harvest, as proposed by Mao et al. (2017), may be more applicable to the Moso bamboo.
In contrast to other types of trees (gymnosperms and angiosperms), the culms density clearly varies over time and space. Although the DBH of Moso bamboo does not substantially change over time in a stem, average DBH of a plot changes over time and space as the culms density changes. Therefore, the changes in culms density and DBH are the main reasons for changes in carbon stock. We suggest that Moso bamboo forest management strategies should closely consider optimal culms density in order to increase average DBH, ensuring sustainable forest development and continual carbon sequestration. Our results provide important information for understanding the dynamic changes in Moso bamboo forest carbon stocks and improving regional management.

5. Conclusions

This study analyzed the changes in aboveground culms carbon stocks in the Moso bamboo forest in Zhejiang Province from 2009 to 2014. The total aboveground culms carbon stock increased by 2.95 Mg C ha−1 in all plots from 2009 to 2014. On average, age classes 2 and 4 contributed to 25.5% and 86.7% of the change in the total aboveground culms carbon stocks, respectively. Average carbon stocks in aboveground culms in the Moso bamboo forest in Zhejiang Province were 15.01 Mg C ha−1 in 2009 and 17.96 Mg C ha−1 in 2014. The total aboveground culms carbon stocks of Moso bamboo forests in Zhejiang Province were 10.75 and 14.11 Tg C in 2009 and 2014, respectively.
The change in the average aboveground culms carbon stocks in the Moso bamboo forest was 0.59 Mg C ha−1 year−1, and the average amount of annual carbon sequestrated was 0.42 Tg C year−1 from 2009 to 2014, accounting for 1.55 Tg CO2 year−1 for the entire Moso bamboo forests in the Zhejiang Province. The change in carbon stocks did not correlate with environmental factors, but significantly increased with the increase in culms number. We also recommend that further research on belowground component carbon stocks in Moso bamboo forests should be investigated in order to better understand the dynamic of carbon stocks in belowground components.
Extensive management was predominant in the management of the Moso bamboo forest in Zhejiang Province from 2009–2014. Moso bamboo forest in Zhejiang Province was a carbon sink, and will have a great carbon sink potential through appropriate management strategies implemented in the coming future.

Acknowledgments

This study was supported by the National Natural Science Foundation of China (grant number: 31370637, 61190114), and Central Fiscal Forestry Science and Technology Extension Demonstration Project (grant number: 2017TS07), and China Green Carbon Sink Foundation Project (grant number: H20170049), and Zhejiang province key science and technology projects (grant number: 2015C03008). We are also thankful for the help of the Center for Forest Resource Monitoring of Zhejiang Province for data reduction.

Author Contributions

The analysis was performed by Lin Xu. All authors contributed with ideas, writing, and discussion.

Conflicts of Interest

The authors declare no conflict of interest.

References

  1. Xu, B.; Pan, Y.; Plante, A.F.; Johnson, A.; Cole, J.; Birdsey, R. Decadal change of forest biomass carbon stocks and tree demography in the Delaware River Basin. For. Ecol. Manag. 2016, 374, 1–10. [Google Scholar] [CrossRef]
  2. Luyssaert, S.; Inglima, I.; Jung, M.; Richardson, A.D.; Reichstein, M.; Papale, D. CO2 balance of boreal, temperate, and tropical forestsderived from a global database. Glob. Chang. Biol. 2007, 13, 2509–2537. [Google Scholar] [CrossRef]
  3. Pan, Y.; Birdsey, R.A.; Fang, J.; Houghton, R.; Kauppi, P.E.; Kurz, W.A.; Phillips, O.L.; Shvidenko, A.; Lewis, S.L.; Canadell, J.G. A large and persistent carbon sink in the world’ s forests. Science 2011, 333, 988–993. [Google Scholar] [CrossRef] [PubMed]
  4. Ciais, P.; Sabine, C.; Bala, G.; Bopp, L.; Brovkin, V.; Canadell, J. Carbon and Other Biogeochemical Cycles; Cambridge University Press: Cambridge, UK; New York, NY, USA, 2013. [Google Scholar]
  5. Li, B.; Song, Z.; Wang, H.; Li, Z.; Jiang, P.; Zhou, G. Lithological control on phytolith carbon sequestration in Moso bamboo forests. Sci. Rep. 2014, 4, 5262. [Google Scholar] [CrossRef] [PubMed]
  6. Song, Z.; Liu, H.; Cae, S.; Yang, X.; Zhang, X. Phytolith carbon sequestration in global terrestrial biomes. Sci. Total Environ. 2017, 603–604, 502–509. [Google Scholar] [CrossRef] [PubMed]
  7. Intergovernmental Panel on Climate Change (IPCC). Climate change 2007: The physical science basis. In Contribution of Working Group I to the Fourth Assessment Report of the Intergovernmental Panel on Climate Change; Cambridge University Press: Cambridge, UK; New York, NY, USA, 2007. [Google Scholar]
  8. Sabine, C.L.; Feely, R.A.; Gruber, N.; Key, R.M.; Lee, K.; Bullister, J.L.; Wanninkhof, R.; Wong, C.S.; Wallace, D.W.R.; Tilbrook, B.; et al. The oceanic sink for anthropogenic CO2. Science 2004, 305, 367–371. [Google Scholar] [CrossRef] [PubMed] [Green Version]
  9. Chen, X.G.; Zhang, X.Q.; Zhang, Y.P.; Booth, T.; He, X.H. Changes of carbon stocks in bamboo stands in China during 100 years. For. Ecol. Manag. 2009, 258, 1489–1496. [Google Scholar] [CrossRef]
  10. Zhou, G.M.; Meng, C.F.; Jiang, P.K.; Xu, Q.F. Review of Carbon Fixation in Bamboo Forests in China. Bot. Rev. 2011, 77, 262–270. [Google Scholar] [CrossRef]
  11. Yen, T.M.; Lee, J.S. Comparing aboveground carbon sequestration between Moso bamboo (Phyllostachys heterocycla) and China fir (Cunninghamia lanceolata) forests based on the allometric model. For. Ecol. Manag. 2011, 261, 995–1002. [Google Scholar] [CrossRef]
  12. Mao, F.; Zhou, G.; Li, P.; Du, H.; Xu, X.; Shi, Y.; Mo, L.; Zhou, Y.; Tu, G. Optimizing selective cutting strategies for maximum carbon stocks and yield of Moso bamboo forest using BIOME-BGC model. J. Environ. Manag. 2017, 191, 126–135. [Google Scholar] [CrossRef] [PubMed]
  13. Mao, F.; Li, P.; Zhou, G.; Du, H.; Xu, X.; Shi, Y.; Mo, L.; Zhou, Y.; Tu, G. Development of the BIOME-BGC model for the simulation of managed Moso bamboo forest ecosystems. J. Environ. Manag. 2016, 172, 29–39. [Google Scholar] [CrossRef] [PubMed]
  14. Shang, Z.; Zhou, G.; Du, H.; Xu, X.; Shi, Y.; Lü, Y.; Zhou, Y.; Gu, C. Moso bamboo forest extraction and aboveground carbon storage estimation based on multi-source remotely sensed images. Int. J. Remote Sens. 2013, 34, 5351–5368. [Google Scholar] [CrossRef]
  15. Han, N.; Du, H.; Zhou, G.; Xu, X.; Cui, R.; Gu, C. Spatiotemporal heterogeneity of Moso bamboo aboveground carbon storage with Landsat Thematic Mapper images: A case study from Anji County, China. Int. J. Remote Sens. 2013, 34, 4917–4932. [Google Scholar] [CrossRef]
  16. Li, X.; Mao, F.; Du, H.; Zhou, G.; Xu, X.; Han, N.; Sun, S.; Gao, G.; Chen, L. Assimilating leaf area index of three typical types of subtropical forest in China from MODIS time series data based on the integrated ensemble Kalman filter and PROSAIL model. ISPRS. J. Photogram. Remote Sens. 2017, 126, 68–78. [Google Scholar] [CrossRef]
  17. Du, H.Q.; Zhou, G.M.; Fan, W.Y.; Ge, H.L.; Xu, X.J.; Shi, Y.J.; Fan, W.L. Spatial heterogeneity and carbon contribution of aboveground biomass of Moso bamboo by using geostatistical theory. Plant Ecol. 2009, 207, 131–139. [Google Scholar] [CrossRef]
  18. Gratani, L.; Crescente, M.F.; Varone, L.; Fabrini, G.; Digiulio, E. Growth pattern and photosynthetic activity of different bamboo species growing in the Botanical Garden of Rome. Flora 2008, 203, 77–84. [Google Scholar] [CrossRef]
  19. Li, Z.; Kobayashi, M. Plantation future of bamboo in China. J. For. Res. 2004, 15, 233–242. [Google Scholar] [CrossRef]
  20. Food and Agriculture Organization (FAO). Global Forest Resources Assessment 2010: Main Report; Food and Agriculture Organization of the United Nations: Rome, Italy, 2010. [Google Scholar]
  21. Guo, Q.R.; Yang, G.Y.; Du, T.Z.; Shi, J.M. Carbon character of Chinese bamboo forest. World Bamboo Rattan 2005, 3, 25–28. (In Chinese) [Google Scholar]
  22. Statse Forestry Administration of China. Forest Resources in China—The 8th National Forest Inventory; Statse Forestry Administration of China: Beijing, China, 2015.
  23. Jung, C.; Lowdermilk, W. Forestry. In Agroindustries and Forestry; Daniels, C.A., Menzies, N.K., Eds.; Cambridge University Press: Cambridge, UK, 1996; pp. 540–667. [Google Scholar]
  24. Li, P.; Zhou, G.; Du, H.; Lu, D.; Mo, L.; Xu, X.; Shi, Y.; Zhou, Y. Current and potential carbon stocks in Moso bamboo forests in China. J. Environ. Manag. 2015, 156, 89–96. [Google Scholar] [CrossRef] [PubMed]
  25. Zhou, G.M. Carbon Storage, Fixation and Distribution in Moso bamboo (Phyllostachy pubescens) Stands Ecosystem; Zhejiang University: Hangzhou, China, 2006. [Google Scholar]
  26. Fu, J.H. Chinese Moso bamboo: Its importance. Bamboo 2001, 22, 5–7. [Google Scholar]
  27. Yen, T.M. Culm height development, biomass accumulation and carbon storage in an initial growth stage for a fast-growing Moso bamboo (Phyllostachy pubescens). Bot.Stud. 2016, 57, 1–9. [Google Scholar] [CrossRef] [PubMed]
  28. Li, Y.; Zeng, Q.; Wu, Z.; Zhou, G.; Chen, B. Estimation of amount of carbon pool in natural tropical forest of China. For. Res. 1998, 11, 156–162. (In Chinese) [Google Scholar]
  29. Komatsu, H.; Onozawa, Y.; Kume, T.; Tsuruta, K.; Shinohara, Y.; Otsuki, K. Canopy conductance for a Moso bamboo (Phyllostachys pubescens) forest in western Japan. Agric. For. Meteorol. 2012, 156, 111–120. [Google Scholar] [CrossRef]
  30. Zhou, B.; Fu, M.; Xie, J.; Yang, X.; Li, Z. Ecological functions of bamboo forest: Research and application. J. For. Res. 2005, 16, 143–147. (In Chinese) [Google Scholar]
  31. Anonymous. Healing degraded land. INBAR Mag. 1997, 5, 40–45. [Google Scholar]
  32. Zhou, G.; Xu, X.; Du, H.; Ge, H.; Shi, Y.; Zhou, Y. Estimating aboveground carbon of Moso bamboo forests using the k nearest neighbors technique and satellite imagery. Photogramm. Eng. Remote Sens. 2011, 77, 1123–1131. [Google Scholar] [CrossRef]
  33. Du, H.Q.; Zhou, G.M.; Ge, H.L.; Fan, W.Y.; Xu, X.J.; Fan, W.L.; Shi, Y.J. Satellite-based carbon stock estimation for bamboo forest with a non-linear partial least square regression technique. Int. J. Remote Sens. 2012, 33, 1917–1933. [Google Scholar] [CrossRef]
  34. Mao, F.; Du, H.; Zhou, G.; Li, X.; Xu, X.; Li, P.; Sun, S. Coupled LAI assimilation and BEPS model for analyzing the spatiotemporal pattern and heterogeneity of carbon fluxes of the bamboo forest in Zhejiang Province, China. Agric. For. Meteorol. 2017, 242, 96–108. [Google Scholar] [CrossRef]
  35. Soil Survey Staff of United States Department of Agriculture (USDA). Soil Taxonomy: A Basic System of Soil Classification for Making and Interpreting Soil Survey; Agriculture Handbook 1999, (No. 436.); Soil Survey Staff of United States Department of Agriculture (USDA): Washington, DC, USA, 1999.
  36. Department of Forestry of Zhejiang Province. Announcement of Value of Forest Resources and Ecological Functions of Zhejiang Province in 2014; Department of Forestry of Zhejiang Province: Zhejiang, China, 2015.
  37. State Forestry Administration of China. Main Technical Regulations for Continuous Inventory of National Forest Resources; Department of Forestry Resources Management of the State Forestry Administration of China: Beijing, China, 2003; pp. 36–44.
  38. Yen, T.M. Comparing aboveground structure and aboveground carbon storage of an age series of Moso bamboo forests subjected to different management strategies. J. For. Res. 2014, 20, 1–8. [Google Scholar] [CrossRef]
  39. Liu, E.B.; Shi, Y.J.; Li, Y.F.; Zhou, G.M. Carbon sequestration potential of Moso bamboo forest in Zhejiang province based on the non-spatial structure. Sci. Silv. Sin. 2012, 48, 9–14. [Google Scholar]
  40. R Core Team. R: A Language and Environment for Statistical Computing. R Foundation for Statistical Computing. Vienna, Austria, 2015. Available online: http://www.Rproject.org (accessed on 21 May 2017).
  41. Qiu, F.G. The on-year and off-year of Phyllostachys pubescens forests and their control. J. Bamboo Res. 1984, 3, 62–69. [Google Scholar]
  42. Wang, K.; Bao, Q. Phytohormone content and distribution in Phyllostachys pubescens in shooting period. J. Bamboo Res. 1989, 8, 35–46. (In Chinese) [Google Scholar]
  43. Li, R.; Zhong, Z.; Werger, M.J.A. The relationship between the clonal growth and the density of adult shoots with different leaf age in Phyllostachys pubescens mazel. Acta Phytoecol. Sin. 1997, 21, 545–550. (In Chinese) [Google Scholar]
  44. Wu, L.; Xiao, J. Study on dynamic characteristics of eudogenous phytohormone in on-and-off year bamboo (Phyllostachys heterocycles var. pubescens) grove. J. Bamboo Res. 1998, 17, 24–30. (In Chinese) [Google Scholar]
  45. Wu, J.; Zhou, G.; Xu, Q.; Yang, F. Spatial distribution of nutrition element and its relationship with soil nutrients in different years of Phyllostachys pubescens. Sci. Silv. Sin. 2005, 41, 171–174. (In Chinese) [Google Scholar]
  46. Zhou, G.M.; Wu, J.S.; Jiang, P.K. Effects of different management models on carbon storage in Phyllostachys pubescens forests. J. Beijing For. Univ. 2006, 28, 51–55. (In Chinese) [Google Scholar]
  47. Wen, G.S.; Zhang, L.Y.; Zhang, R.M.; Cao, Z.H.; Zhou, G.M.; Huang, H. Temporal and spatial dynamics of carbon fixation by Moso bamboo (Phyllostachys pubescens) in subtropical China. Bot. Rev. 2011, 77, 271–277. [Google Scholar] [CrossRef] [PubMed]
  48. Ji, B.Y.; Tao, J.X.; Zhang, G.J.; Du, Q.; Yao, H.W.; Xu, J. Zhejiang Province’s forest vegetation biomass assessment for guaranteed accuracy. J. Zhejiang Agric. For. Univ. 2012, 29, 328–334. [Google Scholar]
  49. Yen, T.M.; Wang, C.T. Assessing carbon storage and carbon sequestration for natural forests, man-made forests, and bamboo forests in Taiwan. Int. J. Sustain. Dev. World Ecol. 2013, 20, 455–460. [Google Scholar] [CrossRef]
  50. Jiang, P.K.; Meng, C.F.; Zhou, G.M.; Xu, Q.F. Comparative study of carbon storage in different forest stands in subtropical china. Bot. Rev. 2011, 77, 242–251. [Google Scholar] [CrossRef]
  51. Zheng, H.; Ouyang, Z.Y.; Xu, W.H.; Wang, X.K.; Miao, H.; Li, X.Q.; Tian, Y.X. Variation of carbon storage by different reforestation types in the hilly red soil region of southern china. For. Ecol. Manag. 2008, 255, 1113–1121. [Google Scholar] [CrossRef]
  52. Lou, Y.P.; Wu, L.R.; Shao, D.F.; Yan, Z.W. Effect of long term management of pure Phyllostachys pubescens stands on soil fertility. For. Res. 1997, 10, 125–129. (In Chinese) [Google Scholar]
  53. Zhang, C.X.; Ding, X.C. Studies on yield of Phyllost Achys heterocycla var. Pubescens stands. J. Bamboo Res. 1997, 16, 31–36. (In Chinese) [Google Scholar]
  54. Zheng, Y.S.; Hong, W. A study on age structure model of bamboo stand and its application. Sci. Silv. Sin. 1998, 34, 32–39. (In Chinese) [Google Scholar]
  55. Zheng, Y.S.; Hong, W.; Chen, L.G. Study on the density structure for bamboo forest management. Sci. Silv. Sin. 1998, 34, 5–10. (In Chinese) [Google Scholar]
  56. Wu, B.S. A preliminary analysis of the relationship between the underground structure of a Phyllostachys pubescens forest and its yield. J. Bamboo Res. 1984, 3, 49–58. (In Chinese) [Google Scholar]
  57. He, L.; He, X.Y. Rational age structure and growth regularity during shooting period of Phyllostachys pubescens forest for shoot. J. Bamboo Res. 1993, 12, 52–56. (In Chinese) [Google Scholar]
  58. Zhou, G.M.; Jiang, P.K.; Mo, L.F. Bamboo: A possible approach to the control of global warming. Int. J. Nonlinear Sci. Numer. Simul. 2009, 10, 547–550. [Google Scholar]
Figure 1. Study area in Zhejiang Province and Moso bamboo forest sample plot locations.
Forests 08 00371 g001
Figure 2. Distribution of Moso bamboo forest culms. (a) represents the distribution in different diameter class; (b) represents the distribution in different age class; (c) represents the distribution in different altitude; (d) represents the distribution in different soil thickness.
Forests 08 00371 g002
Figure 3. Aboveground culms carbon stocks (a) and change in carbon stocks (b) in all sample plots. Red color represents the carbon stocks in 2009, and black color represents the carbon stocks in 2014 in (a). The symbols ** and *** denote significant differences between carbon stocks in 2009 and 2014 at p < 0.01 and p < 0.001, respectively.
Forests 08 00371 g003
Figure 4. Relationship between culms carbon stocks and average DBH changes (a), culms number changes (b), soil thickness (c), and altitude (d) among sample plots.
Forests 08 00371 g004
Table 1. Type II (major axis) correlations between carbon stocks change and biotic or abiotic factors. (** represents statistical significance at p < 0.01). DBH, diameter at breast height.
VariableSlopeInterceptR2p
change in culms density6.3420.470.864<0.01 **
DBH change1757.15−33.890.203<0.01 **
geomorphology−8747.8537,206.470.0080.26
altitude15.79−6318.050.0080.24
aspect−3197.5314,415.890.0040.4
slope−12,567359,0060.0000.95
slope position8650.8−26,3850.0050.35
canopy density−40,59030,3020.0080.25
soil thickness464.7−21,9630.010.20
Table 2. A comparison of aboveground carbon stocks, mean aboveground carbon sequestration, and aboveground carbon sequestration between this study and other studies.
Study AreaYearAboveground Carbon Stocks (Mg C ha−1)Total Aboveground Culms Carbon Stocks (Tg C)Mean Aboveground Carbon Sequestration (Mg C ha−1 Year−1)Aboveground Carbon Sequestration (Tg C Year−1)Forest Type
Zhejiang Province200413.00 [39]///Moso bamboo forest
Zhejiang Province200915.01 (this study)10.37 [48] 10.75 (this study)//Moso bamboo forest
Zhejiang Province201417.96 (this study)14.11 (this study)//Moso bamboo forest
Zhejiang Province2009–2014//0.59 (this study)0.42 (this study)Moso bamboo forest
Zhejiang Province2011–2014///1.74 [34]Bamboo forest
Central Taiwan2004–200740.6 [11]/8.13 [11]/Moso bamboo plantation

