Article

Assessing Forest Cover Dynamics and Forest Perception in the Atlantic Forest of Paraguay, Combining Remote Sensing and Household Level Data

1
Remote Sensing & Environmental Modelling, Department for Geography, Kiel University, 24098 Kiel, Germany
2
German Remote Sensing Data Center (DFD) of the German Aerospace Center (DLR), Oberpfaffenhofen, 82234 Wessling, Germany
3
World Wide Fund for Nature (WWF) Paraguay, Asuncion 1001-1925, Paraguay
4
World Wide Fund for Nature (WWF) Germany, Reinhardtstraße 18, Berlin 10117, Germany
*
Author to whom correspondence should be addressed.
Forests 2017, 8(10), 389; https://doi.org/10.3390/f8100389
Submission received: 29 August 2017 / Revised: 5 October 2017 / Accepted: 7 October 2017 / Published: 11 October 2017

Abstract

:
The Upper Parana Atlantic Forest (BAAPA) in Paraguay is one of the most threatened tropical forests in the world. The rapid growth of deforestation has resulted in the loss of 91% of its original cover. Numerous efforts have been made to halt deforestation activities, however farmers’ perception towards the forest and its benefits has not been considered either in studies conducted so far or by policy makers. This research provides the first multi-temporal analysis of the dynamics of the forest within the BAAPA region on the one hand, and assesses the way farmers perceive the forest and how this influences forest conservation at the farm level on the other. Remote sensing data acquired from Landsat images from 1999 to 2016 were used to measure the extent of the forest cover and deforestation rates over 17 years. Farmers’ influence on the dynamics of the forest was evaluated by combining earth observation data and household survey results conducted in the BAAPA region in 2016. Outcomes obtained in this study demonstrate a total loss in forest cover of 7500 km2. Deforestation rates in protected areas were determined by management regimes. The combination of household level and remote sensing data demonstrated that forest dynamics at the farm level is influenced by farm type, the level of dependency/use of forest benefits and the level of education of forest owners. An understanding of the social value awarded to the forest is a relevant contribution towards preserving natural resources.

1. Introduction

Deforestation in the tropics today continues inexorably with severe implications for biodiversity conservation, climate regulation and ecosystem services such as carbon storage. The rapid expansion of the agricultural frontier, cattle ranching and illegal logging has converted the world’s last remnants of tropical forest into isolated patches endangering their continuity [1]. Between 1999 and 2005, 69 million ha of forest have been lost in Latin America accounting for almost 7% of the forest cover of the continent [2]. Despite the fact that its speed has declined in comparison to previous years [3], deforestation still remains a concern. The latest studies conducted on a global level identified Paraguay as one of the countries in Latin America with the highest deforestation rates [4,5]. The continuous anthropological pressure on natural resources has led to the loss of 90% of the forest cover in the eastern region of the country, where the Atlantic Forest is located [6]. The Atlantic Forest encompasses 15 ecoregions and a total area of 471,204 km2 [7]. The ecoregion is considered to be a biodiversity hotspot, due to the presence of numerous endemic species that are unique in the world [8,9,10,11]. Even though the portion of the Atlantic Forest (also known as the Upper Parana Forest (BAAPA)) within Paraguay only represents a small share of the complete geographic extension of the ecoregion, it has been recognized as a highly diverse ecosystem [12]. According to Huang et al. [13], the BAAPA forest cover decreased around 50% of its original cover between 1973 and 2000, in less than 30 years [1]. Latest studies [6,14] estimated that only 10% of its original cover remains. One of the major drivers of deforestation in the region is the expansion of mechanized agriculture and a lack of economic opportunities for forest owners [15,16]. Economic alternatives to service wood production (e.g., construction wood, fire woods and charcoal) are limited for the local population. As a result, it is tempting for small-scale farmers to lease their lands to large companies that produce exclusively monocultural crops such as soy beans and maize [17]. A common perception among farmers in the region is that one ha of soy crops simply holds a higher economic value than one ha of native forest. In addition, the low economic compensation that can be obtained for forest products cannot compete with the high levels of income generated by agricultural exports [18].
Over the past decades, several governmental institutions, e.g., Forest National Institute (INFONA) and international organizations (e.g., Food and Agriculture Organization of the United Nations (FAO), the World Wildlife Fund (WWF) and the United States Agency for International Development (USAID)), have used remote sensing data to assess deforestation in the BAAPA. Nevertheless, despite the existence of numerous deforestation reports, major parts of the spatial analysis are kept in clusters and some even considered sensitive information [19]. According to Da Ponte et al. [19], only few scientific studies have provided a systematic analysis of forest cover change in the BAAPA region [13,20,21]. These studies estimated the dynamics of the forest cover and forest structure by implementing solely bi-temporal analysis based on Landsat images spanning the years 1970 to 2001 and 2003 to 2013, respectively. Even though the discussed studies successfully identified deforestation processes and patterns with remote sensing techniques, no attempts were made to understand the underlying drivers of change or the effectiveness of conservation policies. No ground information that could capture local circumstances (e.g., uses of natural resources, farm types and cultural characteristics) between forest owners has been included in past analysis. For instance, recent studies conducted in the BAAPA [18,22] have demonstrated that farmers’ perceptions of the importance of the forest vary according to farm types. Farmers with less economic resources depend more heavily on the forest, whereas larger farmers consider the forest’s main value to be recreational/cultural. Hence, it is to be expected for small-scale farmers to present a higher percentage of farms exhibiting a decrease in their forest cover.
In order to address these shortcomings, in this study, a dense set of Landsat imagery is applied on the one hand to provide the first multi temporal analysis of forest cover change in the BAAPA region (to the knowledge of the authors) between the years 1999 and 2016. On the other, remote sensing and household level data are combined to understand how farmers’ perceptions of the forest affects conservation practices at the farm level. The goal of this study is to measure the influence of farmer’s educational background on the dynamics of the forest, how changes in deforestation frequency differ according to farm type (small, medium, and large), how farmers’ dependency on natural forest resources influences changes in the forest cover, and the impact farmers’ participation in conservation programs has on preservation. The outcomes obtained in this study provide useful information when contemplating the importance of social involvement in land-use planning.

2. Data and Methods

2.1. Study Area

This study was conducted in the Upper Parana Atlantic Forest of Paraguay (BAAPA), located in the eastern region of the country. The ecoregion comprises portions of ten departments, resulting in a total area of 86,000 km2 (see Figure 1) [23]. Almost 50% (over 3 million inhabitants) of the country’s population is located within the boundaries of the BAAPA [23]. The areas of highest population density in the ecoregion are located in the east (Ciudad del Este) and south (Encarnación), whereas in the north the population decreases [23]. The climate in the Atlantic Forest is characterized by frequent rainfalls that fluctuate between 1300 to 1800 mm per year. The temperature in the region varies greatly between seasons. During summer months (December–March), the temperature can increase up to 42 °C, while over winter (May–August), it can decrease down to 0 °C. Most of the diverse biological richness of the BAAPA is distributed in the ecoregions of the Montane Forest in the North (Amambay), the central forest in the south and the Upper Parana forest in the southeast [12]. Although forest cover represents a significant portion of the natural vegetation in the ecoregion, the severe pressure from anthropological activities has degraded the forest with only a few remaining fragmented patches [13,20].
Prior to 1940, the BAAPA forest covered over 55% of the eastern region of the country (accounting for almost 9,000,000 ha). Nevertheless, uninterrupted deforestation practices resulted in the loss of 90% of its original cover [6]. Currently, 90% of the country’s soy bean production on 3 million ha is located within the boundaries of the BAAPA region [24]. According to studies such as Huang et al. [13,20], causes of deforestation were related to the long-established perception of the forest as unproductive lands, the rapid expansion of the agricultural frontier and the unsustainable use of natural resources. By the year 2000, almost two-thirds of the Paraguayan Atlantic Forest was lost, with an annual average deforestation rate of 2000 km2. The government introduced reforestation programs in the late 1990s (incentives to forestation and reforestation law 536/96) to diminish the damage done in the BAAPA, yet unfortunately, these did not obtain remarkable results. The lack of clear regulations and financial support discouraged land owners from introducing further lands into the program [25]. By 2003 at the latest, Paraguay had become the country with the second highest deforestation rate in the world [3]. In response, the Paraguayan government approved in 2004 the “Zero Deforestation Law (2524/04)” for a period of two years, which prohibited the conversion of any parts of the Atlantic forest in eastern Paraguay [14,16]. According to reports from the World Wildlife Fund [3], deforestation rates decreased drastically as a result, slowing by over 90% from 2002 (110,000 ha of forest loss per year) to 2009 (8000 ha of forest loss per year).

2.2. Landsat Image Acquisition and Pre-Processing

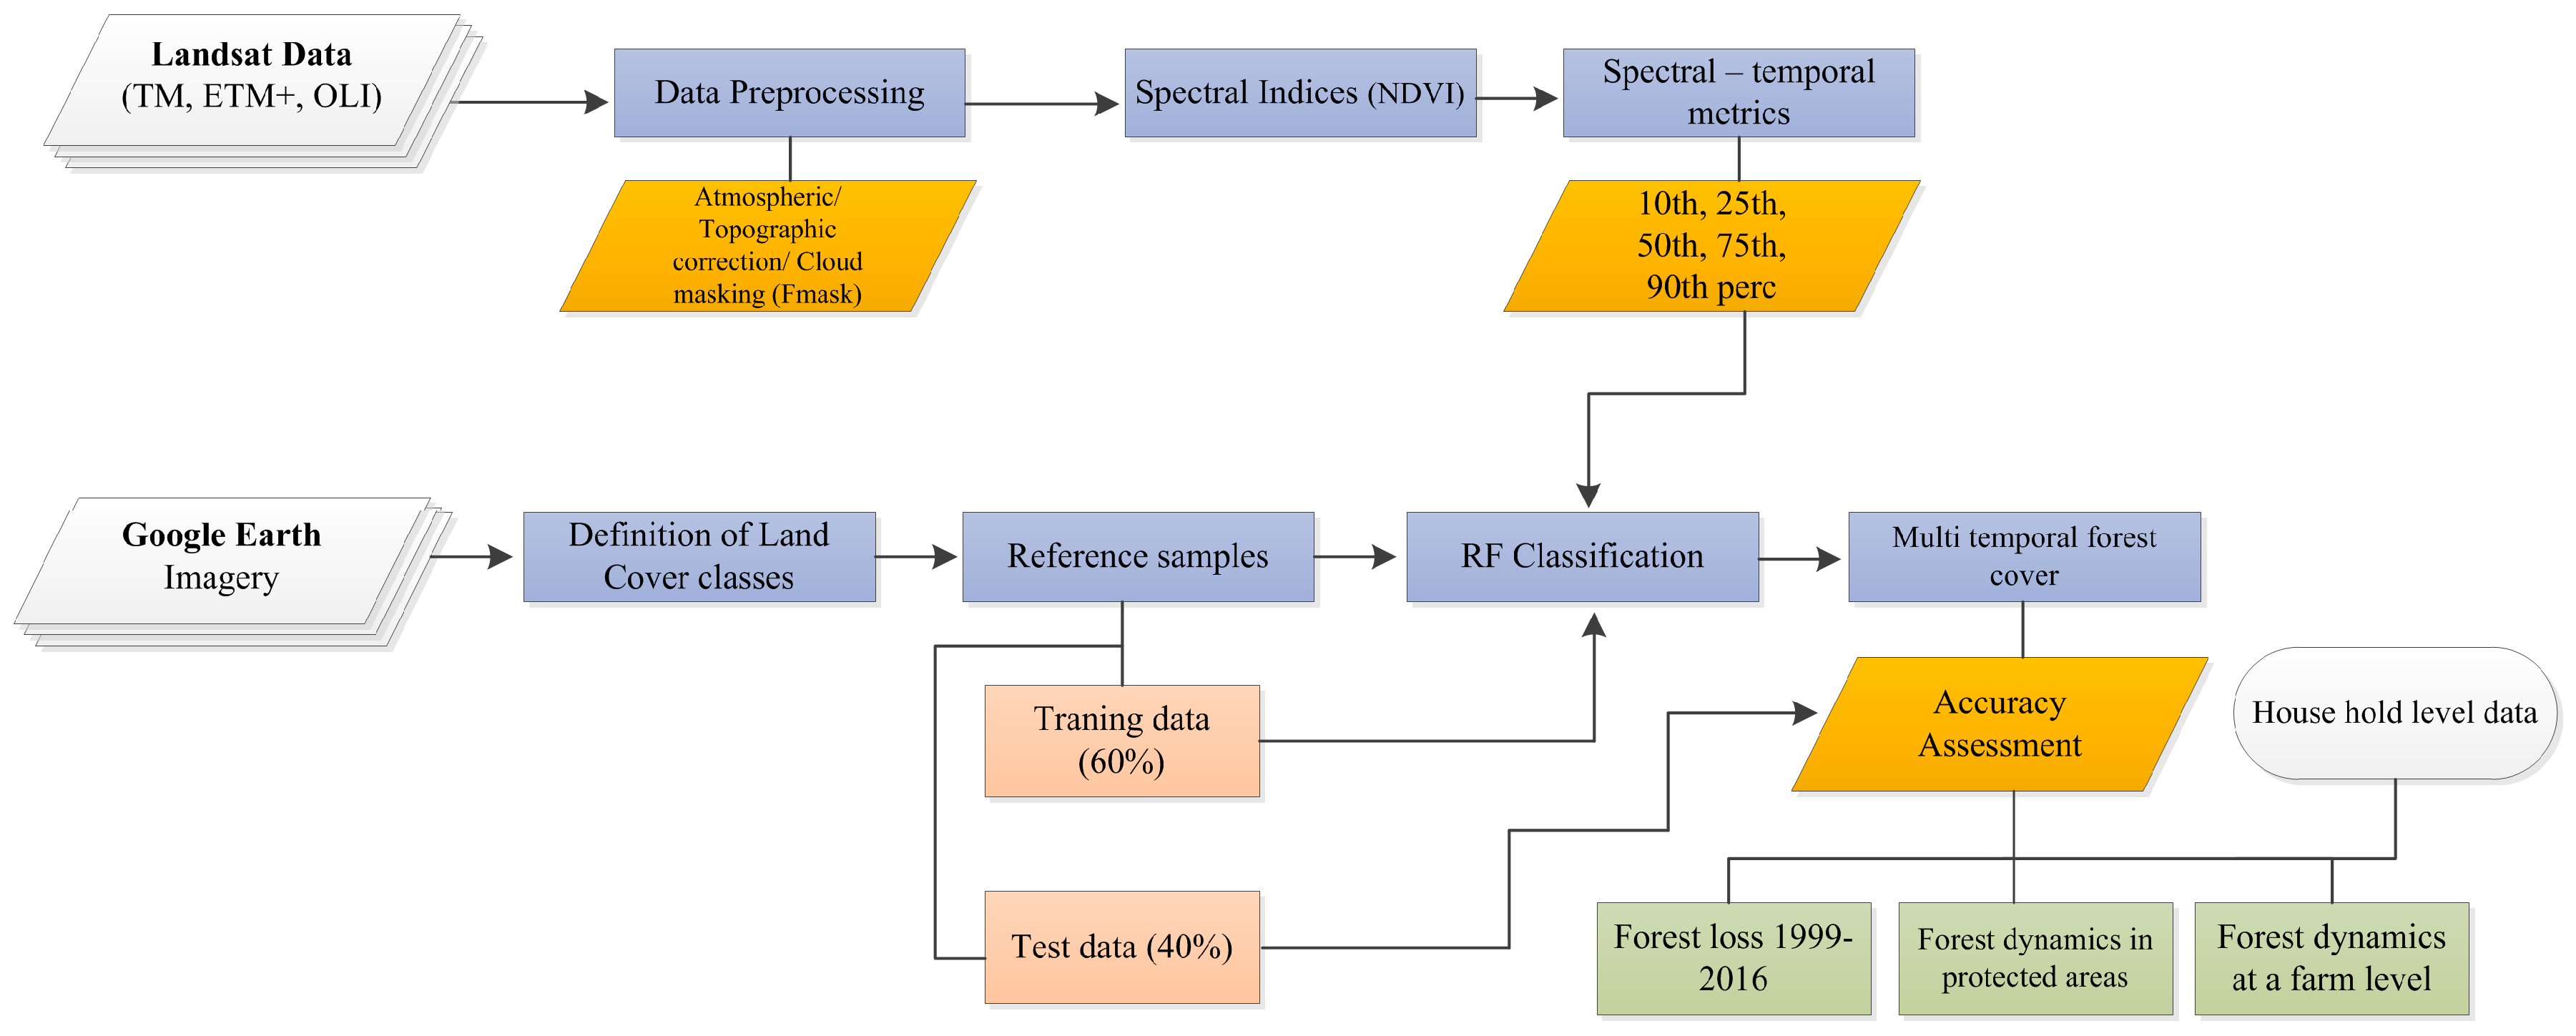
For this study, Landsat 5 Thematic Mapper (TM), Landsat 7 Enhanced Thematic Mapper Plus (ETM+) and Landsat 8 Operational Land Imager (OLI) data were acquired between the reference years of 1999 and 2016. Taking into consideration the high temporal and spatial resolution of the Landsat images, the sensor was considered the most suitable for this research. As presented in Table 1, a total of 2775 terrain corrected (L1T) images with less than 30% cloud cover were obtained from the United States Geological Survey (USGS) archives. In order to decrease any possible noise and data gaps resulting from clouds and further atmospheric distortions, the number of satellite images to be used per classification was increased by considering data of two years for each map. This permitted to obtain a denser temporal coverage from the study region. Similar to Wohlfart et al. [28], Knauer et al. [29] and Gebhardt et al. [30], the FMASK (Function of mask) algorithm was applied over the Landsat images to identify and mask pixels classified as clouds shadows or no data (see Figure 2). The FMASK algorithm was developed to automatically detect and mask clouds, cloud shadows and snow from Landsat images by taking the spectral and textural features into consideration based on probabilistic scores [31].
Atmospheric corrections were performed with ATCOR-3 [32] for each Landsat scene to obtain physically comparable surface reflectance information, while also integrating topographic corrections by incorporating slope and elevation information from the Shuttle Radar Topography Mission.

2.3. Spectral-Temporal Landsat Time-Series Metrics

The use of continuous spectral-temporal metrics not only has proven to solve problems related to data gaps (a consequence of clouds), but also has been applied extensively as a reliable approach for separating land cover/use classes [34,35,36,37]. A variety of different spectral-temporal metrics were estimated based on bi-annual Landsat stacks, characterizing different land cover classes for the most prominent phenological information. The procedure follows the approach as described in Mack et al. [33] and Wohlfart et al. [28]. The lack of temporal regularity of Landsat acquisitions constrains the direct quantification of phenological metrics. Therefore, several bi-annual spectral-temporal metrics were computed from the Landsat scenes in order to obtain proxies for seasonal information. For this study, several statistical image metrics were derived (percentiles of 10, 25, 50, 75, 90%) from Landsat (TM, ETM+, and OLI) observations based on the reflectances of the five bands (blue, green, red, near infrared and short-wave infrared). For each band and index, multi-year percentile differences (90% minus 10% and 75% minus 25%) were calculated. As described in Mack et al. [33] interannual minimum and maximum were neglected in order to decrease noise and further outliers. In addition, Normalized Vegetation Index (NDVI) percentiles were computed. Hence, a total of 35 multi-temporal spectral features were considered as input variables in the classifications.

2.4. Estimation of Forest Cover between Years 1999–2016

Forest/non-forest maps were produced for every year between 1999 and 2016, employing a random forest (RF) [38] classifier to generate inter-annual thematic change maps based on spectral-temporal metrics (see Figure 2). For each reference year, training samples were randomly collected over the BAAPA area, resulting in a set of at least 100 homogeneous training polygons (as suggested by Congalton and Green [39]) for each of the five land cover/use classes “forest, croplands, grasslands, urban areas, and water”. Training and validation samples were well distributed over the study area to obtain the most representative coverage of land cover/uses in the region. Following the procedures of Wohlfart et al. [40], visual interpretation of very-high-resolution images (acquired from the historical imagery function of Google Earth between 1999 and 2016 [41]) was performed to define the classes of the training and validation samples. The interpretation was based not only on the image interpretation but also on local expert knowledge of the area.
The RF algorithm has been increasingly applied to conduct land cover mapping due to its performance, user friendliness and computer proficiency [42,43,44]. RF is a decision tree algorithm which selects random subsets of learning samples and of variables to build multiple (default value of 500) independent decision trees. Models were built and adjusted using the software R (version 3.3.1, R Foundation for Statistical Computing, Vienna, Austria) using its random forest package [45,46]. The pixel-wise classification applies the majority vote rule from aggregated decision trees to determine the final category. In this study, RF models with 500 independent trees were built for each two-year composite, resulting in a total of eight individual models. Default values for the mrty parameters were used, which traditionally is p , where the number of predictors in the dataset is represented by p. In order to train the RF classifier, 60% of the reference dataset served as the training input, and the remaining 40% of the samples as the verification set. The quality of each classified image was described through overall accuracies, producers’ and users’ accuracies, and Kappa coefficients derived from the error matrix [47]. Finally, a non-forest mask was generated by grouping all non-classes. Forest patches with an area smaller than 0.5 ha were excluded from the analysis, considering the forest definition established by FAO [48].
In order to analyze the long-term differences of forest dynamics between protected areas (of different ownership) and among farm types (small, medium and large) a long-term (bi-temporal) analysis of change was conducted by comparing forest classifications results for the reference years of 1999–2000 and 2015–2016.

2.5. Household Survey Data

For this study, a household socio-economic survey (277 households) was conducted in the BAAPA region (see Figure 1c) in January 2016 over a period of one month. Due to the large size of the BAAPA region, three sample areas were chosen to conduct the survey; the ITAIPU watershed dam (10,000 km2) located in the north, the Ñacunday watershed (2500 km2), and the Tavapy district (436 km2) situated in the South (see Figure 2c).
Respondents were stratified according to the size of their farm, following the categorization applied by the Ministry of Agricultural of Paraguay in its rural censuses [49]. Farmers with land size <20 ha represent the small-scale farmers group; farmers with land size of 20–50 ha represent the medium-scale farmers group; and farmers with land size >50 ha represent large-scale farmers. In general, the survey focuses more on aspects of the rural population (e.g., job, income, education level and land size) and their relationship with the forest (e.g., how they define “a forest” their knowledge of its functions, and its importance for their livelihood), their use of forest resources and services (e.g., firewood, construction and forest farming) and conservation programs (e.g., understanding and participation in such programs). For further detailed information on the household surveys methods and results, the interested reader is referred to Da Ponte et al. [18].

2.6. Combining Household and Remote Sensing Data

Using cadastral information, long-term forest cover change results for the reference years 1999–2000 and 2015–2016 were correlated to responses acquired from the field survey. For 106 of the interviewed farmers, cadastral data was obtained from the Paraguayan National Cadastral Service (SNC). Further, information was acquired on site during the field campaigns by measuring the limits of 39 farms while it was feasible to do so; for small-scale farms in particular, the topographic and weather conditions needed to be appropriate for doing so. This resulted in a number of 145 farms where both household survey and cadastral information was available for our comparative study. This sample size can be considered representative of the study region, since according to Yamane´s equation [50], 100 samples are required to achieve a sampling accuracy of approximately 90%. See Equation (1):
n = N 1 + N ( e ) 2
where n represents the samples needed; N refers to the sample population; and e the sampling error (0.10).
Changes in forest cover at the farm level were assessed by applying bi-temporal change detection analysis stratifying the changes into three categories: “forest loss”, “forest gain” and “no significant changes”. A farm was considered to fall into the category “no significant changes” if variations in forest cover occurred between 1 and 4 pixels (0–36 ha).

3. Results

3.1. Forest Classification Accuracy

In general, classification accuracies obtained from Landsat images between the years 1999 and 2016 fluctuated from 85% to 93%, with Kappa coefficients ranging from 0.82 to 0.91 (see Table 2). The Landsat data set from 2001–2002 exhibited the highest accuracy, of which 94% of the pixels were classified correctly as forest. On the other hand, the lowest accuracy values were seen in the 2015–2016 Landsat data sets, obtaining 88% and 87%, respectively. The lower classification values could be attributed to high spectral similarities between forest areas and dense crop fields (e.g., soybean and maize plantations).

3.2 Forest Loss Rates

In 1999/2000, over 31% (27,000 km2) of the BAAPA area was covered by forest. As presented in Table 3 and Figure 3, the largest forest areas in the region were located in the departments of Canindeyú and San Pedro, accounting for more than 48% (over 10,000 km2) of the total forest area in the BAAPA. The lowest levels of forest coverage were found in the departments of Paraguarí, Guairá and Concepción, together accounting for only 9% of the forest cover (around 2500 km2). In the years 2001/2002, the forest cover in the BAAPA decreased to 29%, equivalent to 630 km2. The departments of Canindeyú, San Pedro and Alto Parana exhibited the highest relative forest loss of 79%, with more than 500 km2. In 2003/2004, deforestation rates increased drastically. Almost 9% (2300 km2) of the forest was being depleted, nearly four times as much as in previous years. Similar to the trends above, the highest rates of deforestation were concentrated in the departments of Canindeyú, San Pedro, and Alto Parana, together totaling over 56% (around 1300 km2) of the area loss.
Following the year 2004, rates of deforestation gradually decreased from 4.9% (1200 km2) from 2005/2006 down to 2.5% (549 km2) between 2011 and 2012, before increasing again slightly in 2015/2016 (2.9%). Overall, by the year 2016, more than 27% (7500 km2) of forest cover was lost since 1999, at an annual deforestation rate of 1.5% (442 km2) over the entire BAAPA area. The lowest deforestation rates were shown in the departments of Guairá (12.1%) and Paraguarí (2.4%) accounting for 1.5% (120 km2) of the total area deforested. In contrast, the departments of San Pedro and Canindeyú consistently evidenced the highest losses, with a total forest cover loss of 41% and 33%, respectively.
Figure 4 reveals a clear pattern concerning the effectiveness of the protecting reserves based on their style of governance (ownership). For instance, each protected area owned by a governmental entity (Gov) showed a decrease in total forest cover. The highest deforestation rates were found in the National Parks of Cerro Corá (4.5%), Ybytyryzú (3%) and San Rafael (2.9%), totaling almost 30 km2. In contrast, each natural reserve under ITAIPU-IT (binational hydroelectric dam (partially owned by the government)) management exhibited increments on their forest cover, with natural restoration rates (natural reforestation) varying between 1% (in the Yvytyrokai) and 69% (Biological Reserve Mbaracayú). As for protected areas privately owned (Prv) (e.g., Mbaracayú and Morombí), no clear trend was found. While the Mbaracayú reserve exhibited a small increase in forest cover, (0.8%), the Morombí reserve, by contrast, presented the highest deforestation rates (4.7%) among all the protected areas in the BAAPA region.

3.3. Forest Cover Change and Household Survey

3.3.1. Demography and Influence on Forest Dynamics

All interviews were conducted with the designated head (by the families) of each household. The vast majority of respondents were males (around 85%) with an age between 30 and 62 years. Ownership was mixed between Paraguayans and Colons (Brazilians), with the Paraguayans tending to own the smaller farms (82% Paraguayans), and Colons larger ones (83% Colons). The principal occupation of 91% interviewees was farmer, while a small share (9%) occupied positions in governmental institutions in addition to farming activities. Respondents’ main agricultural activities were soy bean production (mainly large-scale farmers), cattle ranching (mostly medium-scale and small-scale farmers) and subsistence agriculture (small-scale farmers in particular). When analyzing the dynamics of the forest at the farm level, Figure 5 shows that forest loss/gain are closely related to farm size. For instance, the majority of forest loss (62%) occurred on small-scale farmers’ properties. The percentage of farmers experiencing deforestation gradually decreases with an increased farm size, declining from 50% for medium-scale to 38% for large-scale farmers groups. Forest gain, on the other hand, is more common among large-scale farmers, accounting for 48% of the interviewees. On the contrary, small scale farmers exhibited the lowest percentage (23%) of respondents with an increment in their forest cover. Hence, when farm sizes increase, the percentage of farms showing forest cover gain increases as well.
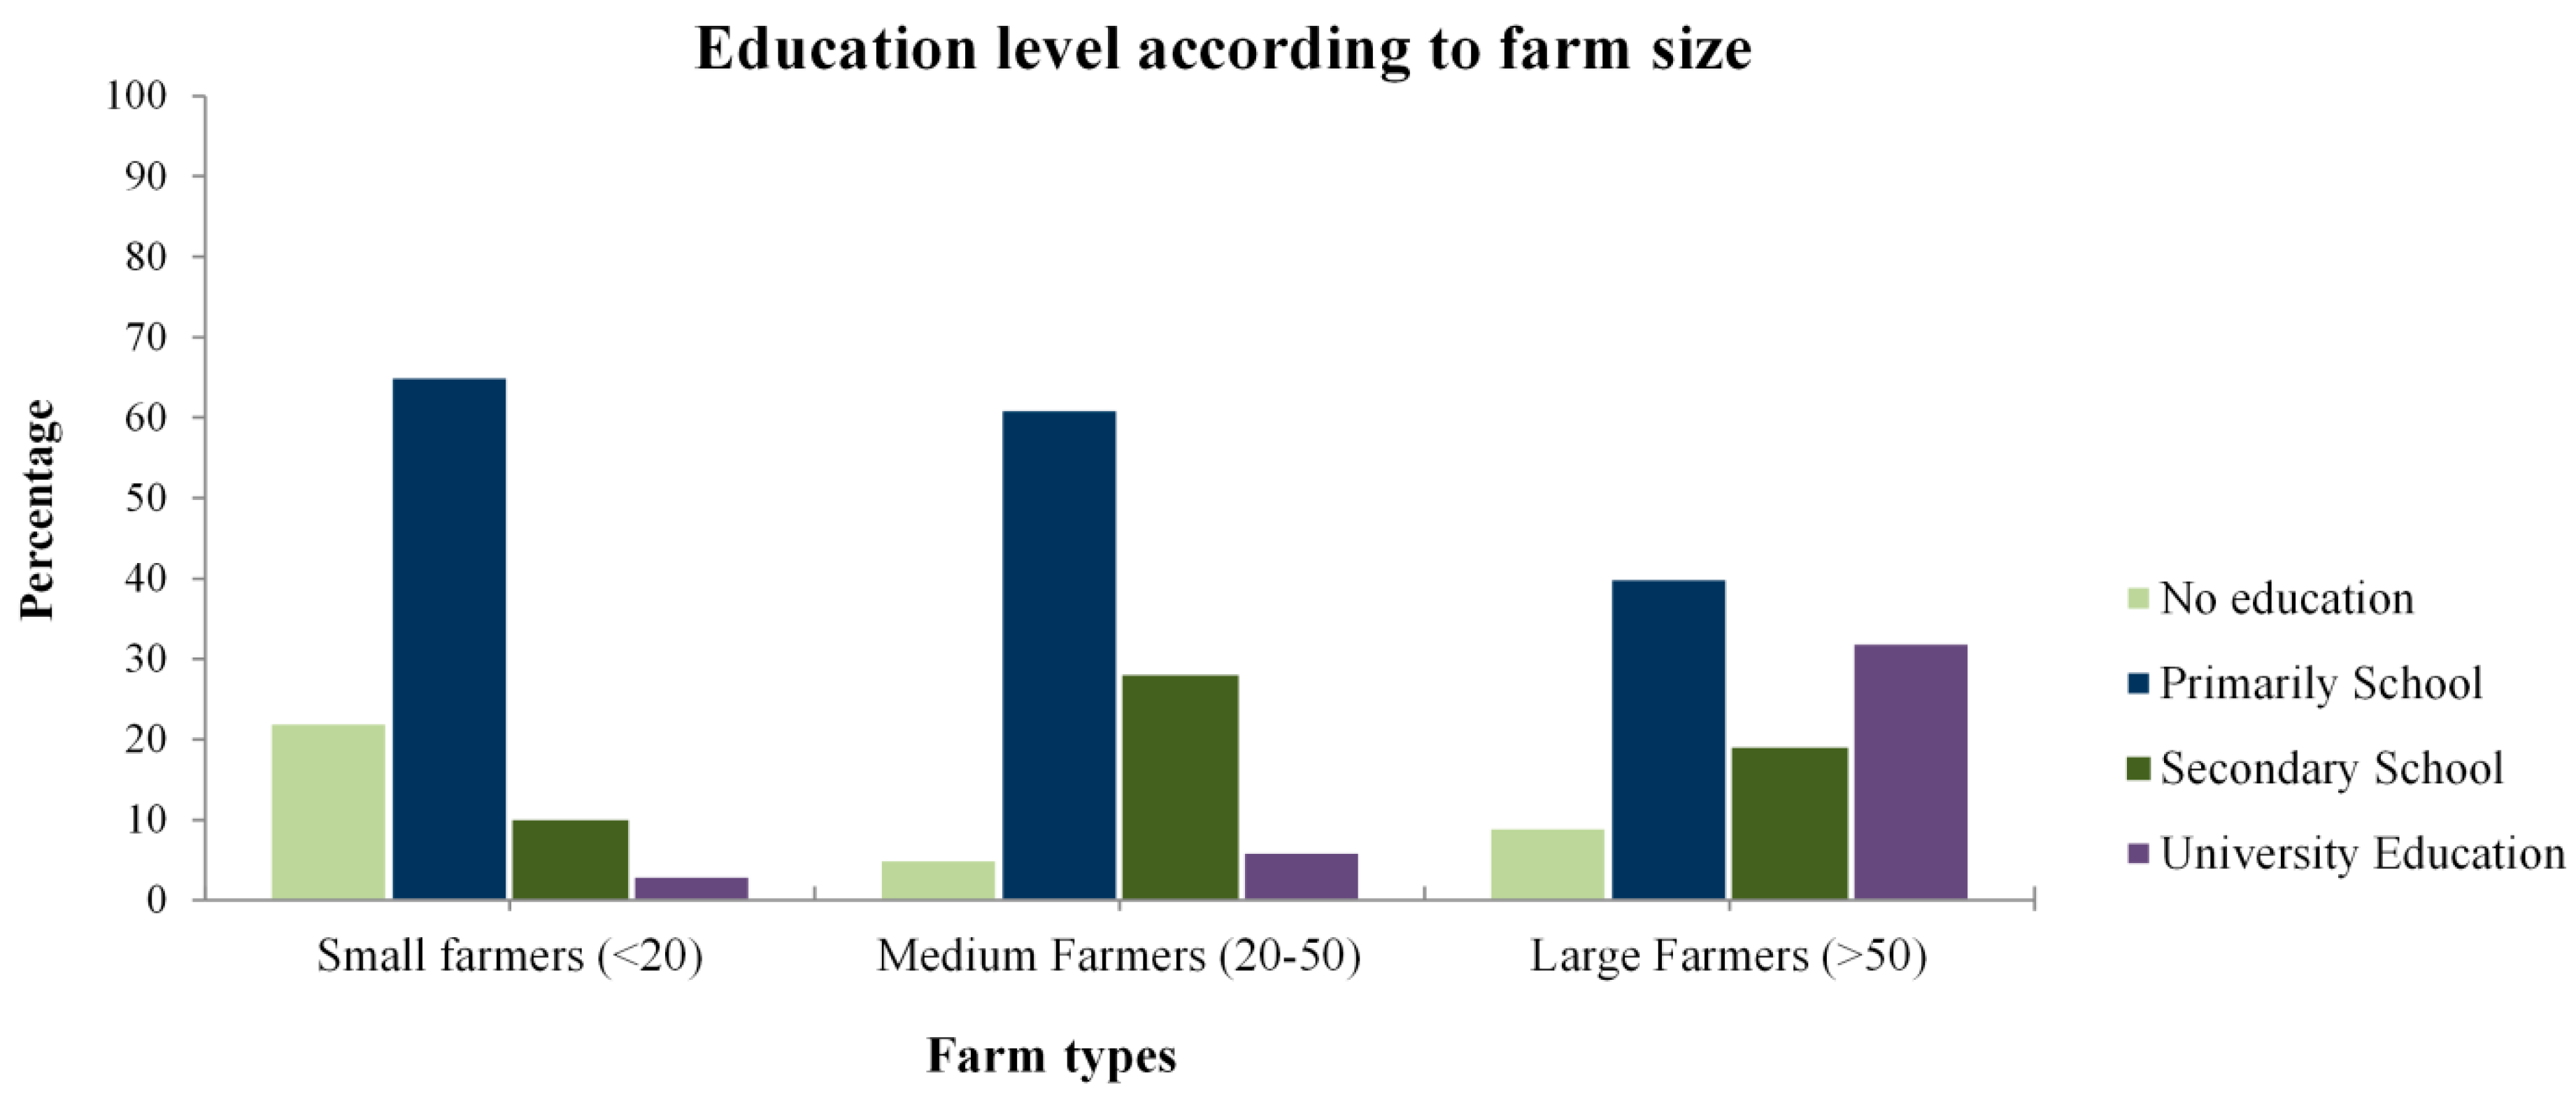
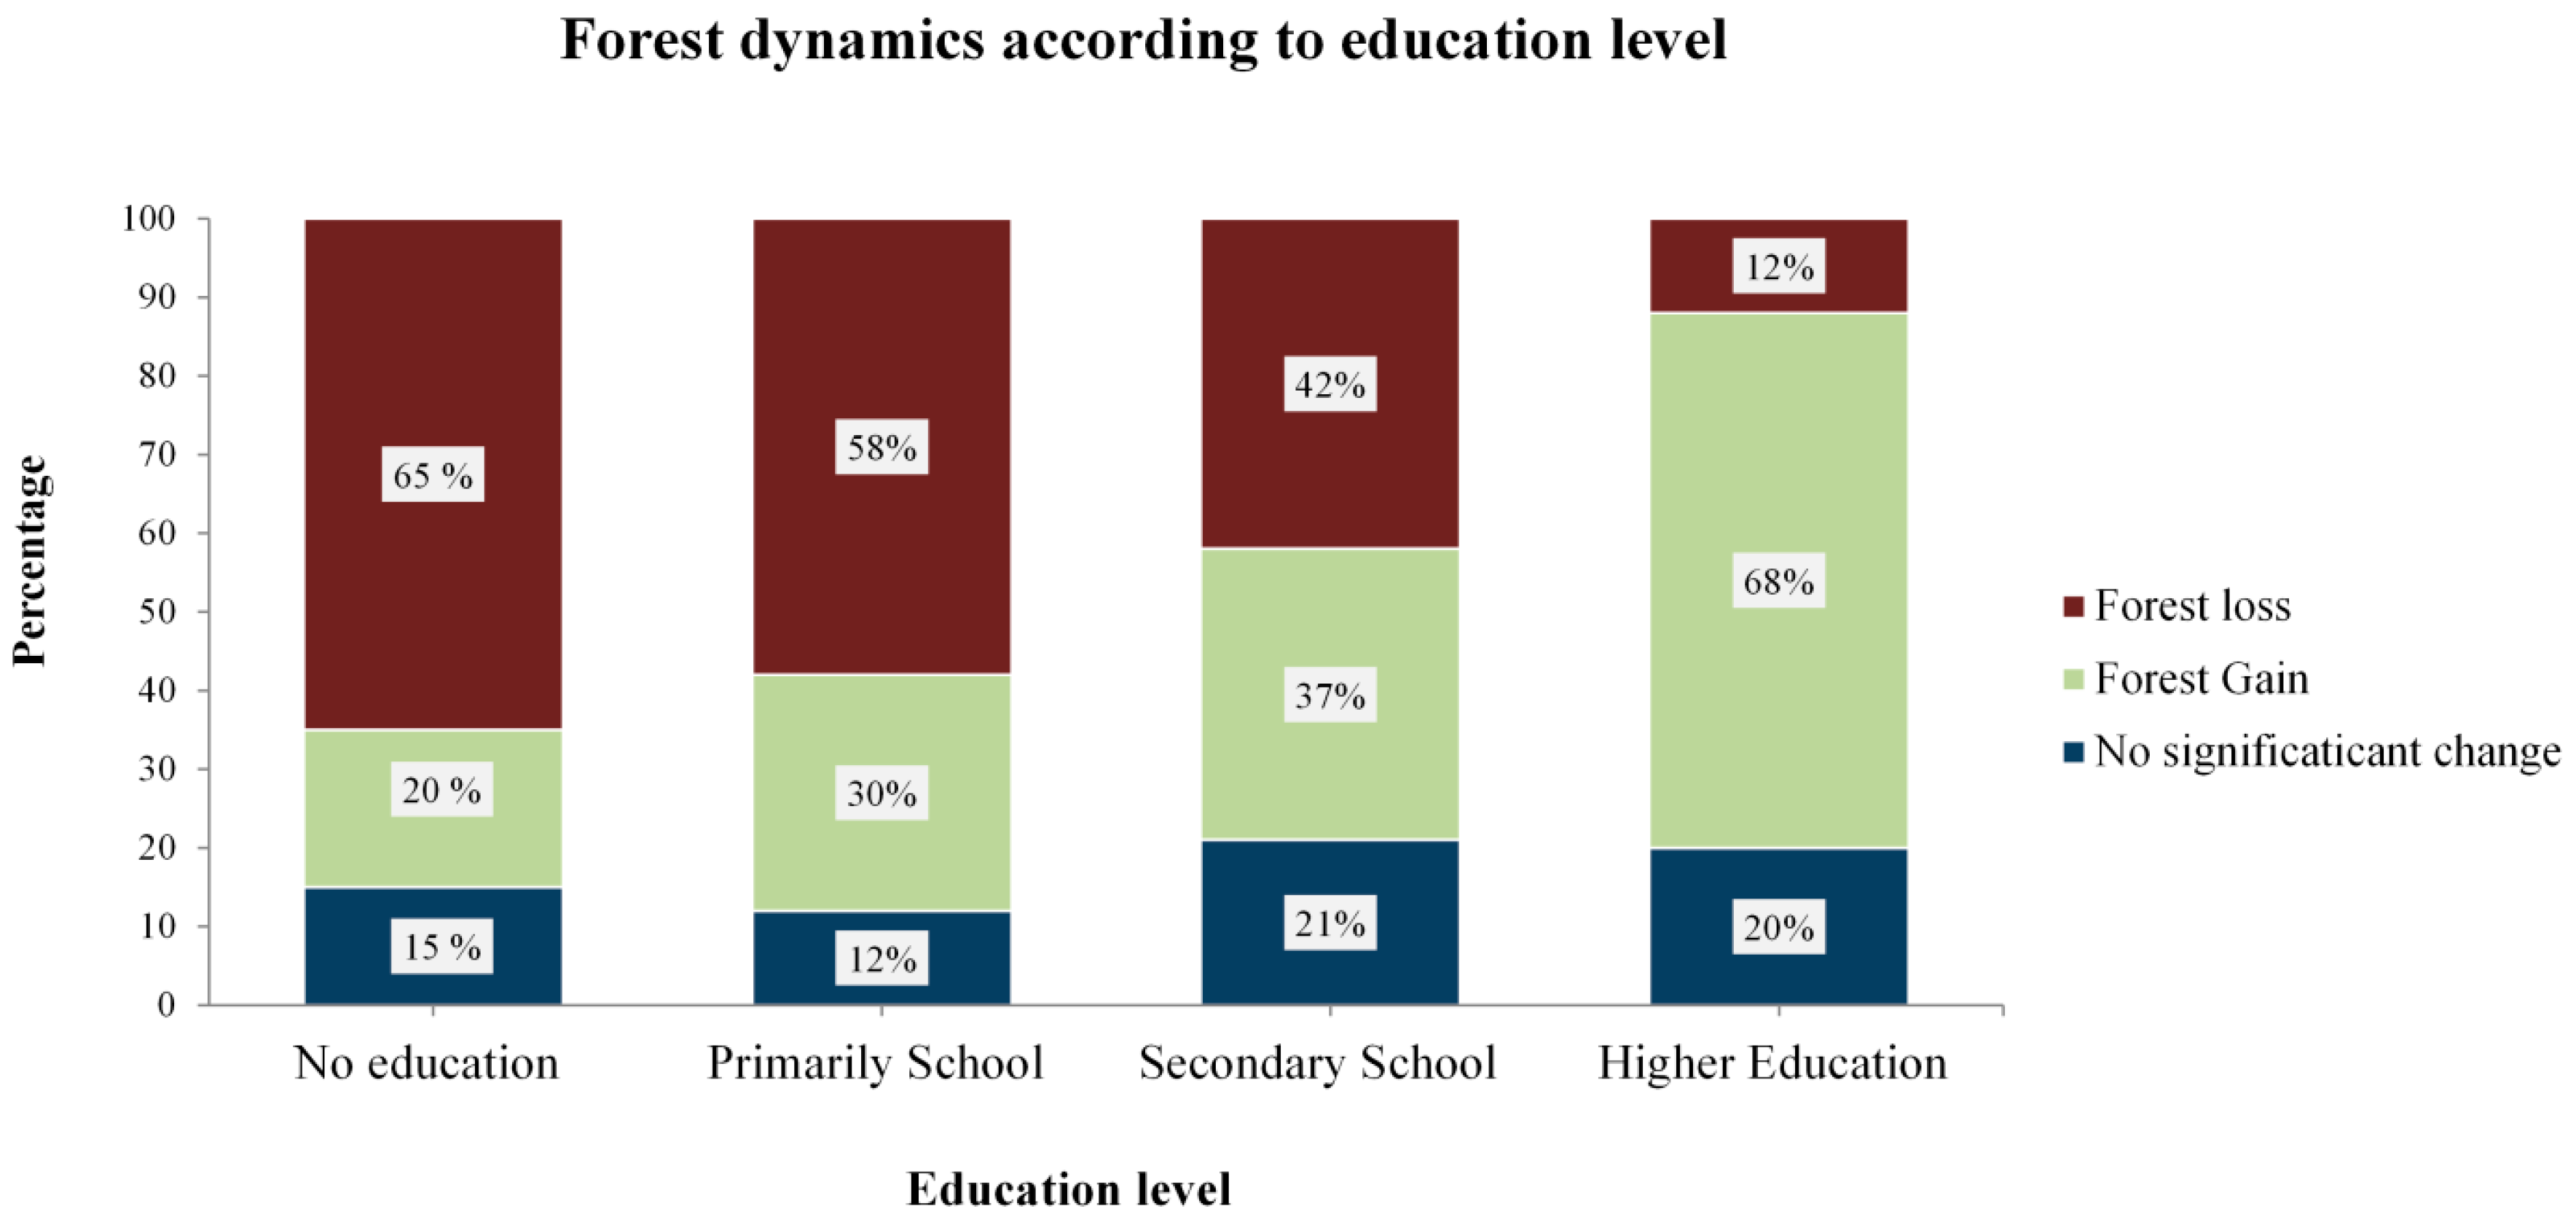
Figure 6 presents the distribution of the education level between farm types. Basically, education level increases slightly as farm sizes increases. The majority of farmers with higher education (a university degree) is found among the large-scale farmers group (32%). Small-scale farmers more frequently reveal lower levels of education, with 22% of the respondents having no school degree. Notwithstanding, a primary school education remains the most common level of education among all farm types with 65% (small-scale farmers), 61% (medium-scale farmers) and 40% (large-scale farmers) of respondents, respectively. Figure 7 presents strong tendency between a farmers’ education level and the dynamics of the forest on their parameters. The highest percentage of farmers exhibiting forest loss is found in the group with no school degree.
This tendency gradually decreases as education level increases, down from 65% in the group with no formal education to 12% in the group with a college education. Furthermore, farmers with higher education (University degree) most commonly saw gains of forest cover on their property. This tendency decreases with decreasing education level, dropping from 68% (higher education) to 20% (no education).

3.3.2. Uses of Forest Benefits and Influence on the Forest Cover

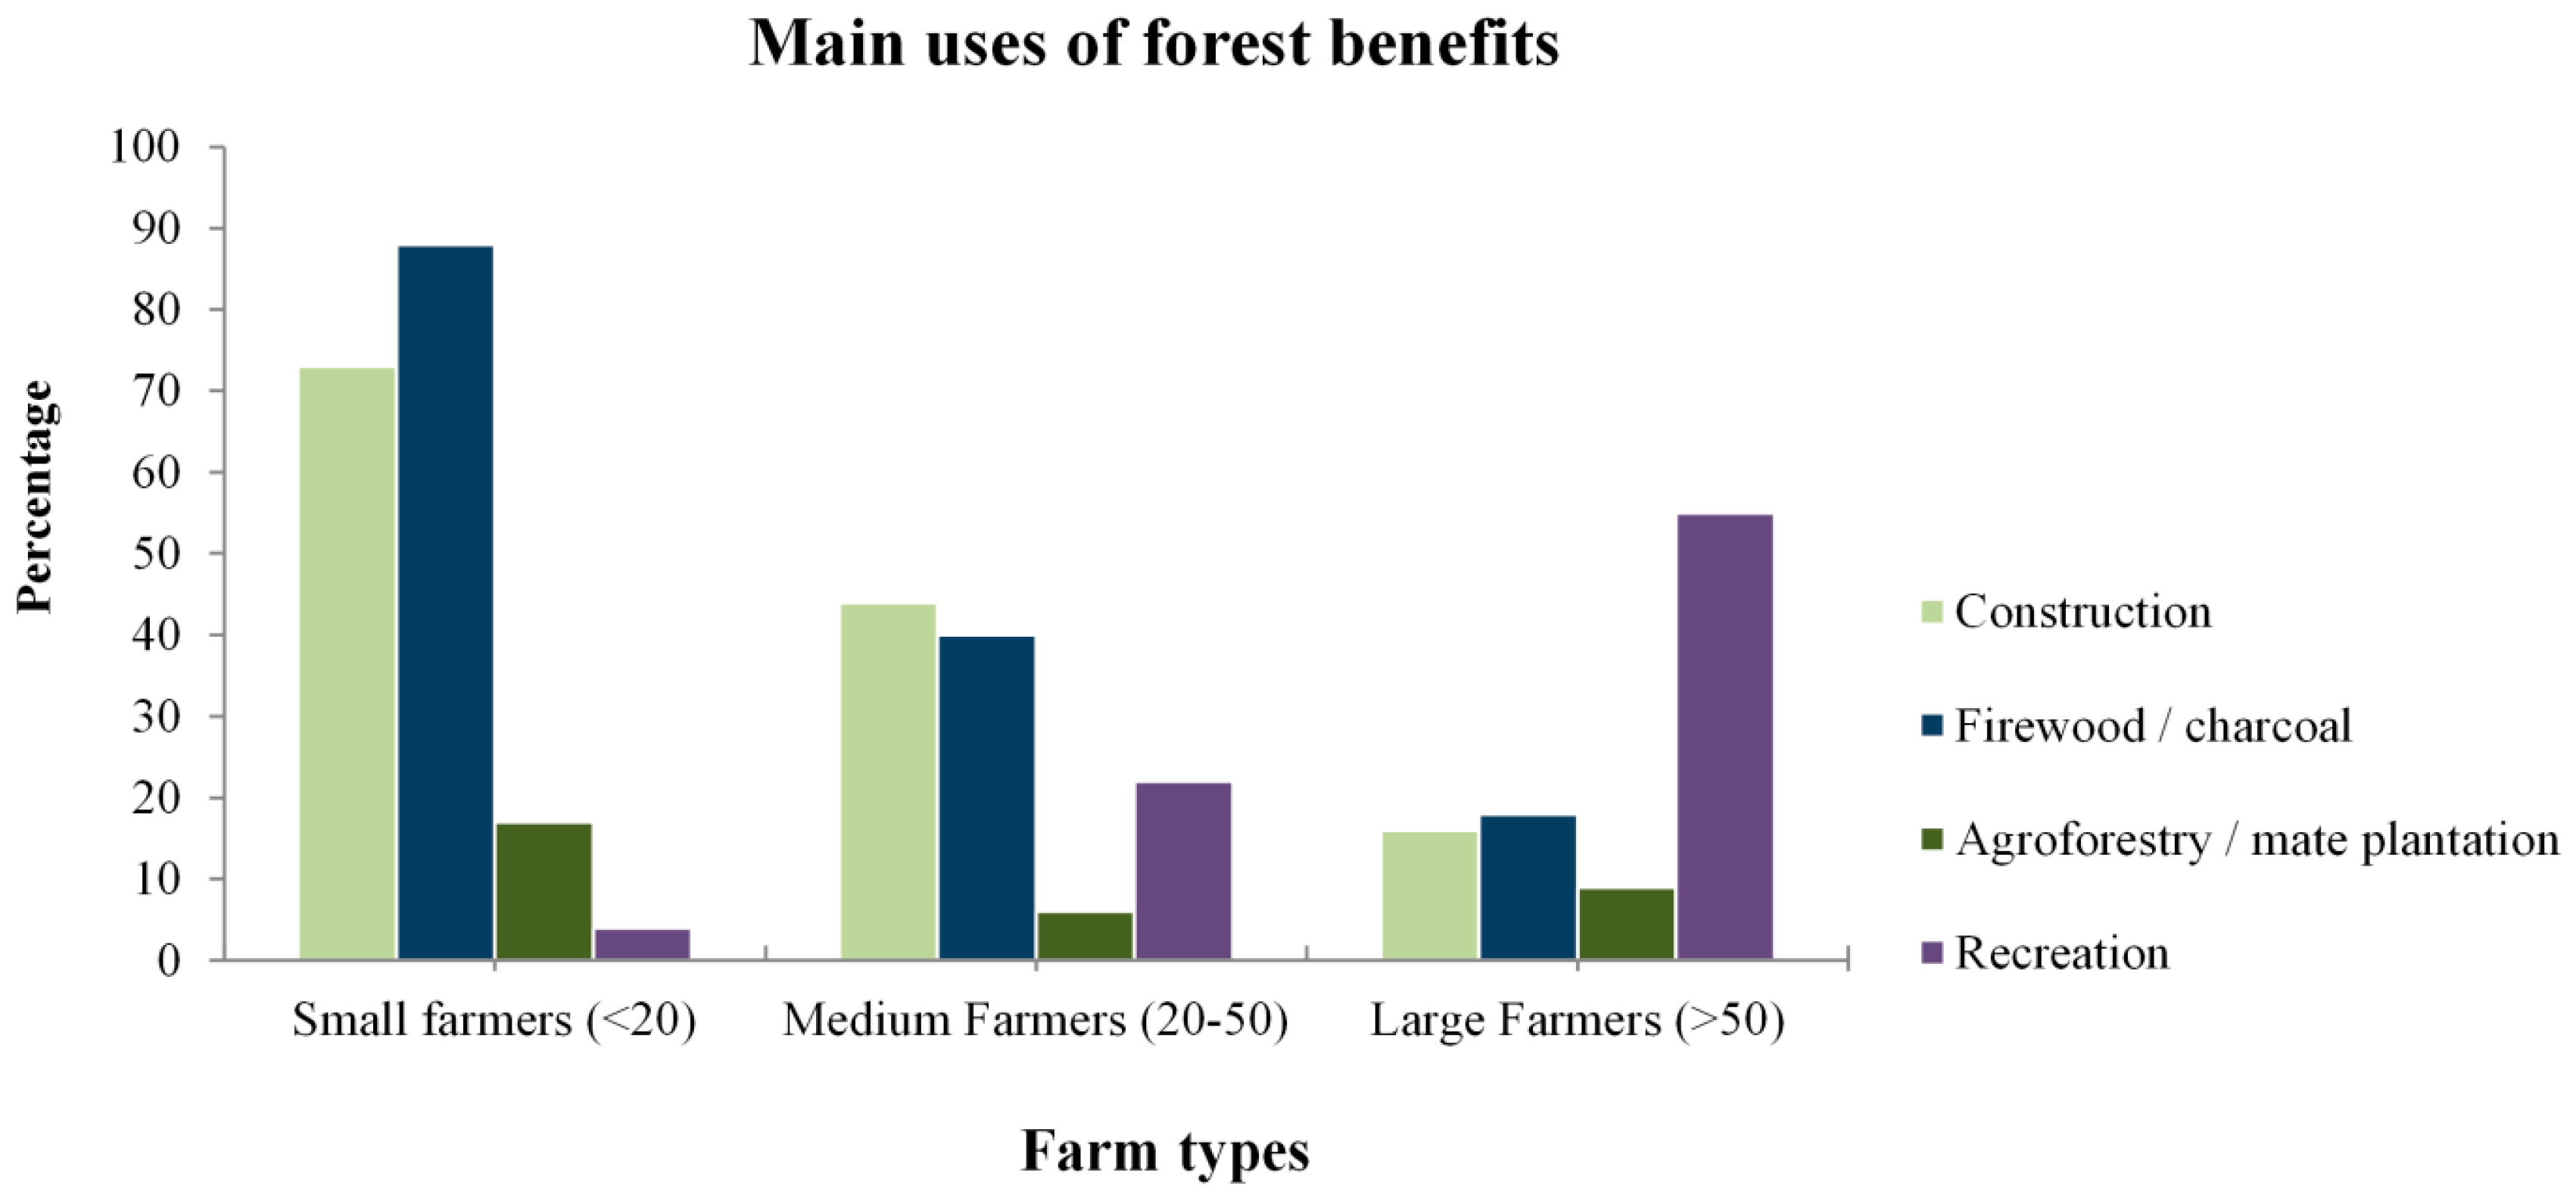
To capture the level of dependency on forest benefits by different farm types, interviewees were asked which products they obtained from the forest and how important they were to them. A total of 68% of the farmers remarked that they frequently benefited from the forest, and 92% stated that forests are very important for their livelihood. A deeper analysis of the results revealed a higher dependency of forest products among small (97%) and medium-scale (78%) farmers, whereas large-scale farmers (44%) stated that they made use of the forest but not as intensively. The high reliance on forest products and services, in particular among the small-scale farmers group, can be attributed to a lack of other sufficient financial resources. Figure 8 presents the different uses of the forest according to farm type. Over 88% of the small-scale farmers group admit to collecting firewood from the forest. A total of 94% of this group stated that their main use was for subsistence, in particular cooking. On the other hand, only 40% of medium and 18% large-scale farmers claimed a certain level of dependency, in clear contrast to the above. Small (73%) and medium-scale (44%) farmers were more reliant on forest wood for construction (e.g., households, barns and fences construction) than large-scale farmers (16%).
In rural areas, the vast majority of small households (in particular within the group of small-scale farmers) own houses that are built with wood from the forest, while medium- and large-scale farms often present permanent homes. When asked about the cultural value of the forest, around 55% of large-scale farmers considered the forest’s main value to be recreational. However, this inclination is less frequent among medium- and small-scale farmers, of which only 22% and 4%, respectively, held the same opinion.
Figure 9 presents how the forest cover of each farm group is affected by the use of forest benefits and products. For this analysis, we considered the percentage of farmers that acknowledged the use of the forest for any purpose (e.g., construction, firewood, agroforestry and recreation) and the spatial information from the forest cover of each farm. When analyzing the small-scale farmers group, 60% of the respondents presented forest loss, whereas only 26% and 14% showed forest gain or non-significant changes. Similar trends were observed among medium-scale farmers, among whom a high percentage of respondents (58%) presented a decrease in their forest cover, in comparison to the ones showing increments (35%) or no changes (7%). In contrast, a much higher proportion of the large-scale farmer’s group (53%) revealed forest gain. Overall trends disclose a correlation between the uses of forest by different farm groups and their influence on the forest cover. Whereas small- and medium-scale farms evidenced high rates of deforestation, large-scale farmers demonstrated more sustainable use of the natural resources. However, it is important to mention that main uses of forest benefits differed among farm groups, which could have an impact on the forest cover itself. As described previously, small- and medium-scale farmers exhibited a higher tendency to use the forest as a source of firewood and construction-wood, whereas large-scale farmers were more inclined to use the forest for recreational proposes.

3.3.3. Conservation Programs and Forest Cover Change

To comprehend landowner’s perception about the willingness to conserve forests, farmers were asked if natural areas should be protected. In general, positive responses were obtained, with 99% of farmers expressing their support for protecting forests. Additionally, 88% of the farmers remarked on the importance of the forest and the negative effects of a disappearing forest, in particular on the prevailing natural resources, flora and fauna and water reservoirs. Overall, the interviewed farmers exhibited high degrees of environmental awareness. Furthermore, 54% of respondents reported participating in environmental programs such as the Payment for Ecosystem Service (PES) program, reforestation programs and water courses protection programs. Particularly large-scale farmers (65%) participated in such programs followed by medium (47%) and small-scale (45%) farmers’ groups.
To understand the influence of conservation programs on forest dynamics, respondents’ participation in environmental programs/workshops was reflected by the variations of the forest cover in each farm. Overall, results also highlighted that sustainable use of the forest was related with program participation. Of the group that reported not participating in any environmental workshops or conservation programs, 73% evidenced forest loss and only 9% an increase in forest cover. On the contrary, the fraction of properties experiencing forest loss decreased to 48% among participants in environmental programs, and the fraction of farmers with forest gains increased to 41%. When analyzing the results at a farm type level, small-scale farmers presented similar tendencies to the ones described above (see Figure 10). The percentage of famers exhibiting forest loss decreased from 73% to 48% for respondents involved in conservation/workshops programs.
Additionally, forest cover increase was found among farmers with environmental education, accounting for 41% of the respondents in this group. Large-scale farmers revealed different patterns from the ones described previously. The group of respondents which attended workshops was higher among farmers with increases in their forest cover (59%) in comparison to the ones exhibiting forest loss (32%) in the same group. Trends among the non-participant group resemble the ones shown for small- and medium-scale farmers, where farmers exhibiting forest loss (50%) dominated. Overall, results revealed a clear pattern where environmental education has an influence on the dynamics of the forest. Farmers with environmental knowledge tend to experience less forest loss.

4. Discussion

4.1. Forest Cover Change Analysis

The dynamics of the BAAPA forest and the perception of its benefits is a topic of great importance which has not been adequately studied so far. When analyzing changes of the forest cover, most studies were based solely on remote sensing [4,5,20] or field survey data [18]. To the knowledge of the authors, no research has combined both information types in the region. If the objective is to preserve natural resources, it is important to understand not only the historical distribution of the forest, but also the landowners’ perceptions of it [51,52]. In a first part, the present study focuses on how the forest cover has been changing over the last 17 years, using a multi-temporal analysis approach. For this purpose, changes in the forest cover were assessed by applying a RF classifier using spectral temporal metrics derived from a dense set of Landsat Imagery (TM, ETM+ and OLI/TIRS). In a second part, this study examines how different farmer groups perceive the forest and how their perceptions influence its dynamics, integrating remote sensing and household level data.
Overall, change detection results revealed a total forest cover loss of 7500 km2 (almost 28% of its original cover) between 1999 and 2016. However, in comparison with studies conducted for the previous years, a decreasing trend in deforestation rates is observed. Huang et al. [13,20] demonstrated that between 1989 and 2000, the BAAPA forest lost almost 40% (over 13,500 km2) of its original cover, a figure nearly two times higher than deforestation figures found in this research. Inconsistencies with other studies regarding deforestation rates were found. For example, Da Ponte et al. [21] analyzed changes in the BAAPA forest between the years 2003 and 2013 based on Landsat images (OLI and ETM+). The study reported a total forest cover loss of 37% (around 33,039 km2) by the year 2003 and 30% (over 26,966 km2) in 2013. The present research, however, revealed lower forest coverage for the same period, of 28% (24,197 km2) and 23% (20,221 km2), respectively. Differences between findings could be related to sensors applied, input data (e.g., percentiles, vegetation indexes) and definition of forest. Similar trends were observed when comparing classification results with the ones obtained by the National University of Asuncion—UNA. For the year 2011, the UNA found natural forest coverage of 20% in the BAAPA, or almost 17,500 km2 [53]. Results from this study presented higher forest coverage values (around 23% (20,000 km2)) for the same period. It is worth noting that both studies assessed changes in the forest cover by applying bi-temporal-approaches considering only single scenes. Further spectral features such as percentiles derivation, vegetation indices, and a dense set of Landsat imagery were excluded from the analysis. The described data was already proven to be essential to achieving higher accuracy in land cover predictions and change detection assessment [28,37].
A detailed analysis of the time series indicates that deforestation rates seem to increase abruptly between the years 2002–2004 (almost four times higher than previous years) and gradually decrease again until the years 2015–2016, where slight increase is once again observed. This trend can be attributed to the Zero Deforestation Law (No. 2524/04) established in the year 2004, which banned the conversion of forest lands for other purposes [14]. According to farmers interviewed during the field survey, the Zero Deforestation Law was anticipated by rural communities and large landowners, who increased their deforestation activities before the deforestation law took effect.
A clear difference in the effectiveness of conservation programs under different forest management regimes is observed. For instance, every natural reserve owned by the Government-Gov presented a certain degree of forest loss within their boundaries. Reserves managed by the ITAIPU-IT hydroelectric, on the other hand, showed increases in forest cover, in some cases up to 71% of its total area (e.g., Mbaracayu reserve). ITAIPU is a binational hydroelectric company owned by the Paraguayan and Brazilian government. They invest economic resources to protect natural areas, but solely in areas located directly in their watersheds (as a part of their environmental mitigation program). Subsidies given directly by the government, in contrast, are rather scarce. According to several national environmental institutions (e.g., Guyra Paraguay, WWF, Fundacion Moises Bertoni), further support to protecting natural forest areas is needed. Until today, there still remains a strong weakness in the enforcement of environmental laws, policies and proper criteria to include stakeholder’s needs and concerns when implementing conservation programs [25].

4.2. Household Survey and Remote Sensing Data

The analysis of forest cover change at the farm level in combination with results derived from field surveys permits comparing variations in forest surfaces along with the influence of change by different farm groups. Overall, results revealed a clear difference in the dynamics of the forest cover between farm types. In general, a higher proportion of small-scale farms presented forest loss compared with medium- and large-scale farmers. Similar tendencies were found in several reports from Peruvian environmental agencies (e.g., Ministry of Environment and Ministry of Agriculture and Irrigation) that tag small-scale farmers as the principal responsible group for over 90% of the deforestation activities that occurred in the Peruvian Amazon [54]. However, it is important to clarify that the total area of forest loss between farm types was not considered in this study. Therefore, even though small-scale farmers were shown to be the farm group most responsible for deforestation activities, the total forest area loss might not be as high compared to medium- and large-scale farmers. This study also analyzed the influence of education level on deforestation tendencies in the BAAPA. The percentage of farmers exhibiting forest loss decreases as education levels increase. Comparable trends were found among the Amerindian farmers in Honduras, where forest clearings tended to decline as education levels increased [55]. Additionally, according to Turner II et al. [56], a higher level of education could imply a better management of natural resources and a decrease in pressure on the forest.
A clear correlation was observed between the various farm types and differing ways of using the forest. In general, results show a higher percentage of small- and medium-scale farmers demonstrating forest loss. The present trend is consistent with the results obtained in the 2016 field survey, which revealed a high dependency on forest benefits (in particular construction wood and fire-wood) by the same farm types. The extraction of forest goods without considering any concept of sustainability or management plans could greatly influence its continuity [14]. Similar to the trends discussed above, a correlation between the tendencies found among large-scale farmers and results obtained in the 2016 survey was observed. The majority of large-scale farmers stated that their main use of the forest was recreational; correspondingly, their properties did not show evidence of intense harvesting. Results in our study demonstrated not only that large-scale farms presented the lowest percentage of respondents exhibiting forest loss, but also that the same group showed the highest percentage of respondents with increases in their forest cover. However, it is important to remark that the level of use of forest goods is highly associated with the level of income and daily subsidence needs (housing and cooking in particular), from each farm group. According to the main results obtained in the survey, the level of reliance on forest products varies with farm size; dependency on the forest tends to increase as farm size decreases. Whereas medium- and large-scale farmers are inclined to see the forest as an additional source of income, small-scale farmers, on the contrary, rely directly on forest products for subsistence.
Lastly, this study related the influence of environmental education on the variation in forest cover between farm types. The properties of farmers that participated in environmental programs/workshops were less likely to exhibit forest loss. However, at least for small- and medium-scale farmers, the percentage of farms showing forest loss was overwhelming. Large-scale farmers presented different trends, the majority of farms demonstrating increases in forest cover, which can be related to their increased participation in environmental programs.
Finally, it is important to take notice of certain biases on the input data that might have influenced the outcomes of this study. Firstly, the responses of the survey could have been influenced by the background of the interviewer, problems with environmental authorities and personal thoughts over the nature of the research itself. The present study combined remote sensing data with the available cadastral information for the area as far as possible. However, since most of the cadastral data was not accessible (in particular for small-scale farmers), field measurements relied on the knowledge of the farmer regarding the boundaries from their farm. Lastly, the distribution of the samples was dependent on the cadastral information; therefore, the representation for the study area could have been biased.

5. Conclusions

The results of this study provided a description of deforestation trends over the BAAPA region between 1999 and 2016. The correlation of household and remote sensing data permitted the obtainment of relevant information with regards to farmers’ influence on the dynamics of the forest at the farm level. Based on the major findings and discussions in this study, the main conclusions are described as follows:
  • Results of the forest change detection analysis based on Landsat imagery revealed a total forest cover loss of almost 7500 km2 between the years 1999 and 2016, which represents almost 27% of its cover.
  • The outcomes of the time series analysis presented a drastic increase in deforestation rates between the years 2001–2002 and 2003–2004, almost four times the deforestation rates observed for previous years (2300 km2). According to local farmers, the present trend could be attributed to the upcoming Zero Deforestation Law in the country, which influenced the rapid deforestation before the law was applied.
  • Forest cover change analysis in protected areas demonstrated a clear difference between their effectiveness. Whereas protected areas under the ITAIPU hydroelectric management regime presented increases in forest cover, protected areas managed by the Government, on the contrary, showed a decrease in their forest cover in each of the reserves.
  • According to the 145 households interviewed, forest dynamics at the farm level is related to farm types. While the frequency of farmers presenting forest loss increases as farm sizes decreases, forest gains, on the contrary, increase as farm sizes increases as well.
  • Education level has been shown to have an influence on the dynamics of the forest at the farm level. Overall, results demonstrated that, as education level increases, the percentage of famers exhibiting forest loss decreases. When considering forest gain, on the other hand, a higher percentage of farms with increases in forest cover can be found among the group with higher education.
  • The level of dependency on forest products by different farm groups affects the status of their forest. Higher levels of dependency resulted in a higher percentage of farmers presenting forest cover loss.
  • Environmental programs provide a certain degree of influence on changes in the forest cover at the farm level. Among the groups participating in environmental programs and workshops, a lower percentage of respondents showed forest loss on their properties than for comparable groups that did not attend the workshops.
Further studies could make use of higher resolution imagery to increase the accuracy of the results, in particular when considering an assessment of forest cover change at the farm level. In addition, absolute values of deforestation between farm types should be addressed in future studies to assess what the actual impact of different farm types on the forest cover is. Moreover, it would be interesting to consider additional dynamic information on the state of the forest (such as yearly forest degradation and regeneration rates) which would add more information with regards to the pressure exerted by different farm types on forest resources. The use of multi-temporal information, along with ground data, are key components to designing and supporting conservation strategies and policies. It is crucial to consider not only the outlook of rural population but their influence on the behavior of natural resources over time, as well.

Acknowledgments

This work was conducted under the Paraguay Land Use (PARLU) ‘Protecting Forest for the Benefit of Climate, People and Nature in Paraguay’ executed by WWF Paraguay and supported by the German Federal Ministry of the Environment, Nature Conservation, Building and Nuclear Safety (BMUB).

Author Contributions

D.P.E. conducted the field surveys, processed and validated the remote sensing data, and wrote the majority of the manuscript. K.C. was involved in research design, the design of the household survey questionnaire, methodological guidance for data processing and a critical revision of the manuscript. B.M. and C.W. contributed to the processing of remote sensing data. R.O. contributed to conducting the field surveys. N.O., S.D. and M.F. supported the manuscript with discussion and critical revision.

Conflicts of Interest

The authors declare no conflict of interest.

References

  1. Carlson, M.J.R.; Mitchell, L.R. Scenario analysis to identify viable conservation strategies in Paraguay’s imperiled Atlantic forest. Ecol. Soc. 2011, 16, 8. [Google Scholar]
  2. Tejaswi, G. FAO Manual on Deforestation, Degradation, and Fragmentation Using Remote Sensing and GIS; Forestry Department, Food and Agriculture Organization of the United Nations: Rome, Italy, 2007; Available online: www.fao.org/forestry/18222-045c26b711a976bb9d0d17386ee8f0e37.pdf (accessed on 29 August 2017).
  3. WWF Paraguay Extends Zero Deforestation Law to 2018. Available online: http://wwf.panda.org/?210224/Paraguay-extends-Zero-Deforestation-Law-to-2018 (accessed on 29 August 2017).
  4. Hansen, M.C.; Stehman, S.V.; Potapov, P.V. Quantification of global gross forest cover loss. Proc. Natl. Acad. Sci. USA 2010, 107, 8650–8655. [Google Scholar] [CrossRef] [PubMed]
  5. Hansen, M.C.; Potapov, P.V.; Moore, R.; Hancher, M.; Turubanova, S.A.; Tyukavina, A.; Thau, D.; Stehman, S.V.; Goetz, S.J.; Loveland, T.R.; et al. High-Resolution Global Maps of 21st-Century Forest Cover Change. Science 2013, 342, 850–853. [Google Scholar] [CrossRef] [PubMed]
  6. Fleytas, C. Cambios en el paisaje. Evolución de la cobertura vegetal en la Región Oriental del Paraguay. In Biodiversidad del Paraguay: Una imacion a Sus Realidades, 1st ed.; Salas-Deunas, D., Facetti, J., Eds.; Fundacion Moises Bertoni, USAID, GEF/BM.: Asuncion, Paraguay, 2007; pp. 77–88. Available online: https://de.scribd.com/document/225612694/Cambios-en-El-Paisaje-Evolucion-de-La-Cobertura-Vegetal-en-La-Region-Oriental-Del-Paraguay (accessed on 4 April 2017).
  7. Bitetti Di, M.S.; Placci, G.; Alves, D. Vision de la Biodiversidad de la Ecorregión Bosque Atlántico del Alto Paraná: Diseño de un Paisaje para la Conservación de la Biodiversidad y prioridades para las acciones de conservación; World Wildlife Fund: Washington, DC, USA, 2003; pp. 29–135. Available online: http://assets.wwf.org.br/downloads/altoparana_version_completa.pdf (accessed on 15 April 2017).
  8. Mayers, N. Threatened biotas: “Hot spots” in tropical forests. Environmentalist 1988, 8, 187–208. [Google Scholar] [CrossRef]
  9. Mittermeier, R.A.; Myers, N.; Mittermeier, C.G. Hotspots: Earth’s Biologically Richest and Most Endangered Terrestrial Ecoregions; Graphic Arts Center Publishing Company: Washington, DC, USA, 1999; pp. 1–431. [Google Scholar]
  10. Myers, N.; Mittermeier, R.A.; Mittermeier, C.G.; Da Fonseca, G.A.; Kent, J. Biodiversity hotspots for conservation priorities. Nature 2000, 403, 853–858. [Google Scholar] [CrossRef] [PubMed]
  11. Olson, D.M.; Dinerstein, E. The Global 200: Priority ecoregions for global conservation. Ann. Missouri Bot. Gard. 2002, 89, 199–224. [Google Scholar] [CrossRef]
  12. Catterson, T.M.; Fragano, F.V. Tropical Forestry and Biodiversity Conservation in Paraguay: A Report to USAID/Paraguay. 2004. Available online: https://rmportal.net/library/content/1/118_paraguay/at_download/file (accessed on 29 August 2017).
  13. Huang, C.; Kim, S.; Altstatt, A.; Townshend, J.R.G.; Davis, P.; Song, K.; Tucker, C.J.; Rodas, O.; Yanosky, A.; Clay, R.; et al. Rapid loss of Paraguay’s Atlantic forest and the status of protected areas–A Landsat assessment. Remote Sens. Environ. 2007, 106, 460–466. [Google Scholar] [CrossRef]
  14. Hutchison, S.; Aquino, L. Making a Pact to Tackle Deforestation in Paraguay. International Tree Foundation, 2011. Available online: internationaltreefoundation.org/wp-content/.../Paraguay-FINAL-30-march-2011.pdf (accessed on 29 August 2017).
  15. Grossman, J.J. A case study of smallholder eucalyptus plantation silviculture in Eastern Paraguay. For. Chron. 2012, 88, 528–534. [Google Scholar] [CrossRef]
  16. Kernan, B.S.; Cordero, W.; Macedo Sienra, A.M.; Marín, J.V. Report on Biodiversity and Tropical Forests in Paraguay; USAID: Asuncion, Paraguay, 2010; pp. 1–99. Available online: https://www.usaid.gov/sites/default/files/documents/1862/paraguay_biodiversity_tropical_forest_report.pdf (accessed on 29 August 2017).
  17. Valiente, E.; Gerard, F. Fortalecimiento de las políticas agroambientales en los países de américa latina y el caribe. Diagnostico Nacional de Politica Agroambiental Paraguay, 2016. Available online: http://www.fao.org/in-action/programa-brasil-fao/proyectos/politicas-agroambientales/es/ (accessed on 29 August 2017).
  18. Da Ponte, E.; Kuenzer, C.; Parker, A.; Rodas, O.; Oppelt, N.; Fleckenstein, M. Forest cover loss in Paraguay and perception of ecosystem services: A case study of the Upper Parana Forest. Ecosyst. Serv. 2017, 24, 200–212. [Google Scholar] [CrossRef]
  19. Da Ponte, E.; Fleckenstein, M.; Leinenkugel, P.; Parker, A.; Oppelt, N.; Kuenzer, C. Tropical forest cover dynamics for Latin America using Earth observation data: A review covering the continental, regional, and local scale. Int. J. Remote Sens. 2015, 36, 37–41. [Google Scholar] [CrossRef]
  20. Huang, C.; Kim, S.; Song, K.; Townshend, J.R.G.; Davis, P.; Altstatt, A.; Rodas, O.; Yanosky, A.; Clay, R.; Tucker, C.J.; et al. Assessment of Paraguay’s forest cover change using Landsat observations. Glob. Planet. Chang. 2009, 67, 1–12. [Google Scholar] [CrossRef]
  21. Da Ponte, E.; Roch, M.; Leinenkugel, P.; Dech, S.; Kuenzer, C. Paraguay’s Atlantic Forest cover loss—Satellite-based change detection and fragmentation analysis between 2003 and 2013. Appl. Geogr. 2017, 79, 37–49. [Google Scholar] [CrossRef]
  22. Bragayrac, E. Proyecto Conservación de Bosques del Paraguay—REDD BAAPA; Monitoreo Social de la Colonia Amistad: Asuncion, Paraguay, 2014; pp. 1–46. Available online: http://www.worldlandtrust.org/documents/annexe_1_-_social_monitoring_results_in_spanish.pdf (accessed on 29 August 2017).
  23. DGEEC (Dirección Nacional de Censos y Estadisticas), Atlas censal del Paraguay. Available online: http://www.dgeec.gov.py/ (accessed on 29 August 2017).
  24. MAG (Ministerio de Agricultura y Ganaderia). Informer sector Agropecuario ISA. Available online: http://www.mag.gov.py/index.php/noticias/logros-del-sector-agropecuario-en-el-pais (accessed on 29 August 2017).
  25. Gonzales, R.; Rivadeneira, M. Estudio de tendencias y perspectivas del Sector Forestal en America Latina Documento de Trabajo. Informe nacional Paraguay; FAO: Rome, Italy, 2004; Volume 9, pp. 1–98. Available online: http://www.fao.org/forestry/outlook/2406/es/ (accessed on 29 August 2017).
  26. Patterson, T.; Kelso, V.N. Earth Natural Free Vector and Raster Map Data. Available online: http://www.naturalearthdata.com/downloads (accessed on 10 March 2017).
  27. Mittermeier, R.A.; Robles-Gil, P.; Hoffman, M.; Pilgrim, J.D.; Brooks, T.B.; Mitterneier, C.G.; Lamoreux, J.L.; Fonseca, G.A. Biodiversity Hotspots Revisited, Conservation International 2004. Databasin, 2004. Available online: http://www.biodiversityhotspots.org/xp/Hotspots/resources/maps.xml (accessed on 3 April 2017).
  28. Wohlfart, C.; Mack, B.; Liu, G.; Kuenzer, C. Multi-faceted land cover and land use change analyses in the Yellow River Basin based on dense Landsat time series: Exemplary analysis in mining, agriculture, forest, and urban areas. Appl. Geogr. 2017, 85, 73–88. [Google Scholar] [CrossRef]
  29. Knauer, K.; Gessner, U.; Fensholt, U.; Kuenzer, C. Agricultural Expansion in Burkina Faso over 14 Years with 30 m Resolution Time Series: The Role of Population Growth and Implications for the Environment. Remote Sens. 2017, 9, 132. [Google Scholar] [CrossRef]
  30. Gebhardt, S.; Wehrmann, T.; Ruiz, M.A.M.; Maeda, P.; Bishop, J.; Schramm, M.; Kopeinig, R.; Cartus, O.; Kellndorfer, J.; Ressl, R.; et al. MAD-MEX: Automatic wall-to-wall land cover monitoring for the mexican REDD-MRV program using all landsat data. Remote Sens. 2014, 6, 3923–3943. [Google Scholar] [CrossRef]
  31. Zhu, Z.; Woodcock, C.E. Object-based cloud and cloud shadow detection in Landsat imagery. Remote Sens. Environ. 2012, 118, 83–94. [Google Scholar] [CrossRef]
  32. Richter, R.; Schläpfer, D. Atmospheric/Topographic Correction for Satellite Imagery (ATCOR-2/3 User Guide); ReSe Applications Schläpfer: Langeggweg, Switzerland, 2016; pp. 13–250. Available online: www.rese.ch/pdf/atcor3_manual.pdf (accessed on 29 August 2017).
  33. Mack, B.; Leinenkugel, P.; Kuenzer, C.; Dech, S. A semi-automated approach for the generation of a new land use and land cover product for Germany based on Landsat time-series and Lucas in-situ data. Remote Sens. Lett. 2017, 8, 244–253. [Google Scholar] [CrossRef]
  34. Franklin, S.E.; Ahmed, O.S.; Wulder, M.A.; White, J.C.; Hermosilla, T.; Coops, N.C. Large area mapping of annual land cover dynamics using multitemporal change detection and classification of Landsat time series data. Can. J. Remote Sens. 2015, 41, 293–314. [Google Scholar] [CrossRef]
  35. Griffiths, P.; Kuemmerle, T.; Baumann, M.; Radeloff, V.C.; Abrudan, I.V.; Lieskovsky, J.; Munteanu, C.; Ostapowicz, K.; Hostert, P. Forest disturbances, forest recovery, and changes in forest types across the Carpathian ecoregion from 1985 to 2010 based on Landsat image composites. Remote Sens. Environ. 2014, 151, 72–88. [Google Scholar] [CrossRef]
  36. Hansen, M.C.; Egorov, A.; Potapov, P.V.; Stehman, S.V.; Tyukavina, A.; Turubanova, S.A.; Roy, D.P.; Goetz, S.J.; Loveland, T.R.; Ju, J.; et al. Monitoring conterminous United States (CONUS) land cover change with Web-Enabled Landsat Data (WELD). Remote Sens. Environ. 2014, 140, 466–484. [Google Scholar] [CrossRef]
  37. Müller, H.; Griffiths, P.; Hostert, P. Long-term deforestation dynamics in the Brazilian Amazon—Uncovering historic frontier development along the Cuiabá–Santarém highway. Int. J. Appl. Earth Obs. Geoinf. 2016, 44, 61–69. [Google Scholar] [CrossRef]
  38. Breiman, L. Random forests. Mach. Learn. 2001, 45, 5–32. [Google Scholar] [CrossRef]
  39. Congalton, R.G.; Green, K. Assessing the Accuracy of Remotely Sensed Data: Principles and Practices; Second Edition (Mapping Science); CRC Press: Boca Raton, FL, USA, 2008. [Google Scholar]
  40. Wohlfart, C.; Liu, G.; Huang, C.; Kuenzer, C. A River Basin over the course of time: Multi-temporal analyses of land surface dynamics in the Yellow River Basin (China) based on medium resolution remote sensing data. Remote Sens. 2016, 8, 186. [Google Scholar] [CrossRef] [Green Version]
  41. Paraguayan Atlantic Forest. 24°58′31.38″ S and 55°03′27.73″ W. Google Earth. 1999–2016. Available online: https://earth.google.com/web/@-24.58598683,-55.12783014,432.7883121a,308634.30743907d,35y,11.83507172h,7.24129773t,0r (accessed on 12 April 2017).
  42. Pal, M. Random forest classifier for remote sensing classification. Int. J. Remote Sens. 2005, 26, 217–222. [Google Scholar] [CrossRef]
  43. Gislason, P.O.; Benediktsson, J.A.; Sveinsson, J.R. Random Forests for land cover classification. Pattern Recognit. Lett. 2006, 27, 294–300. [Google Scholar] [CrossRef]
  44. Schneider, A. Monitoring land cover change in urban and peri-urban areas using dense time stacks of Landsat satellite data and a data mining approach. Remote Sens. Environ. 2012, 124, 689–704. [Google Scholar] [CrossRef]
  45. R Core Team. R, 3.3.1; R Foundation for Statistical Computing: Vienna, Austria, 2016. [Google Scholar]
  46. Liaw, A.; Wiener, M. Classification and regression by randomForest. R News 2002, 2, 18–22. [Google Scholar]
  47. Lillesand, T.; Kiefer, R.W.; Chipman, J. Remote Sensing and Image Interpretation, 6th ed.; Flahive, R., Kelleher, L., Hong, S., Eds.; Wiley: New York, NY, USA, 2008; Volume 6. [Google Scholar]
  48. FAO. Global Forest Resources Assessment 2010; FAO: Rome, Italy, 2010; pp. 1–193. [Google Scholar]
  49. PNUD Sector rural paraguayo: una visión general para un dialogo informado; Mercurio S.A.: Asuncion, Paraguay, 2010; Volume 7, pp. 8–109.
  50. Yamane, T. Statistics: An Introductory Analysis; Harper and Row: New York, NY, USA, 1967. [Google Scholar]
  51. Sodhi, N.S.; Lee, T.M.; Sekercioglu, C.H.; Webb, E.L.; Prawiradilaga, D.M.; Lohman, D.J.; Pierce, N.E.; Diesmos, A.C.; Rao, M.; Ehrlich, P.R. Local people value environmental services provided by forested parks. Biodivers. Conserv. 2009, 19, 1175–1188. [Google Scholar] [CrossRef]
  52. Casado-Arzuaga, I.; Madariaga, I.; Onaindia, M. Perception, demand and user contribution to ecosystem services in the Bilbao Metropolitan Greenbelt. J. Environ. Manag. 2013, 129, 33–43. [Google Scholar] [CrossRef] [PubMed]
  53. Rajelaga, L.; Guerrero, N.; Cabrera, L.; Hirata, Y.; Takahashi, M.; Vega, L. Mapa de Cobertura de la Tierra Paraguay 2011. In Facultad de Ciencias Agrarias y Forestry and Forest Products Research Institute (Japon); SIG/CIF/FCA/UNA: San Lorenzo, Paraguay, 2013; pp. 1–24. [Google Scholar]
  54. Ravikumar, A.; Sears, R.R.; Cronkleton, P.; Menton, M.; Pérez-Ojeda del Arco, M. Is small-scale agriculture really the main driver of deforestation in the Peruvian Amazon? Moving beyond the prevailing narrative. Conserv. Lett. 2017, 10, 170–177. [Google Scholar] [CrossRef]
  55. Godoy, R.; Groff, S.; O’Neill, K. The role of education in neotropical deforestation: Household evidence from Amerindians in Honduras. Hum. Ecol. 1998, 26, 649–675. [Google Scholar] [CrossRef]
  56. Turner, B.L., II; Geoghegan, J.D. Integrated Land-Change Science and Tropical Deforestation in the Southern Yucatan; OUP Oxford: Oxford, UK, 2004. [Google Scholar]
Figure 1. (a) Overview of the study area (Base layer provided by Natural Earth Community and Conservation international [26,27]); (b) Paraguay and the Upper Parana Atlantic Forest (BAAPA) location (source: adapted from Natural Earth [26]); (c) Household distribution within selected study areas.
Forests 08 00389 g001
Figure 2. Workflow of remote sensing data processing and classification procedures (source: adapted from Mack et al. [33].
Forests 08 00389 g002
Figure 3. Deforestation results in the BAAPA region between 1999 and 2016.
Forests 08 00389 g003
Figure 4. Comparison of forest dynamics between protected areas based on the type of ownership: Prv. (Private ownership), Gov. (Governmental ownership) and IT (Owned by the ITAIPU hydroelectric dam).
Forests 08 00389 g004
Figure 5. Dynamics of the forest stratified by farm type.
Forests 08 00389 g005
Figure 6. Education level according to farm size of the respondents.
Forests 08 00389 g006
Figure 7. Dynamics of the forest based on the education level of the respondents.
Forests 08 00389 g007
Figure 8. Main uses of forest related products based on farm type.
Forests 08 00389 g008
Figure 9. Dynamics of the forest cover based on the level of dependency.
Forests 08 00389 g009
Figure 10. Relationship between conservation programs and forest cover change per-farm type.
Forests 08 00389 g010
Table 1. Landsat data and number of processed scenes used in this study.
SensorPath/RowAcquisition DatesNumber of ScenesTotal
Landsat 5 TM224/7707/1999–11/2011116930
224/7804/1999–11/2011108
224/7901/1999–11/2011106
225/7601/1999–11/2011112
225/7701/1999–11/2011118
225/7801/1999–11/2011121
225/7901/1999–9/2011127
226/7602/1999–10/2011122
Landsat 7 ETM+224/7708/1999–07/20161901514
224/7808/1999–08/2016177
224/7909/1999–08/2016188
225/7607/1999–07/2016198
225/7707/1999–08/2016197
225/7807/1999–08/2016194
225/7910/1999–08/2016179
226/7608/1999–08/2016191
Landsat 8 OLI224/7705/2013–08/201643331
224/7805/2013–08/201640
224/7907/2013–08/201642
225/7604/2013–07/201644
225/7704/2013–07/201641
225/7804/2013–07/201645
225/7904/2013–07/201643
226/7604/2013–08/201633
Table 2. Classification accuracies for each time step from 1999 to 2016.
Time PeriodOverallKAPPAProducers Accuracy ForestUsers Accuracy ForestProducers Accuracy Non-ForestUsers Accuracy Non-Forest
1990/200089.04%0.8590.15%89.12%89.87%88.10%
2001/200293.06%0.9194.13%92.28%92.86%93.18%
2003/200485.71%0.8286.74%85.95%84.67%85.13%
2005/200692.86%0.9093.75%92.67%92.88%91.43%
2007/200891.69%0.8993.09%90.43%91.15%92.24%
2009/201091.03%0.8791.15%91.08%89.87%91.02%
2011/201292.35%0.8994.88%93.45%90.72%91.23%
2013/201492.13%0.8992.78%92.52%91.36%91.75%
2015/201687.36%0.8388.40%87.78%87.04%86.26%
Table 3. Forest cover and forest cover loss in the BAAPA region from 1999 to 2017.
DepartmentForest Cover (1999–2000 km2)%Forest Cover (2001–2002 km2)%Forest Cover (2003–2004 km2)%Forest Cover (2005–2006 km2)%Forest Cover (2007–2008 km2)%
Alto Paraná333612.3321011.8285610.5274710.1270910.0
Amambay24148.923718.723538.721447.919987.3
Caaguazú311311.5306911.3280110.326589.826499.7
Caazapá21728.021698.019017.018016.617876.6
Canindeyú581221.4560220.6503618.5488918.0469217.3
Concepción12464.612364.510844.010273.89403.5
Guairá9163.48913.38623.28603.28563.1
Itapúa308611.4308411.3283310.4280210.3273010.0
Paraguarí3571.33241.23471.33351.23271.2
San Pedro473517.4457016.8412415.2372813.7338312.4
Total27,18710026,526 24,197 22,991 22,071
DepartmentForest Cover (2009–2010 km2)%Forest Cover (2011–2012 km2)%Forest Cover (2013–2014 km2)%Forest Cover (2015–2016 km2)%Total Forest Loss (km2)%
Alto Paraná26649.826099.625989.625289.380824.2
Amambay19467.219117.018276.718086.760625.1
Caaguazú25489.424879.124349.023228.579125.4
Caazapá17686.517686.517326.416396.053324.5
Canindeyú442716.3427815.7409115.0390414190832.8
Concepción9163.49013.38903.38763.237029.7
Guairá8343.18163.08063.08053.011112.1
Itapúa27059.927009.926789.926349.745214.6
Paraguarí3281.23581.33601.33481.392.4
San Pedro320411.8296310.9280410.3275410198141.8
Total21,340 20,791 20,220 19,618 756927.8