Article

Taxon-Independent and Taxon-Dependent Responses to Drought in Seedlings from Quercus robur L., Q. petraea (Matt.) Liebl. and Their Morphological Intermediates

1
Department of Forest Genetic Resources, Research Institute for Nature and Forest, Geraardsbergen 9500, Belgium
2
Department of Biometrics and Agricultural Informatics, Szent István University, Budapest 1118, Hungary
3
Department of Forest Reproductive Material and Plantation Management, Institute of Silviculture and Forest Protection, West-Hungarian University, Sopron 9400, Hungary
4
Department of Agro- and Biotechnology, School of Technology, Odisee University College, Sint-Niklaas 9100, Belgium
5
Laboratory of Plant Ecology, Faculty of Bioscience Engineering, Ghent University, Ghent 9000, Belgium
*
Author to whom correspondence should be addressed.
Forests 2017, 8(11), 407; https://doi.org/10.3390/f8110407
Submission received: 31 August 2017 / Revised: 21 October 2017 / Accepted: 24 October 2017 / Published: 27 October 2017
(This article belongs to the Special Issue Seedling Production and Field Performance of Seedlings)

Abstract

:
The increasing severity and frequency of summer droughts at mid-latitudes in Europe may impact forest regeneration. We investigated whether the sympatric species Quercus robur L., Q. petraea (Matt.) Liebl., and their morphological intermediates respond differentially to water deficit. Acorns were sourced from a naturally mixed population. Half of the potted seedlings were subjected to two successive drought periods during the first growing season, each followed by a plentiful re-watering. The surviving drought-exposed seedlings subsisted independent of the taxon of the mother tree. The phenological responses were also taxon-independent. However, drought-exposed plants showed a retarded height growth in the year following the treatment which was taxon-dependent. Offspring from Q. robur and from trees with leaves resembling Q. robur leaves and infructescences resembling Q. petraea infructescences showed a stronger decrease in height growth compared to the offspring from Q. petraea and from trees with leaves resembling Q. petraea leaves and infructescences resembling Q. robur infructescences. Diameter growth in the year following the drought treatment showed a weak taxon-dependent response. Together, our results may suggest that the composition of oak species and their hybrids in natural oak forests could be altered upon prolonged periods of precipitation deficit.

1. Introduction

Climate change may alter temperature and precipitation regimes across Europe, which may result in longer and more severe summer droughts that in turn will challenge forest vitality [1,2]. Increases in tree mortality have been documented in temperate forests due to rising temperatures and water limitation [3], and multiple recurrent drought events were found to be more damaging than a single drought [4,5]. Generally speaking, the seedling stage of a forest tree is the most vulnerable phase in its life cycle. Therefore, comprehension of stress responses in seedlings is fundamental for predicting forest regeneration [6,7].
Among the prominent broad-leaved European tree species, oaks are well-known to be tolerant to drought. Therefore, Quercus robur L. and Q. petraea (Matt.) Liebl. are proposed as candidate tree species to replace more drought-sensitive species such as beech (Fagus sylvatica L.) or spruce (Picea abies (L.) Karst.) in warm and dry sites in Europe [8]. Responses to water deficit in oaks have been described in several studies. Water limitations induce a reduced above-ground growth pattern, a diminished biomass production, and a shift towards below-ground root growth [9,10,11,12,13]. Dry growing conditions induce an earlier stop of height growth [12,14] and an earlier cessation of secondary (radial) growth [15]. In the spring that follows a growing season with a drought treatment and an earlier autumnal growth stop, an advanced bud burst was noticed [16]. Re-watering after a period of water deficit increased the chance of an extra shoot as compensation growth [17]. A delay in autumnal senescence, with a delayed bud burst in the subsequent spring, was observed upon re-watering after a drought period in late summer, and is interpreted as a compensation time for physiological repair before entering the next developmental phase of senescence [18]. To date, these studies focus on pure oak species and do not account for interspecific hybrids that are known to occur regularly.
Q. robur and Q. petraea are two native mid-successional European oak species, and are among the most frequent tree species in Central and Western Europe. Both oaks occur widely across most of Europe, reaching northwards to southern Scandinavia, southwards to the northern part of the Mediterranean region, westwards to Ireland, and eastwards to southern European Russia. Q. robur has a more extended distribution, reaching more eastwards into continental central Russia. Both are of great ecological interest as habitat and food source for a great variety of insects, mammals, birds, fungi, lichens, and moss species. At the same time, they imply a considerable economic value for forest enterprises and the wood processing industry [19]. Sympatric in large geographical areas, these interfertile species are well-known to hybridise in natural conditions, giving rise to the hybrid taxon Q. x rosacea Bechst [20,21,22]. It was already suggested in 1950 that the number of genes by which species of oaks differ from each other is considerably smaller than is the case for many related and interfertile species in other plant genera [23]. Both species still deviate in their ecological requirements. Q. robur flourishes in nutrient-rich, humid sites, often in lowlands, whereas Q. petraea is more dominantly present in drier and warmer sites that are less nutrient-rich, often at mid-altitudes [24]. For instance, in Germany only 25% of 1200 studied natural oak stands consisted of only one of the two species, while the other 75% contained both species in variable proportions, with the latter sites being characterised by mosaics of dry and humid microenvironments and the occurrence of intermediate morphological forms [24]. Q. petraea is considered the more drought-tolerant species, and detailed studies have corroborated this. For instance, a study on excised branches showed that Q. robur was more vulnerable than Q. petraea to water-stress-induced cavitation [25] and Q. petraea displayed a higher water use efficiency compared to Q. robur [26]. In addition, Q. petraea is less adapted to anoxia than Q. robur [27]. The behaviour of hybrids in this respect is unknown.
In general, Q. robur and Q. petraea are characterized by distinct differences in leaf morphology, although overlap exists between the two species when individual traits are considered [28,29,30]. The two species do not differ in alleles but in allele frequencies, as detected by molecular marker studies [30]. A joint analysis of morphology and genetic information is rare, often applying one approach as confirmation for the other, with genetic taxon assignment coinciding well with morphological classification [30,31,32]. In all these cases, leaf morphological traits are applied. Q. robur is characterized by a short leaf petiole, secondary veins running to the sinuses between leaf lobes, and a leaf lamina base being typically lobated [33]. Q. petraea leaves have longer petioles, no secondary veins that end in the sinuses, and a more symmetrical leaf shape. In comparison to other leaf traits, the largest part of the variation attributable to species distinction between Q. robur and Q. petraea was found for the trait leaf petiole length, indicating the importance of this trait for species determination [29]. Still, infructescence traits can enhance the morphological separation of the two species [20]. Intermediate individuals can be described based on a statistical multivariate analysis of leaf morphological traits, denoting individuals that are situated in between two peaks of a bimodal distribution along a synthetic axis where the peaks represent Q. robur and Q. petraea [28,29]. Intermediate individuals have also been defined based on a combination of leaf and infructescence traits when leaves resemble one species and infructescence traits resemble the other [20].
As the interfertile Q. robur and Q. petraea differ in their drought tolerance and as drought tolerance in their hybrids is unknown, we hypothesized in this study that Q. robur, Q. petraea, and their morphological intermediates respond differentially upon experimental drought, with Q. petraea being more drought tolerant and morphologically intermediate individuals displaying intermediate responses to water limitation. We question whether these taxa display variable responses (i) for survival after two successive drought periods in the first year; (ii) for leaf senescence in the first two years; (iii) for bud burst in the second year; (iv) for height growth in the second year; and (v) diameter growth in the second year.

2. Materials and Methods

2.1. Source Material

The sourced oak population in the northern part of Belgium (51°0′57.8556′′ N, 5°31′57.0384′′ E) is autochthonous [34]. A cpDNA analysis revealed a uniform haplotype. This haplotype fitted in the reconstructed postglacial migration routes [35]. The trees form a small relict of abandoned coppice wood growing on inland sand dunes within a former heath land where no tradition existed among the relatively poor farmers of introducing foreign provenances. Acorns were collected on 26 September 2013 from 18 mother trees in an area of 150 m × 150 m. At this time, acorns had ripened but were still hanging in the trees. As the oaks are growing widely spaced on the sand dunes, they have low reaching branches and the acorns were picked by hand, excluding any mixing of the acorns among mother trees. The taxon of the mother trees was identified in the field [20]. Q. robur showed a leaf stalk smaller than 1 cm and an infructescence stalk larger than 2 cm (six mother trees sampled and abbreviated as r). Q. petraea was characterised by a leaf stalk larger than 1 cm and an infructescence stalk smaller than 2 cm (six mother trees sampled and abbreviated as p). Any other combination of these two measures was considered to belong to the mother trees with intermediate morphological traits, further called intermediates. Two types of intermediates were present: the very rare trees with long leaf stalks (>1 cm) and long infructescence stalks (>2 cm), further called the long-stalked intermediates (one mother tree sampled and abbreviated as pr), and the more common trees with short leaf stalks (<1 cm) and short infructescence stalks (<2 cm), further called the short-stalked intermediates (five mother trees sampled and abbreviated as rp). The rarity of the long-stalked intermediates is also suggested by the results from controlled crosses. Interspecific crosses with Q. robur as a female parent showed higher acorn production rates, producing offspring with leaves resembling Q. robur and most probably resulting in short-stalked intermediates at fertile ages, compared to interspecific crosses with Q. petraea as a female parent generating offspring with leaves resembling Q. petraea and most probably yielding long-stalked intermediates at fertility [24].

2.2. Germination of the Acorns

In October 2013, the collected seeds were sown in forestry trays with one seed per cell, using standard nursery potting soil (organic matter 20%, pH 5.0–6.5, electrical conductivity (EC): 450 µS/cm, dry matter 25%, fertilization: 1.5 kg/m3 powdered compound fertilizer NPK 12 + 14 + 24). During winter, the trays were watered manually, keeping the soil moist. The experiment took place in a greenhouse with automatic temperature regulation, keeping the greenhouse frost-free in wintertime, but without additional heating. An automatic internal grey shade cloth system operated in the greenhouse, protecting the plants from high levels of insolation. In total, 392 seeds germinated, 143 from Q. petraea, 109 from Q. robur, and 140 from the intermediates (Table 1). Germination success per sampled taxon was 90%, 96%, 78%, and 79% for Q. petraea, the long-stalked intermediate, the short-stalked intermediate and Q. robur respectively. All germinating plants were given water at regular times according to the visual needs as judged by the experienced greenhouse workers. Seedlings were transferred in April 2014 to one-litre pots (12 × 11 × 11 cm) using standard nursery potting soil. The seedlings were not additionally fertilised.

2.3. Drought Treatment, Measurements, and Scoring

For the summer months, climate scenarios for Flanders indicate a decrease in average precipitation together with an increase in extreme short rainfall events [36]. Our experimental set-up mimicked the summer scenario by withholding any watering to potted seedlings (heat waves) interrupted by plentiful re-watering (short heavy rainfall). The pots were divided in two groups: a control and a treatment group. In both groups, the offspring of the 18 mother trees were individually mingled at random (completely randomised). Two successive drought periods were imposed on the oak seedlings during the first growing season. In 2014 on DOY (day of the year) 134 and DOY 217, respectively, the two groups of plants were soaked overnight in a basin with the water level up to two cm above the bottom of the pots to reach a fully-water-saturated condition. Watering was withheld from the drought-treated group up to DOY 182 and DOY 290, respectively, whereas the control group was further watered. All plants were re-watered on DOY 183 and DOY 291, respectively, by soaking the two groups of plants in the basins in the same way. The first drought period lasted 48 days and the second 73 days. At the end of the first drought period, only 1% of the seedlings in the treated group showed wilting and/or curling of the leaves, and no seedlings had died among the treated plants nor in the control group (Figure S1). The second drought period lasted until a larger number of plants (43%) showed wilting and/or curling of the leaves and started dying off (Figure S2). This period was considered as having had the strongest effect on the seedlings. When a drought period is mentioned in this paper, it concerns the second drought period of 2014. It was not a part of the experimental design to unravel the effect of the first drought period on the responses of the plants upon the second drought period. Still, results should be interpreted in light of a putative contribution of the first drought period. After the second re-watering, all plants—including both control plants and treated plants—were kept well-watered. They were well-watered during the whole following growing year by soaking all plants on a regular basis in the basins for several hours and subsequent draining. In this way, plants were brought to field capacity on a regular basis using a relatively easy-to-apply method of watering the individual pots in an equal manner.
During the two drought periods, all the pots were weighed nearly weekly to measure the water loss (Figures S1 and S2). On the same days, the wilting and/or curling of the leaves was observed (Figures S1 and S2). The initial weight at the beginning of the treatment period was measured after the pots had been drained of excess water. We described the soil water reserve with a relative value which is related to the term relative extractable water (REW). REW is calculated for a given day (j) using the formula REWj = (Rj − Rmin)/RU. Rj is the soil water content on a given day (j), calculated using the rooting depth. Rmin represents the minimum soil water content observed at the permanent wilting point, also expressed at the same depth. RU represents the total amount of extractable soil water in the rooted zone. It is the difference between the soil water reserve at field capacity and at the permanent wilting point. Water availability in the soil for plants to access will obviously depend on the size of the available reserve; i.e., the depth of rooting and the physical soil properties. In our experiment, all pots had the same size and the same volume and type of soil. Therefore, we modified the formula of REW for a given day (j) to an adjusted REWj = (weight DOY j − mean weight DOY 290)/(mean weight DOY 218 − mean weight DOY 290). Mean weight DOY 290 was the mean weight of the pots on DOY 290 for which the plant had died off at the end of the second drought period and did not recover anymore afterwards. This represented an approximation of the permanent wilting point. Mean weight DOY 218 was the mean weight of all the pots on DOY 218 and approximated field capacity. The calculation did not take into account possible weight gain by plant growth. This approximation is easily applicable to a larger amount of potted plants.
As acorns were collected within one natural stand with co-occurring Q. robur, Q. petraea, and morphologically intermediate forms; it cannot be excluded that hybrid individuals were sampled among the descendants of Q. robur and Q. petraea. A morphological evaluation was made of a well-developed leaf per plant in the first growing season. Morphological analyses of the leaves in the juvenile phase of oaks are known to have a diagnostic value, albeit weak [37]. Four scores were given per seedling, as indicated in Table S1. The principal component analysis was run on these scores to control the identification of the mother trees in the field.
During the second drought period, a significant amount of plants died off. Therefore, survival was monitored as a separate binary variable. The height of all the seedlings and the diameter of the plants at 1 cm above the soil level was measured at the end of the first and second growing seasons. Height and diameter growth during the second growing season were calculated by subtracting the height and diameter at the end of 2014 from the height and diameter at the end of 2015, respectively. Two phenophases were scored on all plants: leaf senescence in autumn 2014 and 2015, and bud burst in spring 2015. Leaf senescence was scored following an 8-level scoring protocol (Table S2) on DOY 335 in 2014 and on DOY 292, 313, and 330 in 2015. All the leaves of a seedling were observed together, and a visual mean of colour change was made. Bud burst and leaf unfolding in the apical bud was scored according to a 6-level scoring protocol (Table S2) on DOY 128 in 2015.

2.4. Data Analysis

All the statistical analyses were performed in the open source software R 3.1.2 [38]. Five response variables were modelled using generalised linear mixed models: survival, leaf senescence, bud burst, height growth, and diameter growth. Survival was examined using logistic regression (generalised linear mixed models) in the package lme4 [39], whereas the phenological response variables were modelled using cumulative logistic regression in the package ordinal [40]. We ordered the ordinal response variables bud burst and leaf senescence in decreasing order: going from unfolded leaves to buds in winter rest (from 6 to 1) and from shed leaves to dark green leaves (from 8 to 1). This way, the probability to have reached maximally for instance bud burst score 4 equalled the probability to have reached scores 6, 5, or 4. This included all plants with an apical bud from which leaves are protruding but not yet unfolding up to leaves fully unfolded (Table S2). This was interpreted as the probability of having reached at least bud burst score 4. Height and diameter growth in the second growing year—thus in the year following a growing season with a drought treatment—were processed with linear mixed models [39].
In the fixed part of the models, several covariates were examined for significant explanatory power: the taxon of the mother tree, the adjusted relative extractable water of the pots at the end of the second drought period, and the plant height at the end of the first growing season. The interaction between taxon of the mother tree and the adjusted relative extractable water at the end of the second drought period indicated whether the taxa experienced water limitation differentially. The phenological model leaf senescence got two additional covariates (day of observation and year of observation), as for this response variable repeated observations per plant were available. In all the models, the mother plant from which acorns were collected was in the random part (random intercept). For the phenological model leaf senescence, an additional unique plant identity variable was added in the random part of the models (random intercept) to account for the repeated measurements on the same plants. We simplified all full models to allow an easier and better interpretation. Using drop1 (a likelihood ratio test), the fixed part of all five models was reduced up to only significant terms. With a significant interaction term, the corresponding covariates (main effects) remained in the model. When taxon appeared not significant in a model, it was discarded from the model, indicating that the response variable was independent from the taxon of the mother tree.
Here we show the full models. The chance (p) of survival was calculated following a logistic regression:
log(p/(1 − p)) = α + βTT + βHH + βAA + βTATA + βHAHA
with α as the estimated intercept and the β’s as the estimated parameters of the fitted model. T is the taxon of the mother tree (r: Q. robur, p: Q. petraea, pr: long-stalked intermediate, rp: short-stalked intermediate); A is the adjusted relative extractable water of the pots at the end of the second drought period, accounting for the water deficient condition; and H is the plant height at the end of the first growing season.
For bud burst, the chance (p) to have reached at least a given phenological score level on the day of observation was calculated following a cumulative logistic regression:
log(p/(1 − p)) = αT − βTT − βHH − βAA − βTATA − βHAHA
with αT as an estimated threshold value for the passing on from one level of the phenological variable to the next.
For leaf senescence, the chance (p) to have reached at least a given phenological score level on the days of observation (both in 2014 and 2015) was calculated following a cumulative logistic regression:
log(p/(1 − p)) = αT − βDD − βYY − βTT − βHH − βAA − βYAYA − βTATA − βHAHA
D is the day of observation and Y is the year of observation (factor variable with two levels, 2014 and 2015).
Both diameter and height growth in the second growing year (I) were analysed with linear mixed models. Apart from the plants that had died off totally (n = 63), also the plants that had died off above ground (n = 10) were excluded from the dataset.
I = α + βTT + βHH + βAA + βTATA + βHAHA
The full and reduced models, using drop1, were run with the “maximum likelihood” method until only significant terms remained in the fixed part. Model statistics were taken from the final reduced model run with “restricted maximum likelihood”.
Confidence intervals (95%) were calculated based on the estimates of the parameters and their variance-covariance matrices in the final models.
To quantify the relative variability of the individual mother tree in comparison to the taxon of the mother tree, all final models were run with the taxon of the mother tree in the random part. In this way, the variance attributable to the mother trees could be compared to the variance attributable to the taxa to which these mother trees belonged to. In the linear models (response variables of height and diameter growth in second growing year), the residual variance indicated the variance of the individual seedlings and therefore allowed the comparison of the variance of the mother taxa and of the individual mother trees (nested within mother taxa) with the variance among the seedlings (nested within the individual mother trees). Logistic regression and cumulative logistic regression models did not have an error term, and therefore residual variance was not calculated.

3. Results

3.1. Morphological Evaluation of Seedlings
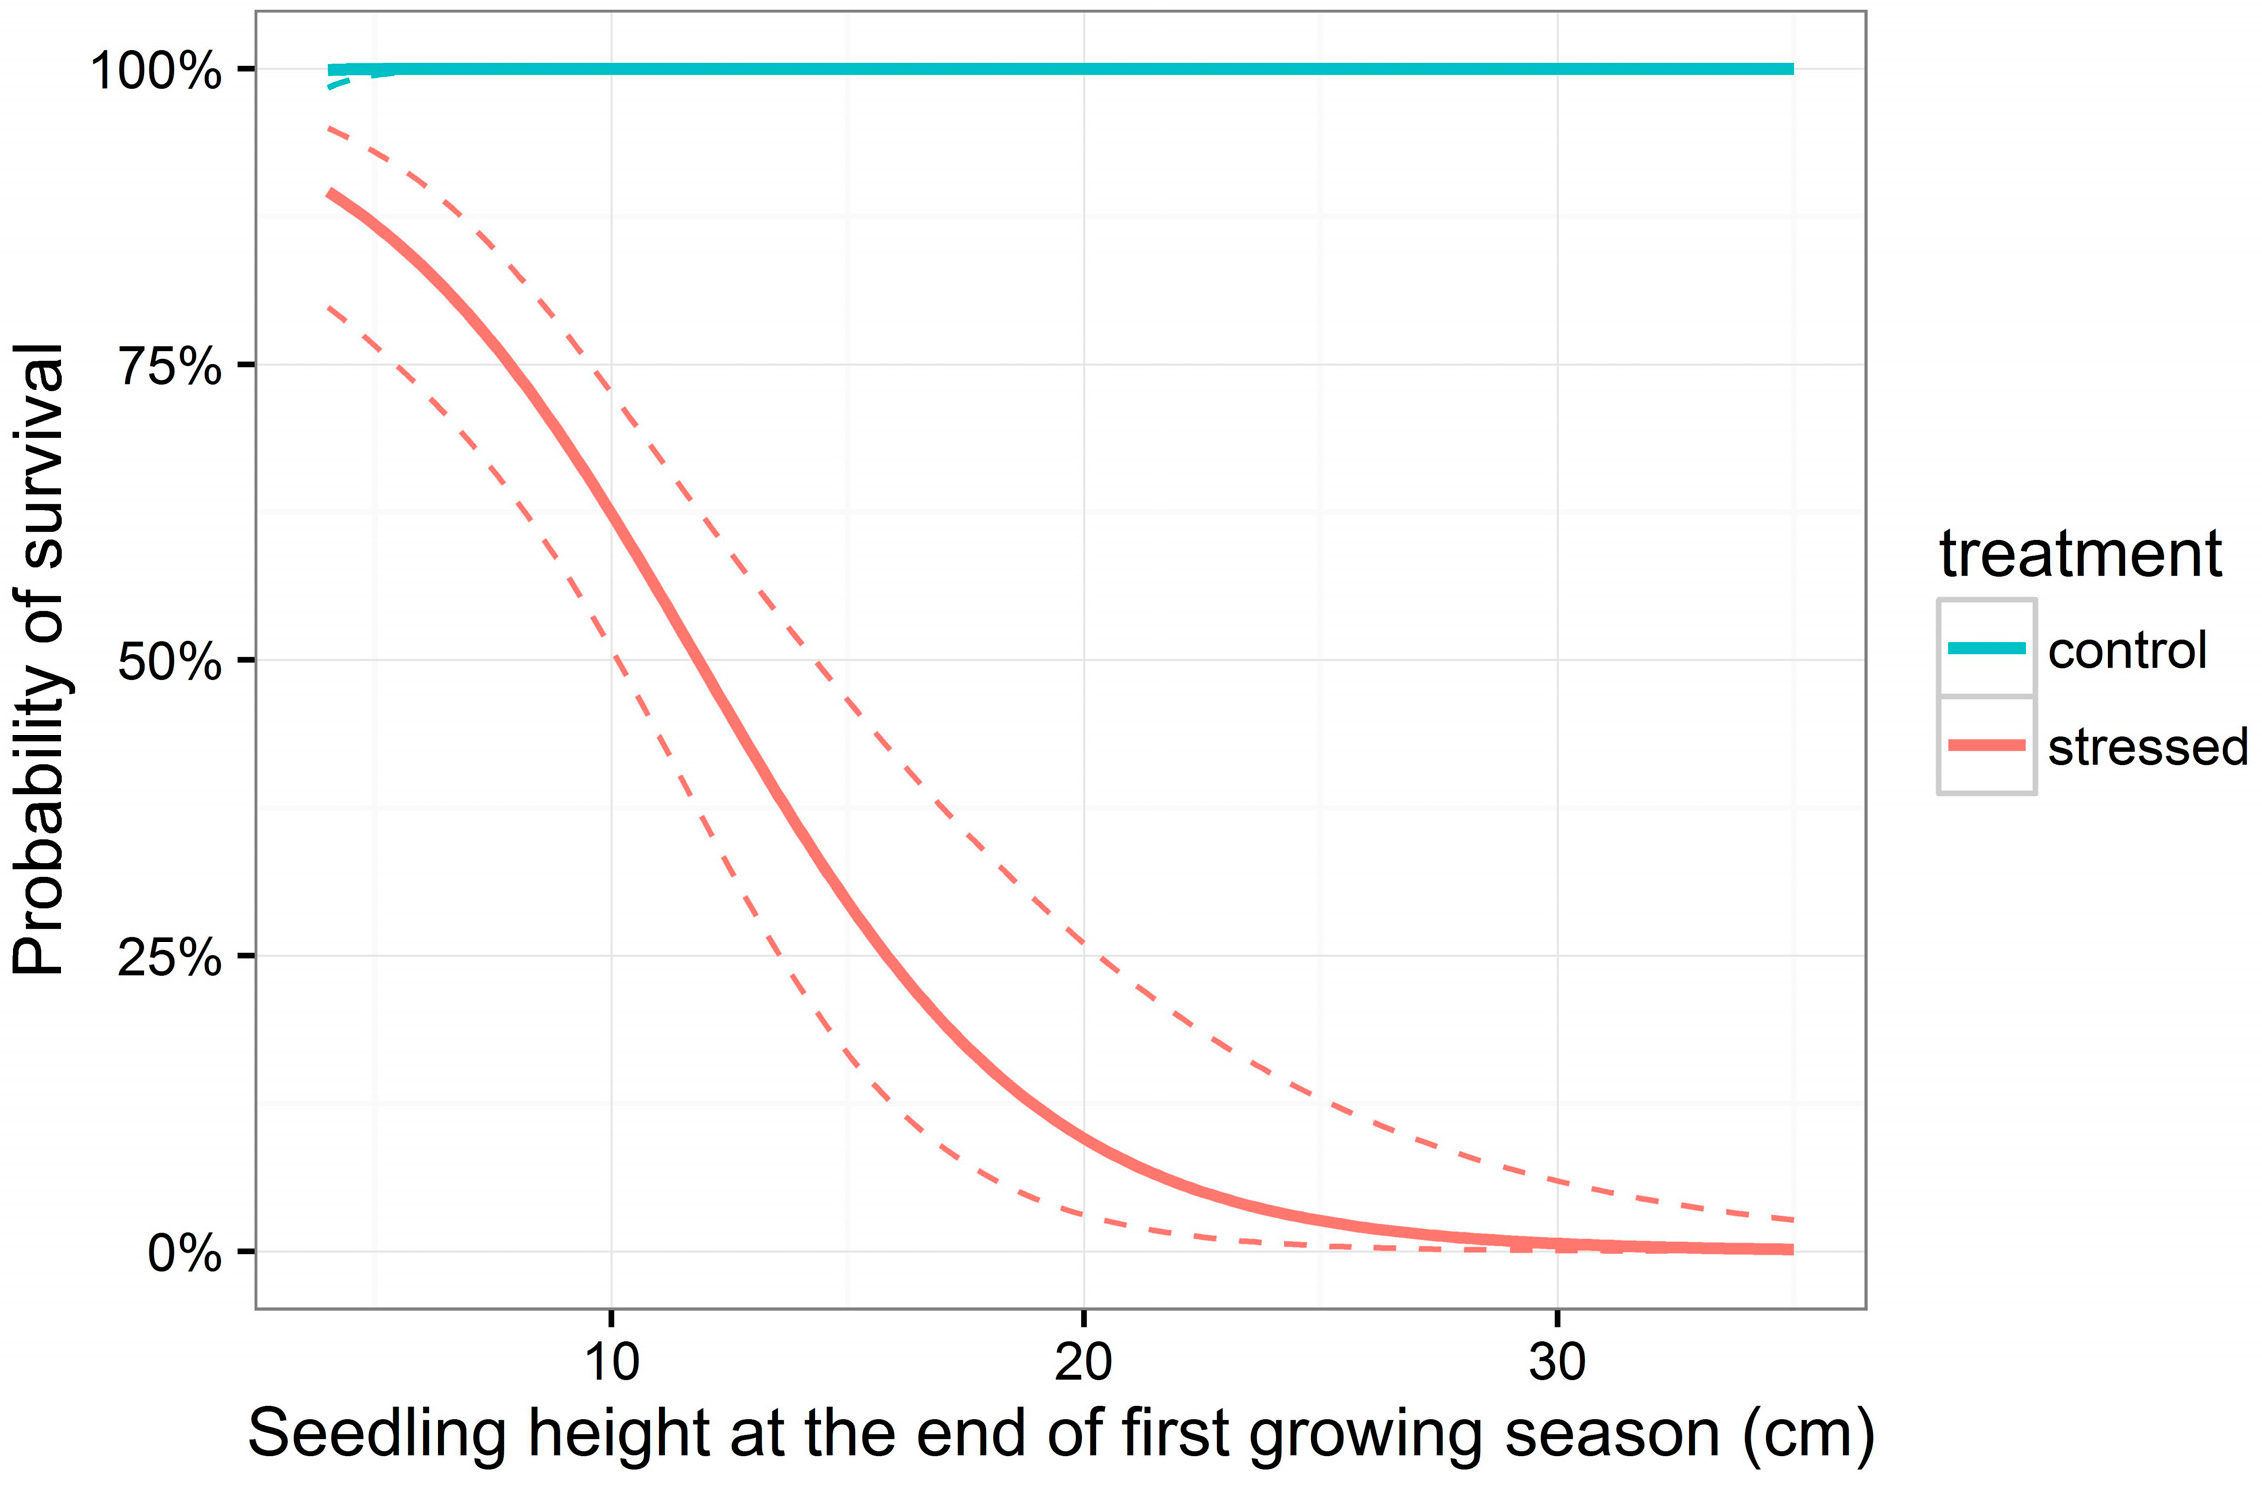
A principal component analysis was applied on the four morphological leaf traits of the seedlings to control the identification of the mother trees in the field. The first principal component discriminates the parental species Q. robur and Q. petraea mainly based on the length of the leaf petiole (PL) and the presence or absence of leaf ears at the lamina base (LE) (Figures S3 and S4; Table S3). Offspring of the two types of intermediates (short-stalked and long-stalked individuals) show a tendency to deviate from the parental species. The second and third PC axes mainly account for the number of intercalary veins and display less discriminating power between the different sampled oak taxa. The majority of the seedlings displayed a petiole length (PL) and a leaf lamina base (LE) that matched the expected petiole length according to the mother tree (Table S4). The small amount of seedlings that did not coincide could concern first-generation hybrids, as sourced mother trees were open-pollinated.

3.2. Survival

At the end of the first drought period, only 1% of the seedlings in the treated group showed wilting and/or curling of the leaves, and no seedlings had died among the treated plants nor in the control group (Figure S1). The second drought period lasted until a larger number of plants (43%) showed wilting and/or curling of the leaves (Figure S2) and started dying off (Table 1). The taxon of the mother tree was not significant in the survival model. Survival depended quite evidently on the weight loss of the pots at the end of the second drought period. The height of the seedlings at the end of the first growing season was an influencing trait, depending on the adjusted relative extractable water (significant interaction term; Table 2). The taller the seedlings, the greater the probability to die off in the drought-exposed group of plants (Figure 1 and Table 2).

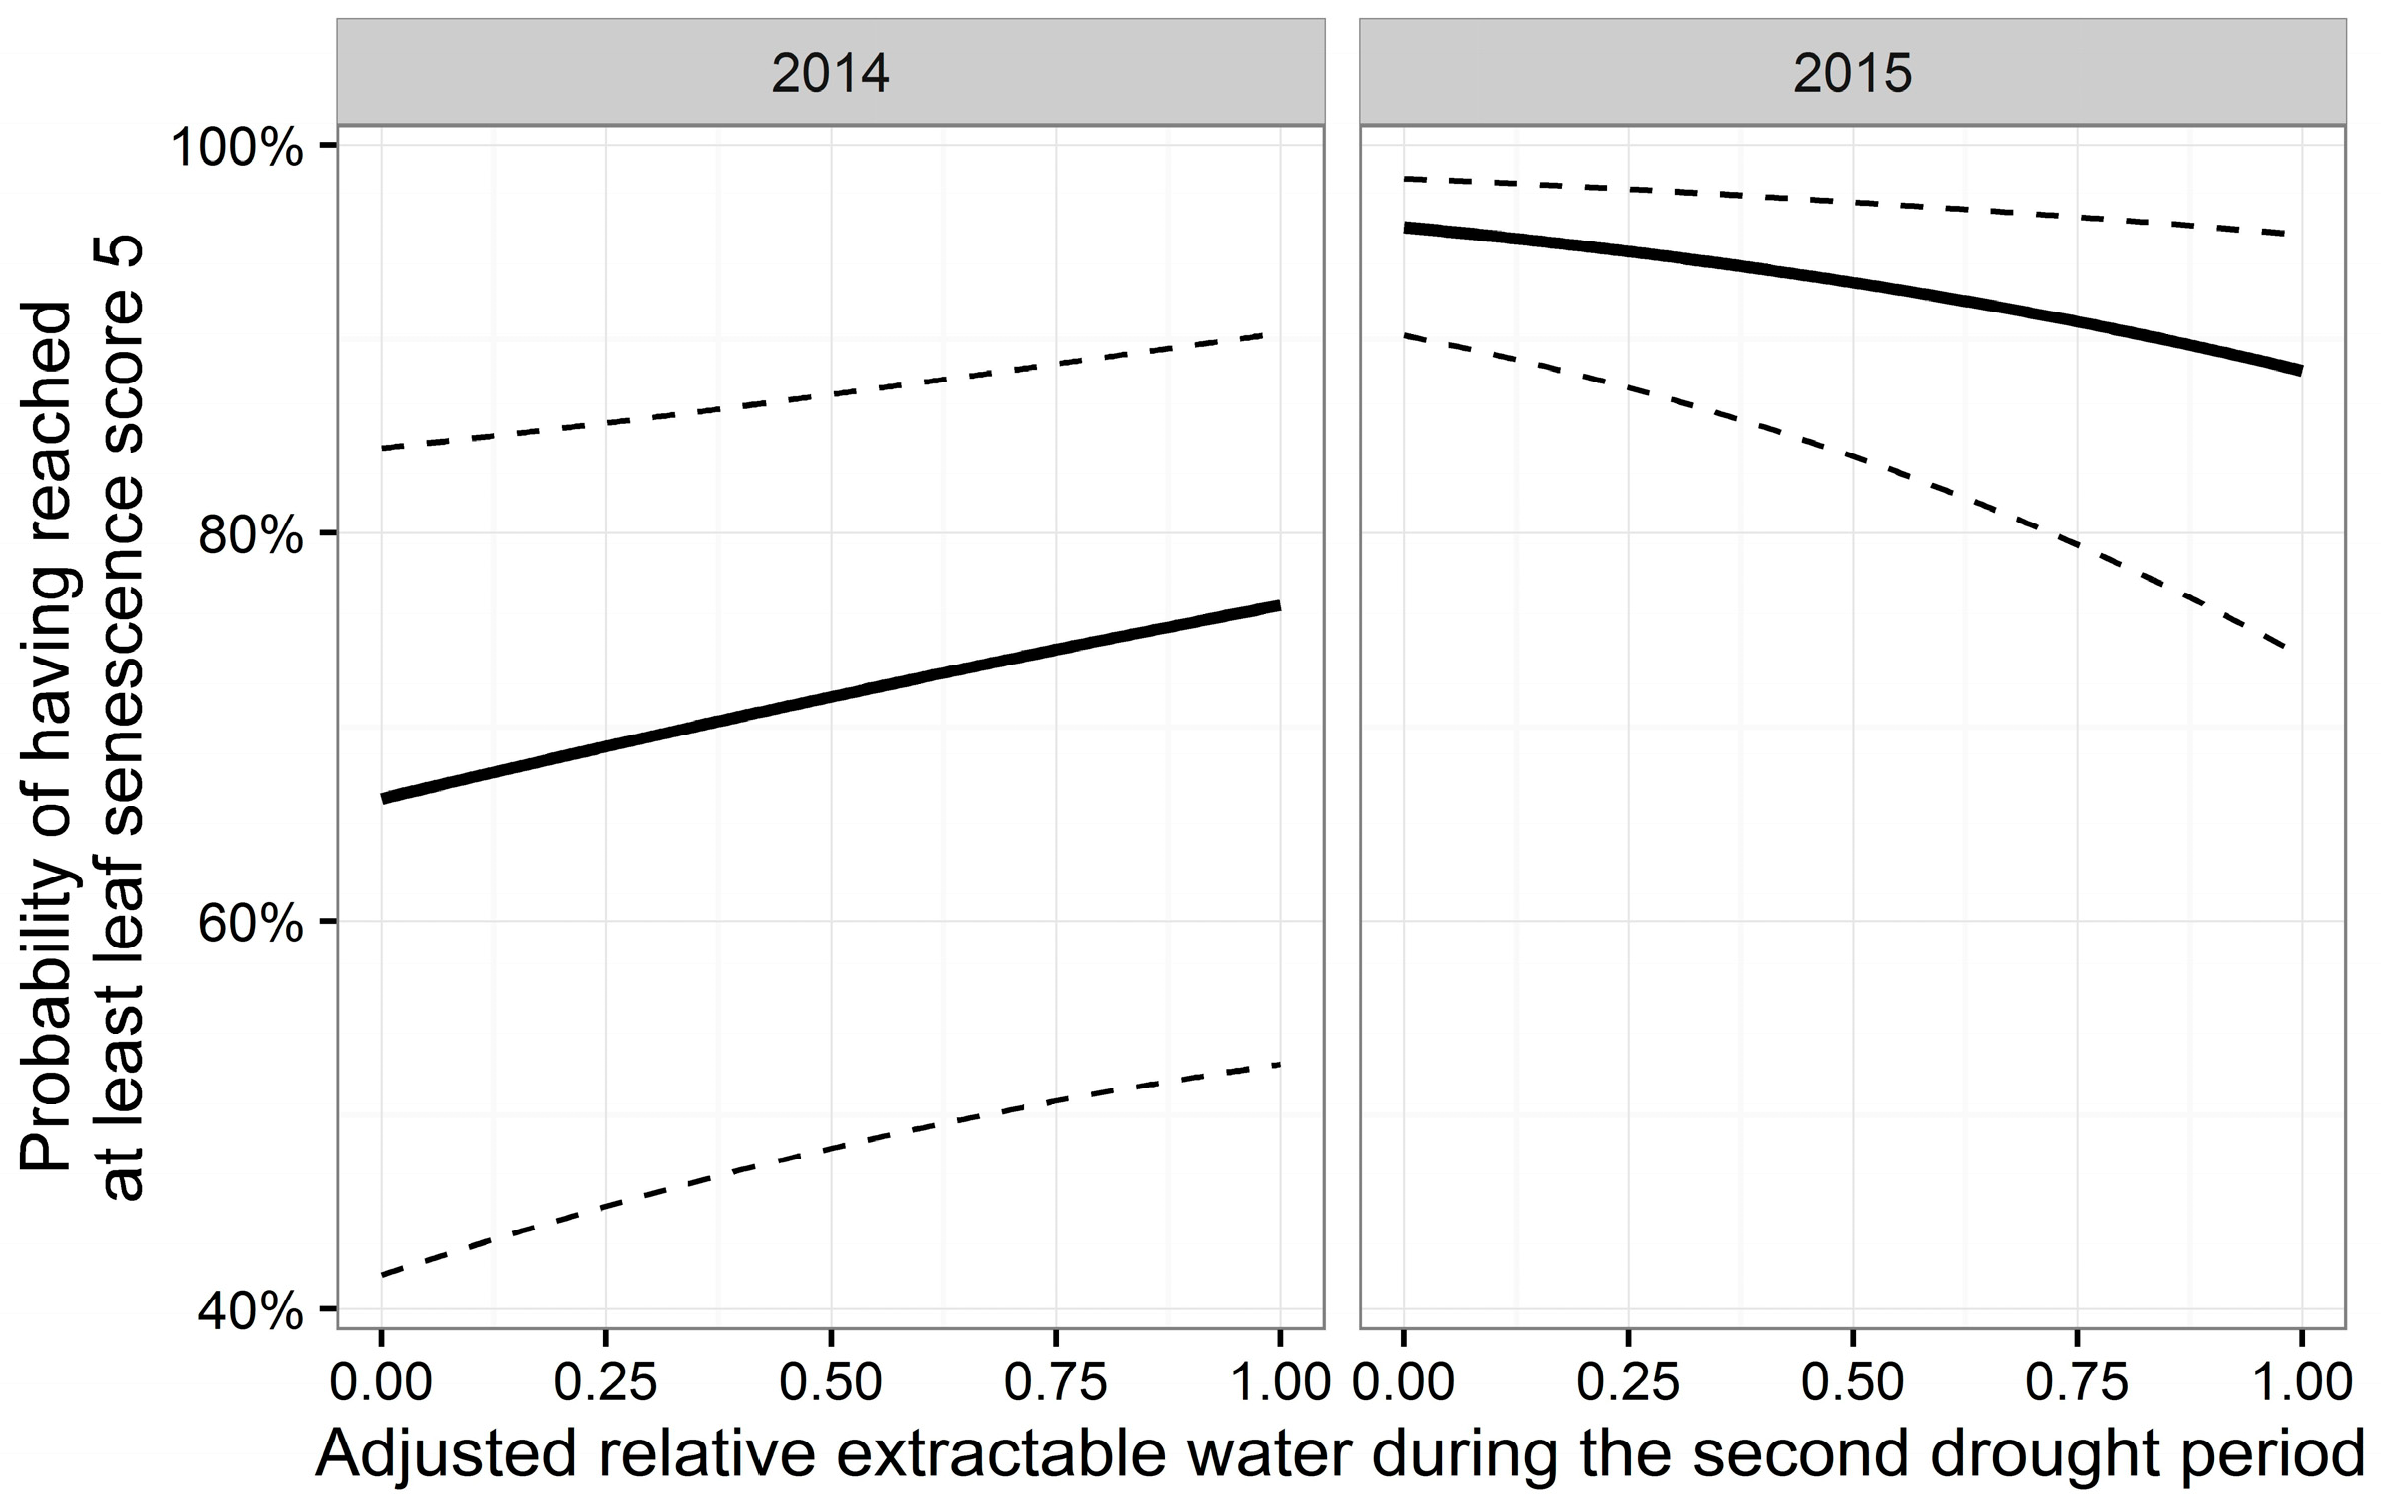
3.3. Leaf Senescence
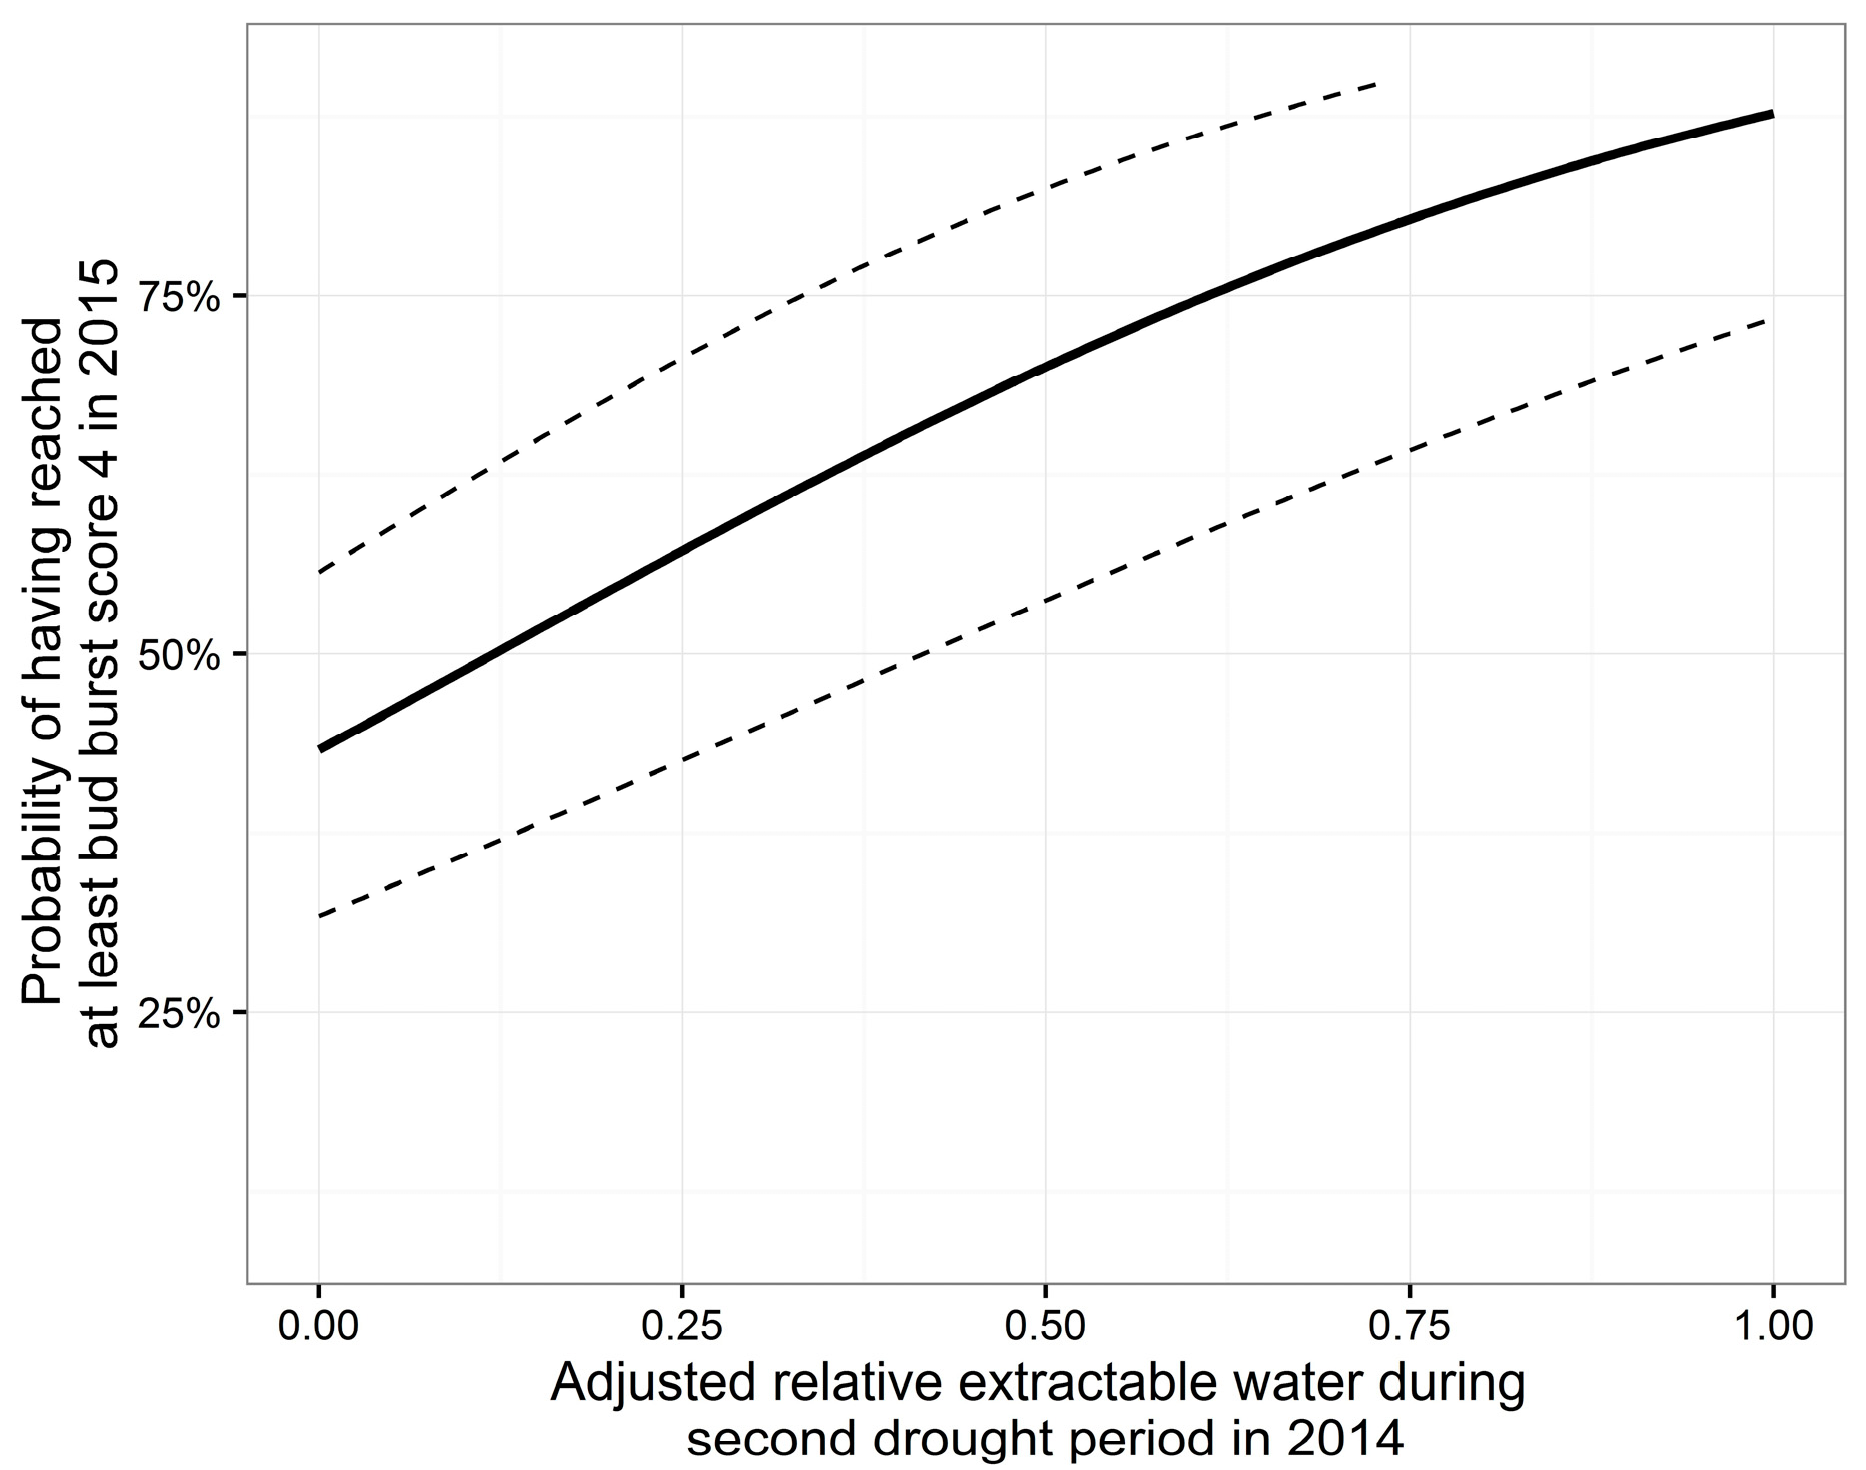
In the phenological model describing leaf senescence, the taxon of the mother tree was not significant (with or without interaction term with adjusted relative extractable water), whereas the height of the seedlings was significant without interaction term with adjusted relative extractable water (Table 3). Leaf senescence appeared earlier in the taller seedlings, independent of the drought treatment (thus, both in the control group and in the drought-exposed seedlings). The interaction term between year of observation and the adjusted relative extractable water was significant in the model, indicating that the senescence response in 2014 differed from 2015 depending on the amount of weight loss in the pots during the drought period in 2014 (Table 3). A more severe drought period, as expressed by a low adjusted relative extractable water, retarded the decolouration of the leaves in 2014 and advanced the decolouration in 2015 (Figure 2).

3.4. Bud Burst

Modelling the phenological variable bud burst revealed that the taxon of the mother tree was not significant. The only significant influence was the adjusted relative extractable water of the pots during the second drought treatment in the first growing season (2014), indicating that the drought-exposed group of plants burst buds later compared to the control group (Figure 3 and Table 3). Next to the taxon of the mother tree, plant height displayed no significant explanatory power (with or without interaction term with adjusted relative extractable water).

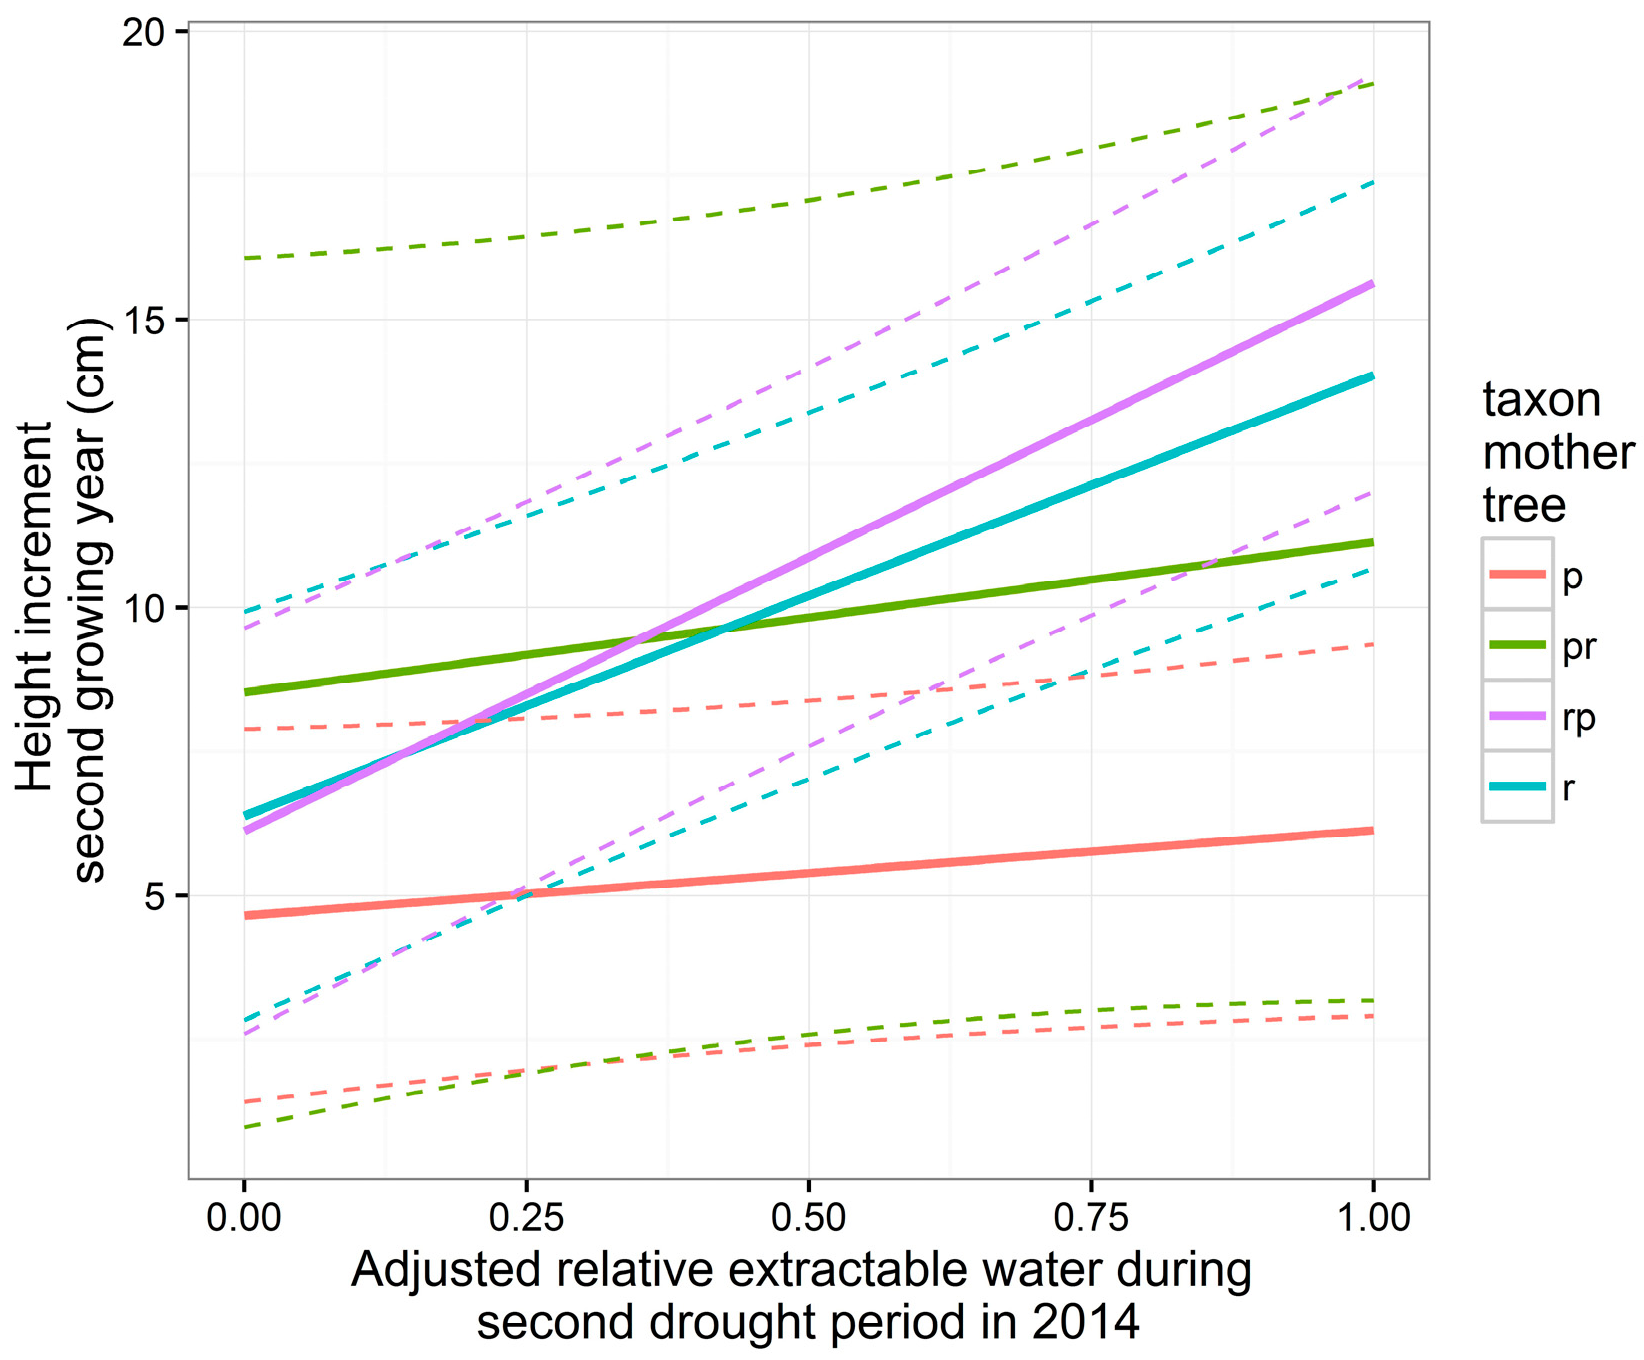
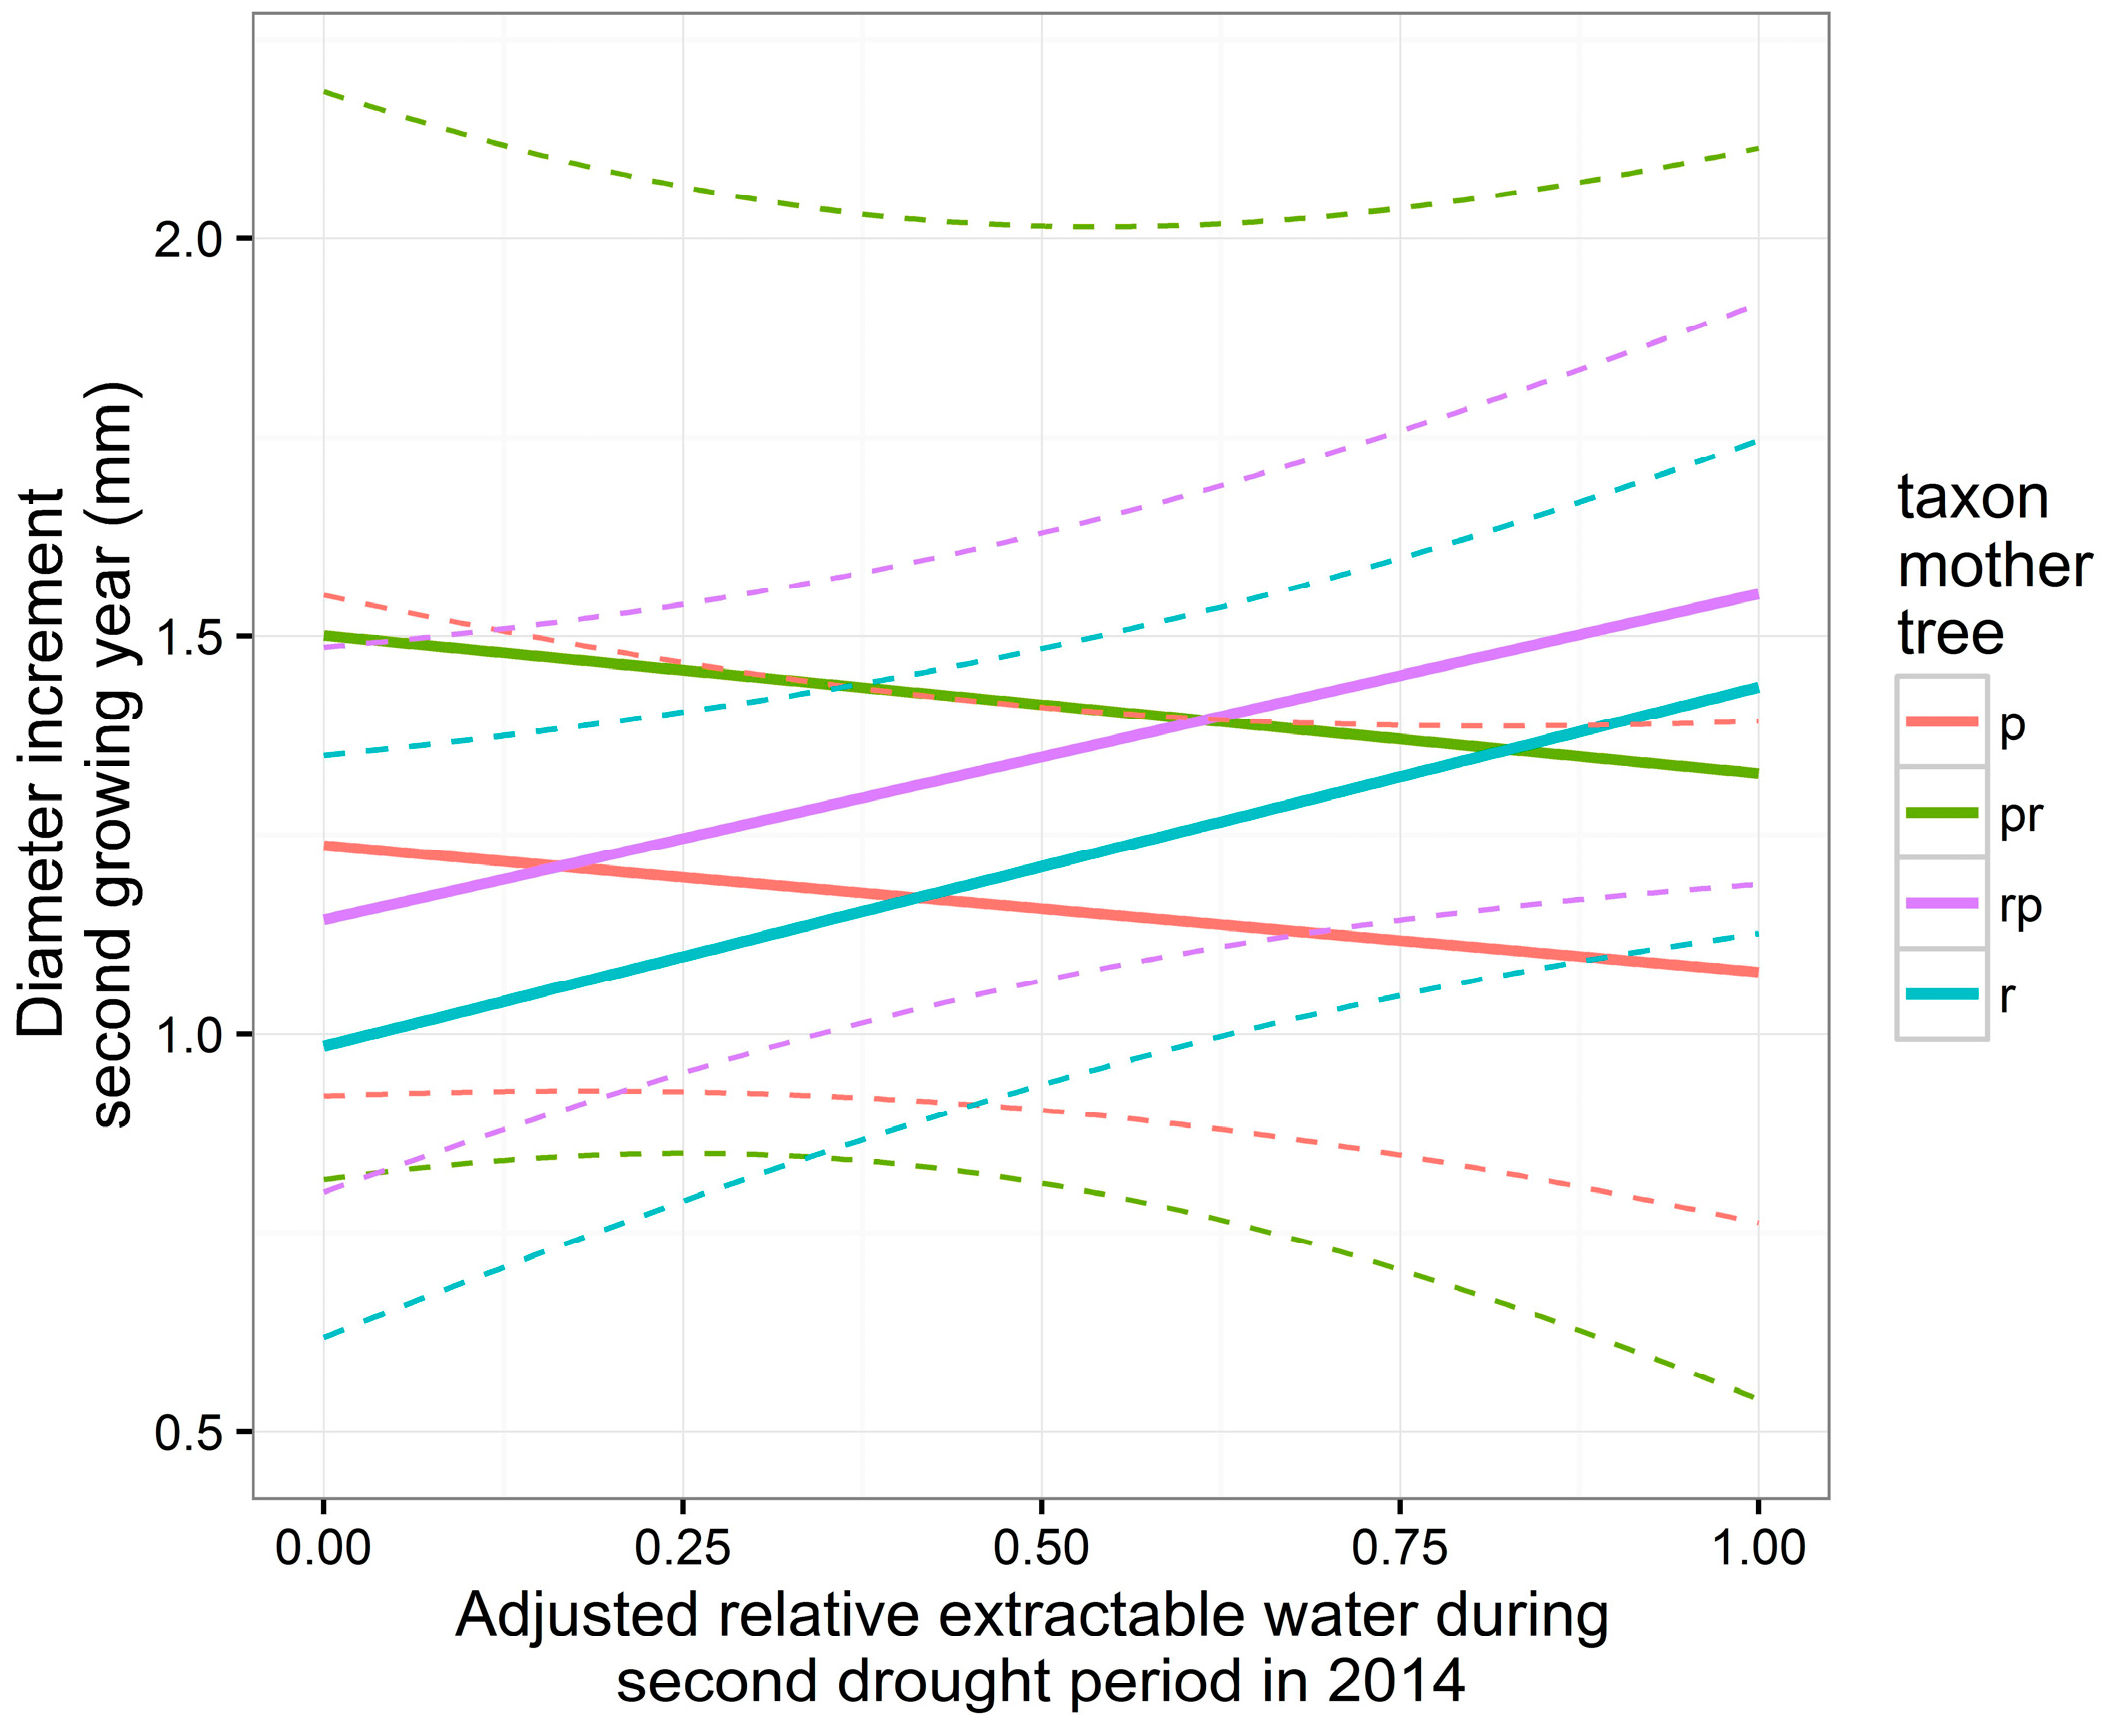
3.5. Height and Diameter Growth in the Second Growing Year

Total plant height and stem diameter growth in the two growing seasons are shown in Figures S5 and S6. In the height growth model, the covariable taxon of the mother tree appeared significant in interaction with adjusted relative extractable water of the pots during the second drought treatment of 2014 (Table 4), indicating that the reduction in height growth in 2015 in comparison to the control group (and thus due to the water deficit in 2014) depended on the taxon of the mother tree. Seedlings from Q. robur and short-stalked intermediates showed a stronger decrease in height growth due to the drought treatment than the seedlings from Q. petraea and the long-stalked intermediate (Figure 4). In addition to the taxon of the mother tree, the height at the end of the growing season in 2014 was significant in the height model, independent of the weight loss of the pots during the second drought period in 2014 (Figure 4 and Table 4), showing that the taller plants displayed a larger height growth in the second growing season. The taxon of the mother tree was analogously significant in the model of the diameter growth in the second growing season, also in interaction with the weight loss of the pots (Figure 5 and Table 4) but independent of the height of the seedlings at the end of the growing season in 2014.

3.6. Variance Components

To assess the influence of the individual mother trees in the analysis, variance components were calculated (Table 5). Taxon of the mother tree was not significant in the models with response variables survival, bud burst, and leaf senescence. This was reflected in the low levels of variance attributed to the taxon of the mother tree in comparison to the individual mother tree (individual mother tree nested within taxon of the mother tree). The models for height and diameter growth in the second growing season allowed an additional comparison with variance attributable to the individual seedlings (the residual variance). In both models, the largest part of the variance was attributable to variability among individual seedlings, being more pronounced in the diameter model. For the height model, the variance component attributable to the variation among individual mother trees was roughly double the variance component of the taxon of the mother tree and roughly half of the variance attributable to the variation among the seedlings. In the diameter model, this variance component of the individual mother trees was roughly 12 times the variance component of the taxon of the mother trees, and about 1/9th of the variance attributable to variation among individual seedlings.

4. Discussion

4.1. Taxon-Independent Responses to Drought

Q. petraea is regarded as more drought-tolerant than Q. robur [25,26,27]. Still, in our experiment survival of the seedlings after a period of water limitation appeared independent of the taxon of the mother tree when taking into account the height of the seedlings (taller seedlings have a higher number of leaves, leading to a higher evaporation). This indicates that under life-threatening stress caused by drought, equally sized seedlings of both species and their intermediate morphological forms likely die off at the same rate. This observation is not in accordance with Vivin, Aussenac, and Levy [41], describing a higher mortality rate among Q. robur upon water deficit. There is no indication of the provenances used in this study. Possibly, the observed deviating responses between the two species may (partly) be due to different provenances rather than due to the different taxa. Different groups of neutral Simple Sequence Repeats (SSR) have been identified that either discriminate between species or between provenances, indicating that provenance is not merely a type of taxon [42]. In our case, the mother trees from the different taxa belong to the same natural population. The delayed leaf senescence upon re-watering after a severe water deficit, the delayed subsequent bud burst, and the advanced leaf senescence in the following growing year were found both in the here-described experiment with offspring of Q. petraea, Q. robur, and morphological intermediates, as well as for different provenances of Q. petraea [18,43]. For the different taxa sourced in the same provenance (here-described experiment), no dependency on the taxon of the mother tree could be detected, whereas phenological responses in a similar experiment with different provenances of Q. petraea were dependent on the provenance [18]. These dissimilar responses for the provenance and taxon can likely be related to recent genomic findings. Provenance-specific and taxon-specific loci have been discovered in the genomes of Q. robur and Q. petraea, with “species discriminant” loci representing genome regions affected by directional selection maintaining species’ identity, and “provenance-specific” loci representing genome regions with high interspecific gene flow and common adaptive patterns (e.g., phenological responses) to local growth environment [42]. The delayed leaf senescence is suggested to be caused by a compensation time upon re-watering after a severe drought in which physiological repair mechanisms act before the seedlings enter the next developmental phenological phase [18]. The observed reduction in height growth in the second growing season likely caused an earlier growth stop, resulting in an advanced leaf senescence in this year.

4.2. Taxon-Dependent Responses to Drought

Drought stress causes a reduction in tree stem growth. Büsgen et al. [44] describe that the summer drought of short duration in Germany may seriously reduce the height growth of spruce and other tree species and, in addition, that repeated summer droughts may diminish stem growth for decades, leading to enormous losses of increment. Drought-exposed saplings of Q. robur and Q. petraea display a reduced secondary growth and adjust their xylem wood-anatomical structure to improve resistance and repairing abilities after cavitation [45]. This supports the hypothesis that carbon allocation attributes lowest priority to stem growth under stress [46]. This allows woody plants to redirect assimilates and energy otherwise used for shoot growth to maintain respiration, to stimulate root growth, or to favour other protective adjustments. Additionally, increased energy storage in the xylem parenchyma cells is believed to be induced by drought to repair embolised vessels as soon as the conditions improve [45]. In our experiment, both Q. robur and Q. petraea displayed a reduced height growth in the year succeeding the period of water deficit in comparison to the control group. This carry-over effect on shoot length can simply be explained by an insufficient resource storage for bud formation and growth [47]. Interestingly, compared to the control plants, Q. petraea showed a relatively lesser diminution of height growth in the year succeeding the period of drought than Q. robur (significant interaction terms between taxon of the mother tree and adjusted relative extractable water during drought period in the height model, Table 4), indicating a more stable growth pattern for Q. petraea when confronted with water-limiting growth conditions. This observation is consistent with the fact that Q. petraea withstands more xeric growth conditions compared to Q. robur [25,26,27]. However, it is not in agreement with the findings of Kuster et al. [16], where no difference is reported in shoot elongation, radial stem growth, and shoot biomass production between the two species in a three-year drought experiment. Possibly, the different provenances sourced for both species in this experiment may have faded the influence of taxon. In addition, our observed height growth response that differentiated between Q. robur and Q. petraea could be stronger, taking into account that F1 hybrids may be present in the collected acorns on Q. robur and Q. petraea mother trees. These may have attenuated this result.
The offspring of the short-stalked intermediate mother trees tended to a similar reduction in height growth in 2015 to offspring of Q. robur when compared to the control groups that did not experience water limitation in the preceding growing season. The reduction in height growth of 2015 depended on the adjusted relative extractable water during the drought period, and is visualised in Figure 4 with similar slopes between offspring of Q. robur and offspring of the short-stalked intermediates. On the other hand, the offspring of the long-stalked intermediate mother tree (only one mother tree sampled) behaved similar to the offspring of Q. petraea (also similar slopes between the offspring of Q. petraea and the long-stalked intermediate in Figure 4). This can be partly explained by matroclinal inheritance, at least in the juvenile phase, as has already been observed for juvenile leaf morphology in the offspring of controlled crosses between Q. robur and Q. petraea, with interspecific hybrids displaying leaf morphological features of the mother tree [24]. As we sampled morphological intermediates in a natural population, we have no indication of the number of generations (the number of back crosses) that may have passed since the original (natural) cross between Q. robur and Q. petraea. In this sense, our results may suggest that the more Q. robur is introgressed in the short-stalked intermediates (leaf morphology resembling Q. robur) or the more Q. petraea is introgressed in the long-stalked intermediates (leaf morphology resembling Q. petraea), the more the height growth response of these hybrids upon water deficit may mirror the respective original maternal parental response.
For the diameter growth in 2015, there are relative weak significant interaction terms between the taxa of the mother trees and the adjusted relative extractable water during the drought period in 2014. This means that the offspring from Q. robur and the short-stalked intermediates differ from Q. petraea offspring, with p-values of 0.029 and 0.051, respectively (Table 4). As with height growth, this indicates that the offspring of short-stalked intermediates tend to have a similar response as the offspring of Q. robur, and the offspring of the long-stalked intermediate behave similar to the offspring of Q. petraea. Strangely, a tendency can be observed for an increased diameter growth in 2015, measured at 1 cm above soil level, upon higher pre-drought (lower adjusted relative extractable water in 2014; Figure 5) in the offspring from Q. petraea and the long-stalked intermediate. This is possibly due to an enhanced allocation to root growth, which has been observed in oak upon water deficit [10]. A slightly larger diameter increment at the stem base could therefore be considered as a side-effect of the re-allocation of resources due to the pre-drought period.
The variance component analysis allowed an assessment of the relative importance of the taxon of the mother tree in comparison to the individual mother trees belonging to each taxon (which can be interpreted as the maternal effect) and the individual seedlings belonging to each mother tree. When compared to the height growth in the second growing season, the diameter growth showed more relative variance among the individual seedlings. This suggests that height growth, in comparison to diameter growth, is relatively more influenced by both taxon of the mother tree and the individual mother tree, and relatively less variation resides among the different seedlings.

5. Conclusions

Together, we showed that in pedigrees of a naturally mixed population of Q. robur and Q. petraea in Belgium, the survival rate after a severe drought and phenological responses of the persisting seedlings were independent of the taxon of the mother trees, whereas a taxon-effect was detected for height and diameter growth in the year succeeding the growing season with water limitation. The frequency of extreme climate events will increase [36], and plant responses may differ depending on the timing of these events within the year [48,49]. The impact of drought on perennial herbaceous plant growth and biomass production were found to be the least apparent in spring, possibly due to lower leaf area of the plants and a seasonally differing water potential in the leaves that may not fully reflect the water potential of the soil [49]. In our experiment, the first early summer drought event did not severely impact the plants as visually judged. Still, it possibly aggravated the responses to the second longer lasting drought period that occurred later in the year [4,5]. This growth response upon water limitation may influence the growth dynamics of seedling competition in natural conditions. It is generally known among plant species that in a population where plants compete with each other, larger individuals grow faster than smaller individuals and that initial height differences in trees can build over time as larger individuals pre-empt available light and suppress the growth of smaller neighbours [50,51,52,53]. Complex stand structures and diverse community assemblages can develop from the legacies of small differences in initial size and growth rates between individuals and species [54]. The rate of hybridisation between Q. robur and Q. petraea may augment in the future due to the predicted climate change, which may decrease species clustering and density [55]. As Q. petraea is characterised by stronger post-pollination hybridisation barriers than Q. robur [22,56], it can be expected that in the forest stands in Belgium (and by extension in Europe) which harbour both species, an evolution may occur towards larger amounts of short-stalked intermediate forms. If our observed taxon-specific responses to water deficit in controlled conditions can be extrapolated to field conditions, it can be hypothesised that the composition of oak species and their hybrids in the natural oak forests may alter upon prolonged periods of precipitation deficit, promoting Q. petraea and the long-stalked intermediates. Clearly, longer-term experiments are needed here.

Supplementary Materials

The following are available online at www.mdpi.com/1999-4907/8/11/407/s1. Table S1: Morphological descriptors of fully developed oak leaves on first year seedlings discriminating Q. robur from Q. petraea. Table S2: Description of the score levels of the two phenological response variables leaf senescence and bud burst in oak seedlings. Table S3: Loadings of leaf morphological traits in PCA of the analysed oak seedlings. Abbreviation of traits are in Table S1. Table S4: Number of seedlings (in %) in the different score levels of the two morphological leaf traits petiole length (PL) and leaf ear (LE). Total number of seedlings are in Table 1. Descriptions of score levels are in Table S1. p: Q. petraea. pr: long-stalked intermediate. rp: short-stalked intermediate. r: Q. robur. Figure S1: Average and standard deviation of the weights of the pots in the control and the drought treated group of plants during the first drought period in the first growing year. Percentage of seedlings in the treated group of plants showing wilting and/or curling of the leaves is indicated. p: Q. petraea, pr: long-stalked intermediate, rp: short-stalked intermediate, r: Q. robur. Figure S2: Average and standard deviation of the weights of the pots in the control and the drought treated group of plants during the second drought period in the first growing year. Percentage of seedlings in the treated group of plants showing wilting and/or curling of the leaves is indicated. p: Q. petraea, pr: long-stalked intermediate, rp: short-stalked intermediate, r: Q. robur. Figure S3: Biplots of a Principal Components Analysis on leaf morphological traits of oak seedlings. Seedlings are coloured according to the field identification of the mother trees that was based on both leaf and infructescence traits. p: Q. petraea, pr: long-stalked intermediate, rp: short-stalked intermediate, r: Q. robur. Abbreviation of traits are in Table S1. Figure S4: Principal components on leaf morphological traits of oak seedlings in relation to the field identification of the mother trees that was based on both leaf and infructescence traits. p: Q. petraea, pr: long-stalked intermediate, rp: short-stalked intermediate, r: Q. robur. Figure S5: Height growth in the two growing seasons 2014 and 2015 for both the control and the stressed group of plants. p: Q. petraea, pr: long-stalked intermediate, rp: short-stalked intermediate, r: Q. robur. Figure S6: Diameter growth in the two growing seasons 2014 and 2015 for both the control and the stressed group of plants. p: Q. petraea, pr: long-stalked intermediate, rp: short-stalked intermediate, r: Q. robur. Table S5: Basic data.

Acknowledgments

In the first place, we like to thank Stefaan Moreels for the elaborate and meticulous nursery work and indispensable help during the measurements and observations. We thank Ghislain Mees, Marc Missoorten and Eddy Hubrechts from the Agency for Nature and Forest for facilitating the seed collections. We also thank the COST FP1106 network Studying Tree Responses to Extreme Events: A Synthesis (STReESS) for the short-term scientific mission granted to AT, and the ERASMUS exchange program for funding. We are grateful to Pieter Verschelde for help with the Principal Components Analysis.

Author Contributions

K.V.M., A.T., M.S., K.S., B.V.d.A. and S.M. conceived of and supervised the whole study, while A.T., K.V.M., J.M. and N.D. collected the seedlings and conducted the measurements and observations on the seedlings. A.T., J.M. and N.D. were responsible for the weight loss and height/diameter measurements. A.T., J.M. and N.D. observed the leaf senescence. K.V.M. observed the bud burst. K.V.M., A.T., J.M., B.V.d.A. and N.D. performed the statistical analyses. All authors (K.V.M., A.T., J.M., N.D., S.M., M.S., K.S., B.V.d.A.) contributed substantially to the manuscript preparation.

Conflicts of Interest

The authors declare no conflict of interest.

References

  1. Lindner, M.; Fitzgerald, J.B.; Zimmermann, N.E.; Reyer, C.; Delzon, S.; van der Maaten, E.; Schelhaas, M.J.; Lasch, P.; Eggers, J.; van der Maaten-Theunissen, M.; et al. Climate change and european forests: What do we know, what are the uncertainties, and what are the implications for forest management? J. Environ. Manag. 2014, 146, 69–83. [Google Scholar] [CrossRef] [PubMed]
  2. Intergovernmental Panel on Climate Change (IPCC). Climate Change 2014; Synthesis Report; Contribution of Working Groups I, II and III to the Fifth Assessment Report of the Intergovernmental Panel on Climate Change; Intergovernmental Panel on Climate Change (IPCC): Geneva, Switzerland, 2014. [Google Scholar]
  3. Anderegg, W.R.L.; Berry, J.A.; Field, C.B. Linking definitions, mechanisms, and modeling of drought-induced tree death. Trends Plant Sci. 2012, 17, 693–700. [Google Scholar] [CrossRef] [PubMed]
  4. Scheffer, M.; Carpenter, S.; Foley, J.A.; Folke, C.; Walker, B. Catastrophic shifts in ecosystems. Nature 2001, 413, 591–596. [Google Scholar] [CrossRef] [PubMed]
  5. Benigno, S.M.; Dixon, K.W.; Stevens, J.C. Seedling mortality during biphasic drought in sandy mediterranean soils. Funct. Plant Biol. 2014, 41, 1239–1248. [Google Scholar] [CrossRef]
  6. Niinemets, U. Responses of forest trees to single and multiple environmental stresses from seedlings to mature plants: Past stress history, stress interactions, tolerance and acclimation. For. Ecol. Manag. 2010, 260, 1623–1639. [Google Scholar] [CrossRef]
  7. Psidova, E.; Ditmarova, L.; Jamnicka, G.; Kurjak, D.; Majerova, J.; Czajkowski, T.; Bolte, A. Photosynthetic response of beech seedlings of different origin to water deficit. Photosynthetica 2015, 53, 187–194. [Google Scholar] [CrossRef]
  8. Leuschner, C.; Backes, K.; Hertel, D.; Schipka, F.; Schmitt, U.; Terborg, O.; Runge, M. Drought responses at leaf, stem and fine root levels of competitive Fagus sylvatica L. and Quercus petraea (Matt.) Liebl. trees in dry and wet years. For. Ecol. Manag. 2001, 149, 33–46. [Google Scholar] [CrossRef]
  9. Broadmeadow, M.S.J.; Jackson, S.B. Growth responses of Quercus petraea, Fraxinus excelsior and Pinus sylvestris to elevated carbon dioxide, ozone and water supply. New Phytol. 2000, 146, 437–451. [Google Scholar] [CrossRef]
  10. Thomas, F.M.; Gausling, T. Morphological and physiological responses of oak seedlings (Quercus petraea and Q. robur) to moderate drought. Ann. For. Sci. 2000, 57, 325–333. [Google Scholar] [CrossRef]
  11. Arend, M.; Kuster, T.; Gunthardt-Goerg, M.S.; Dobbertin, M. Provenance-specific growth responses to drought and air warming in three european oak species (Quercus robur, Q. petraea and Q. pubescens). Tree Physiol. 2011, 31, 287–297. [Google Scholar] [CrossRef] [PubMed]
  12. Spiess, N.; Oufir, M.; Matusikova, I.; Stierschneider, M.; Kopecky, D.; Homolka, A.; Burg, K.; Fluch, S.; Hausman, J.F.; Wilhelm, E. Ecophysiological and transcriptomic responses of oak (Quercus robur) to long-term drought exposure and rewatering. Environ. Exp. Bot. 2012, 77, 117–126. [Google Scholar] [CrossRef]
  13. Kuster, T.M.; Arend, M.; Gunthardt-Goerg, M.S.; Schulin, R. Root growth of different oak provenances in two soils under drought stress and air warming conditions. Plant Soil 2013, 369, 61–71. [Google Scholar] [CrossRef]
  14. Jensen, J.S.; Hansen, J.K. Genetic variation in responses to different soil water treatments in Quercus robur L. Scand. J. For. Res. 2010, 25, 400–411. [Google Scholar] [CrossRef]
  15. Pflug, E.E.; Siegwolf, R.; Buchmann, N.; Dobbertin, M.; Kuster, T.M.; Gunthardt-Goerg, M.S.; Arend, M. Growth cessation uncouples isotopic signals in leaves and tree rings of drought-exposed oak trees. Tree Physiol. 2015, 35, 1095–1105. [Google Scholar] [CrossRef] [PubMed]
  16. Kuster, T.M.; Dobbertin, M.; Gunthardt-Goerg, M.S.; Schaub, M.; Arend, M. A phenological timetable of oak growth under experimental drought and air warming. PLoS ONE 2014, 9, e89724. [Google Scholar] [CrossRef] [PubMed]
  17. Turcsán, A.; Steppe, K.; Sárközi, E.; Erdélyi, É.; Missoorten, M.; Mees, G.; Vander Mijnsbrugge, K. Early summer drought stress during the first growing year stimulates extra shoot growth in oak seedlings (Quercus petraea). Front. Plant Sci. 2016, 7. [Google Scholar] [CrossRef] [PubMed]
  18. Vander Mijnsbrugge, K.; Turcsan, A.; Maes, J.; Duchene, N.; Meeus, S.; Steppe, K.; Steenackers, M. Repeated summer drought and re-watering during the first growing year of oak (Quercus petraea) delay autumn senescence and bud burst in the following spring. Front. Plant Sci. 2016, 7. [Google Scholar] [CrossRef] [PubMed]
  19. Ducousso, A.; Bordacs, S. Euforgen Technical Guidelines for Genetic Conservation and Use for Pedunculate and Sessile Oaks (Quercus robur and Q. petraea); International Plant Genetic Resources Institute: Rome, Italy, 2004. [Google Scholar]
  20. Vander Mijnsbrugge, K.; De Cleene, L.; Beeckman, H. A combination of fruit and leaf morphology enables taxonomic classification of the complex Q. robur L.—Q. x rosacea Bechst.—Q. petraea (Matt.) Liebl. in autochthonous stands in flanders. Silvae Genet. 2011, 60, 139–148. [Google Scholar] [CrossRef]
  21. Bacilieri, R.; Ducousso, A.; Petit, R.J.; Kremer, A. Mating system and asymmetric hybridization in a mixed stand of european oaks. Evolution 1996, 50, 900–908. [Google Scholar] [CrossRef] [PubMed]
  22. Lepais, O.; Petit, R.J.; Guichoux, E.; Lavabre, J.E.; Alberto, F.; Kremer, A.; Gerber, S. Species relative abundance and direction of introgression in oaks. Mol. Ecol. 2009, 18, 2228–2242. [Google Scholar] [CrossRef] [PubMed]
  23. Stebbins, G.L. Variation and Evolution in Plants; Columbia University Press: New York, NY, USA, 1950. [Google Scholar]
  24. Kleinschmit, J.R.G.; Bacilieri, R.; Kremer, A.; Roloff, A. Comparison of morphological and genetic traits of pedunculate oak (Q. robur L.) and sessile oak (Q. petraea (Matt) Liebl). Silvae Genet. 1995, 44, 256–269. [Google Scholar]
  25. Cochard, H.; Breda, N.; Granier, A.; Aussenac, G. Vulnerability to air-embolism of 3 european oak species (Quercus petraea (Matt) Liebl, Quercus pubescens Willd, Quercus robur L.). Ann. Sci. For. 1992, 49, 225–233. [Google Scholar] [CrossRef]
  26. Ponton, S.; Dupouey, J.L.; Breda, N.; Feuillat, F.; Bodenes, C.; Dreyer, E. Carbon isotope discrimination and wood anatomy variations in mixed stands of Quercus robur and Quercus petraea. Plant Cell Environ. 2001, 24, 861–868. [Google Scholar] [CrossRef]
  27. Le Provost, G.; Sulmon, C.; Frigerio, J.M.; Bodenes, C.; Kremer, A.; Plomion, C. Role of waterlogging-responsive genes in shaping interspecific differentiation between two sympatric oak species. Tree Physiol. 2012, 32, 119–134. [Google Scholar] [CrossRef] [PubMed]
  28. Bacilieri, R.; Ducousso, A.; Kremer, A. Genetic, morphological, ecological and phenological differentiation between Quercus petraea (Matt.) Liebl. and Quercus robur L. in a mixed stand of northwest of France. Sylvae Genet. 1995, 44, 1–10. [Google Scholar]
  29. Saintagne, C.; Bodénès, C.; Barreneche, T.; Pot, D.; Plomion, C.; Kremer, A. Distribution of genomic regions differentiating oak species assessed by QTL detection. Heredity 2004, 92, 20–30. [Google Scholar] [CrossRef] [PubMed]
  30. Rellstab, C.; Bühler, A.; Graf, R.; Folly, C.; Gugerli, F. Using joint multivariate analyses of leaf morphology and molecular-genetic markers for taxon identification in three hybridizing European white oak species (Quercus spp.). Ann. For. Sci. 2016, 73, 669–679. [Google Scholar] [CrossRef]
  31. Curtu, A.; Gailing, O.; Finkeldey, R. Patterns of contemporary hybridization inferred from paternity analysis in a four-oak-species forest. BMC Evolut. Biol. 2007, 9. [Google Scholar] [CrossRef] [PubMed]
  32. Gugerli, F.; Walser, J.; Dounavi, K.; Holderegger, R.; Finkeldey, R. Coincidence of small-scale spatial discontinuities in leaf morphology and nuclear microsatellite variation of Quercus petraea and Q. robur in a mixed forest. Ann. Bot. 2007, 99, 713–722. [Google Scholar] [CrossRef] [PubMed]
  33. Kremer, A.; Dupouey, J.L.; Deans, J.D.; Cottrell, J.; Csaikl, U.; Finkeldey, R.; Espinel, S.; Jensen, J.; Kleinschmit, J.; Van Dam, B.; et al. Leaf morphological differentiation between Quercus robur and Quercus petraea is stable across western European mixed oak stands. Ann. For. Sci. 2002, 59, 777–787. [Google Scholar] [CrossRef]
  34. Vander Mijnsbrugge, K.; Cox, K.; Van Slycken, J. Conservation approaches for autochthonous woody plants in flanders. Silvae Genet. 2005, 54, 197–206. [Google Scholar] [CrossRef]
  35. Vander Mijnsbrugge, K.; Coart, E.; Beeckman, H.; Van Slycken, J. Conservation measures for autochthonous oaks in flanders. For. Genet. 2003, 10, 207–217. [Google Scholar]
  36. Brouwers, J.; Peeters, B.; Van Steertegem, M.; van Lipzig, N.; Wouters, H.; Beullens, J.; Demuzere, M.; Willems, P.; De Ridder, K.; Maiheu, B.; et al. Mira Climate Report 2015: About Observed and Future Climate Changes in Flanders and Belgium; Flanders Environment Agency: Aalst, Belgium, 2015. [Google Scholar]
  37. Boratynski, A.; Marcysiak, K.; Lewandowska, A.; Jasinska, A.; Iszkulo, G.; Burczyk, J. Differences in leaf morphology between Quercus petraea and Q. robur adult and young individuals. Silva Fenn. 2008, 42, 115–124. [Google Scholar] [CrossRef]
  38. R Core Team. R: A Language and Environment for Statistical Computing; R Foundation for Statistical Computing: Vienna, Austria, 2014. [Google Scholar]
  39. Bates, D.; Machler, M.; Bolker, B.M.; Walker, S.C. Fitting linear mixed-effects models using lme4. J. Stat. Softw. 2015, 67, 1–48. [Google Scholar] [CrossRef]
  40. Christensen, R.H.B. Ordinal: Regression Models for Ordinal Data. R Package Version 2013.10–31. 2013. Available online: http://www.Cran.R-project.Org/package=ordinal/ (accessed on 3 July 2015).
  41. Vivin, P.; Aussenac, G.; Levy, G. Differences in drought resistance among 3 deciduous oak species grown in large boxes. Ann. Sci. For. 1993, 50, 221–233. [Google Scholar] [CrossRef]
  42. Neophytou, C.; Aravanopoulos, F.A.; Fink, S.; Dounavi, A. Detecting interspecific and geographic differentiation patterns in two interfertile oak species (Quercus petraea (Matt.) Liebl. and Q. robur L.) using small sets of microsatellite markers. For. Ecol. Manag. 2010, 259, 2026–2035. [Google Scholar] [CrossRef]
  43. Vander Mijnsbrugge, K.; Turcsan, A.; Maes, J.; Duchene, N.; Meeus, S.; Steppe, K.; Steenackers, M. Research Institute for Nature and Forest, Geraardsbergen, Belgium. Unpublished work. 2016. [Google Scholar]
  44. Büsgen, M.; Münch, E.; Thomson, T. The Structure and Life of Forest Trees; Chapman and Hall: London, UK, 1929. [Google Scholar]
  45. Fonti, P.; Heller, O.; Cherubini, P.; Rigling, A.; Arend, M. Wood anatomical responses of oak saplings exposed to air warming and soil drought. Plant Biol. 2013, 15, 210–219. [Google Scholar] [CrossRef] [PubMed]
  46. Waring, R.H. Characteristics of trees predisposed to die. Bioscience 1987, 37, 569–574. [Google Scholar] [CrossRef]
  47. Dobbertin, M. Tree growth as indicator of tree vitality and of tree reaction to environmental stress: A review. Eur. J. For. Res. 2005, 124, 319–333. [Google Scholar] [CrossRef]
  48. De Boeck, H.; Dreesen, F.; Janssens, I.; Nijs, I. Climatic characteristics of heat waves and their simulation in plant experiments. Glob. Chang. Biol. 2010, 16, 1992–2000. [Google Scholar] [CrossRef]
  49. De Boeck, H.; Dreesen, F.; Janssens, I.; Nijs, I. Whole-system responses of experimental plant communities to climate extremes imposed in different seasons. New Phytol. 2011, 189, 806–817. [Google Scholar] [CrossRef] [PubMed]
  50. D’Amato, A.W.; Puettmann, K.J. The relative dominance hypothesis explains interaction dynamics in mixed species Alnus rubra/Pseudotsuga menziesii stands. J. Ecol. 2004, 92, 450–463. [Google Scholar]
  51. Schwinning, S.; Weiner, J. Mechanisms determining the degree of size asymmetry in competition among plants. Oecologia 1998, 113, 447–455. [Google Scholar] [CrossRef] [PubMed]
  52. Cannell, M.G.R.; Rothery, P.; Ford, E.D. Competition within stands of Picea sitchensis and Pinus contorta. Ann. Bot. (Lond.) 1984, 53, 349–362. [Google Scholar] [CrossRef]
  53. Van Couwenberghe, R.; Gegout, J.C.; Lacombe, E.; Collet, C. Light and competition gradients fail to explain the coexistence of shade-tolerant Fagus sylvatica and shade-intermediate Quercus petraea seedlings. Ann. Bot. (Lond.) 2013, 112, 1421–1430. [Google Scholar] [CrossRef] [PubMed]
  54. Boyden, S.B.; Reich, P.B.; Puettmann, K.J.; Baker, T.R. Effects of density and ontogeny on size and growth ranks of three competing tree species. J. Ecol. 2009, 97, 277–288. [Google Scholar] [CrossRef]
  55. Lagache, L.; Klein, E.K.; Guichoux, E.; Petit, R.J. Fine-scale environmental control of hybridization in oaks. Mol. Ecol. 2013, 22, 423–436. [Google Scholar] [CrossRef] [PubMed]
  56. Petit, R.J.; Bodenes, C.; Ducousso, A.; Roussel, G.; Kremer, A. Hybridization as a mechanism of invasion in oaks. New Phytol. 2004, 161, 151–164. [Google Scholar] [CrossRef]
Figure 1. Modelled probability of survival depending on the plant height at the end of the first growing season. The mean adjusted relative extractable water of the pots in the control and treated group of plants was applied to calculate the probabilities; 95% confidence intervals are shown with dashed lines.
Forests 08 00407 g001
Figure 2. Modelled probability of having reached at least leaf senescence score 5 (yellowing leaves with brown parts) depending on the adjusted relative extractable water of the pots during the second drought period in the first growing season. To calculate the probabilities, the mean plant height of 9.2 cm in 2014 and of 17.6 cm in 2015 was applied, together with DOY2014 = 340 and DOY2015 = 325; 95% confidence intervals are shown with dashed lines.
Forests 08 00407 g002
Figure 3. Modelled probability of having reached at least bud burst score 4 (leaves protruding from the apical bud) depending on the adjusted relative extractable water of the pots during the second drought period in the first growing season; 95% confidence intervals are shown with dashed lines.
Forests 08 00407 g003
Figure 4. Modelled height growth in the second growing season (2015) depending on the adjusted relative extractable water of the pots during the second drought period in the first growing season and on the taxon of the mother tree. The modelled height is shown for seedlings reaching up to 8 cm (median height) at the end of 2014. p: Q. petraea; pr: long-stalked intermediate; rp: short-stalked intermediate; r: Q. robur ( 95% confidence intervals are shown with dashed lines).
Forests 08 00407 g004
Figure 5. Modelled diameter growth in the second growing season (2015) depending on the adjusted relative extractable water of the pots during the second drought period in the first growing season and on the taxon of the mother tree. p: Q. petraea; pr: long-stalked intermediate; rp: short-stalked intermediate; r: Q. robur (95% confidence intervals are shown with dashed lines).
Forests 08 00407 g005
Table 1. Number of oak seedlings according to the treatment and the taxon of the mother tree (nt) and number of seedlings that survived the first growing season (nsu), also expressed in % (nsu%).
TreatmentTaxon Mother Tree *ntnsu (nsu%)
controlp6968 (99)
pr1313 (100)
rp5555 (100)
r5858 (100)
droughtp7450 (68)
pr1411 (79)
rp5838 (66)
r5136 (71)
* p: Q. petraea, pr: long-stalked intermediate, rp: short-stalked intermediate, r: Q. robur.
Table 2. Model statistics for the general linear mixed model of the binary response variable survival.
CovariateEstimateSt. er.z Valuep Value
Intercept3.260.595.52<0.001 ***
H−0.280.06−4.98<0.001 ***
A−3.661.95−1.880.061
H:A2.490.534.69<0.001 ***
A: adjusted relative extractable water (continuous variable), H: height of the plant (continuous variable). Significant results are in bold: *** p < 0.001.
Table 3. Model statistics for the general linear mixed models of the ordinal phenological response variables leaf senescence and bud burst.
Leaf Senescence (2014 and 2015)Bud Burst (2015)
CovariateEstimateSt. er.z Valuep ValueEstimateSt. er.z Valuep Value
D−0.190.008−25.20<0.001 ***
Y4.800.29516.25<0.001 ***
A1.090.2524.33<0.001 ***−2.240.30−7.40<0.001 ***
H−0.070.013−5.14<0.001 ***
Y:A−1.580.331−4.78<0.001 ***
D: day of observation (continuous variable), Y: year of observation (factor variable with 2015 as standard level), A: adjusted relative extractable water (continuous variable), H: height of the plant (continuous variable). Significant results are in bold: *** p < 0.001.
Table 4. Model statistics for the linear mixed models of the continuous response variables height and diameter growth in the second growing year.
Height Growth in 2015Diameter Growth in 2015
CovariateEstimateSt. er.DFt Valuep ValueEstimateSt. er.DFt Valuep Value
Intercept5.861.722963.40<0.001 ***123.716.12977.71<0.001 ***
A1.481.252961.180.238−15.919.1297−0.830.40
Tpr3.874.19140.920.37126.438.4140.690.50
Tr1.732.46140.700.494−25.224.614−1.030.32
Trp1.472.44140.600.557−9.323.714−0.390.70
H−0.150.08296−1.920.056
A:Tpr1.133.102960.370.716−1.4547.5297−0.030.98
A:Tr6.171.842963.35<0.001 ***61.127.92972.190.029 *
A:Trp8.031.902964.23<0.001 ***56.829.02971.960.051
A: adjusted relative extractable water (continuous variable), T: taxon of the mother tree with pr: long-stalked intermediate, r: Q. robur, rp: short-stalked intermediate (factor variable with Q. petraea as standard level to which pr, r, and rp are compared to), H: height of the plant (continuous variable). Significant results are in bold: *** p < 0.001; * p < 0.05.
Table 5. Variance components calculated in the different models for the taxon of the mother tree (Mother taxon), the individual mother tree (Mother ID), and the residual variance. Only linear regression models have a calculation of the residual variance.
Response VariableVariance Component
Mother TaxonMother IDResidual
Survival 1<0.00010.23-
Bud burst 2<0.00010.52-
Senescence 2<0.00010.55-
Height 35.6312.5025.36
Diameter 30.556.7259.72
1 Logistic regression model; 2 Cumulative logistic regression model; 3 Linear regression model.

