Article

The Relationship between Sap Flow Density and  Environmental Factors in the Yangtze River Delta  Region of China

1
Co‐Innovation Center for Sustainable Forestry in Southern China, Jiangsu Province Key Laboratory of Soil and Water Conservation and Ecological Restoration, Nanjing Forestry University, 159 Longpan Road, Nanjing 210037, China
2
Department of Biology, University of Miami, Coral Gables, FL 33124, USA
*
Author to whom correspondence should be addressed.
Forests 2017, 8(3), 74; https://doi.org/10.3390/f8030074
Submission received: 17 January 2017 / Accepted: 8 March 2017 / Published: 10 March 2017

Abstract

:
Canopy transpiration is an important component of evapotranspiration, integrating physical and biological processes within the water and energy cycles of forests. Quercus acutissima and Cunninghamia lanceolata are two important, fast-growing and commercial tree species that have been extensively used for vegetation restoration, water conservation and building artificial forests in the Yangtze River Delta region of China. The primary objective of this study was to characterize sap flow densities of the two species by comparing daytime and nocturnal sap flow patterns and their relationships with environmental factors. Sap flow densities (Sd) were measured between September 2012 and August 2013 using the commercially-available thermal dissipation probes. Hourly meteorological data were measured in an open field, located 200 m away from the study site, including photosynthetically-active radiation (Par), air temperature (Ta), relative air humidity (Rh), vapor pressure deficit (Vpd) and precipitation (P). Soil water content (Swc) data were logged hourly in different layers at Q. acutissima and C. lanceolata forests. Results indicated that the mean Sd in summer was higher than that in spring and autumn. Both the Sd of Q. acutissima and C. lanceolata showed distinct diurnal patterns. Nocturnal sap flow densities (Sdn) were noticeable, and both species followed similar declining patterns during our study period. The daytime sap flow density (Sdd) was more sensitive to environmental factors than Sdn. Sap flow density was significant linearly correlated with Par, Vpd and Ta, and Par and Vpd explained the greatest amount of variation in daytime sap flow of Q. acutissima and C. lanceolata, respectively. Our study will enrich knowledge of plantation forest physical and biological processes and provide valuable information for plantation forest management in the Yangtze River Delta region of China.

1. Introduction

In a forest ecosystem, canopy transpiration, which can be derived empirically from sap flow measurements in the trunk xylem [1], is a physiological metabolism process that is essential to the vitality of tree and also is an important component of evapotranspiration [2,3,4]. It exerts great influence on the weather patterns, Earth’s surface energy balance and water supply to downstream systems [5,6].
Most prior studies indicated that sap flow is strongly influenced by environmental factors [7,8,9], including solar radiation, vapor pressure deficit, rainfall, air temperature, wind speed and soil water content [10]. For example, in a comparative study, the effect of a flat-roof screen house on banana transpiration showed that reduction in transpiration in the screen house is mainly due to the combined reductions of wind speed and global radiation [11]. There were significant differences in sap flow dynamics of a drought-tolerant plant between the two periods of the day (0:00–15:00 and the remainder) due to the meteorological factors [12]. In the future, climate change likely will increase air temperature, and its variation may be accompanied by similar changes in vapor pressure deficit (Vpd), which would influence the canopy transpiration [6]. Therefore, an improved understanding of how these environmental factors interact to influence the sap flow is essential in the Yangtze River Delta region of China.
Transpiration occurs through the stomata, and researchers formerly thought that leaf stomata close at night, so it is generally assumed that transpiration only occurs during the day [13,14], which led to the underestimation of total sap flow [15]. Now, there is a greater awareness that nocturnal sap flow can in fact have a significant contribution to total daily sap flow [16,17,18,19]. Most previous work on the nocturnal sap flow has shown by analysis of 98 species that its averaged proportion of the total daily sap flow was 12.03% [16]. Daley and Phillips found that over 10% of the total daily sap flux during the growing season was due to transpiration at night in paper birch [20]. Nighttime sap flow was over 8% of the total daily flow in red oak and 2% in red maple. Integrated crop water loss during the dark, non-photosynthetic hours measured on the lysimeter was 3%–10.8% of total daily water loss [21]. Hence the nocturnal sap flow is significant and needs to be carefully considered in sap flow and related studies [16].
With the rapid growth of the population, China underwent deforestation at an alarming rate during the second half of the 20th century to meet the needs for timber and food production. Almost all natural primary forests have been replaced with secondary forest and fast-growing tree plantations. Plantations currently account for 40% of the total forest area in China [22,23]. Quercus acutissima and Cunninghamia lanceolata are the most important plantation tree species in China in terms of planted area, yield and timber usage [24,25,26,27]. In recent decades, a great deal of pure Q. acutissima stands and pure C. lanceolata stands were established in the Yangtze River Delta region of China. With the maturation of these plantations, the forest farms faced many problems of management and sustainable development [28,29,30], such as reasonable use of water. Therefore, accurate calculation of water consumption for the plantation ecosystems is important for forest farm management, which depends on our capacity to quantify the transpiration in plantations. To our knowledge, however, none of the existing studies considered the transpiration of Q. acutissima and C. lanceolata [31] in the Yangtze River Delta region of China.
Therefore, in this study, we monitored stem sap flow density using thermal dissipation probes (TDPs) in the pure Q. acutissima forest and pure C. lanceolata forest in the Yangtze River Delta region of China. Our primary objectives were (1) to compare the difference of the sap flow density among the diameters at breast height (DBH), (2) to examine monthly variations of the daily sap flow density and (3) to compare the diurnal and nocturnal sap flow patterns and their relationships with the environmental factors. Our study will enrich knowledge of plantation forest hydrological processes and provide valuable information for plantation forest management in the Yangtze River Delta region of China.

2. Materials and Methods

2.1. Study Site

The study site was located in the Tong Shan forest farm (31°37′ N, 118°51′ E), Nanjing, China. The altitude of the Tong Shan forest farm ranged from 38 m–388 m. The research area is a mature artificial pure forest of, respectively, Q. acutissima pure forest, C. lanceolata pure forest or Phyllostachys edulis pure forest. It has a subtropical monsoon climate; the annual mean temperature is 16.5 °C, with a monthly mean temperature reaching a maximum of 28.6 °C in July and a minimum of 3.1 °C in January (Figure 1). Annual cumulative hours of sunshine are 2199.5 h. The annual mean precipitation is 1126.9 mm, and the average precipitation during the rainy season, from June to August is 587.6 mm (Figure 1).
The experimental plots were located in Q. acutissima deciduous forest and C. lanceolata evergreen forest. At the time of the study (2012–2013), the trees were about 45 years old. The averaged tree heights of Q. acutissima and C. lanceolata were, respectively, 13.8 m and 12.8 m. The stand densities were, respectively, 425 trees ha–1 and 850 trees ha–1. The average diameters at breast height (DBH) were, respectively, 25.8 cm and 21.0 cm. The leaf area indices (LAI) of Q. acutissima deciduous forest, estimated by an LAI-2200 plant canopy analyzer (LI-COR, Lincoln, USA), was 2.49–3.37 during the growing season, and the LAI of C. lanceolata evergreen forest was 1.71–3.12 throughout the year.

2.2. Sap Flow Measurements

Sap flow densities per unit sapwood area (Sd, g·cm–2·h–1) were measured from July 2012 to August 2013 using the commercially-available thermal dissipation probes (Model TDP-30, Dynamax Inc., Houston, TX, USA) [32]. Eight Q. acutissima trees and eleven C. lanceolata trees, relatively well-grown, were selected based on the growing condition in the experimental site (Table 1). We took a separate sample of 20 trees of the same species distributed across the study area to determine the sapwood area (SA) of the samples. The trees used for the determination of sapwood area were not the same as those used for continuous monitoring of sap flow density, in order to avoid the effects of plant injury on our measurements. Approximately 20 tree ring cores with an average height of 1.3 m were drilled by an increment borer (SY-CO, Haglöf, Långsele, Sweden), after which their heartwood and sapwood were measured [33]. The sapwood area values of the samples were estimated according to the data (Figure 2).
Pairs of probes with lengths of 30 mm were inserted in the northern trunk directions at breast height of each sample tree in order to avoid the sun-exposed side of the trunk, the TDP sensor installed according to the instructions recommended by the manufacturer (Copyright 2007, Dynamax Inc.) at the same sapwood depth of the same tree species (Table 1). These probes operated on the constant power principle [34], and the sap flow density was recorded at 10-min intervals. An average value was calculated every 60 min and then recorded in Campbell CR1000 data loggers. Due to loss of electricity supply, the sap flow densities of C. lanceolata in May and December were lost.
Sap flow density on a sapwood area basis was calculated based on the temperature difference between the heated and non-heated probe by an empirical equation [34]:
S d = 0.0119 × 3600 × [ ( d T M d T ) / d T ] 1.231
where S d is the sap flow density (g·cm–2·h−1 or cm·h−1), d T is differential temperature between the two probes and d T M is the temperature difference at zero flow. Zeppel et al. used two methods to determine the zero set of each sensor: (1) examining the flow rates at night when Vpd and wind speed were ca. zero during the periods and (2) at the end of the study, cutting into the sapwood beneath the sensors in each tree to determine the zero flow rates [35]. They found that there was no significant difference (p < 0.05) between the two different methods used to estimate zero flow rates [35]. In our study, zero flow measurements were automatically conducted every six days between the hours of 02:00 and 05:00 because the sap flow velocity can reasonably be considered to be zero or minimal during this period [36]. According Oishi et al., to account for potential nocturnal sap flows due to both transpiration and recharge, we selected the highest daily d T to represent d T M if two conditions are satisfied simultaneously: (1) the average, minimum two hours Vpd < 0.05 kPa, thus assuring that water loss to the atmosphere is negligible, and (2) the standard deviation of the highest d T values <0.5% of the mean of these values; such stable measurement of maximum d T ensures that recharge of water above the sensor height is completed or negligible. In our sap flow time series, zero flow nighttime conditions were often not met for several consecutive days [37].
In addition, transpiration was scaled up to the stand level using the following equation [38]:
S t = 10 × S d m × S A s t a n d / S G
where S t is stand transpiration (mm·h–1), S d m is the mean S d of stand (g·cm–2·h–1 or cm·h–1), S A s t a n d is stand sapwood area (cm2) and S G is the ground area (cm2).

2.3. Meteorological and Soil Water Measurements

Hourly meteorological data (EM50, Decagon Devices, Pullman, WA, USA) were measured in an open field, which is 200 m away from the studied stand, including photosynthetically-active radiation (Par, μmol·m–2·s–1), air temperature (Ta, °C), relative air humidity (Rh, %) and precipitation (P, mm) (Figure 3A,B,C,F). These Ta and Rh data were used to calculate the vapor pressure deficits (Vpd, kPa, Figure 3D).
Soil water content at different soil layers (10 cm and 40 cm) was measured continuously with ECH2O probes (Decagon Devices Inc., Pullman, WA, USA) (Figure 3F).

2.4. Statistical Analyses

All statistical analyses were performed using the SPSS Version 21.0 software (IBM Inc., Armonk, NC, USA). Data plotting was completed with software OriginPro 8.5 (OriginLab Inc., Northampton, MA, USA).

3. Results

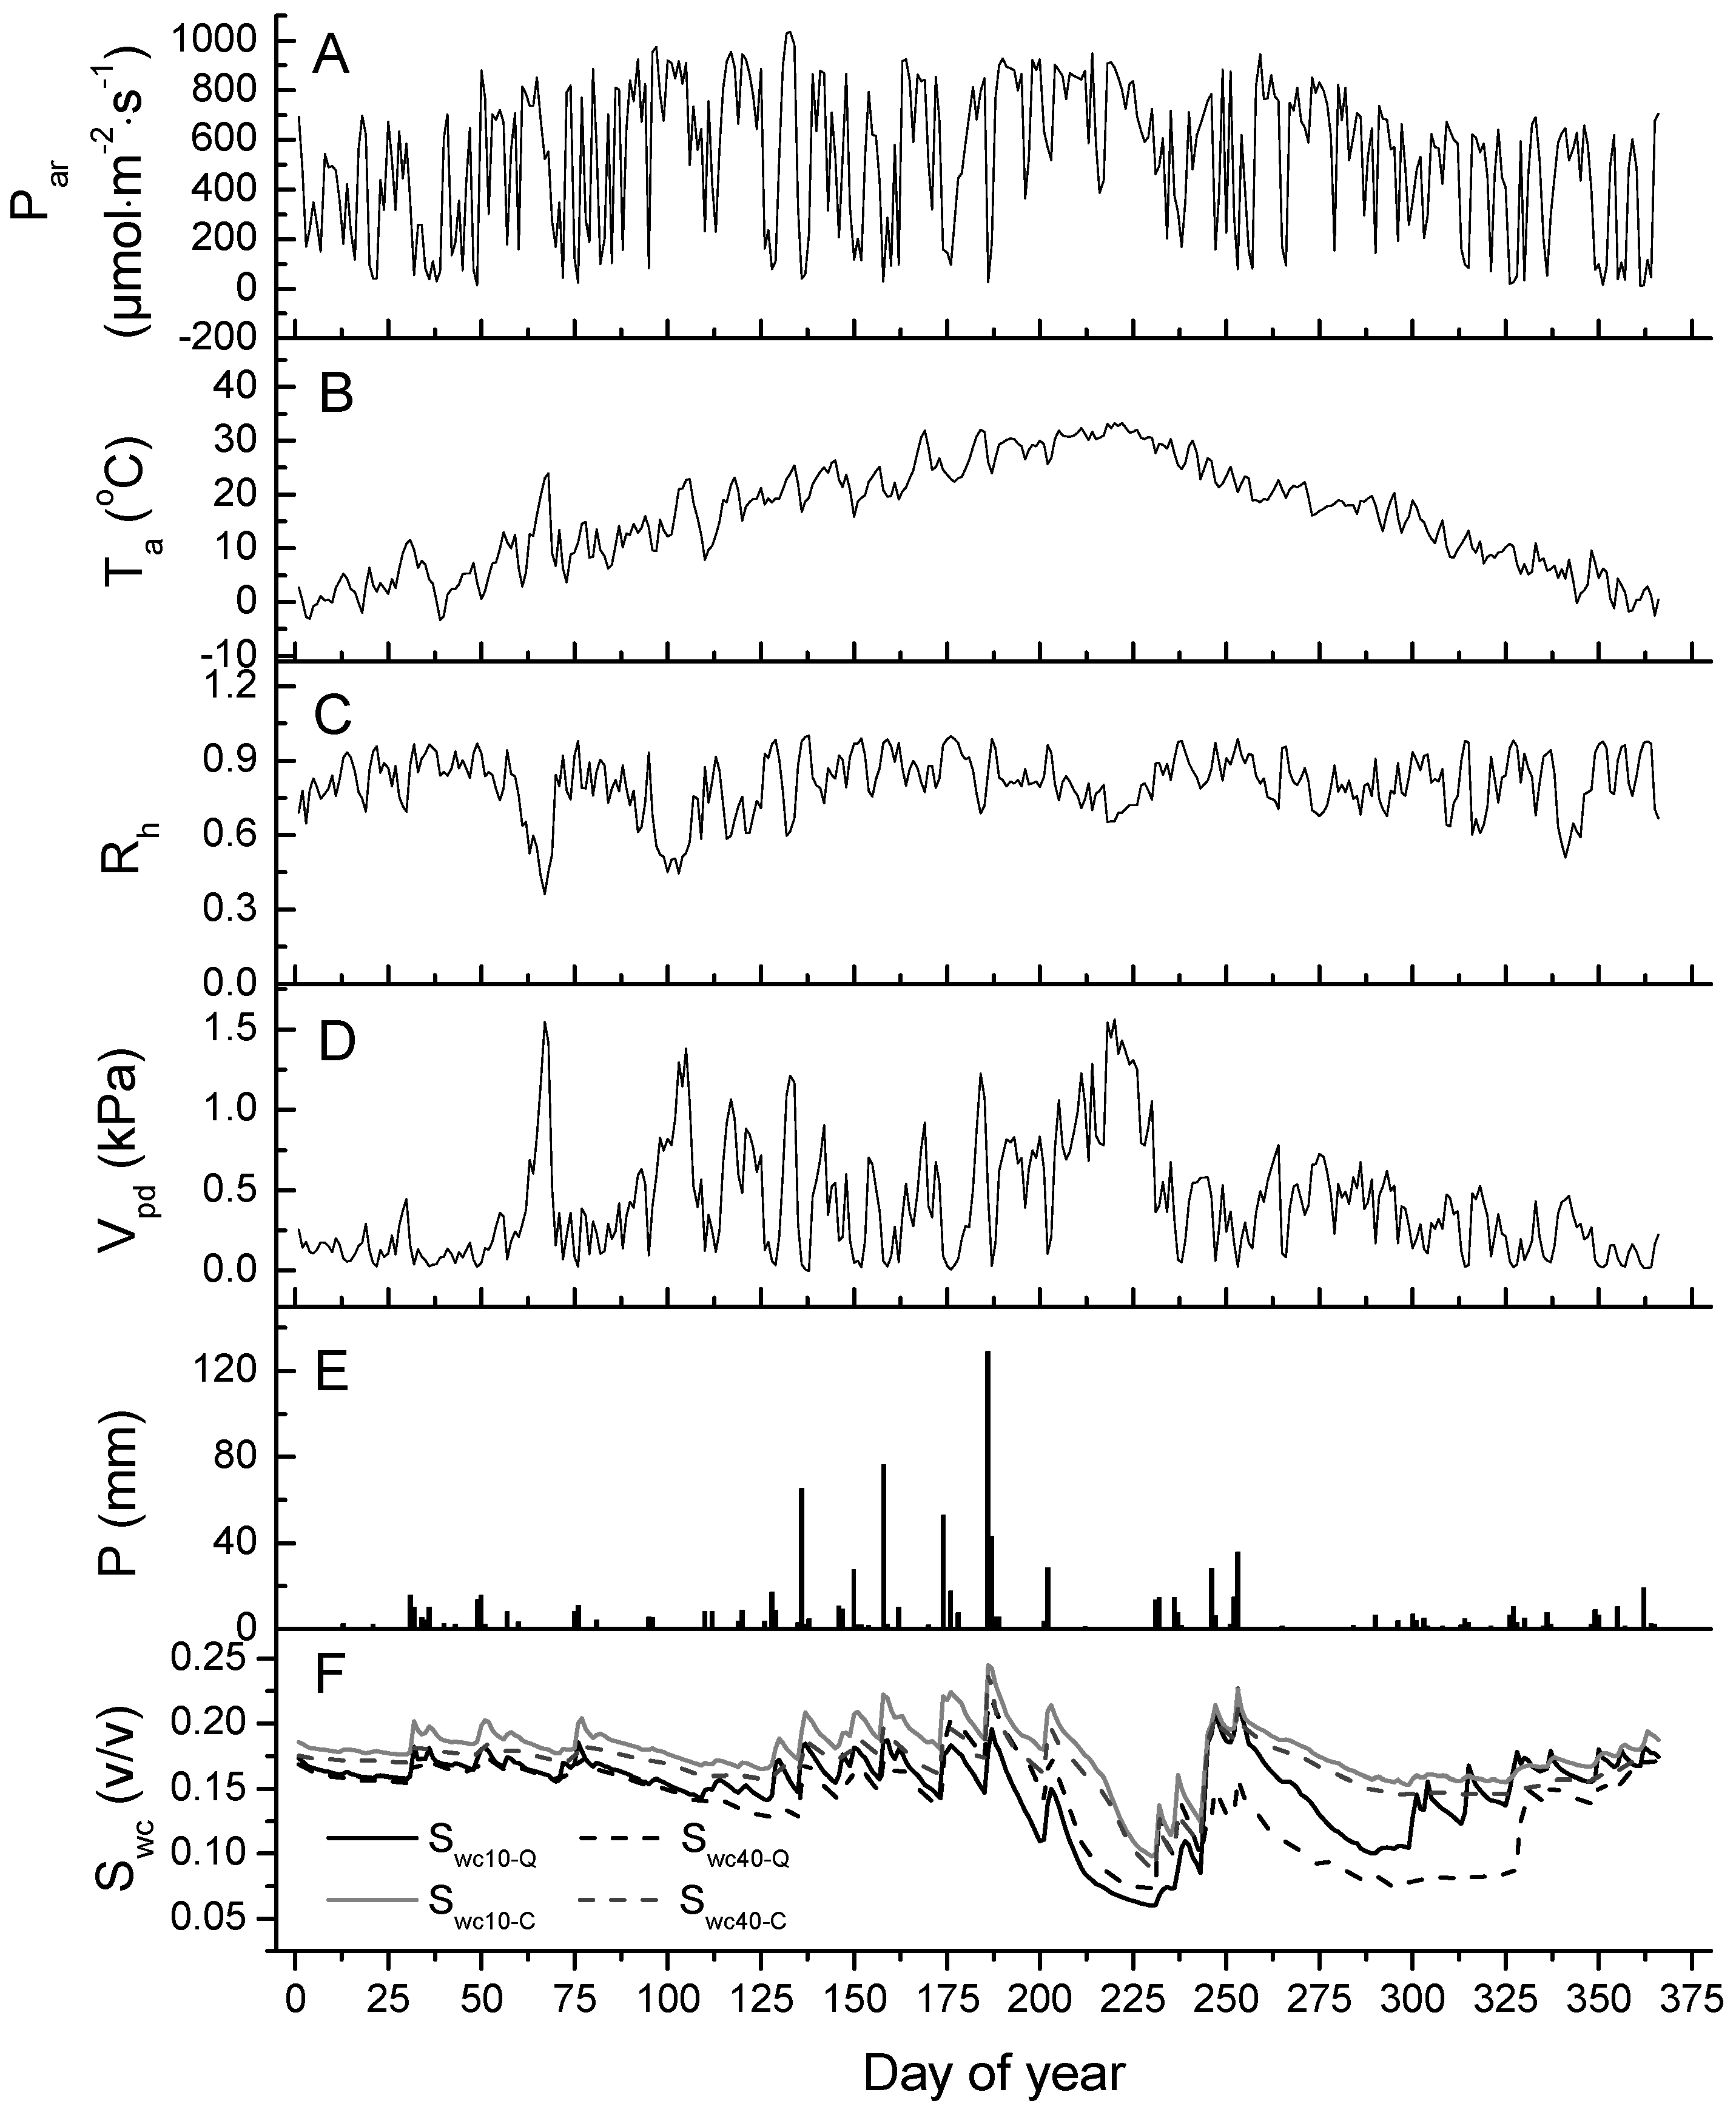
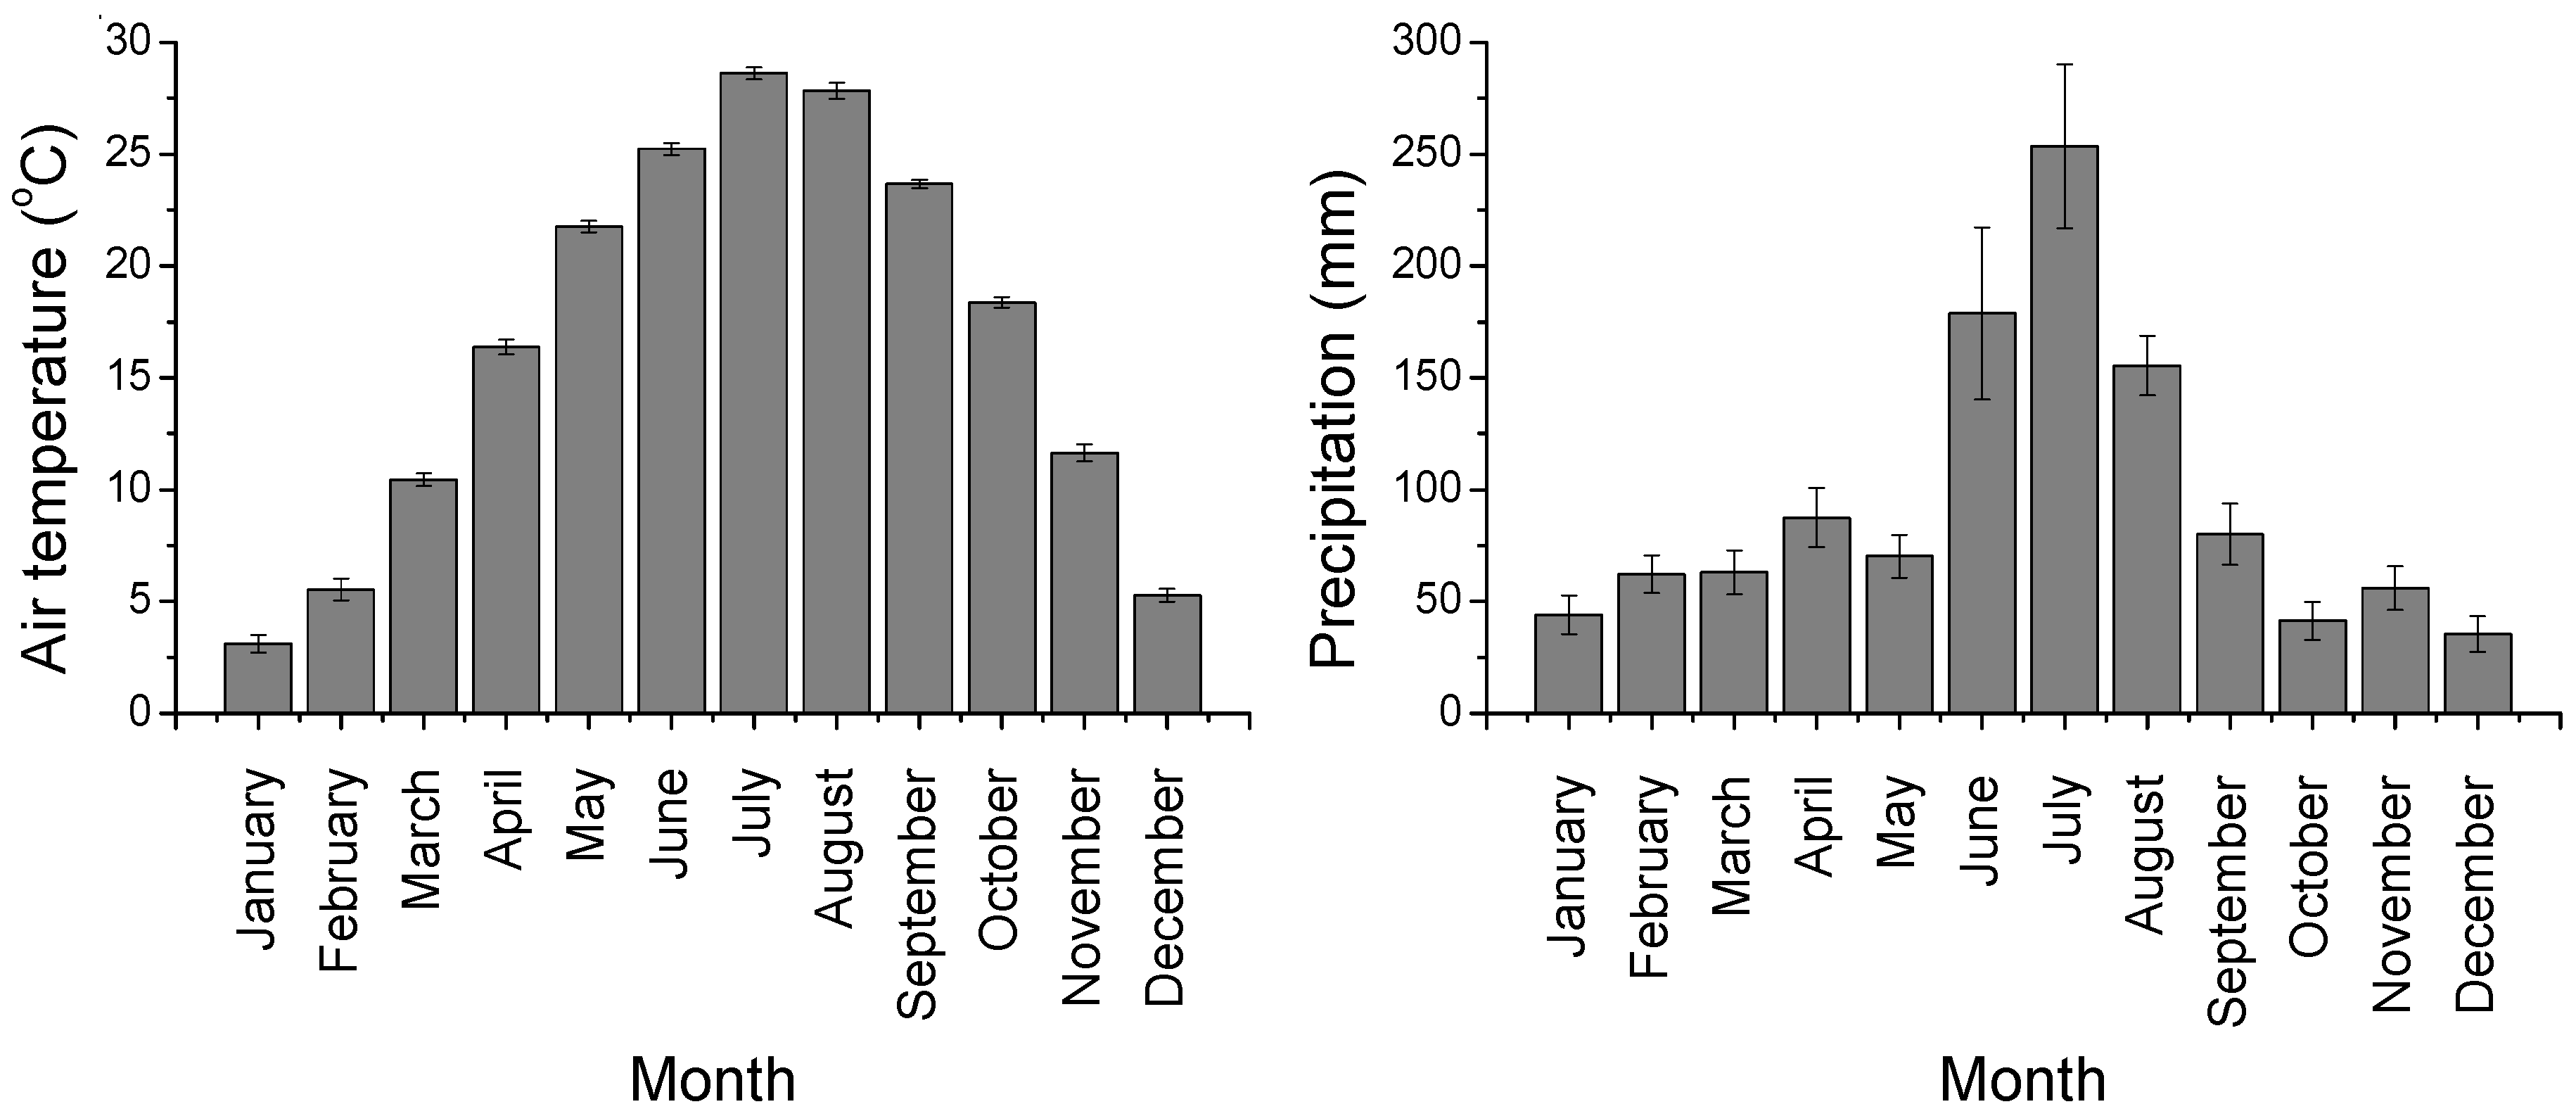
3.1. Environmental Variables

The seasonal patterns of environmental variables obtained during the study period (1 September 2012 to 31 August 2013) were representative of the climatic conditions at the study site (Figure 3). The daily maximum photosynthetically-active radiation (Par), mean air temperature (Ta), mean air relative humidity (Rh) and mean vapor pressure deficit (Vpd) had seasonal patterns (Figure 3A,B,C,D). The daily maximum Par varied from 12.82 μmol·m–2·s–1 during December to 1034.55 μmol·m–2·s–1 during May (Figure 3A). The daily mean Ta and Vpd were highest in August, and the values of July were only a little lower than August. Daily averaged Ta was 15.87 °C and varied between –3.31 °C (28 February 2013) and 33.28 °C (10 August 2013) (Figure 3B,D). The Rh (Figure 3C) was significantly negatively correlated with Ta, and daily averaged Rh was 80.6%.
Rainfall data for the study region were collected from 2012–2013 (Figure 3E). During the data collection period, there were 115 rainy days, which produced a total rainfall of 973.2 mm and an average rainfall of 9.5 mm per day, with individual events ranging from 0.2–129 mm. The distribution of rainfall is shown in Table 2. A light rain event (<10 mm) was most frequent and had the greatest contribution to total rainfall.
Soil moisture depended significantly on rainfall. Soil water content (Swc) increased with increasing rainfall amount, and the dynamic variation of Swc increased intensely after rainfall, then gradually decreased as a result of evaporation (Figure 3F). Soil water content for the upper 10 cm (Swc10) in most study periods was higher than Swc40. In Q. acutissima forest, Swc10 averaged 14.97%, and Swc40 averaged 13.81%. In C. lanceolata forest, Swc10 averaged 17.80%, and Swc40 averaged 16.59%.

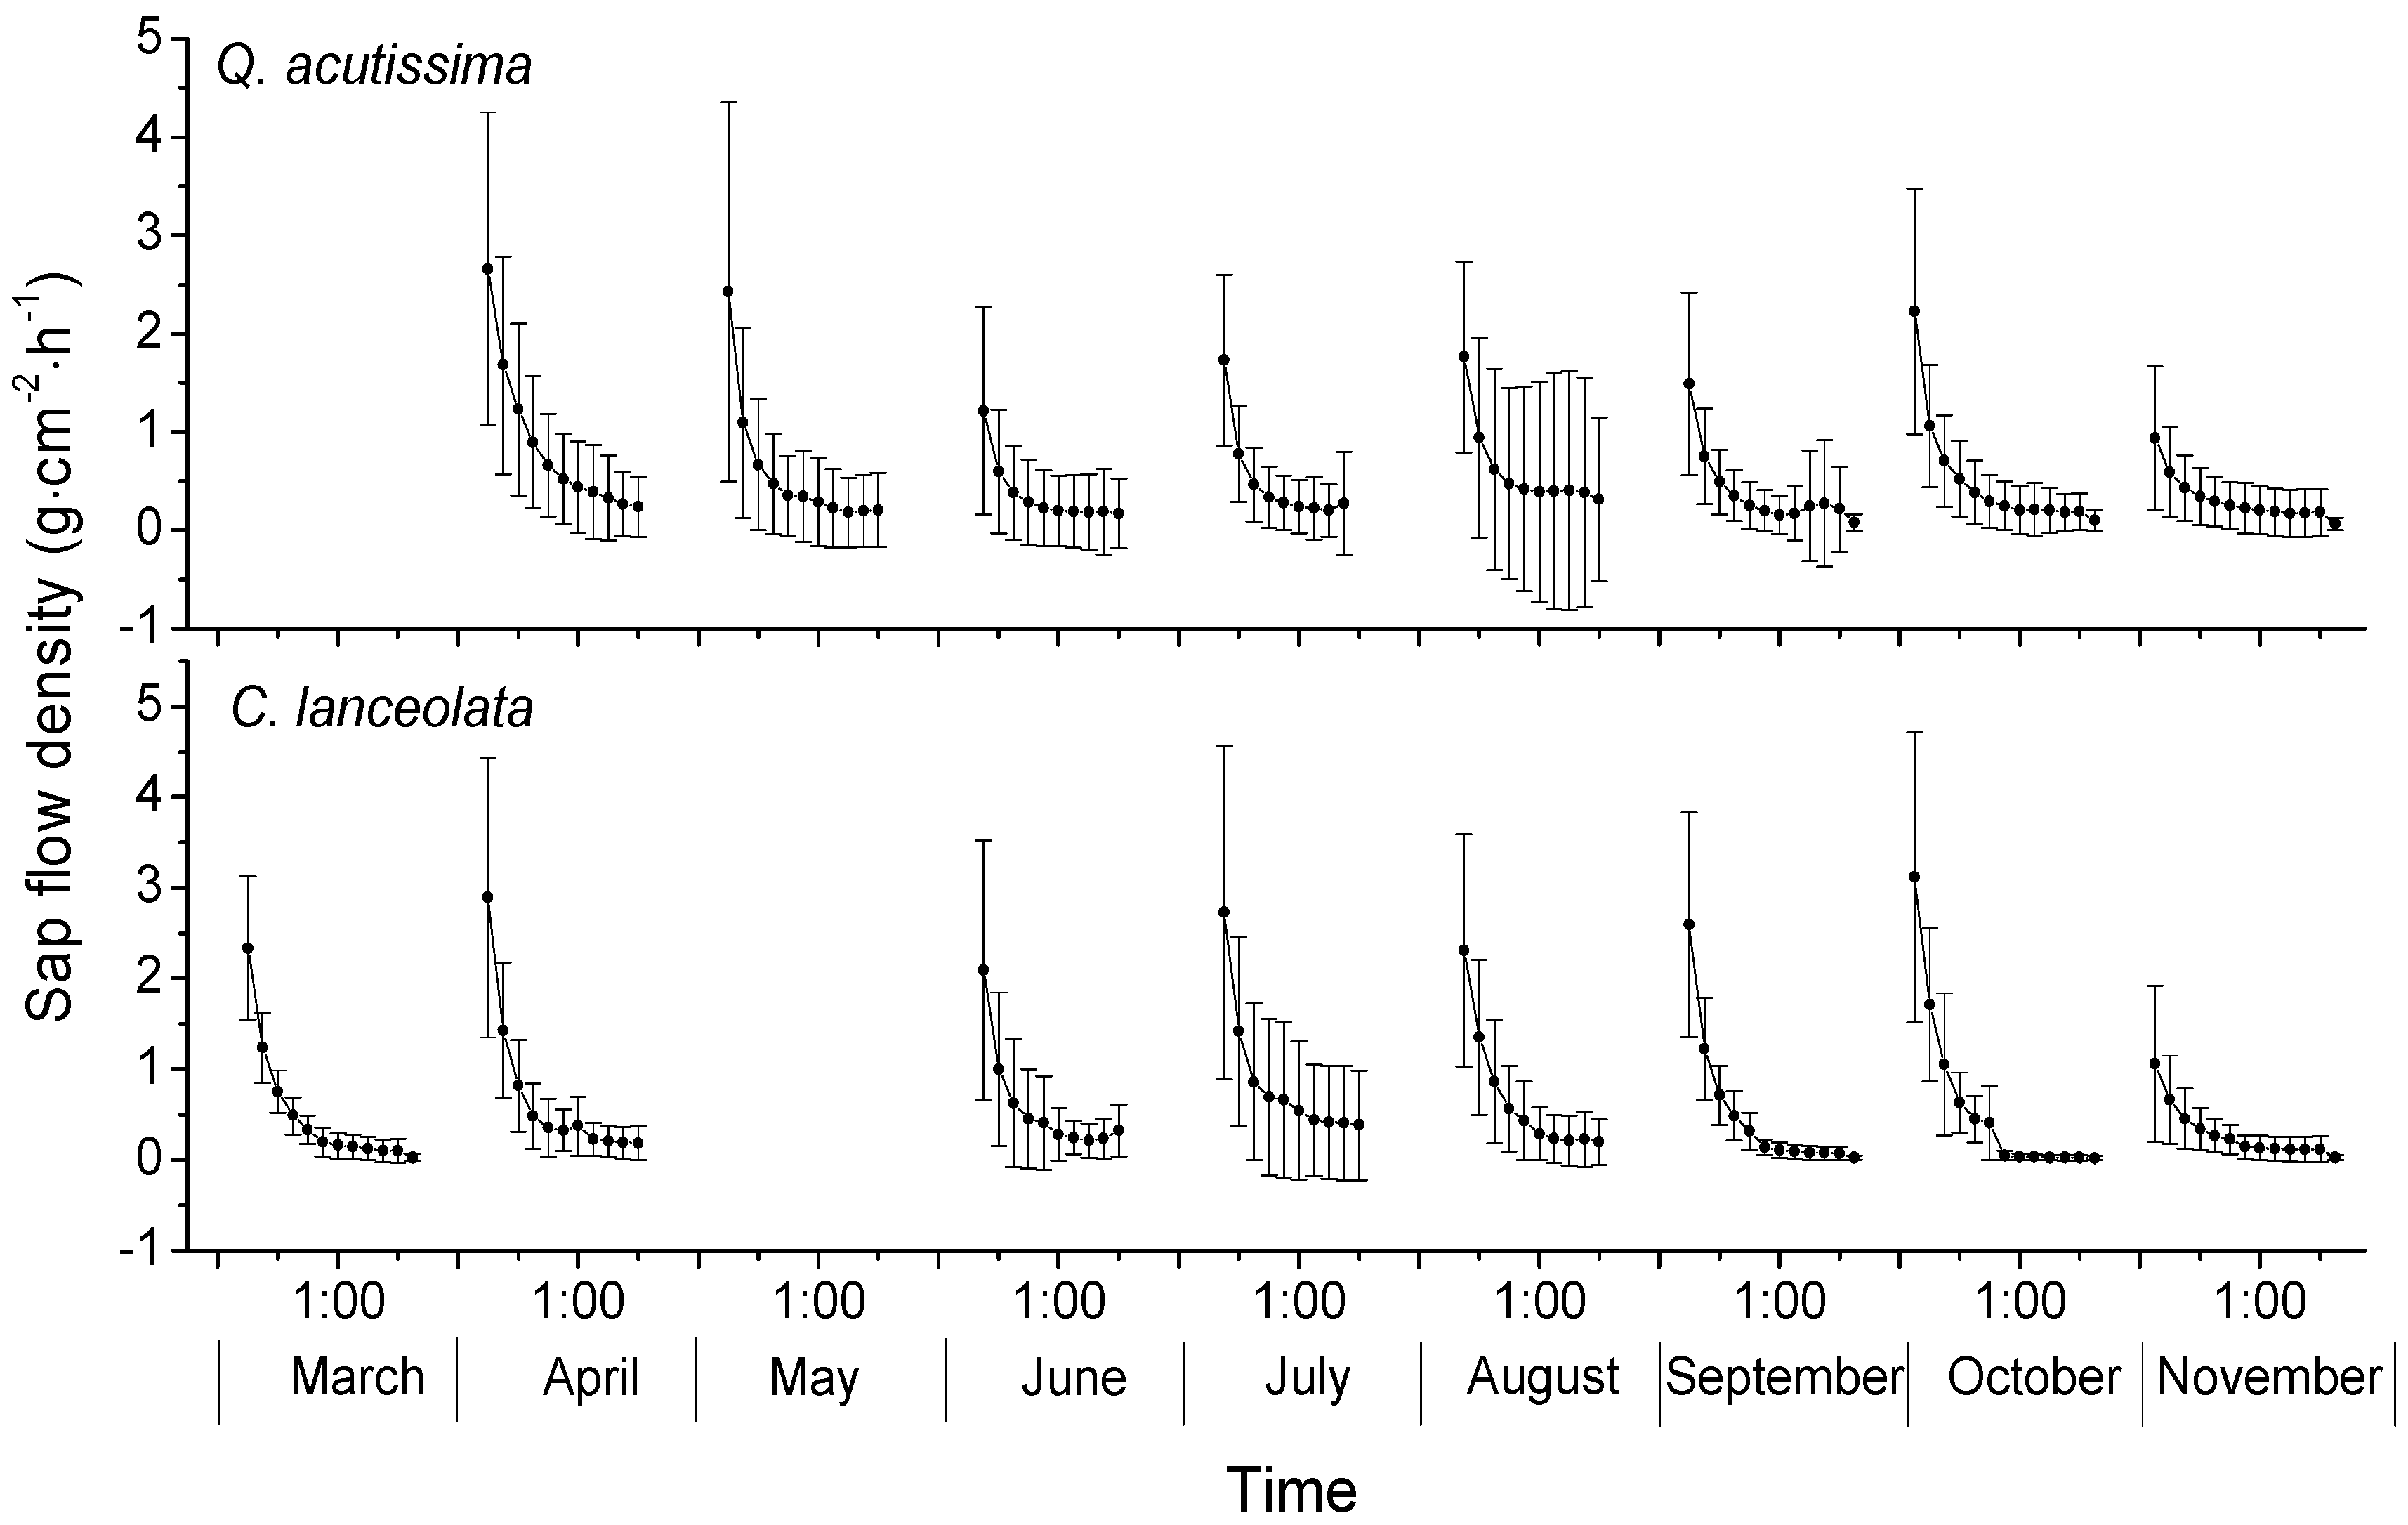
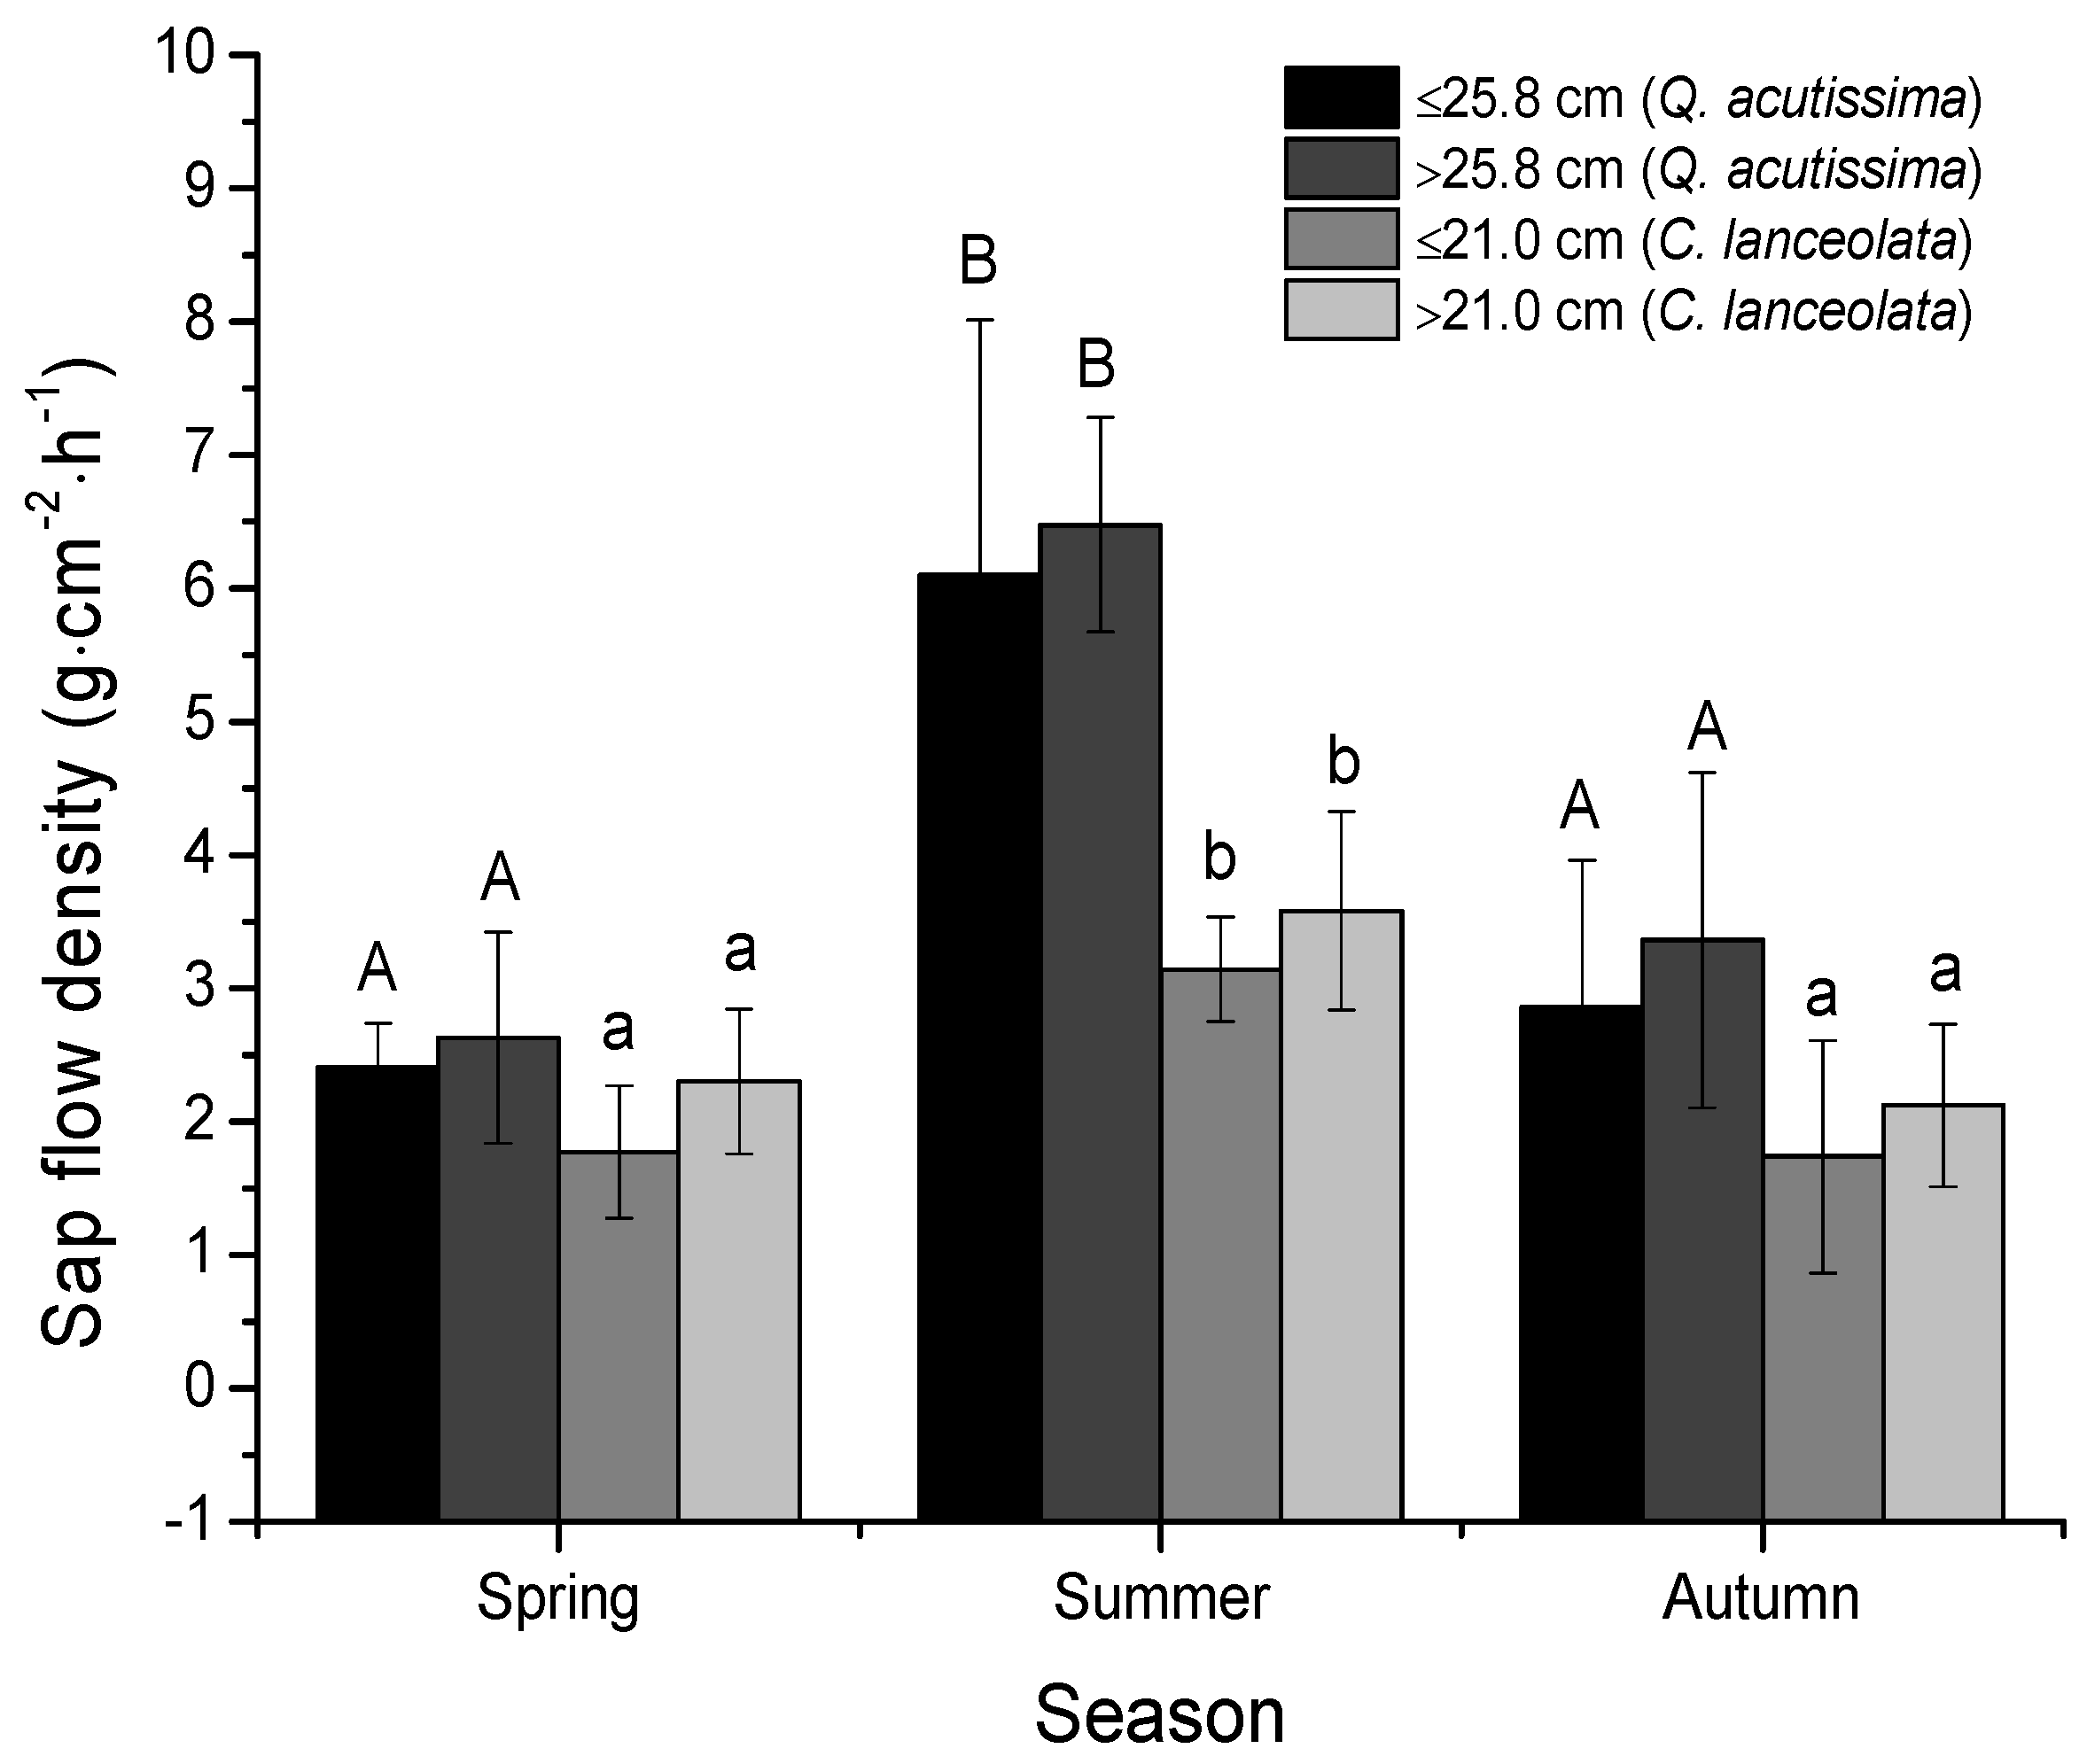
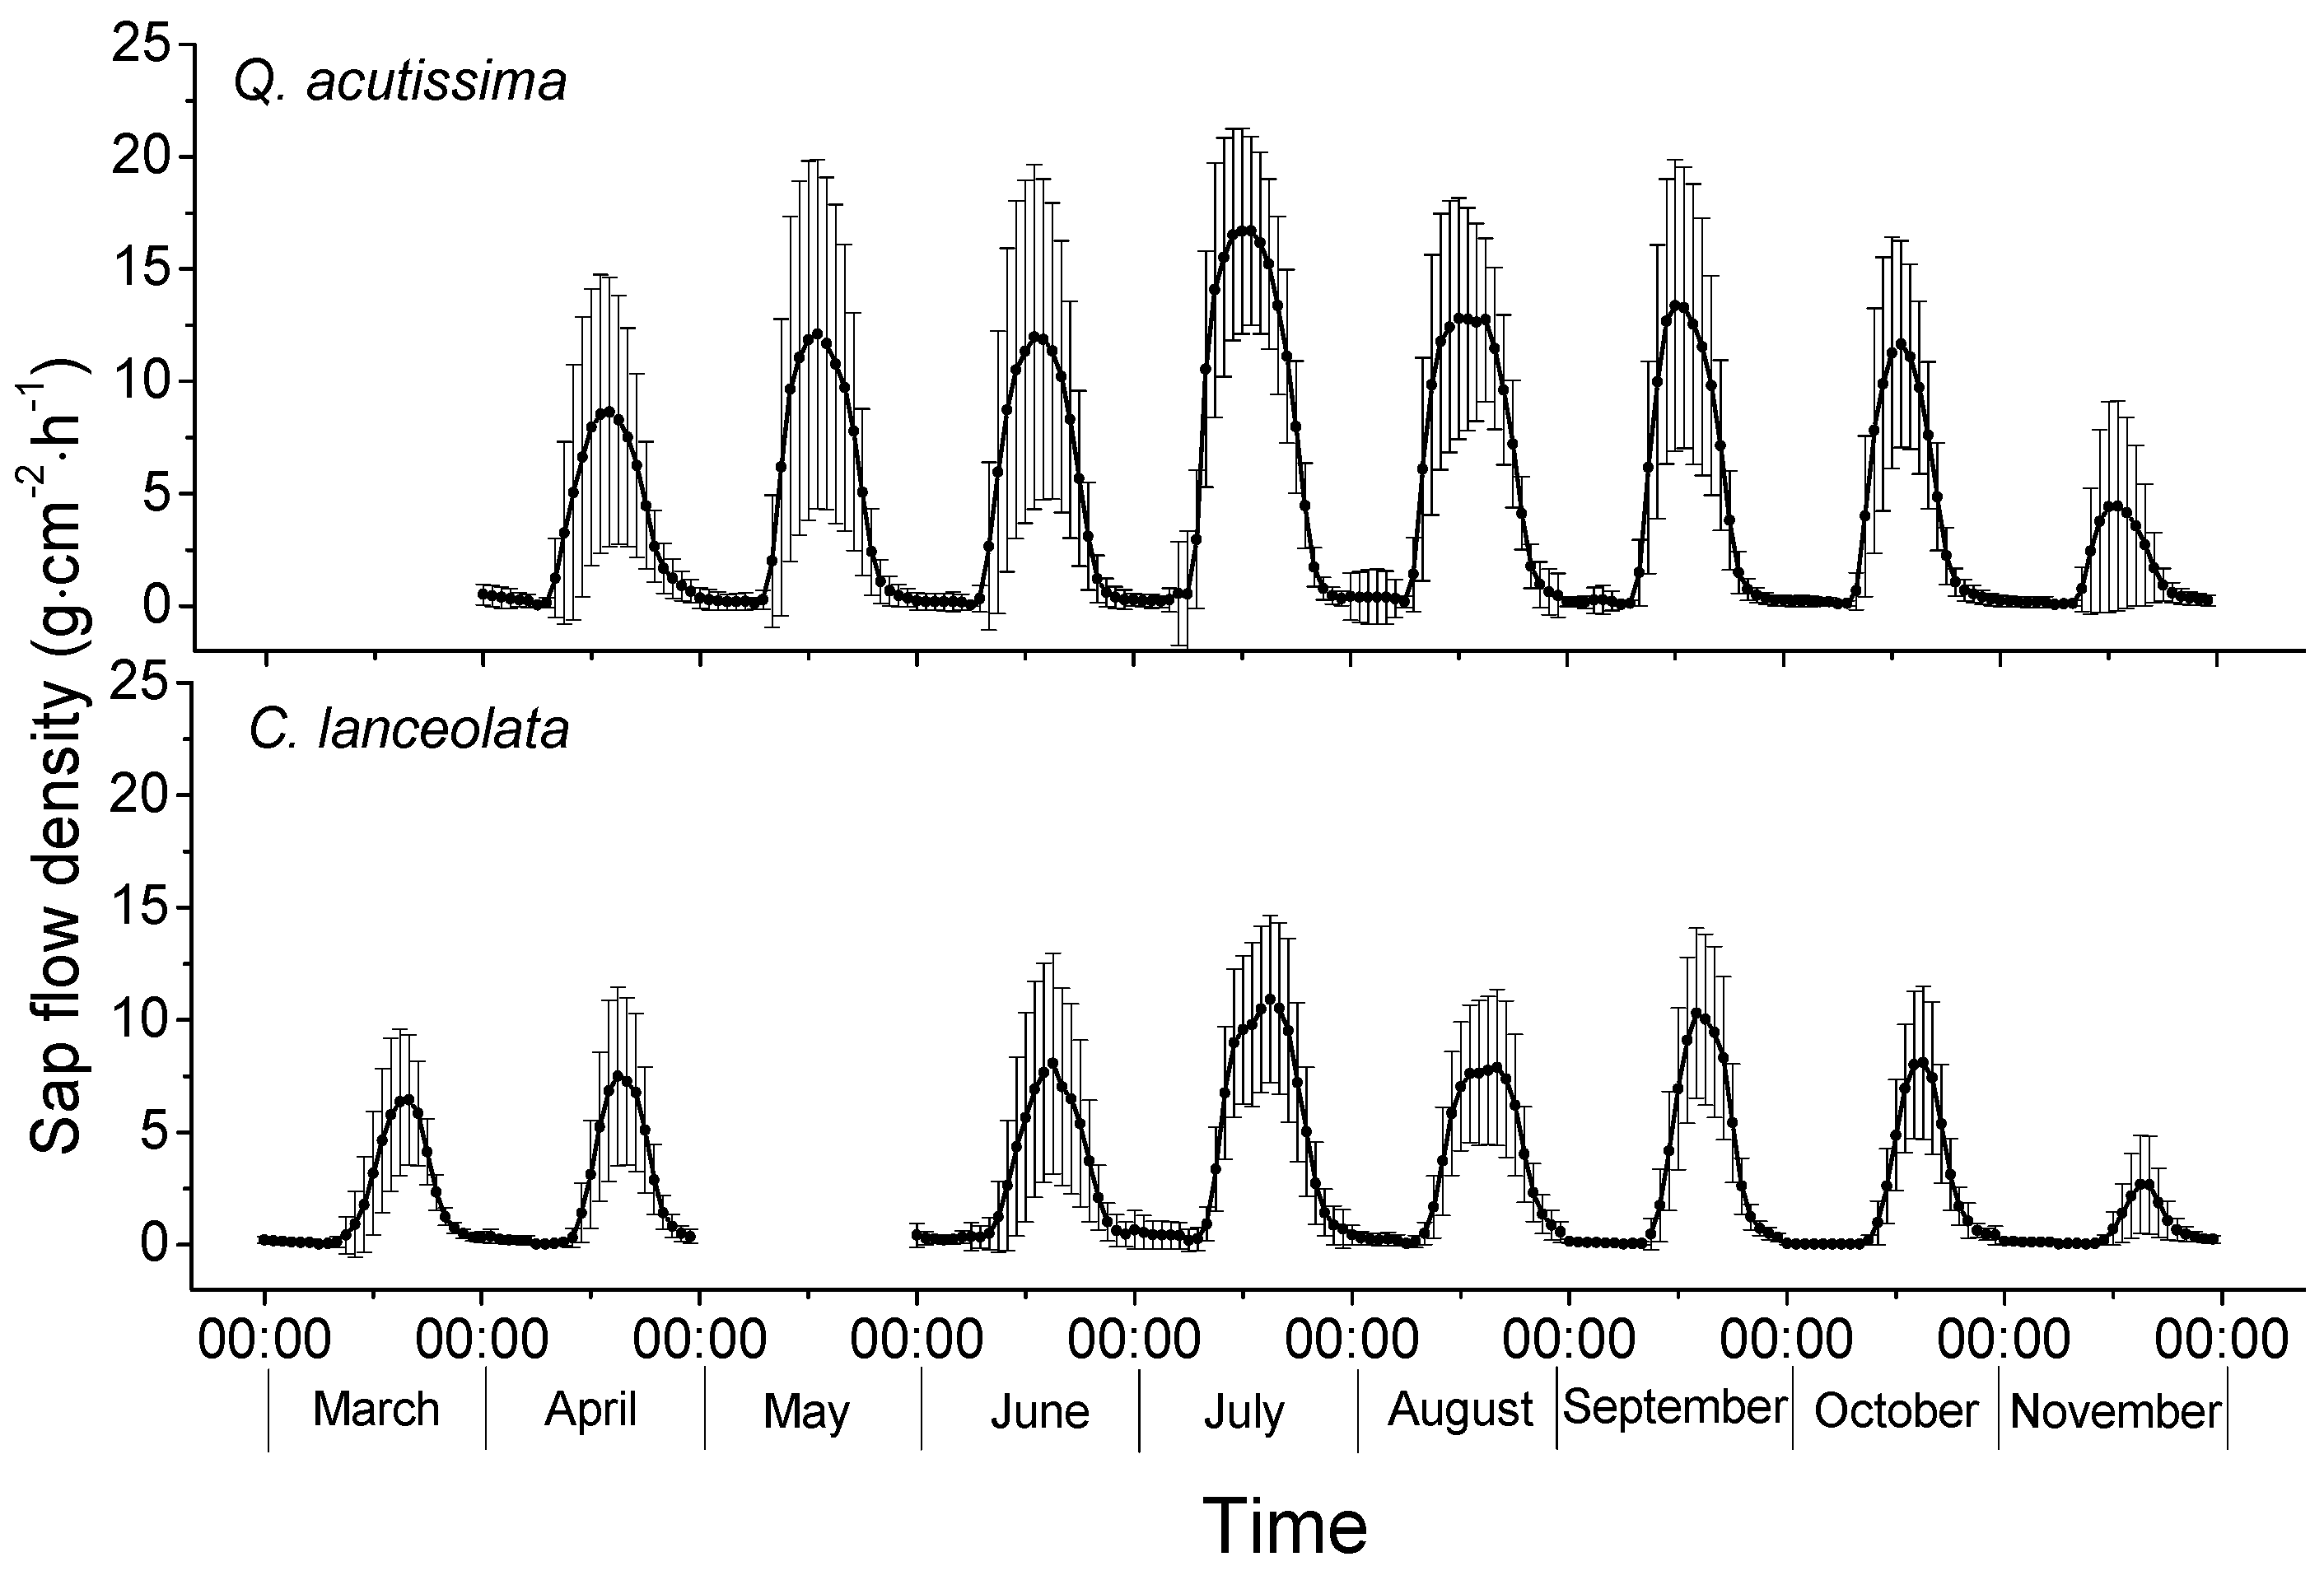
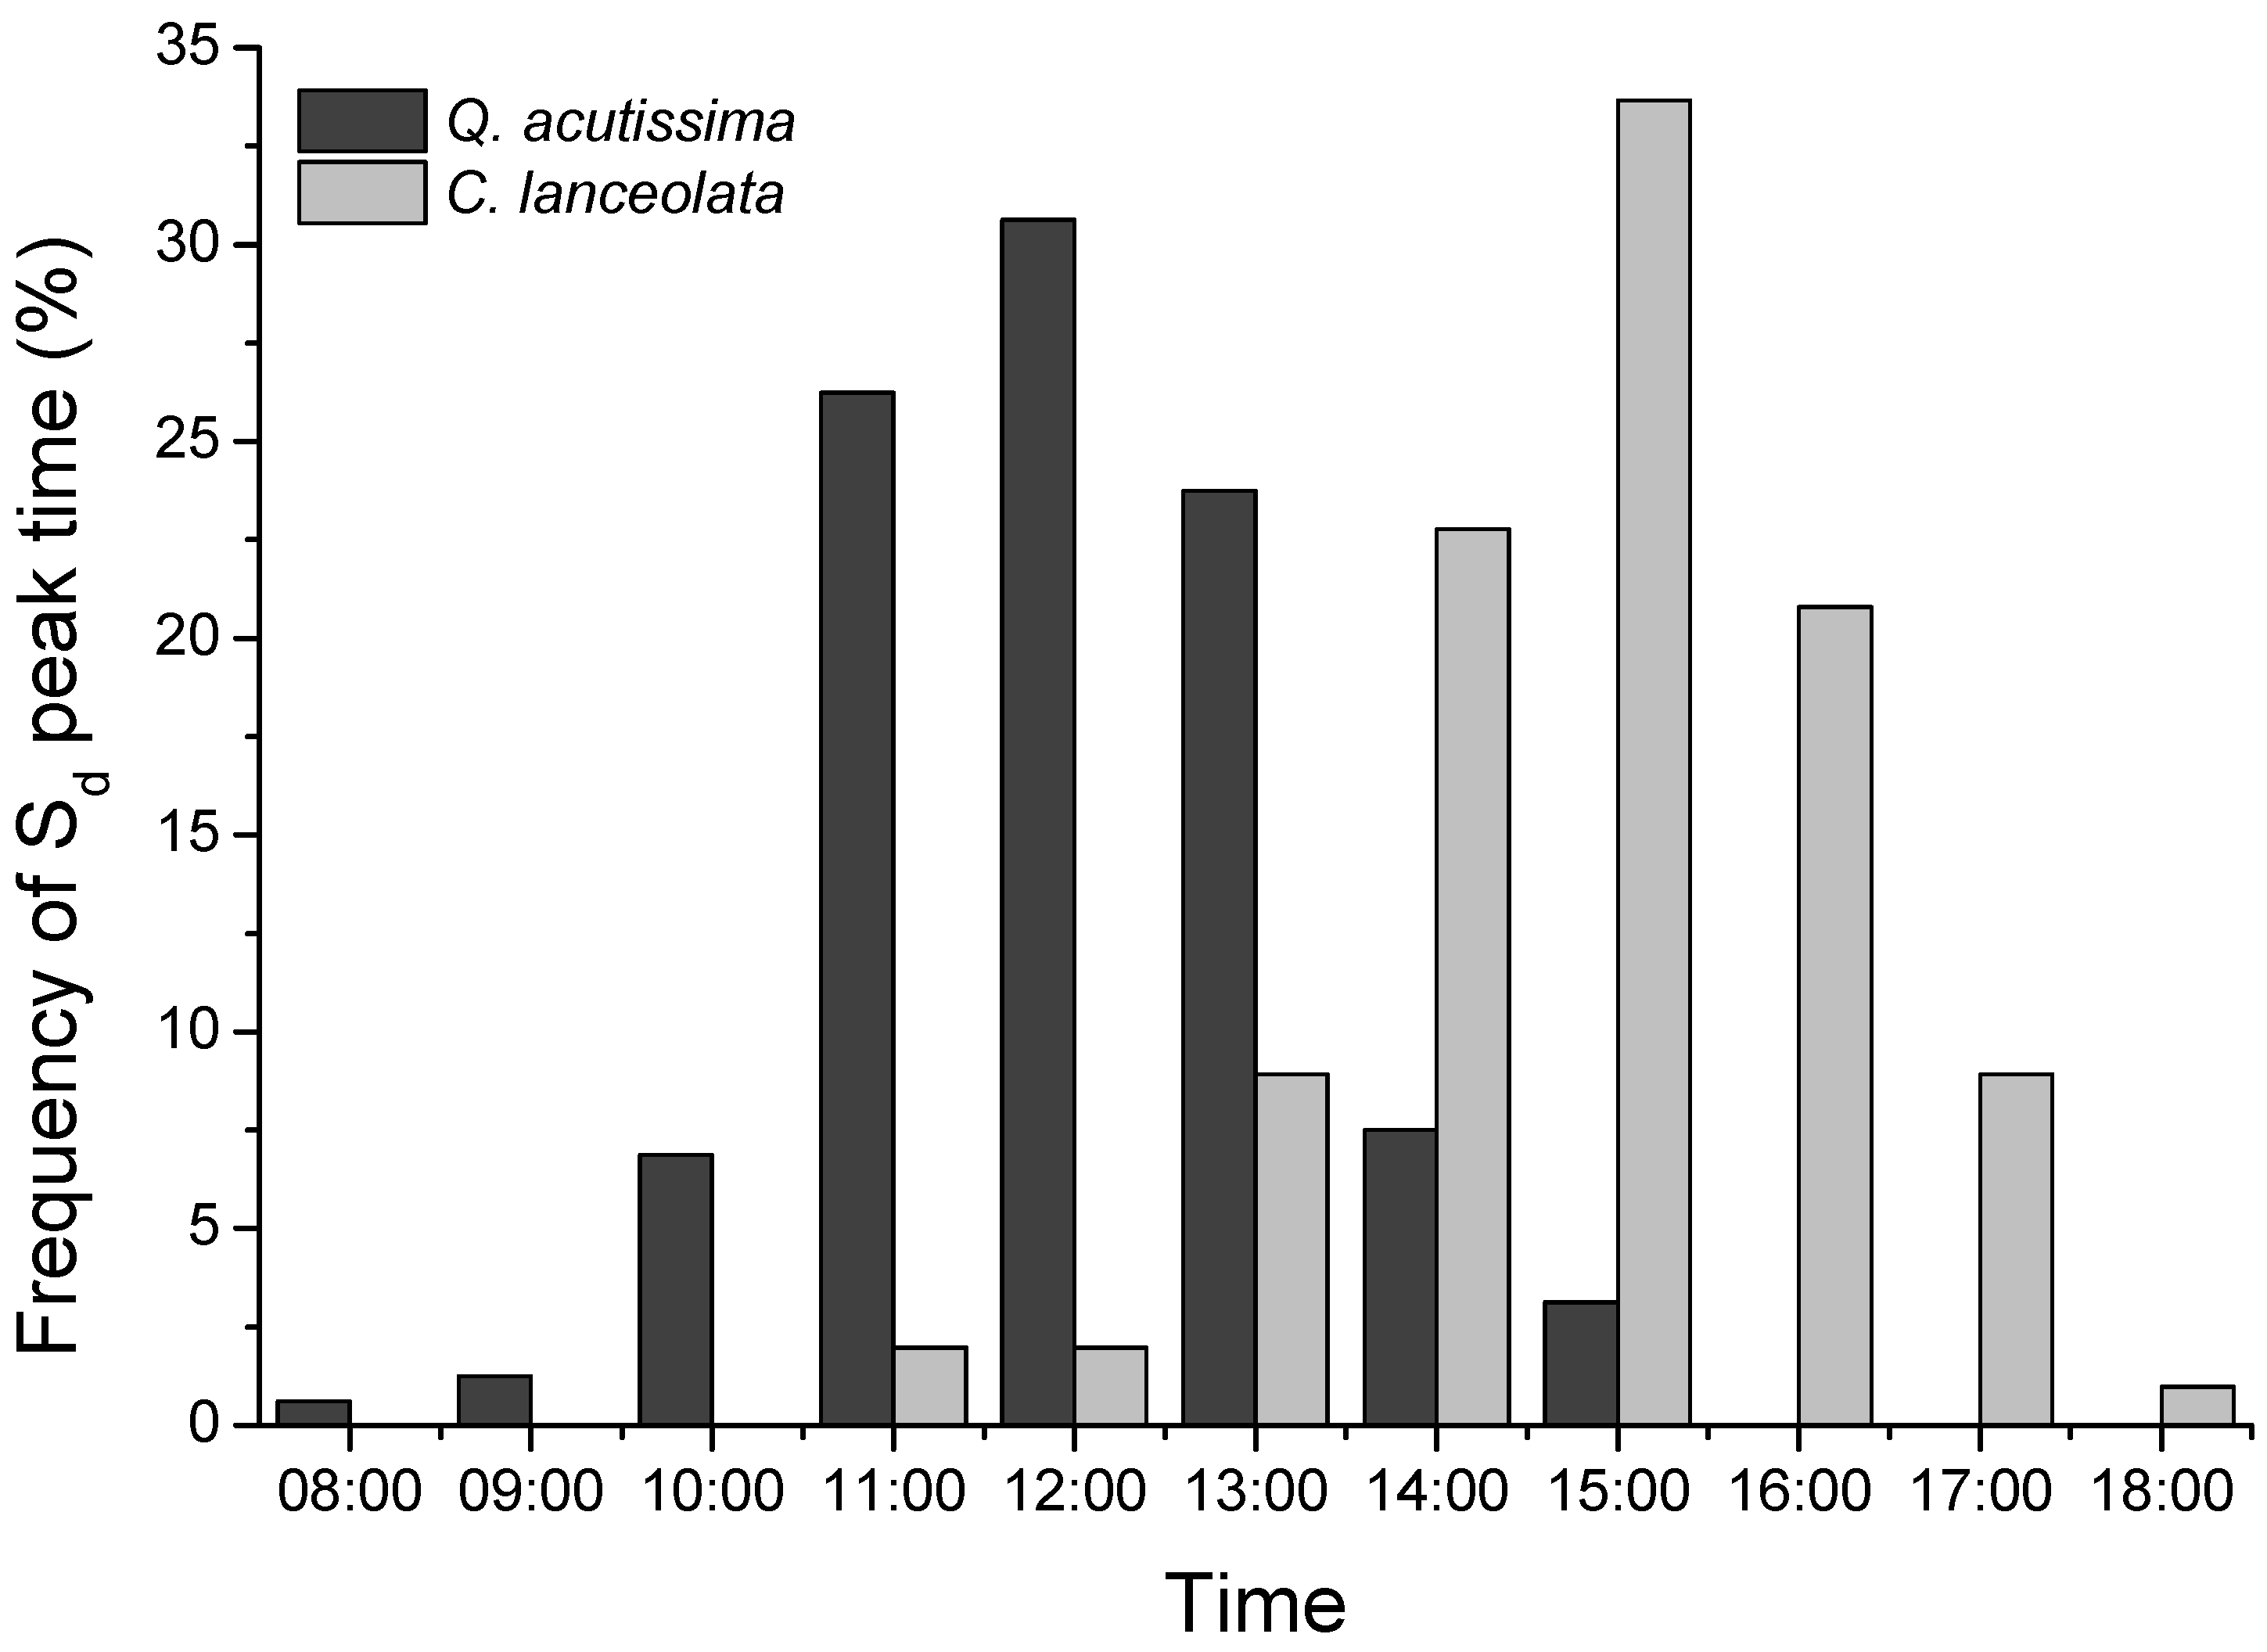
3.2. Sap Flow Densities

Q. acutissima is a deciduous species, and C. lanceolata is an evergreen species. We found that the sap flow of Q. acutissima obviously rose starting on 8 April and declined starting on 20 November. The sap flow of C. lanceolata obviously rose starting in March and declined starting in December. Therefore, the data of Q. acutissima used for analyses was from 8 April to 20 November and C. lanceolata was from March to November. Mean sap flow density of the two DBH classes (Q. acutissima: ≤25.8 cm and >25.8 cm (mean DBH of Q. acutissima stand); C. lanceolata: ≤21.0 cm and >21.0 cm (mean DBH of C. lanceolata stand)), averaged over the entire study period, is shown for three seasons (Figure 4). The sap flow densities showed no significant difference between two DBH classes of Q. acutissima (SdQ) and C. lanceolata (SdC), respectively, and the SdQ was higher than that of SdC. In addition, the mean SdQ and SdC in summer were significantly higher than those of the spring and autumn. However, the mean SdQ and SdC showed no significant difference between spring and autumn.
Daytime sap flow density (Sdd) of Q. acutissima (SddQ) started at about 7:00–9:00 a.m. and presented a sustained rise along midday and usually reached a peak at 12 p.m. (Figure 5). Daytime sap flow density of C. lanceolata (SddC) started about one or two hours later than SddQ. The time that it reached the peak was about two hours later (about 3:00 p.m.). Both the sap flows for Q. acutissima and for C. lanceolata were highest in July and were lowest in November. To further clarify the differences between Q. acutissima and C. lanceolata, we calculated the frequency of the Sd peak with sunny days throughout all study periods. The results are presented in Figure 6. On 80.63% of all days over the study period, the maximum Sd (Sd,max) for Q. acutissima occurred between 11:00 a.m. and 1:00 p.m. In contrast, the most frequent occurrence of Sd,max for C. lanceolata occurred between 2:00 p.m. and 4:00 p.m. (77.23%).
Both the nocturnal sap flows of Q. acutissima and C. lanceolata were noticeable and declined slowly at 8:00 a.m.–9:00 p.m. (Figure 7). The nocturnal sap flow density (Sdn) showed a strongly declining power function relationship through nights, and all of these power functions passed the variance analysis (Table 3). The nocturnal sap flow density of Q. acutissima (SdnQ) and C. lanceolata (SdnC) was highest in April (9.30 ± 0.85 g·cm–2·d–1) and July (8.16 ± 1.21 g·cm–2·d–1), respectively. The proportions of nocturnal sap flow to the whole-day sap flow for Q. acutissima and C. lanceolata were, respectively, 2.71% (July)–12.56% (November) and 8.00% (July)–24.29% (November).
The canopy transpirations of both of Q. acutissima and C. lanceolata stands were highest in July, and the values were, respectively, 67.42 mm and 56.52 mm (Table 4). The total canopy transpirations were 315.99 mm and 303.55 mm, which were about 32.47% and 31.19% of rainfall, respectively.

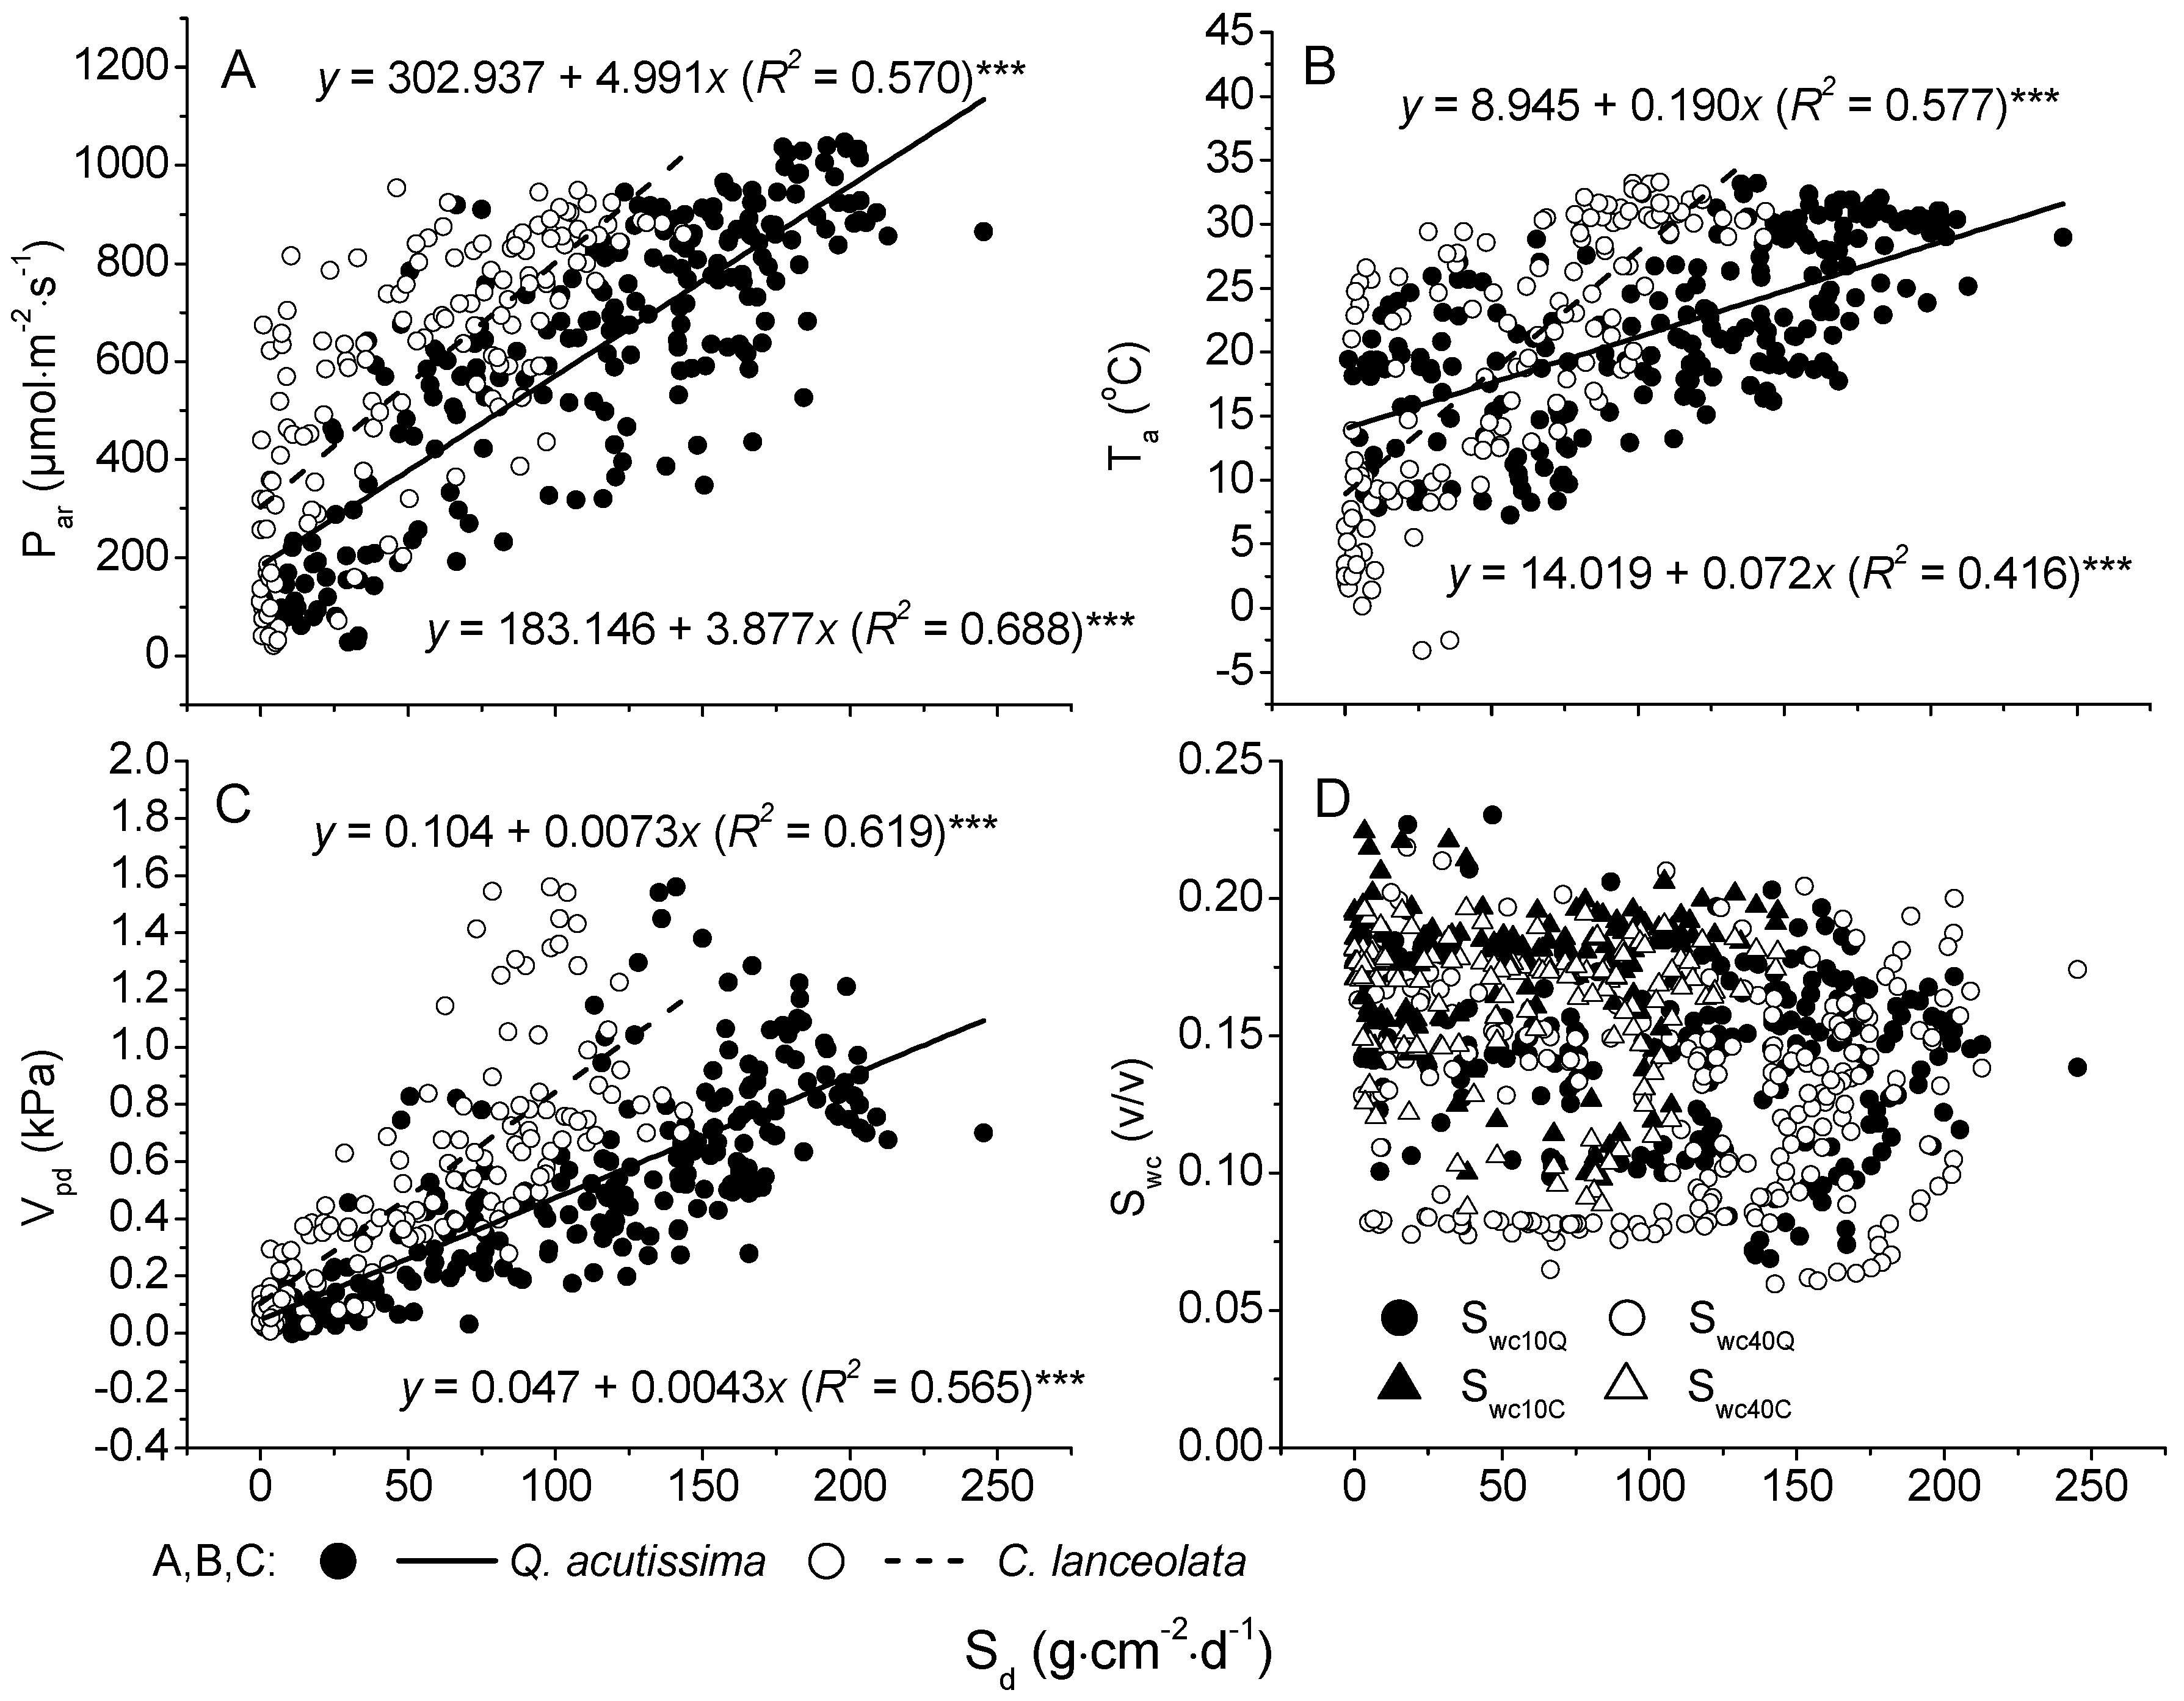
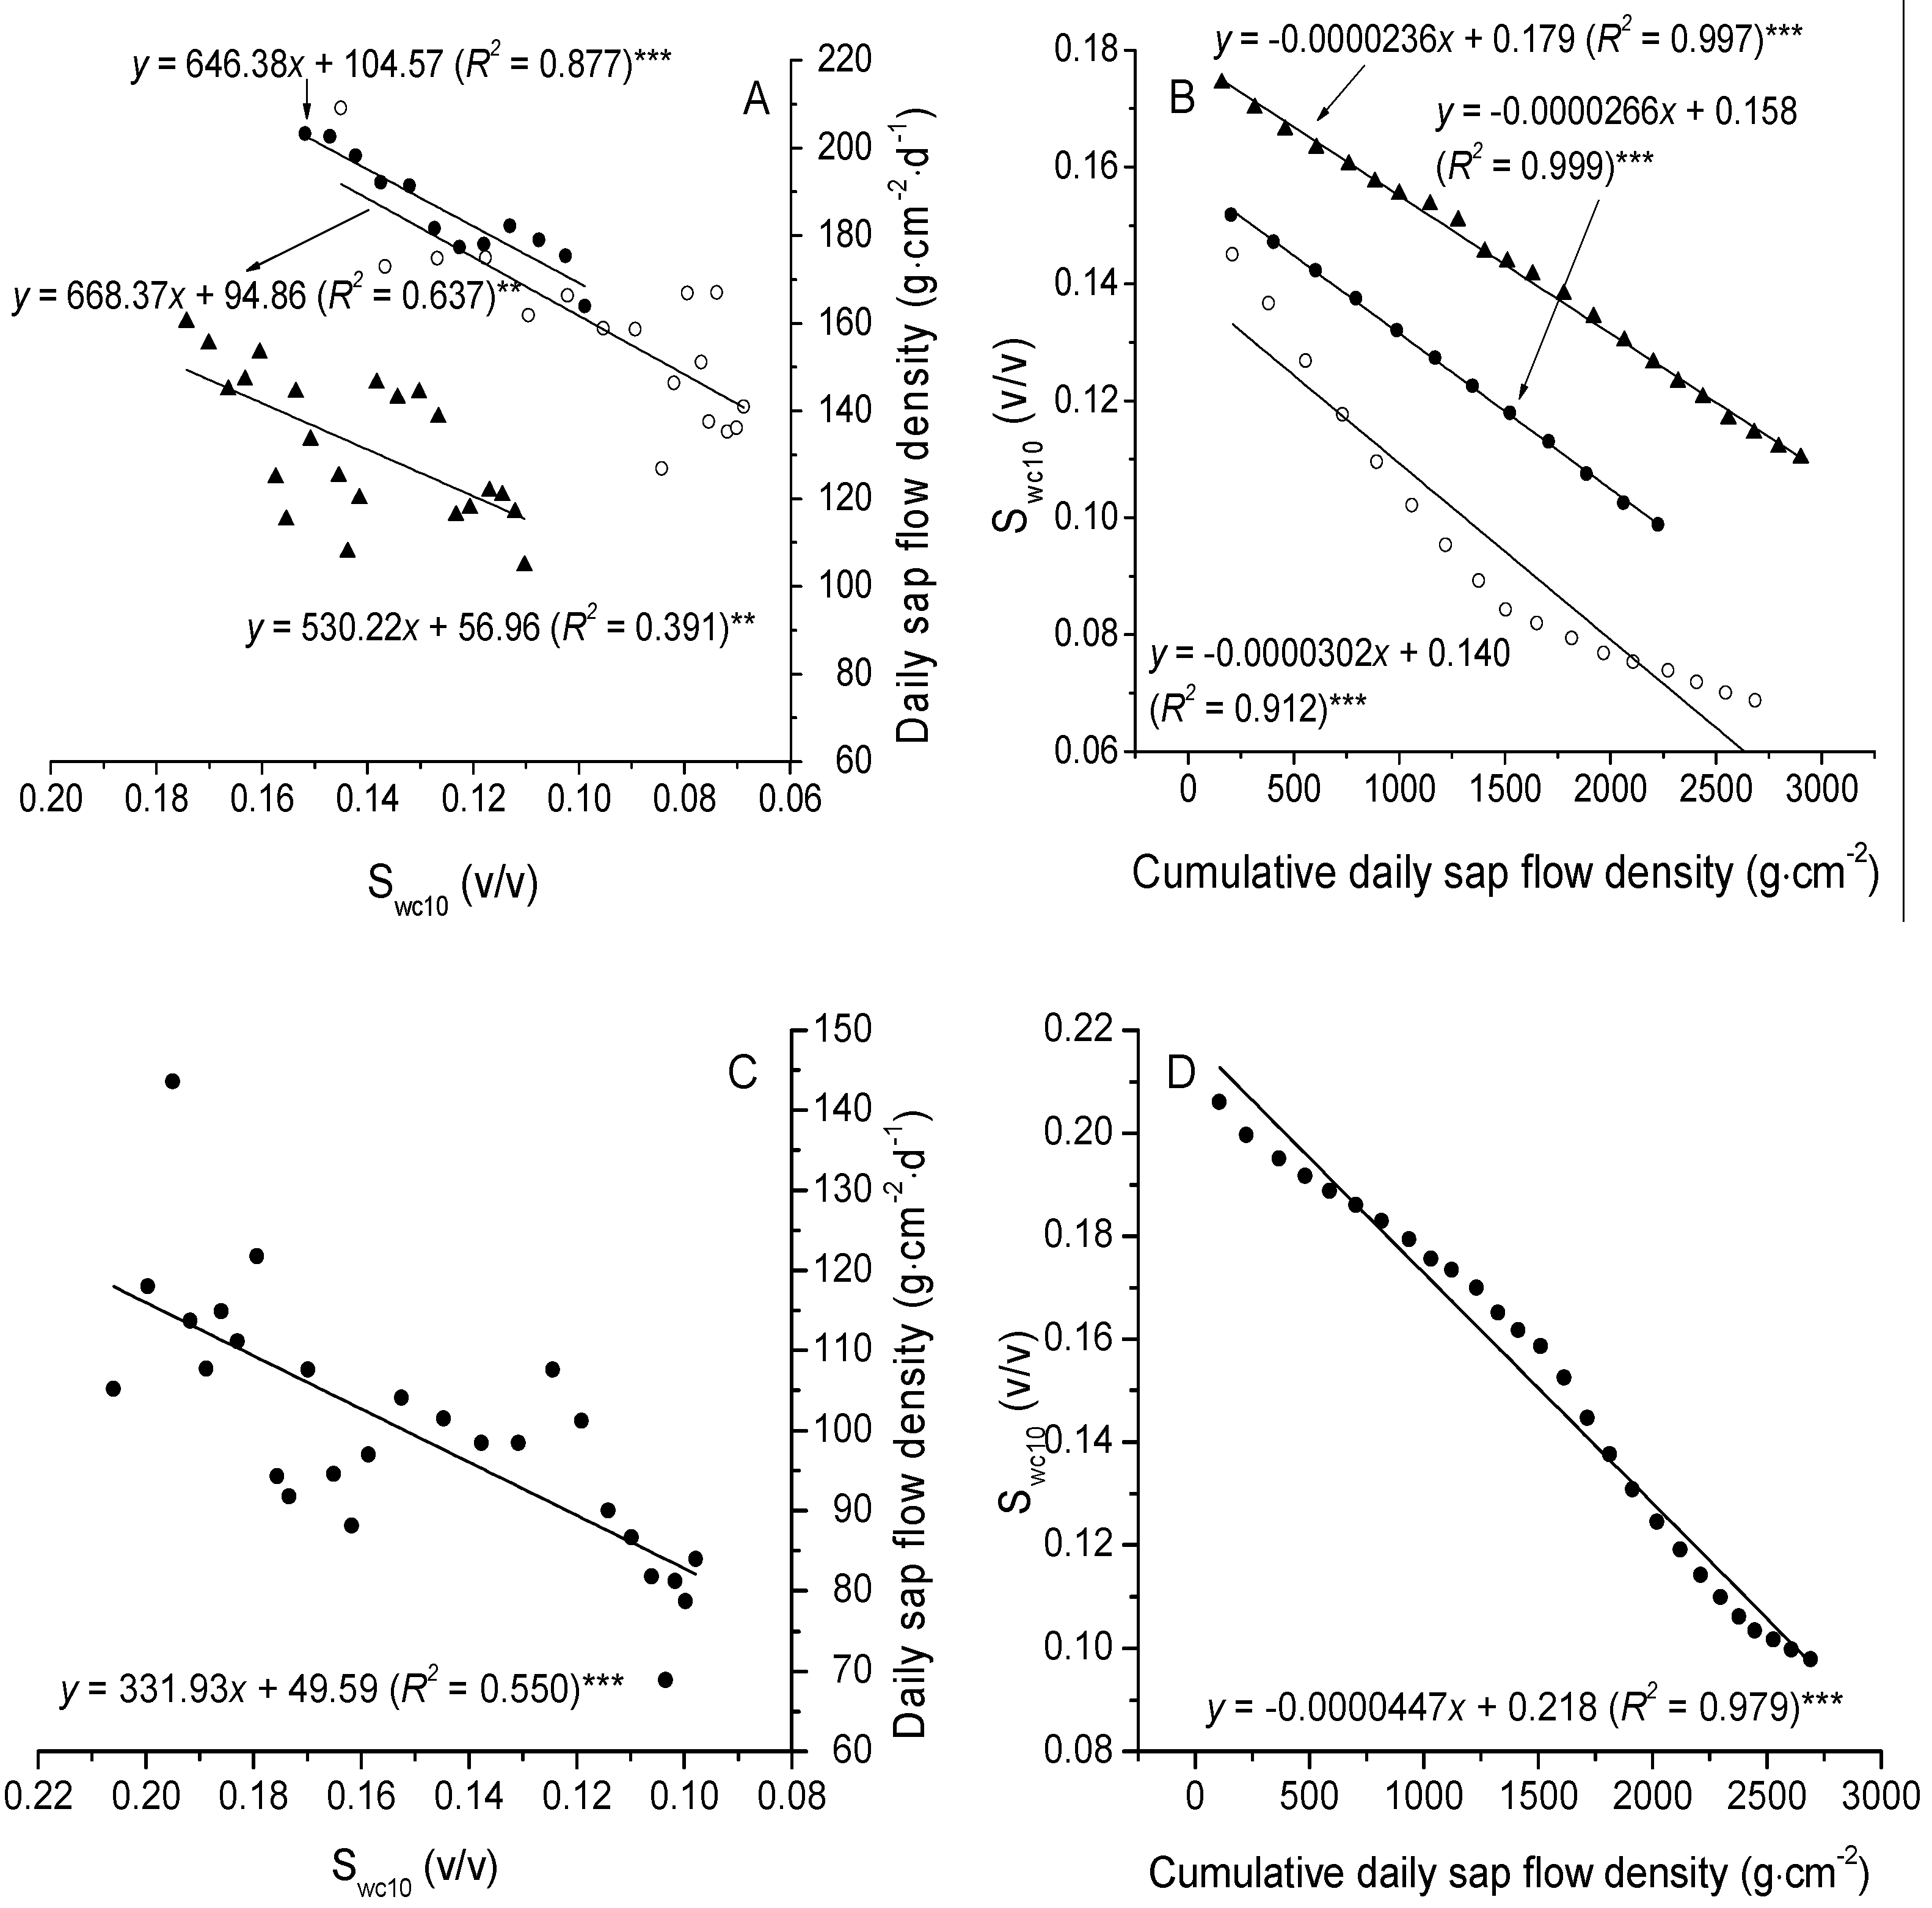
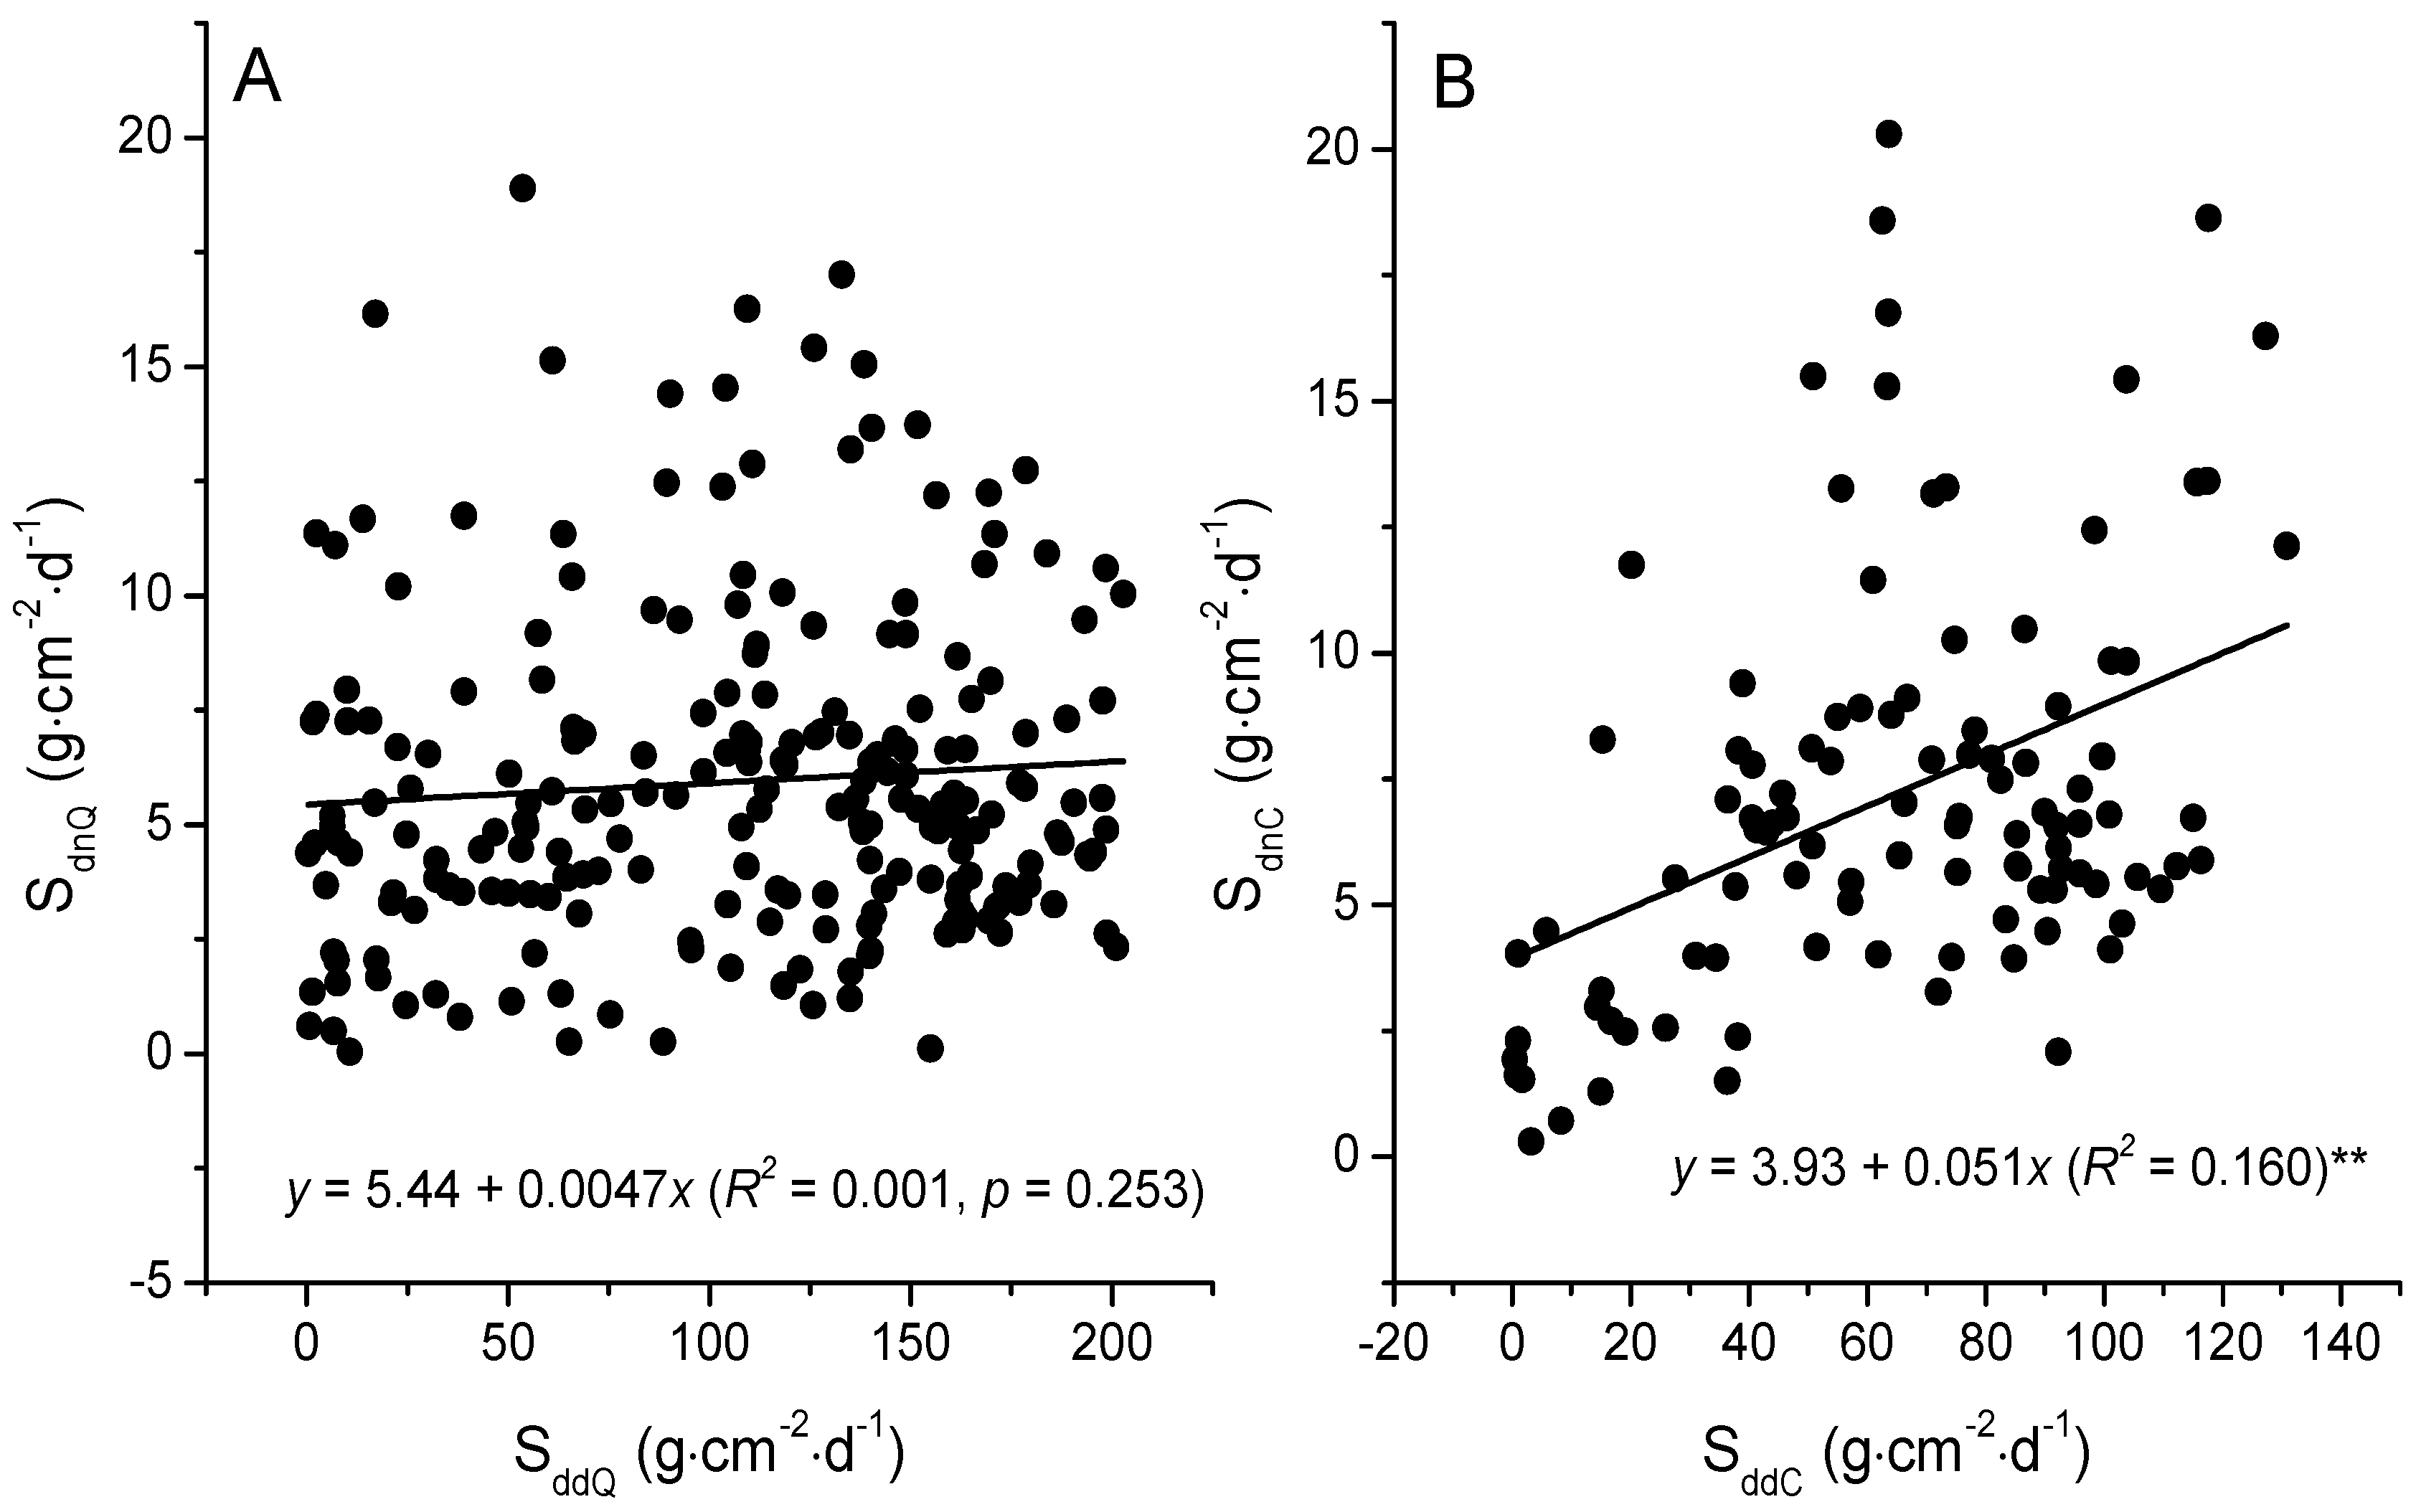
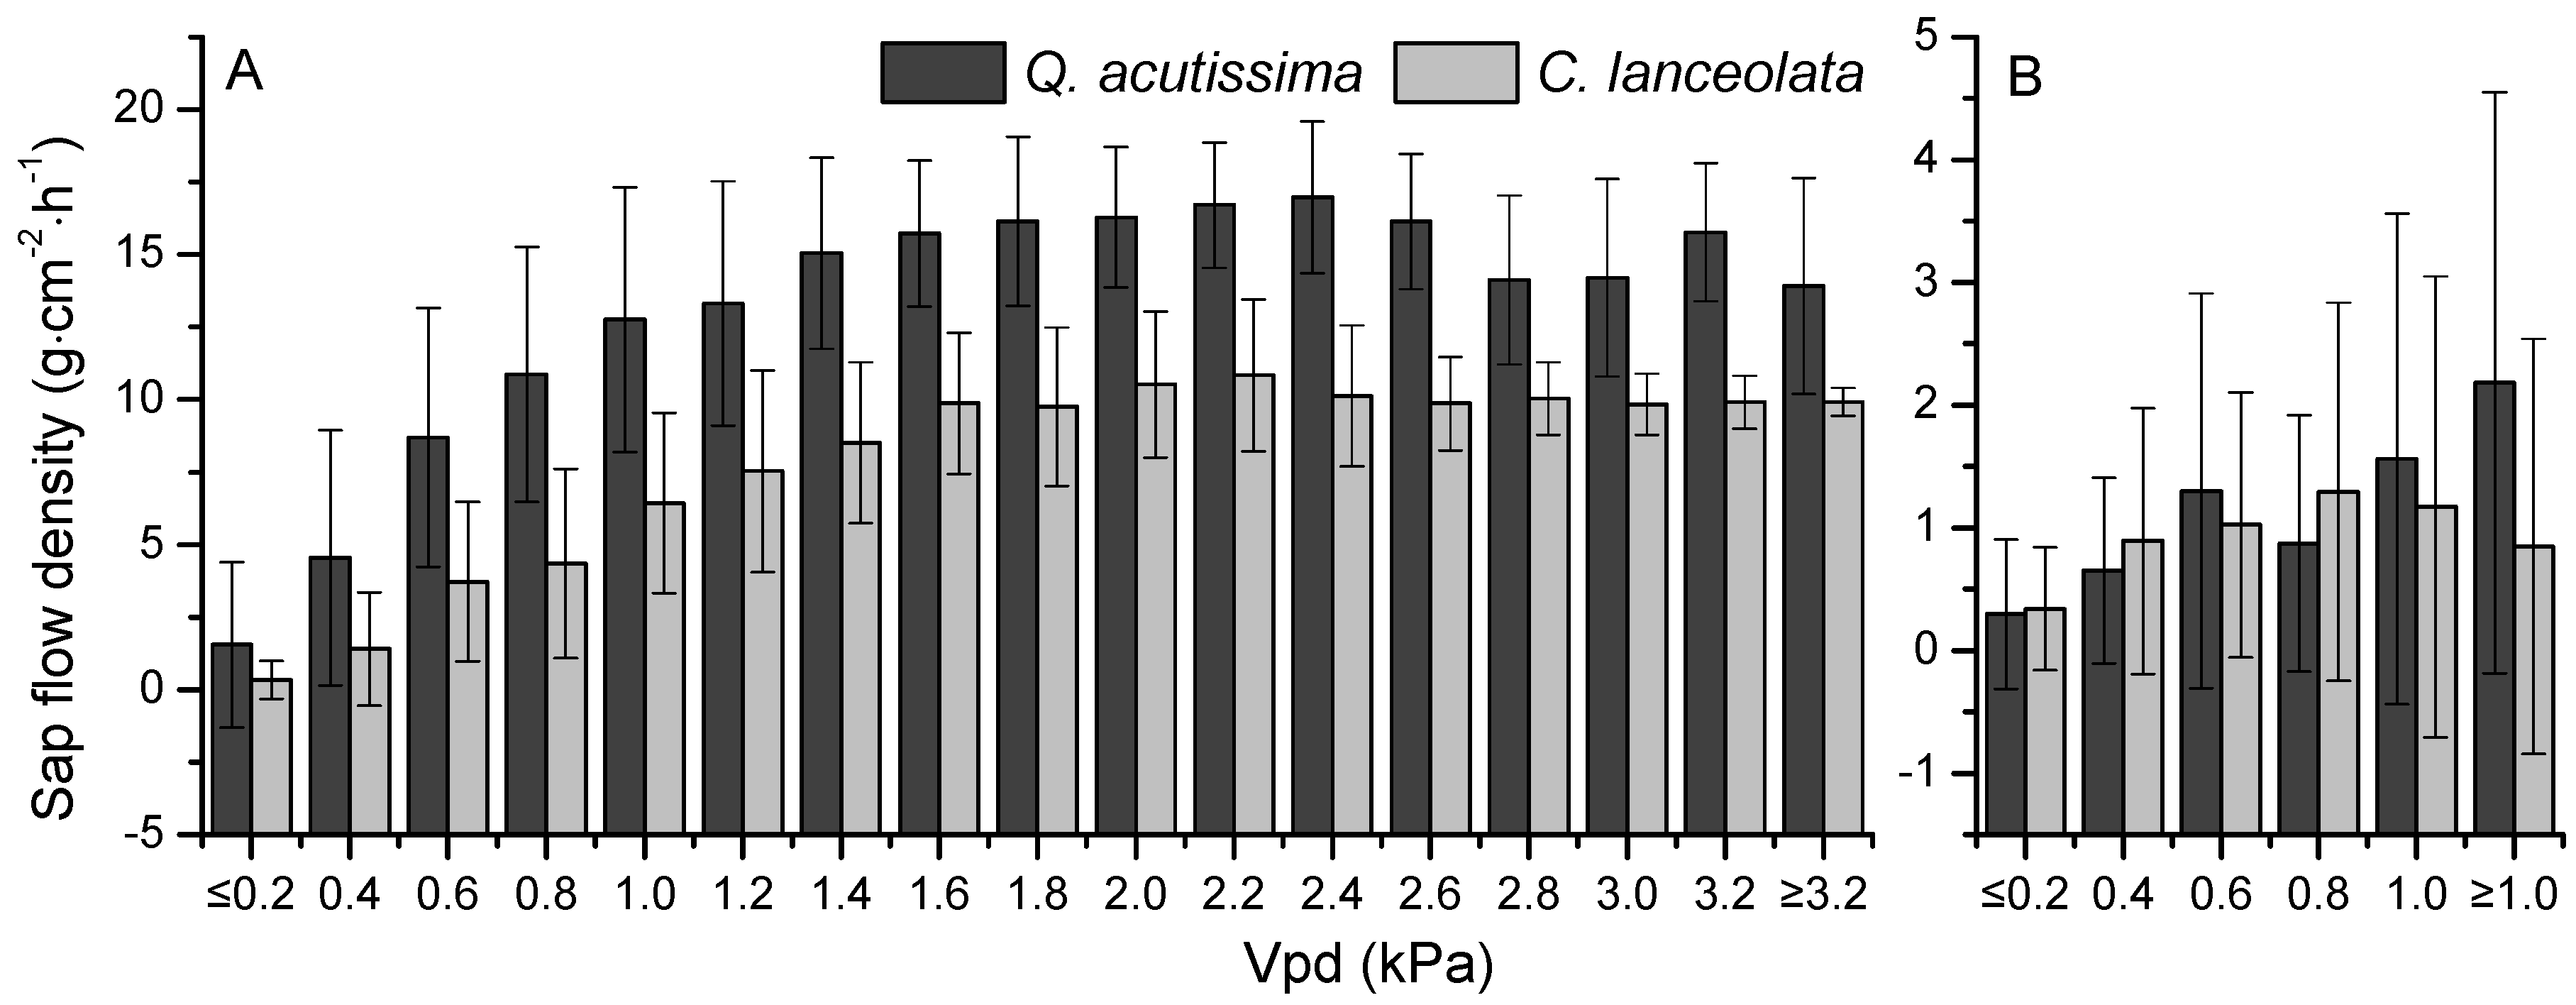
3.3. The Relationships between Sap Flow Densities and Environmental Factors

The relationship between daily sap flow density and environmental factors (Par, Ta, Vpd and Swc) in the study periods is shown in Figure 8, in which both the daily sap flow density of Q. acutissima and C. lanceolata increased with increases in Par, Ta and Vpd (Figure 8A,B,C). There were statistically-significant linear correlations between sap flow density and Par, Ta or Vpd (p < 0.001). However, there was no significant correlation between sap flow density and soil water content. To further elucidate the influence of environmental factors on sap flow density, we used the partial regression analysis (Table 5), which showed that Par explained 25.91% of the variation in daytime hourly sap flow density of Q. acutissima and that Ta was a secondary explanatory variable (20.88%). In comparison, Vpd was the main explanatory variable for both nocturnal hourly sap flow density of Q. acutissima (19.45%) and daytime hourly sap flow density of C. lanceolata (35.28%). The nocturnal sap flow density of C. lanceolata was not obviously influenced by environmental factors, and the Vpd explained only 3.88% of the variation. During the study period, the significance linear relationship between SdnC and SddC was shown in Figure 9B (p < 0.01); but no observed significant correlation of SdnQ to SddQ was found (Figure 9A).
In our study, the Par, Ta and Vpd were selected to model and calculate the daily sap flow density. The regression equations are given by:
S d Q = 0.103   P a r + 1.579   T a + 33.178   V p d   ( R 2 = 0.948 )
S d C = 0.032   P a r + 1.051   T a + 38.148   V p d   ( R 2 = 0.908 )
where S d Q and S d C are the daily sap flow density of Q. acutissima and C. lanceolata (g·cm–2·d–1), P a r is the maximum photosynthetically-active radiation (μmol·m–2·s–1), T a is the mean air temperature (°C) and V p d is the mean vapor pressure deficit (kPa).

4. Discussion

In China, there has been an increasing research focus on the sap flow characteristics in arid and semi-arid regions, where soil water is limited [39,40,41,42]. Many people think that water shortage problems only exist in arid or semi-arid regions. However, with the development of regional economy and population, water pollution has gradually increased, and many regions face the serious problem of water quality-induced water shortage [43,44], especially in the Yangtze River Delta region of China. Hence, it is also important and necessary to do research on the sap flow characteristics in water-rich regions in order to plan rational use of the water resources and manage the forest farms.
Measurements of sap flow have been widely used to study the characteristics of transpiration by using the thermal dissipation probe method (TDP) [42,45]. In our study, there was no significant difference between the two DBH classes of Q. acutissima and C. lanceolata. In spring, summer and autumn, the sap flow density of Q. acutissima was greater than that of C. lanceolata. The sap flow of Q. acutissima and C. lanceolata showed similar patterns with solar radiation, which was consistent with the research on Abies georgei [33], Quercus ilex and Phillyrea latifolia [46]. SddQ started at about 7:00–9:00 a.m., presented a sustained rise during the middle of the day and usually reached a peak at 12:00 p.m. Sap flow velocity of Abies georgei increased gradually after 7:00 and reached a peak at approximately 14:00, as shown in Guo et al. [33]. SddC started later, about one or two hours than SddQ. The time that it reached the peak was about two hours later (about 3:00 p.m.). Doronila and Forster [47] and Du et al. [48] suggested that species with a peak sap flow at earlier times of the day have greater stomatal sensitivity to Vpd, which, in turn, can also affect patterns of carbon uptake and growth rates. Our study species show distinct sap flow peaks at 12:00 p.m. (Q. acutissima) and 3:00 p.m. (C. lanceolata), respectively. How these times of peak sap flow are related to stomatal opening, photosynthesis, growth rates and even patterns of species co-existence and interaction provides grounds for further research.
In previous studies, nocturnal sap flow has been documented in a wide range of species [16,17]. Zeppel et al. [49] used data from many ecosystems to examine the abiotic factors that may affect the Sdn and found that Sdn was higher in broad-leaved compared with needle-leaved plants and in tropical compared with temperate species. Our study also demonstrates that Sdn accounted for 2.71%–12.56% (Q. acutissima) and 8.00%–24.29% (C. lanceolata) of the whole-day sap flow throughout the study period, respectively. Sdn was higher in broad-leavedthan in evergreen plants. In addition, the proportions of Sdn in summer were lower than other seasons, which maybe because the nighttime period during spring and autumn is longer than summer, and therefore, there is more time for nocturnal sap flow to accumulate [16]. Previous studies have also shown that Sdn accounted for up to 31%–47% of total daily sap flow in a desert ecosystem [19] and 22.6% ± 7.5% for Q. ilex and 18.2% ± 8.9% for P. latifolia in a Mediterranean ecosystem [46]. Comparing the drought regions, the Sdn proportion in the Yangtze River Delta region, with its greater water sources, was less, but it was also an important fraction to sap flow of the whole day.
As in previous studies carried out in forests [8,50,51], at our study site, sap flow was also effected by environmental factors, such as Par, Vpd and Ta. Our results indicate that sap flow density was significant linearly correlated with Par, Vpd and Ta. Chang and Zhao, studying a Qinghai spruce forest in northwestern China, reported that daily variation in sap flow was also closely related to changes in Par, Vpd and Ta, and sap flow velocity rose with increasing Par, Vpd and Ta when Par < 800 W·m−2, Vpd < 1.4 kPa and Ta < 18.0 °C [10]. Among these factors, Vpd is a well-known driver of transpiration owing to the water potential gradient and the ability of dry air to pull water from a source of higher water potential [13,19]. Wilson et al. reported that when soil water is plentiful, evaporation generally increases with vapor pressure deficit (Vpd) over a wide range of Vpd [32]. In our study, Par and Vpd explained the greatest amount of variation in daytime sap flow of Q. acutissima and C. lanceolata, respectively. In addition, Vpd and soil water content (Swc) were the abiotic drivers of nocturnal sap flow [49]. Causally, Vpd is also used to determine whether Sdn is related to either nocturnal transpiration or stem refilling [16,19,52,53]. Most studies over a wide range of forests indicate that increasing Swc is associated with increased Sdn [54]. High Swc will lead to less negative water potentials [54]. For our study site, the Vpd was the main explanatory variable for both SdnQ (19.45%) and SdnC (3.88%), and Swc10 explained 6.92% of the variation in SdnQ. In addition, the nocturnal sap flow density of C. lanceolata was influenced by the SddC (R2 = 0.160, p < 0.01, Figure 9B), but there was no significant correlation between SdnQ and SddQ (R2 = 0.01, p > 0.05, Figure 9A). The results suggest that SdnQ and SdnC were mainly used for transpiration and stem refilling, respectively.
The sap flow density increased gradually with the increase of Vpd, but the stomata usually closed with Vpd increase [55]. Chen et al. reported that low transpiration was governed by strict physiological regulation and daily Vpd exceeding 1 kPa [12]. Sap flow velocity of Qinghai spruce was heightened by increasing the Vpd when Vpd < 1.4 kPa [10]. Deng et al., studying Hedysarum scoparium in relation to environmental factors in semiarid northwestern China, reported that the minimum threshold for Vpd as a driving force was seen to be around 1.5 kPa [45]. In our study, the Sdd also increased gradually with the increase of Vpd. When Vpd < 0.6 kPa, it increased significantly. When the Vpd > 1.6 kPa, Sdd increased just a little higher than Vpd in the interval 1.4 kPa ≤ Vpd < 1.6 kPa (Figure 10A). When the Vpd > 2.4 kPa (Vpd > 2.2 kPa), the SddQ (SddC) decreased with the increase of Vpd. During the nighttime, the Vpd in this site ranged from 0–1.5 kPa. When 0.6 < Vpd ≤ 0.8kPa, the SdnQ decreased and then increased when Vpd > 1.0 kPa (Figure 10B). However, when the Vpd > 1.0 kPa, the SdnC decreased. Our studies were carried out on SddQ and SddC in the Yangtze River Delta region where optimal Vpd values reached 2.4 kPa and 2.2 kPa, respectively.
With these fluctuating rain events, the soil water content frequently increased and diminished (Figure 3E,F). Light rain events (≤10 mm) were most frequent and had the greatest influence on total rainfall in our study site. In a temperate deciduous forest of Korea, the relationship between sap flow of Quercus serrata Thunb change and Swc was relatively strong during the drought period, and this relationship was stronger during sunny days [38]. Zhang et al. reported that there was no obvious relationship between monthly sap flow and monthly Swc during the full-leaf periods in a semi-arid black locust plantation, Loess Plateau, China [41]. On the contrary, in aridnorthwestern China, Chang et al. had established a logistic functional relationship between sap flow and Swc. Sap flow showed an increasing tendency when Swc was increasing, which explained 84% of the variation in sap flow velocity and exhibited great sensitivity [10]. In our study, there was no significant correlation between both SdQ and SdC (all data) with Swc, because the soil is usually moist during rainy days (115 rain days), when sap flow is low as a result of low Par, Vpd and Ta, which determines the energy available for transpiration [38]. However, in the continuous sunny days (Figure 11), the correlation coefficients between the daily sap flow and soil water contents display very strong positive correlations (Figure 11A,C), which indicates that sap flow decreased with the Swc decreased. Figure 11B,D show that soil water contents gradually decreased with the increase of the cumulative sap flow. All of these results supported the conclusion that transpiration and soil water content influence each other.

5. Conclusions

Q. acutissima and C. lanceolata are two important, fast-growing, commercial tree species that have been extensively used for vegetation restoration, water conservation and building artificial forests in the Yangtze River Delta region of China. The sap flow densities of trees with different DBH show no significant difference. The sap flow density showed distinct patterns in daytime and nighttime, and SdC reached the peak time about two hours later than SdQ. Par (25.91%) and Vpd (35.28%) explained the greatest amount of variation in daytime sap flow of Q. acutissima and C. lanceolata, respectively. The amount of nocturnal sap flow was noticeable; the proportions of nocturnal sap flow for Q. acutissima and C. lanceolata were, respectively, 2.71%–12.56% and 8.00%–24.29%. The total canopy transpirations of the Q. acutissima and C. lanceolata stands were 315.99 mm and 303.55 mm, which were about 32.47% and 31.19% of rainfall, respectively. The results of this study can be used to estimate the transpiration of Q. acutissima and C. lanceolata by the regression equations with environmental factors in the Yangtze River Delta region of China.

Acknowledgments

Financial support for this study by the National Natural Science Foundation of China (Grant No. 31470709, 31200534), the National Special Fund for Forestry Scientific Research in the Public Interest (Grant No. 201504406), the Priority Academic Program Development of Jiangsu Higher Education Institutions (PAPD) and the Doctorate Fellowship Foundation of Nanjing Forestry University is gratefully acknowledged. We would thank Prof. Donald L. DeAngelis, from the Biological Resources Division U.S. Geological Survey, for his valuable comments and suggestions that have greatly improved the quality of this manuscript.

Author Contributions

J.C.Z. and J.Y.Z. conceived of and designed the experiments. X.L., C.H. and W.R.Z. performed the experiments. B.Z., X.L. and L.Z. analyzed the data. X.L. wrote the paper.

Conflicts of Interest

The authors declare no conflict of interest.

References

  1. Baumgarten, M.; Weis, W.; Kühn, A.; May, K.; Matyssek, R. Forest transpiration-targeted through xylem sap flux assessment versus hydrological modeling. Eur. J. For. Res. 2014, 133, 677–690. [Google Scholar] [CrossRef]
  2. Ehrler, W.L.; Nakayama, F.S.; Bavel, C.V. Cyclic changes in water balance and transpiration of cotton leaves in a steady environment. Physiol. Plant 1965, 18, 766–775. [Google Scholar] [CrossRef]
  3. Belmans, C.; Wesseling, J.G.; Feddes, R.A. Simulation model of the water balance of a cropped soil: SWATRE. J. Hydrol. 1983, 63, 271–286. [Google Scholar] [CrossRef]
  4. Schlesinger, W.H.; Jasechko, S. Transpiration in the global water cycle. Agric. For. Meteorol. 2014, 189, 115–117. [Google Scholar] [CrossRef]
  5. Manoli, G.; Domec, J.C.; Novick, K.; Oishi, A.C.; Noormets, A.; Marani, M.; Katul, G. Soil-plant-atmosphere conditions regulating convective cloud formation above southeastern US pine plantations. Glob. Change Biol. 2016, 22, 2238–2254. [Google Scholar] [CrossRef] [PubMed]
  6. Tor-ngern, P.; Oren, R.; Oishi, A.C.; Uebelherr, J.M.; Palmroth, S.; Tarvainen, L.; Näsholm, T. Ecophysiological variation of transpiration of pine forests: Synthesis of new and published results. Ecol. Appl. 2017, 27, 118–133. [Google Scholar] [CrossRef] [PubMed]
  7. Reed, K.L.; Waring, R.H. Coupling of environment to plant response: A simulation model of transpiration. Ecology 1974, 55, 62–72. [Google Scholar] [CrossRef]
  8. Brito, P.; Lorenzo, J.R.; González-Rodríguez, Á.M.; Morales, D.; Wieser, G.; Jiménez, M.S. Canopy transpiration of a semi arid Pinus canariensis forest at a treeline ecotone in two hydrologically contrasting years. Agric. For. Meteorol. 2015, 201, 120–127. [Google Scholar] [CrossRef]
  9. Chen, L.; Zhang, Z.; Zha, T.; Mo, K.; Zhang, Y.; Fang, X. Soil water affects transpiration response to rainfall and vapor pressure deficit in poplar plantation. New For. 2014, 45, 235–250. [Google Scholar] [CrossRef]
  10. Chang, X.; Zhao, W.; He, Z. Radial pattern of sap flow and response to microclimate and soil moisture in Qinghai spruce (Picea crassifolia) in the upper Heihe River Basin of arid northwestern China. Agric. For. Meteorol. 2014, 187, 14–21. [Google Scholar] [CrossRef]
  11. Haijun, L.; Cohen, S.; Lemcoff, J.H.; Israeli, Y.; Tanny, J. Sap flow, canopy conductance and microclimate in a banana screenhouse. Agric. For. Meteorol. 2015, 201, 165–175. [Google Scholar] [CrossRef]
  12. Chen, D.; Wang, Y.; Liu, S.; Wei, X.; Wang, X. Response of relative sap flow to meteorological factors under different soil moisture conditions in rainfed jujube (Ziziphus jujuba Mill.) plantations in semiarid Northwest China. Agric. Water Manag. 2014, 136, 23–33. [Google Scholar] [CrossRef]
  13. Monteith, J.L. Evaporation and environment. Symp. Soc. Experimental Biol. 1964, 19, 205–234. [Google Scholar]
  14. Ritchie, J.T. Atmospheric and soil water influences on the plant water balance. Agric. Meteorol. 1974, 14, 183–198. [Google Scholar] [CrossRef]
  15. Caird, M.A.; Richards, J.H.; Donovan, L.A. Nighttime stomatal conductance and transpiration in C3 and C4 plants. Plant Physiol. 2007, 143, 4–10. [Google Scholar] [CrossRef] [PubMed]
  16. Forster, M.A. How significant is nocturnal sap flow? Tree Physiol. 2014, 34, 757–765. [Google Scholar] [CrossRef] [PubMed]
  17. Dawson, T.E.; Burgess, S.S.; Tu, K.P.; Oliveira, R.S.; Santiago, L.S.; Fisher, J.B.; Ambrose, A.R. Nighttime transpiration in woody plants from contrasting ecosystems. Tree Physiol. 2007, 27, 561–575. [Google Scholar] [CrossRef] [PubMed]
  18. Herrera, A.; Ballestrini, C.; Tezara, W. Nocturnal sap flow in the C3-CAM species, Clusia minor. Trees 2008, 22, 491–497. [Google Scholar] [CrossRef]
  19. Si, J.; Feng, Q.; Yu, T.; Zhao, C. Nighttime sap flow and its driving forces for Populus euphratica in a desert riparian forest, Northwest China. J. Arid Land 2015, 7, 665–674. [Google Scholar] [CrossRef]
  20. Daley, M.J.; Phillips, N.G. Interspecific variation in nighttime transpiration and stomatal conductance in a mixed New England deciduous forest. Tree Physiol. 2006, 26, 411–419. [Google Scholar] [CrossRef] [PubMed]
  21. Caird, M.A.; Richards, J.H.; Hsiao, T.C. Significant transpirational water loss occurs throughout the night in field-grown tomato. Funct. Plant Biol. 2007, 34, 172–177. [Google Scholar] [CrossRef]
  22. Tian, D.; Fang, X.; Xiang, W. Carbon density of the Chinese fir plantation ecosystem at Huitong, Hu'nan Province. Acta Ecol. Sin. 2004, 24, 2382–2386. (In Chinese) [Google Scholar]
  23. Shi, Z.; Li, Y.; Wang, S.; Wang, G.; Ruan, H.; He, R.; Zhang, Z. Accelerated soil CO2 efflux after conversion from secondary oak forest to pine plantation in southeastern China. Ecol.Res. 2009, 24, 1257–1265. [Google Scholar] [CrossRef]
  24. Chen, H. Phosphatase activity and P fractions in soils of an 18-year-old Chinese fir (Cunninghamia lanceolata) plantation. For. Ecol. Manag. 2003, 178, 301–310. [Google Scholar] [CrossRef]
  25. Yang, Y.S.; Guo, J.; Chen, G.; Xie, J.; Gao, R.; Li, Z.; Jin, Z. Carbon and nitrogen pools in Chinese fir and evergreen broadleaved forests and changes associated with felling and burning in mid-subtropical China. For. Ecol. Manag. 2005, 216, 216–226. [Google Scholar] [CrossRef]
  26. Kim, Y.W.; Youn, Y.; Noh, E.R.; Kim, J.C. Somatic embryogenesis and plant regeneration from immature embryos of five families of Quercus acutissima. Plant Cell Rep. 1997, 16, 869–873. [Google Scholar] [CrossRef]
  27. Zhang, Y.Y.; Fang, Y.M.; Mukui, K.Y.; Li, X.X.; Xia, T. Molecular characterization and genetic structure of Quercus acutissima germplasm in China using microsatellites. Mol. Biol. Rep. 2013, 40, 4083–4090. [Google Scholar] [CrossRef] [PubMed]
  28. Dye, P.J. Climate, forest and stream flow relationships in South African afforested catchments. Commonw. For. Rev. 1996, 75, 31–38. [Google Scholar]
  29. Feng, R.F.; Yang, W.Q.; Zhang, J. Artificial forest management for global change mitigation. Acta Ecol. Sin. 2006, 26, 3870–3877. (In Chinese) [Google Scholar]
  30. Benyon, R.G.; Marcar, N.E.; Crawford, D.F.; Nicholson, A.T. Growth and water use of Eucalyptus camaldulensis and E.occidentalis on a saline discharge site near Wellington, NSW, Australia. Agric. Water Manag. 1999, 39, 229–244. [Google Scholar] [CrossRef]
  31. Zhao, Z.H.; Kang, W.X.; Tian, D.L.; Xiang, W.H.; Yan, W.D. Sap flow rate and its relationship with environmental factors of Chinese fir plantation in Huitong, Hunan Province. Sci. Silvae Sin. 2009, 45, 127–132. (In Chinese) [Google Scholar]
  32. Wilson, K.B.; Hanson, P.J.; Mulholland, P.J.; Baldocchi, D.D.; Wullschleger, S.D. A comparison of methods for determining forest evapotranspiration and its components: Sap-flow, soil water budget, eddy covariance and catchment water balance. Agric. For. Meteorol. 2001, 106, 153–168. [Google Scholar] [CrossRef]
  33. Guo, Q.Q.; Zhang, W.H. Sap flow of Abies georgei var. smithii and its relationship with the environment factors in the Tibetan subalpine region, China. J. Mt. Sci. 2015, 12, 1373–1382. [Google Scholar] [CrossRef]
  34. Granier, A. Evaluation of transpiration in a Douglas-fir stand by means of sap flow measurements. Tree Physiol. 1987, 3, 309–320. [Google Scholar] [CrossRef] [PubMed]
  35. Zeppel, M.J.; Tissue, D.; Taylor, D.T.; Macinnis-Ng, C.M.; Eamus, D. Rates of nocturnal transpiration in two evergreen temperate woodland species with differing water-use strategies. Tree Physiol. 2010, 30, 988–1000. [Google Scholar] [CrossRef] [PubMed]
  36. Peng, X.; Fan, J.; Wang, Q.; Warrington, D. Discrepancy of sap flow in Salix matsudana grown under different soil textures in the water-wind erosion crisscross region on the Loess Plateau. Plant Soil 2015, 390, 383–399. [Google Scholar] [CrossRef]
  37. Oishi, A.C.; Oren, R.; Stoy, P.C. Estimating components of forest evapotranspiration: A footprint approach for scaling sap flux measurements. Agric. For. Meteorol. 2008, 148, 1719–1732. [Google Scholar] [CrossRef]
  38. Laiju, N.; Otieno, D.; Jung, E.Y.; Lee, B.; Tenhunen, J.; Lim, J.H.; Kang, S. Environmental controls on growing-season sap flow density of Quercus serrata Thunb in a temperate deciduous forest of Korea. J. Ecol. Environ. 2012, 35, 213–225. [Google Scholar] [CrossRef]
  39. Huang, J.; Zhou, Y.; Yin, L.; Wenninger, J.; Zhang, J.; Hou, G.; Uhlenbrook, S. Climatic controls on sap flow dynamics and used water sources of Salix psammophila in a semi-arid environment in northwest China. Environ. Earth Sci. 2015, 73, 289–301. [Google Scholar] [CrossRef]
  40. Chen, L.; Zhang, Z.; Zeppel, M.; Liu, C.; Guo, J.; Zhu, J.; Zha, T. Response of transpiration to rain pulses for two tree species in a semiarid plantation. Int. J. Biometeorol. 2014, 58, 1569–1581. [Google Scholar] [CrossRef] [PubMed]
  41. Zhang, J.G.; Guan, J.H.; Shi, W.Y.; Yamanaka, N.; Du, S. Interannual variation in stand transpiration estimated by sap flow measurement in a semi-arid black locust plantation, Loess Plateau, China. Ecohydrology 2015, 8, 137–147. [Google Scholar] [CrossRef]
  42. Zheng, C.; Wang, Q. Seasonal and annual variation in transpiration of a dominant desert species, Haloxylon ammodendron, in Central Asia up-scaled from sap flow measurement. Ecohydrology 2015, 8, 948–960. [Google Scholar] [CrossRef]
  43. Zeng, Z.; Liu, J.; Savenije, H.H. A simple approach to assess water scarcity integrating water quantity and quality. Ecol. Indic. 2013, 34, 441–449. [Google Scholar] [CrossRef]
  44. Chen, Q.; Wu, W.; Blanckaert, K.; Ma, J.; Huang, G. Optimization of water quality monitoring network in a large river by combining measurements, a numerical model and matter-element analyses. J. Environ. Manag. 2012, 110, 116–124. [Google Scholar] [CrossRef] [PubMed]
  45. Deng, J.; Ding, G.; Gao, G.; Wu, B.; Zhang, Y.; Qin, S.; Fan, W. The Sap flow dynamics and response of Hedysarum scoparium to environmental factors in semiarid northwestern China. PLoS ONE 2015, 10, e0131683. [Google Scholar] [CrossRef] [PubMed]
  46. Barbeta, A.; Ogaya, R.; Peñuelas, J. Comparative study of diurnal and nocturnal sap flow of Quercus ilex and Phillyrea latifolia in a Mediterranean holm oak forest in Prades (Catalonia, NE Spain). Trees 2012, 26, 1651–1659. [Google Scholar] [CrossRef]
  47. Doronila, A.I.; Forster, M.A. Performance measurement via sap flow monitoring of three Eucalyptus species for mine site and dryland salinity phytoremediation. Int. J. Phytoremediation. 2015, 17, 101–108. [Google Scholar] [CrossRef] [PubMed]
  48. Du, S.; Wang, Y.; Kume, T.; Zhang, J.; Otsuki, K.; Yamanaka, N.; Liu, G. Sap flow characteristics and climatic responses in three forest species in the semiarid Loess Plateau region of China. Agric. For. Meteorol. 2011, 151, 1–10. [Google Scholar] [CrossRef]
  49. Zeppel, M.J.B.; Lewis, J.D.; Phillips, N.G.; Tissue, D.T. Consequences of nocturnal water loss: A synthesis of regulating factors and implications for capacitance, embolism and use in models. Tree Physiol. 2014, 34, 1047–1055. [Google Scholar] [CrossRef] [PubMed]
  50. Dragoni, D.; Lakso, A.N.; Piccioni, R.M. Transpiration of apple trees in a humid climate using heat pulse sap flow gauges calibrated with whole-canopy gas exchange chambers. Agric. For. Meteorol. 2005, 130, 85–94. [Google Scholar] [CrossRef]
  51. Liu, C.; Du, T.; Li, F.; Kang, S.; Li, S.; Tong, L. Trunk sap flow characteristics during two growth stages of apple tree and its relationships with affecting factors in an arid region of northwest China. Agric. Water Manag. 2012, 104, 193–202. [Google Scholar] [CrossRef]
  52. Rosado, B.H.; Oliveira, R.S.; Joly, C.A.; Aidar, M.P.; Burgess, S.S. Diversity in nighttime transpiration behavior of woody species of the Atlantic Rain Forest, Brazil. Agric. For. Meteorol. 2012, 158, 13–20. [Google Scholar] [CrossRef]
  53. Gao, J.; Zhou, J.; Sun, Z.; Niu, J.; Zhou, C.; Gu, D.; Zhao, P. Suppression of nighttime sap flux with lower stem photosynthesis in Eucalyptus trees. Int. J. Biometeorol. 2016, 60, 545–556. [Google Scholar] [CrossRef] [PubMed]
  54. Fuentes, S.; Mahadevan, M.; Bonada, M.; Skewes, M.A.; Cox, J.W. Night-time sap flow is parabolically linked to midday water potential for field-grown almond trees. Irrig. Sci. 2013, 31, 1265–1276. [Google Scholar] [CrossRef]
  55. Nakano, S.; Tacarindua, C.R.; Nakashima, K.; Homma, K.; Shiraiwa, T. Evaluation of the effects of increasing temperature on the transpiration rate and canopy conductance of soybean by using the sap flow method. J. Agric. Meteorol. 2015, 71, 98–105. [Google Scholar] [CrossRef]
Figure 1. The annual mean air temperature and precipitation of Nanjing from 2000–2015.
Forests 08 00074 g001
Figure 2. The relationship between diameter at breast height (DBH) and sapwood area (SA). *** Significant correlation at p < 0.001.
Forests 08 00074 g002
Figure 3. Seasonal course of daily maximum photosynthetically-active radiation (Par) (A), daily mean air temperature (Ta) (B), mean air relative humidity (Rh) (C), mean vapor pressure deficit (Vpd) (D), daily sum of precipitation (P) (E) and daily mean soil water content (Swc) (F) between 9 September 2012 and 8 August 2013.
Forests 08 00074 g003
Figure 4. Values of sap flow density (g·cm–2·h–1) for each DBH class for four seasons. Error bars show 95% confidence intervals. Vertical columns with the same uppercase (Q. acutissima) or lowercase (C. lanceolata) letters are not significantly different from each other at p < 0.05 according to the Tukey tests.
Forests 08 00074 g004
Figure 5. Daily variations of averaged sap flow density in different months.
Forests 08 00074 g005
Figure 6. The frequency of time of maximum sap flow density. Data were from the entire sampling period on days with no rainfall.
Forests 08 00074 g006
Figure 7. Daily variations of averaged nocturnal sap flow density in different months.
Forests 08 00074 g007
Figure 8. The linear relationship between daily sap flow density and environmental factors. *** Significant correlation at p < 0.001.
Forests 08 00074 g008
Figure 9. The relationships between daytime sap flow density (Sdd) and nocturnal sap flow density (Sdn). (A) Q. acutissima; (B) C. lanceolata. ** Significant correlation at p < 0.01.
Forests 08 00074 g009
Figure 10. Values of sap flow density ((A) daytime and (B) nighttime) for each Vpd stage.
Forests 08 00074 g010
Figure 11. Relations between soil water content and daily sap flow density ((A) Q. acutissima and (C) C. lanceolata) and cumulative daily sap flow density ((B) Q. acutissima and (D) C. lanceolata) during continuously sunny periods. The relationship between sap flow density with Swc40 was the same as with Swc10. ** and *** mean significant correlation at p < 0.01 and p < 0.001, respectively.
Forests 08 00074 g011
Table 1. Basic parameters of the samples in the two forests.
No.DBH (mm)Depth (mm) and AspectsSA (cm2)DBH (mm)Depth (mm) and AspectsSA (cm2)
Q. acutissimaC. lanceolata
11870–25 at N142.69 1220–20 at N73.64
22000–25 at N166.49 1370–20 at N92.14
32420–25 at N257.86 1880–20 at N169.86
42520–25 at N282.97 1960–20 at N184.11
52680–25 at N325.91 2040–20 at N198.92
62780–25 at N354.50 2080–20 at N206.52
73080–25 at N448.49 2150–20 at N220.17
83180–25 at N482.61 2180–20 at N226.15
9---2230–20 at N236.28
10---2270–20 at N244.54
11---2490–20 at N292.42
DBH, diameter at breast height (1.3m); SA, sapwood area; N, north.
Table 2. The distribution of rainfall during our study period.
The Percentage of AmountsThe Percentage of Events
<10 mm26.86%77.39%
10–25 mm23.28%14.78%
25–50 mm16.67%4.35%
50–100 mm19.93%2.61%
>100 mm13.26%0.87%
Table 3. The change trends of nocturnal sap flow density from sunset to sunrise.
MonthQ. acutissimaR2C. lanceolataR2
March//y = 3.438 n–1.570.927
Aprily = 3.281 n–1.040.978y = 2.889 n–1.180.979
Mayy = 2.274 n–1.080.986//
Juney = 2.037 n–1.110.929y = 1.878 n–0.960.932
Julyy = 1.468 n–0.940.937y = 2.547 n–-0.870.986
Augusty = 1.497 n–0.690.937y = 2.671 n–1.160.979
Septembery = 1.351 n–0.930.829y = 3.861 n–1.760.951
Octobery = 2.268 n–1.090.975y = 7.988 n–2.310.883
Novembery = 1.041 n–0.810.882y = 1.428 n–1.140.862
The time from sunset to sunrise: March and September (7 p.m.–6 a.m., n = 1–12); April and May (7 p.m.–5 a.m., n = 1–11); June and August (8 p.m.–5 a.m., n = 1–10); July (8 p.m.–4 a.m., n = 1–9); October and November (6 p.m.–6 a.m., n = 1–13); n is the integer.
Table 4. The canopy transpiration of the stands from March–November (mm).
MonthQ. acutissimaC. lanceolata
March/25.25
April28.1827.46
May41.1643.34
June40.2335.47
July62.7256.52
August58.1039.71
September40.5738.56
October33.5228.87
November11.498.38
Total315.99303.55
Table 5. Partial regression analysis of sap flow density versus various explanatory factors.
FactorsSddQSdnQSddCSdnC
PCVE (%)PCVE (%)PCVE (%)PCVE (%)
Par0.5125.91 –0.070.49
Ta0.4620.880.010.000.256.450.090.76
Vpd0.266.710.4419.450.5935.280.203.88
Swc100.080.670.266.920.060.350.000.00
Swc40–0.050.23–0.141.930.030.08–0.010.01
SddQ, daytime sap flow density of Q. acutissima; SdnQ, nocturnal sap flow density of Q. acutissima; SddC, daytime sap flow density of C. lanceolata; SdnC, nocturnal sap flow density of C. lanceolata; PC, partial correlation; VE, variance explained.

