Next Article in Journal
Climate Impacts on Soil Carbon Processes along an Elevation Gradient in the Tropical Luquillo Experimental Forest
Next Article in Special Issue
Mixed-Species Effects on Soil C and N Stocks, C/N Ratio and pH Using a Transboundary Approach in Adjacent Common Garden Douglas-Fir and Beech Stands
Previous Article in Journal
Landscape Structure and Mature Forest Biodiversity in Wet Eucalypt Forests: A Spatial Analysis of Timber Production Areas in South-Eastern Australia
 
 
Correction published on 27 September 2017, see Forests 2017, 8(10), 366.
Article

Tree Species Identity Shapes Earthworm Communities

1
Department of Applied Biosciences, Faculty of Bioscience Engineering, Ghent University, Valentin Vaerwyckweg 1, 9000 Gent, Belgium
2
Forest & Nature Lab, Department of Forest and Water Management, Faculty of Bioscience Engineering, Geraardsbergsesteenweg 267, 9090 Gontrode, Belgium
3
Department of Geosciences and Natural Resource Management, University of Copenhagen, Rolighedsvej 23, DK-1958 Frederiksberg C, Denmark
4
Division of Forest, Nature and Landscape, Department of Earth & Environmental Sciences, KU Leuven, Celestijnenlaan 200 E, Box 2411, 3001 Leuven, Belgium
5
Faculty of Science and Technology, University College Ghent, Brusselsesteenweg 161, 9090 Melle, Belgium
*
Author to whom correspondence should be addressed.
Forests 2017, 8(3), 85; https://doi.org/10.3390/f8030085
Submission received: 25 January 2017 / Revised: 10 March 2017 / Accepted: 13 March 2017 / Published: 17 March 2017
(This article belongs to the Special Issue Tree Species, as Major Drivers of Forest Ecosystems Functioning)

Abstract

:
Earthworms are key organisms in forest ecosystems because they incorporate organic material into the soil and affect the activity of other soil organisms. Here, we investigated how tree species affect earthworm communities via litter and soil characteristics. In a 36-year old common garden experiment, replicated six times over Denmark, six tree species were planted in blocks: sycamore maple (Acer pseudoplatanus), beech (Fagus sylvatica), ash (Fraxinus excelsior), Norway spruce (Picea abies), pedunculate oak (Quercus robur) and lime (Tilia cordata). We studied the chemical characteristics of soil and foliar litter, and determined the forest floor turnover rate and the density and biomass of the earthworm species occurring in the stands. Tree species significantly affected earthworm communities via leaf litter and/or soil characteristics. Anecic earthworms were abundant under Fraxinus, Acer and Tilia, which is related to calcium-rich litter and low soil acidification. Epigeic earthworms were indifferent to calcium content in leaf litter and were shown to be mainly related to soil moisture content and litter C:P ratios. Almost no earthworms were found in Picea stands, likely because of the combined effects of recalcitrant litter, low pH and low soil moisture content.

Graphical Abstract

1. Introduction

Earthworms have been studied for a long time (e.g., Darwin [1]), and it is known that soil and forest floor characteristics profoundly affect the composition and abundance of earthworm populations [2,3,4]. On the other hand, earthworms are ecosystem engineers [5,6] that can physically, chemically and biologically modify their environment, impacting the habitat and the resources for other organisms [7,8,9] and consequently providing a wide diversity of ecosystem services including facilitation of nutrient cycling and formation of stable humic compounds [6] and mineral soil C sequestration [10,11].
Earthworm species all have distinct feeding niches varying from fresh leaf litter to humus and even animal dung, fungal hyphae or soil [12]. The simultaneous occurrence of species from different ecological groups can have synergistic outcomes, and loss of species can lead to significant changes in the ecosystem services they provide [13].
Earthworm species can be classified according to their morphological features, habitat choice and feeding habits into three ecological groups: epigeic, endogeic and anecic earthworms (Figure 1, [14]). First, epigeic earthworms, or ‘litter-dwellers’, are detrivorous species feeding mainly on fresh or partially decomposed litter on or near the soil surface. They contribute to litter fragmentation, but have too little muscular power to enter the mineral soil. Given the important organic acid production in accumulating forest floors, most epigeic species are tolerant to acid conditions [15]. For example, Dendrobaena octaedra can occur in Pinus, Picea or Fagus stands with soil pHH2O of less than 4.0 [16,17].
Secondly, endogeic earthworms, or ‘soil-dwellers’, are geophagous earthworms feeding on largely humified soil organic matter and dead roots. They are literally eating their way through the shallow soil and, thereby, ingesting large quantities of soil and mixing this with organic material, i.e., bioturbation [12]. Most of these species are very sensitive to soil acidification [15,17], for example, the fitness of Aporrectodea caliginosa declined in acid soils (pHH2O < 4.8, [18]).
Thirdly, anecic earthworms, or ‘deep-burrowers’, are also detrivorous but differ from epigeic earthworms by their ability to create deep vertical burrows in the mineral soil. They can pull leaf litter from the soil surface into their burrows. The anecic species Lumbricus terrestris is known for removing significant quantities of litter from the forest floor [12] while casts are mainly deposited at the soil surface [19]. This species can occur in a broad pH-range (pHH2O 4.0–7.2 [17,20]) of soil acidity but main occurrence of the anecic species Aporrectodea longa and Lumbricus terrestris is at pHH2O above 4.6 [21].
In forests, the environmental factors that regulate earthworm communities include litter traits and soil characteristics, mainly clay content, pH, base saturation, soil moisture content, organic matter content and aluminium (Al) toxicity [2,23]. Soil pH correlates strongly positively with soil calcium (Ca) and negatively with soil Al concentration, and is among the most important drivers for anecic and endogeic earthworms, i.e., the burrowing earthworm community. A study in multiple Fagus sylvatica stands on a gradient from acid to limestone soils showed that burrowing earthworm densities were most strongly positively linked with the presence of a limestone layer and almost absent from Ca-poor soils [24].
Tree species can significantly modify most of these soil characteristics [25,26,27,28]. For instance, N2-fixing tree species as Alnus glutinosa with high nitrification rates can acidify the topsoil, which hampers the activity of burrowing earthworms despite the high nutrient content of alder litter [27]. It is known that the quality of litter as a substrate for earthworms increases with N, P, K, Ca, and Mg concentrations and decreases with increasing lignin, lignin:N, and C:N ratios [29]. Tree species can reinforce patterns of soil fertility through positive and/or negative litter feedbacks on earthworm activity and the rate of nutrient cycling [30]. For example, several common garden experiments have shown that in just a few decades, tree species with slowly decomposing litter of poor quality for earthworms as Picea abies, Fagus sylvatica and Quercus robur acidify soils and create humus forms very different from those under species with fast decomposing nutrient-rich litter such as Fraxinus excelsior, Acer pseudoplatanus and Tilia cordata [27,31,32]. The latter tree species thus lead to a higher earthworm species diversity and total earthworm biomass (4–6 species, 11–37 g·m−2) compared to species with more nutrient-poor litter (1–2 species, 0–4 g·m−2[33]).
Epigeic and anecic earthworm species seem to be mainly affected by litter traits while endogeic earthworm species are affected by soil characteristics [23]. However, it seems that these patterns depend on the soil context. For example, it was shown in acidic soils that endogeic earthworms were also significantly linked with several litter quality characteristics such as N, Mg and Ca concentration [34].
Here we investigate the effect of six common European tree species with diverging litter quality on earthworm communities. We used a 36-year-old common garden experiment with sites distributed across Denmark to verify how the identity of tree species results in very different earthworm community assemblages. This replicated common garden experiment has previously revealed tree species effects on C and N stocks in the forest floor and mineral soil [35], soil respiration and soil organic C turnover [36] and on N cycling and leaching and the water budget [37]. We aim to broaden the understanding of plant–soil interactions in this common garden experiment by combining existing data on various litter quality characteristics and forest floor turnover rate with new data on soil biogeochemistry and earthworm communities. We expected the tree species to also affect the earthworm communities via altered soil and litter quality characteristics. We also assumed the need to look beyond the response of rough earthworm ecological categories, and rather focus on species-specific responses to varying litter and soil characteristics. We further discuss how our results can be used in the practice of forestry and in light of ongoing global changes.

2. Materials and Methods

2.1. Common Garden

This study was carried out in a 36-year-old common garden experiment replicated in six sites in Denmark (Appendix A). Two out of six study sites (Kragelund and Mattrup) were former agricultural land while the other sites were previously forested with Fagus sylvatica since the beginning of the 19th century. Each site was planted with 0.25 ha adjacent unreplicated monoculture stands of six common European tree species: Acer pseudoplatanus L., Fagus sylvatica L., Fraxinus excelsior L., Picea abies (L.) H. Karst., Quercus robur L. and Tilia cordata Mill., except for Vallø, where the Fraxinus stand establishment failed due to deer browsing. For further details on the setup of this common garden experiment, we refer to Table 1 in [35].

2.2. Soil Sampling and Analyses

In each stand, we randomly selected three representative plots of 0.25 m2 (total number of plots = 105) where we assessed earthworm density and biomass in October 2009 with a minimum distance of 10 m from the stand border. In each plot, three soil cores were combined into one composite soil sample for each of three depths below the forest floor (0–0.05 m, 0.05–0.15 m and 0.15–0.3 m). Soil moisture content was measured gravimetrically by the weight difference before and after drying to constant weight at 40 °C. After sieving (2 mm sieve), soil pH-KCl was determined in a 1:5 soil/KCl solution (1 M) with a glass electrode (Ross Sure-flow 8172). The exchangeable concentrations of K+, Na+, Mg2+, Ca2+ and Al3+ were measured by flame atomic absorption spectrophotometry using BaCl2 (0.1 M) as extractant (ISO 11260). Effective cation exchange capacity (CEC) was calculated as the sum of K+, Na+, Mg2+, Ca2+ and Al3+, expressed in meq·kg−1. The effective base saturation (BS) was calculated by dividing the sum of the base cations (K+, Na+, Mg2+ and Ca2+) by the CEC.

2.3. Sampling and Analyses of Litter and Forest Floor

Litterfall and forest floor sampling was described in detail in Vesterdal et al. [35] and Vesterdal et al. [36]. Briefly, litterfall was collected monthly using ten circular littertraps with a diameter of 31 cm installed along two line transects. Litterfall was sampled in all species for one full year at two sites (Mattrup and Vallø) and at the remaining four sites the broadleaf species litterfall was sampled in the autumn to gauge the discrete foliar litterfall event. Annual litterfall amounts for the broadleaves were estimated by proportional upscaling using the annual litterfall amounts measured at Mattrup and Vallø. Litterfall was dried at 55 °C and hand-sorted and weighed in two fractions: foliar and non-foliar litter. Forest floor was sampled in 15 points along three line transects within each stand using a 25 cm × 25 cm wooden frame in September 2004 just before the onset of foliar litterfall for deciduous species, when forest floor mass was at a minimum. Foliar fractions of the forest floor were dried to constant weight at 55 °C before weighing. In the further analyses, we have used one value per stand for these litter and forest floor traits (n = 35).

2.4. Earthworm Sampling and Identification

In each plot, we used a combined sampling method, ensuring effective sampling of different ecological groups of earthworm species. First, the litter-dwelling specimen was collected by hand-sorting of a litter sample within a 0.25 m2 frame; then, the deep-burrowing specimen was captured at the soil surface by application of a mustard solution (60 g mustard powder in 30 L water, [38,39]) within the same 0.25 m2 frame, and 30 min after mustard extraction, the surface soil dwelling specimen was collected by hand-sorting of a soil core taken in the center of the frame (0.09 m2 with a 0.2 m depth). The earthworms were, for each of the three methods separately, collected in pots containing ethanol (95%) and after a few hours transferred to a 5% formalin solution for fixation. After three days, they were transferred back to a 95% ethanol solution for further preservation and identification. All adult earthworms were identified with the key of Sims and Gerard [15] and were subsequently categorized into three ecological groups as defined by Bouché [40] (epigeic, endogeic or anecic species). In case of individuals with missing heads or juveniles, identification at species level was not possible. We identified these individuals to genus or ecological group level and assigned them pro rata to species. There are disadvantages to this prorating method [41] but since only about half of the individuals per plot were adult, it was important to include these juvenile and unidentifiable individuals. All worms were weighed individually, including gut contents, after briefly being dried on filter paper at room temperature. We did not correct earthworm biomass for potential bias caused by the gut contents. The density and biomass of earthworms sampled by the hand-sorting method was converted to an area of 0.25 m2. Then, for each of the plots, we calculated the area-weighted sum of the number and biomass of earthworms from the three sampling methods per m2. The number of earthworms per m2 will hereafter be referred to as the earthworm density.

2.5. Calculations

2.5.1. Handling of Missing Data

The foliar litterfall data for Picea stands in Kragelund, Odsherred, Viemose and Wedellsborg was missing. Instead, we used the mean values for the mass, C, N, P, Ca, Mn, lignin from Mattrup and Vallø based on evidence of limited site effects on litterfall mass across Denmark [42].

2.5.2. Forest Floor Turnover Rate

The forest floor turnover rate (k) for the broadleaved tree species was calculated according to the following equation for discrete litterfall events [43] because these tree species mainly shed their litter from September to November [35,42]:
k = D M L i t t e r f a l l D M L i t t e r f a l l + D M F o r e s t   f l o o r
where k is the annual decay rate; DMlitterfall is the average annual foliar litterfall measured, and DMForest floor is the accumulated foliar litter layer on the forest floor.
For Picea, a tree species with continuous litterfall through the year [42], k was calculated by a different equation [43]:
k = D M L i t t e r f a l l D M F o r e s t   f l o o r

2.6. Data Analyses

All statistical analyses were performed with R [44].

2.6.1. Tree Species Effect

The effect of tree species identity on the litter (n = 35) and soil variables (n = 105) was analyzed using linear multilevel models with site as a group-level effect to account for the spatial dependence of the measurements (e.g., in R syntax response variable~Treespecies-1, random= ~1|Site; lme; package nlme [45]). Differences between tree species were tested with Tukey post-hoc tests (p < 0.05) using the function glht from the multcomp package [46]. Model fit was verified by examination of the residuals; we log-transformed the response variables in case it improved the fit (‘soil K’, ‘soil Na’, ‘soil Mg’, ‘soil Ca’, ‘soil Al’, ‘litter Mn’ and ‘forest floor mass’).
Due to the high frequency of zero’s in the earthworm response variables (25%–35% for ecological earthworm groups and more for individual species), we used generalized linear multilevel models that allowed for zero-inflation (glmmADMB; package glmmADMB [47]). A negative binomial response distribution was assumed to allow for overdispersed earthworm count data [48,49,50]. Model syntax was similar and differences between tree species were also tested with Tukey post-hoc tests in the method that was described previously.

2.6.2. Links between Litter Quality, Soil Quality and Earthworms

To explore the particular soil and litter variables underlying the overall tree species effect on earthworms (n = 105, models above), in models explaining various earthworm responses (the number of species, total, epigeic, endogeic and anecic earthworm density and biomass) we performed model selection with several soil and litter variables as predictors and site as a group-level effect (again glmmADMB allowing for zero-inflation). The included predictors, standardized by centering to the mean and rescaling by their standard deviation, were ‘soil moisture content, soil pH 0–5 cm, soil Al 0–5 cm, soil Na 0–5 cm, litter Ca, litter N, litter Mn, litter P, litter lignin, litter C:N ratio, litter C:P ratio, forest floor turnover rate and the interaction between soil Al 0–5 cm and litter Ca’. We have also included a measure for the possible interaction between litter quality and soil quality affecting earthworm communities. Leaf litter Ca concentration appears to be an important litter quality trait affecting earthworms [26,27,31]. Further, pH is an important soil quality trait for earthworm activity [23]. Since exchangeable Al concentrations are strongly linked with pH-KCl and probably affect earthworm activity (indications of its toxicity for earthworms in [51]) we also included exchangeable Al to our models. Because exchangeable Al concentration seemed to be more important than pH-KCl in our models, we selected exchangeable Al concentration as a measure for soil quality in the interaction (Soil-Al:Litter-Ca).
To check for multicollinearity, we calculated the variance inflation factors of the standardized variables in a full model. None of the variables had a variance inflation factor (VIF) >3 and therefore, we could include these terms in our model selection [52].
We performed manual stepwise forward selection of predictor terms starting with null models where only site as a group-level effect was included. We added each of the predictors, calculated the Akaike information criterion corrected for small sample sizes (AICc) [53] using AICctab (package bbmle) and continued with the model with the smallest AICc value. AICc values, Δ-AICc values and Akaike weights of the null, intermediate and final optimal models are shown in Appendix B. Predictor variables were added until the AICc was minimized and, then, we evaluated the significance of the included variables by the Wald test (p < 0.05). If these models contained only significant variables, they were retained as the final optimal models. If these models contained non-significant variables, we went back one step in the selection process. We assessed goodness of fit of the optimal models by calculating a measure for R2 describing the correlation between fitted and observed values by the r2.corr.mer function, and we further evaluated plots of residuals and fitted versus observed data. We plotted the coefficients from these models with coefplot2 (coefplot2 package).

3. Results

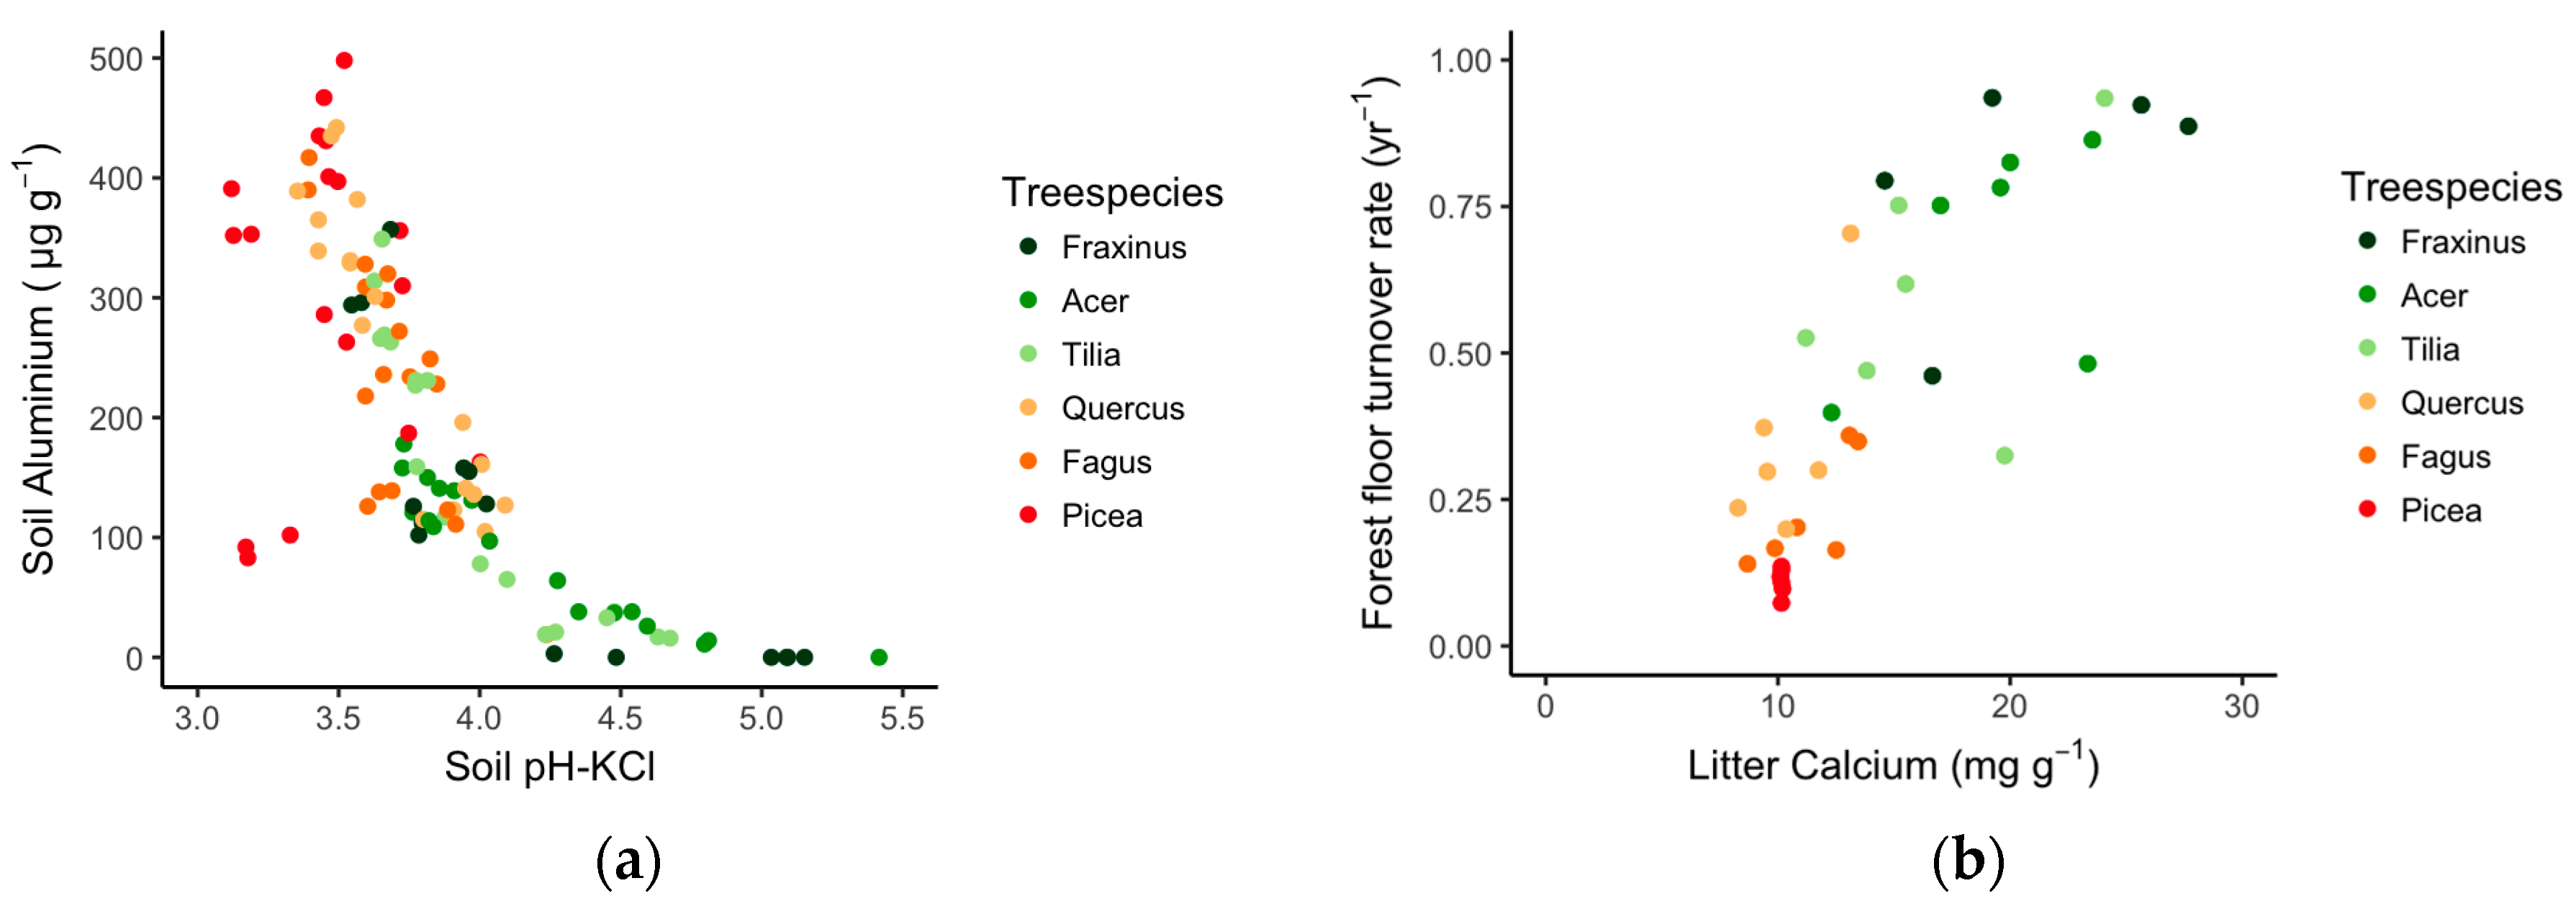
3.1. The Tree Species Effect on Soil Properties and Litter Quality

After 36 years of forestation, tree species consistently influenced all measured topsoil properties significantly across the six sites (Table 1). According to the pH (0–5 cm), the tree species could be ranked as: Fraxinus = Acer = Tilia >> Quercus = Fagus >> Picea. Picea had significantly lower soil moisture content, pH, exchangeable base cation concentrations and higher Al and Na concentrations. The tree species affected not only the topsoil (0–5 cm), as Picea stands also had significantly increased Na and Al concentrations in the deeper soil layers (5–15 cm and 15–30 cm; Appendix C) compared to the other tree species.
All measured foliar litter property variables were significantly influenced by the tree species (Table 2). Ca, Mg and K concentrations in leaf litter of Fraxinus and Acer were at least double the concentrations in leaf litter of Fagus and Picea. Lignin leaf litter concentrations were significantly higher in Picea, Tilia, Quercus and Fagus (ranging from 25% to 29%) compared to Fraxinus and Acer (on average 18%). Leaf litter of Fraxinus and Acer had significantly lower C:N ratios compared to Quercus, Picea and Fagus. Also, Mn and P in leaf litter varied significantly across tree species, with Fraxinus containing significantly lower Mn and higher P concentrations compared to the other species.
Also, the forest floor masses and turnover rates were significantly differing between the observed tree species, with Picea having the lowest forest floor turnover rate and the highest forest floor mass, and Fraxinus, Acer and Tilia stands having the highest forest floor turnover rates and lowest forest floor masses. Quercus and Fagus were found to be intermediate.

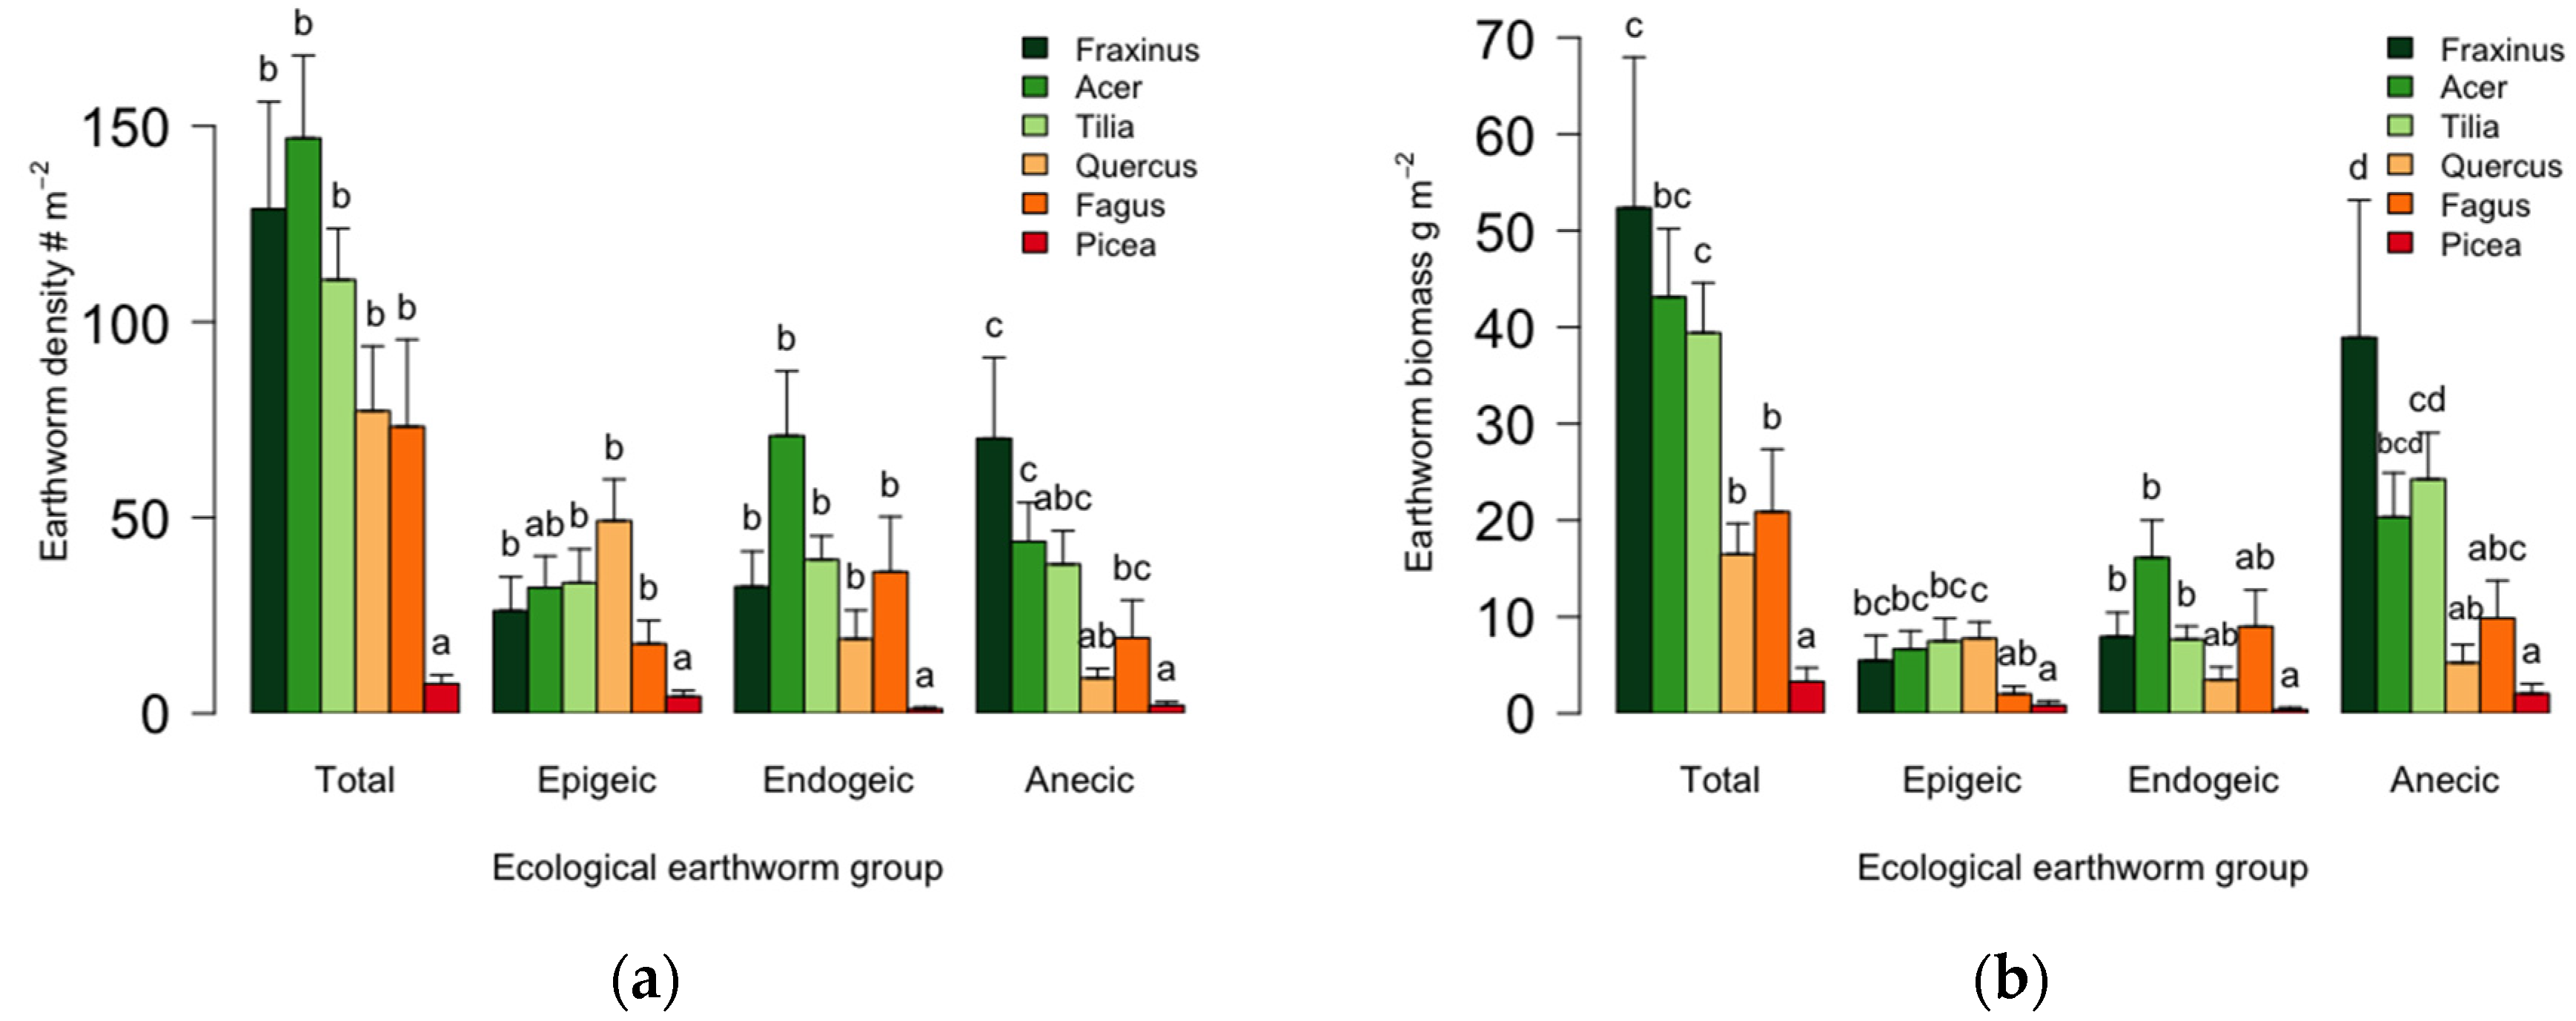
3.2. Tree Species Effect on Earthworm Populations

Over all stands and sites, we found 12 earthworm species (Table 3). Earthworm species richness in Picea plots (2 ± 2 species m−2) was significantly lower compared to Tilia (5 ± 1 species m−2), Fraxinus (4 ± 2 species m−2), Acer (4 ± 1 species m−2) and Quercus plots (4 ± 3 species m−2), while Fagus plots (3 ± 2 species m−2) were not significantly distinguished from the former tree species.
Total earthworm density in the studied plots ranged from zero to 428 individuals m−2 and total earthworm biomass amounted to maximally 202 g·m−2. Figure 2 shows the tree species-specific responses in earthworm communities. In Picea stands, earthworm populations were absent from half of the plots, and across all sites, significantly, they contained the lowest total earthworm densities and biomasses of all tree species. Quercus and Fagus stands contained, on average, an intermediate total earthworm density and biomass. The highest earthworm densities and biomasses were found in Fraxinus and Acer stands and Fraxinus and Tilia stands, respectively.
Considering the three ecological groups, we found Fraxinus, Acer and Tilia stands to have higher densities and biomasses than Picea stands for all ecological groups (Figure 2). Epigeic earthworm biomass was significantly higher in Quercus stands compared to Picea and Fagus stands. Density and biomass of endogeic earthworms were significantly higher in Acer stands than in Picea stands, while anecic earthworm density and biomass were significantly higher in Fraxinus stands compared to Quercus, Fagus and Picea stands.

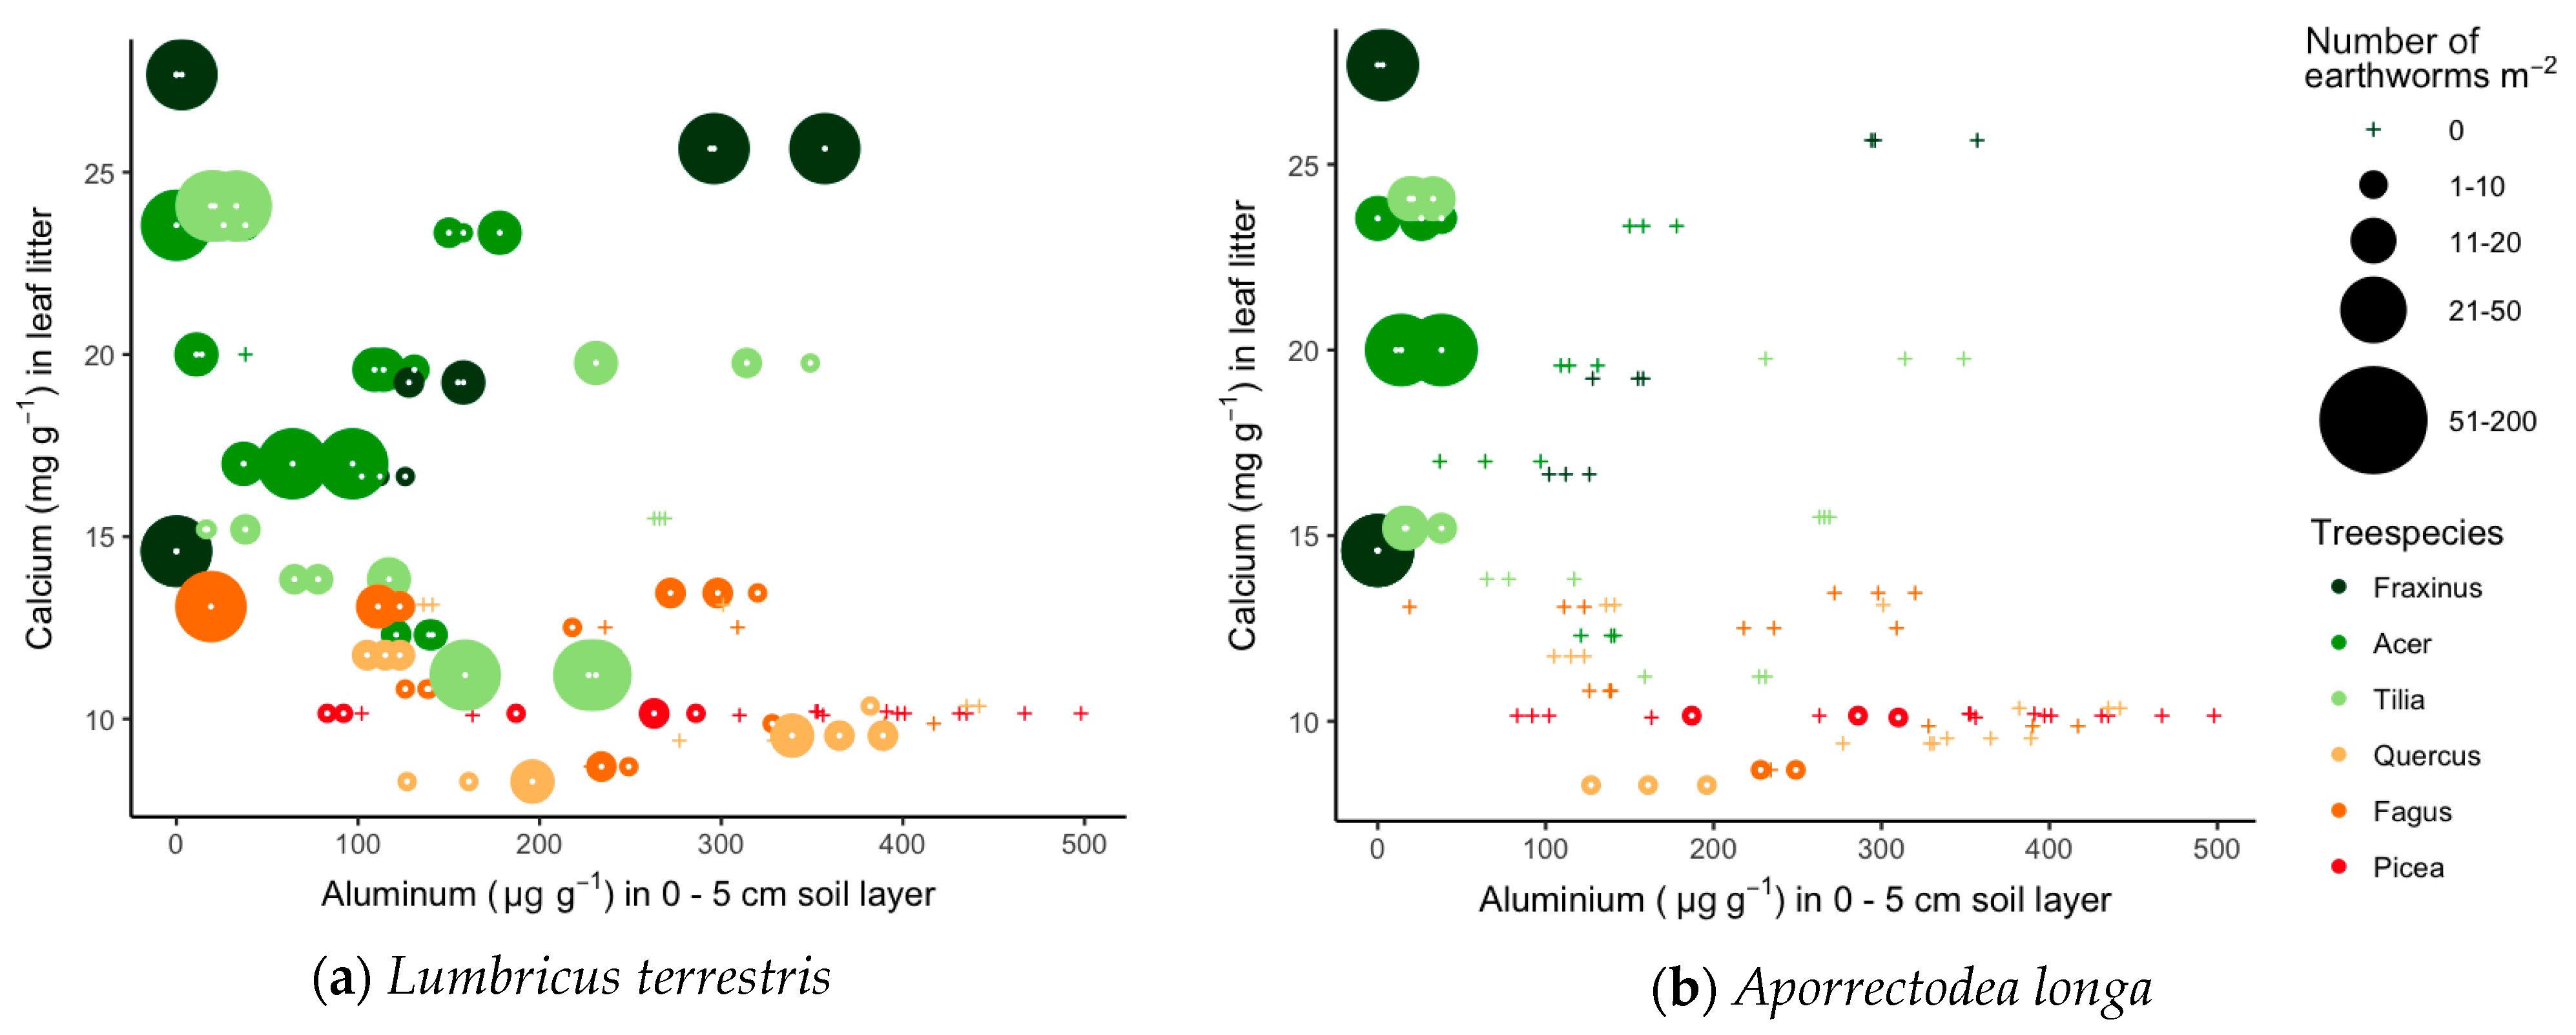
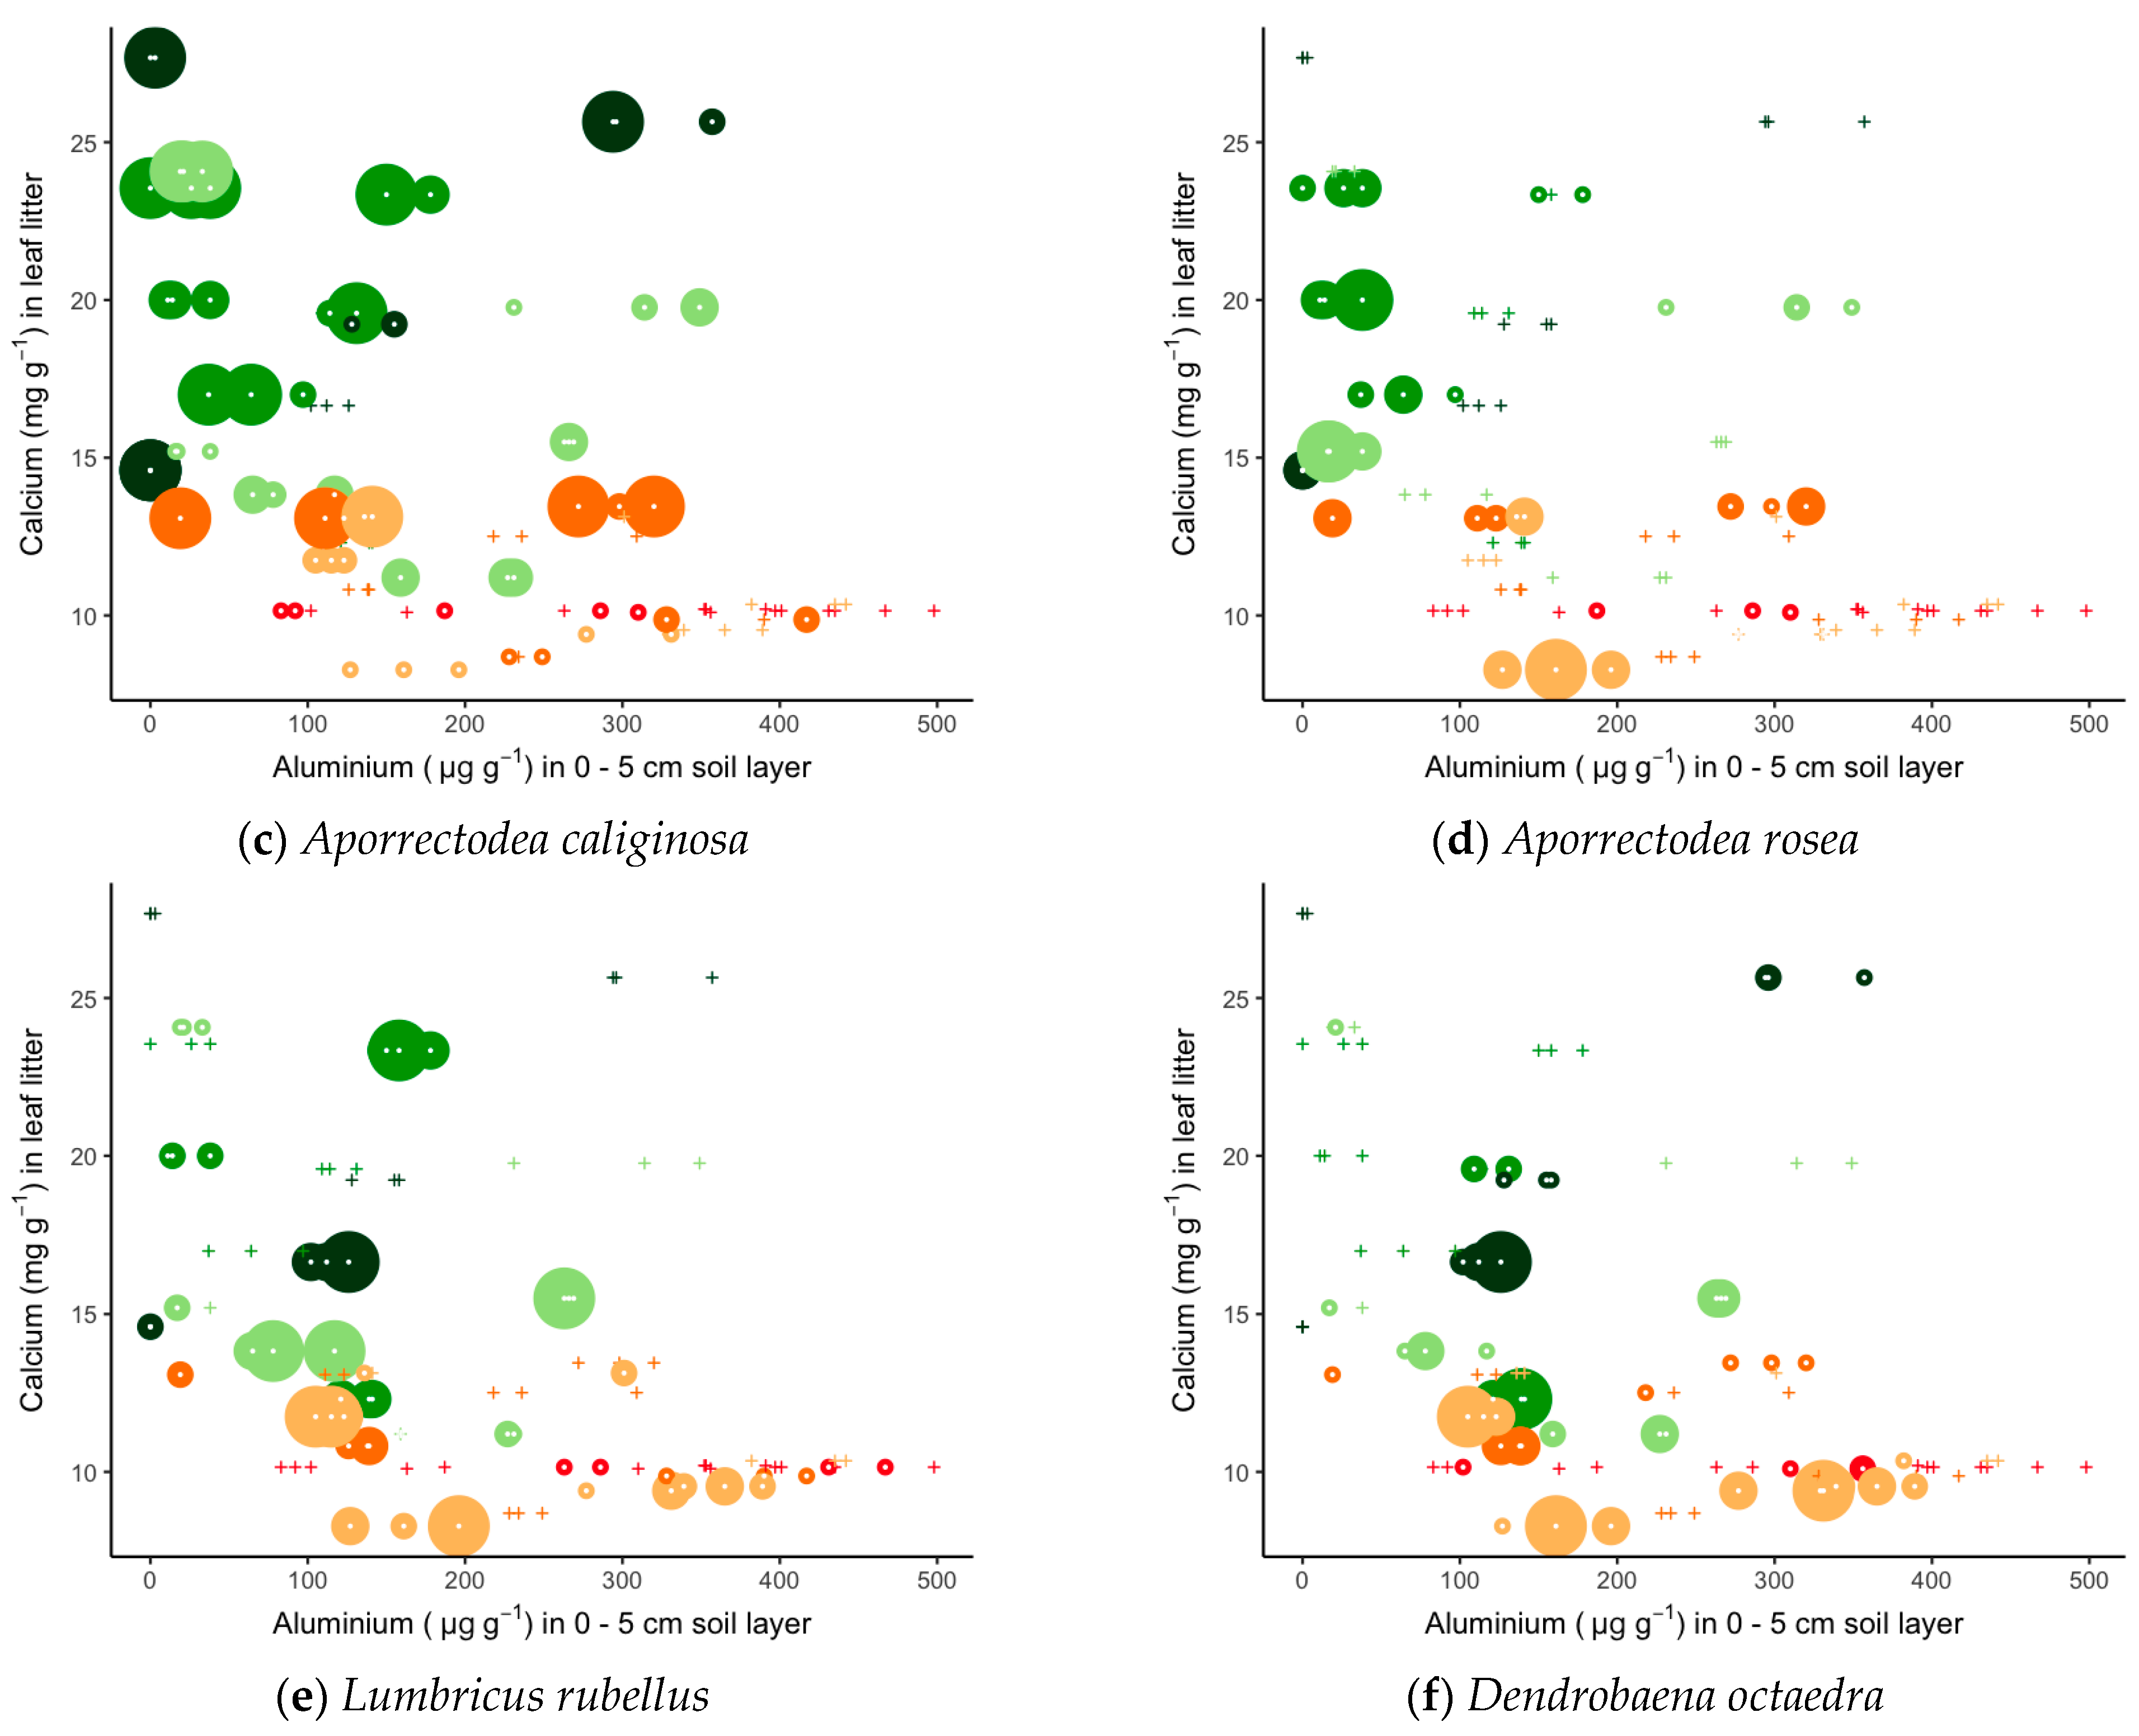
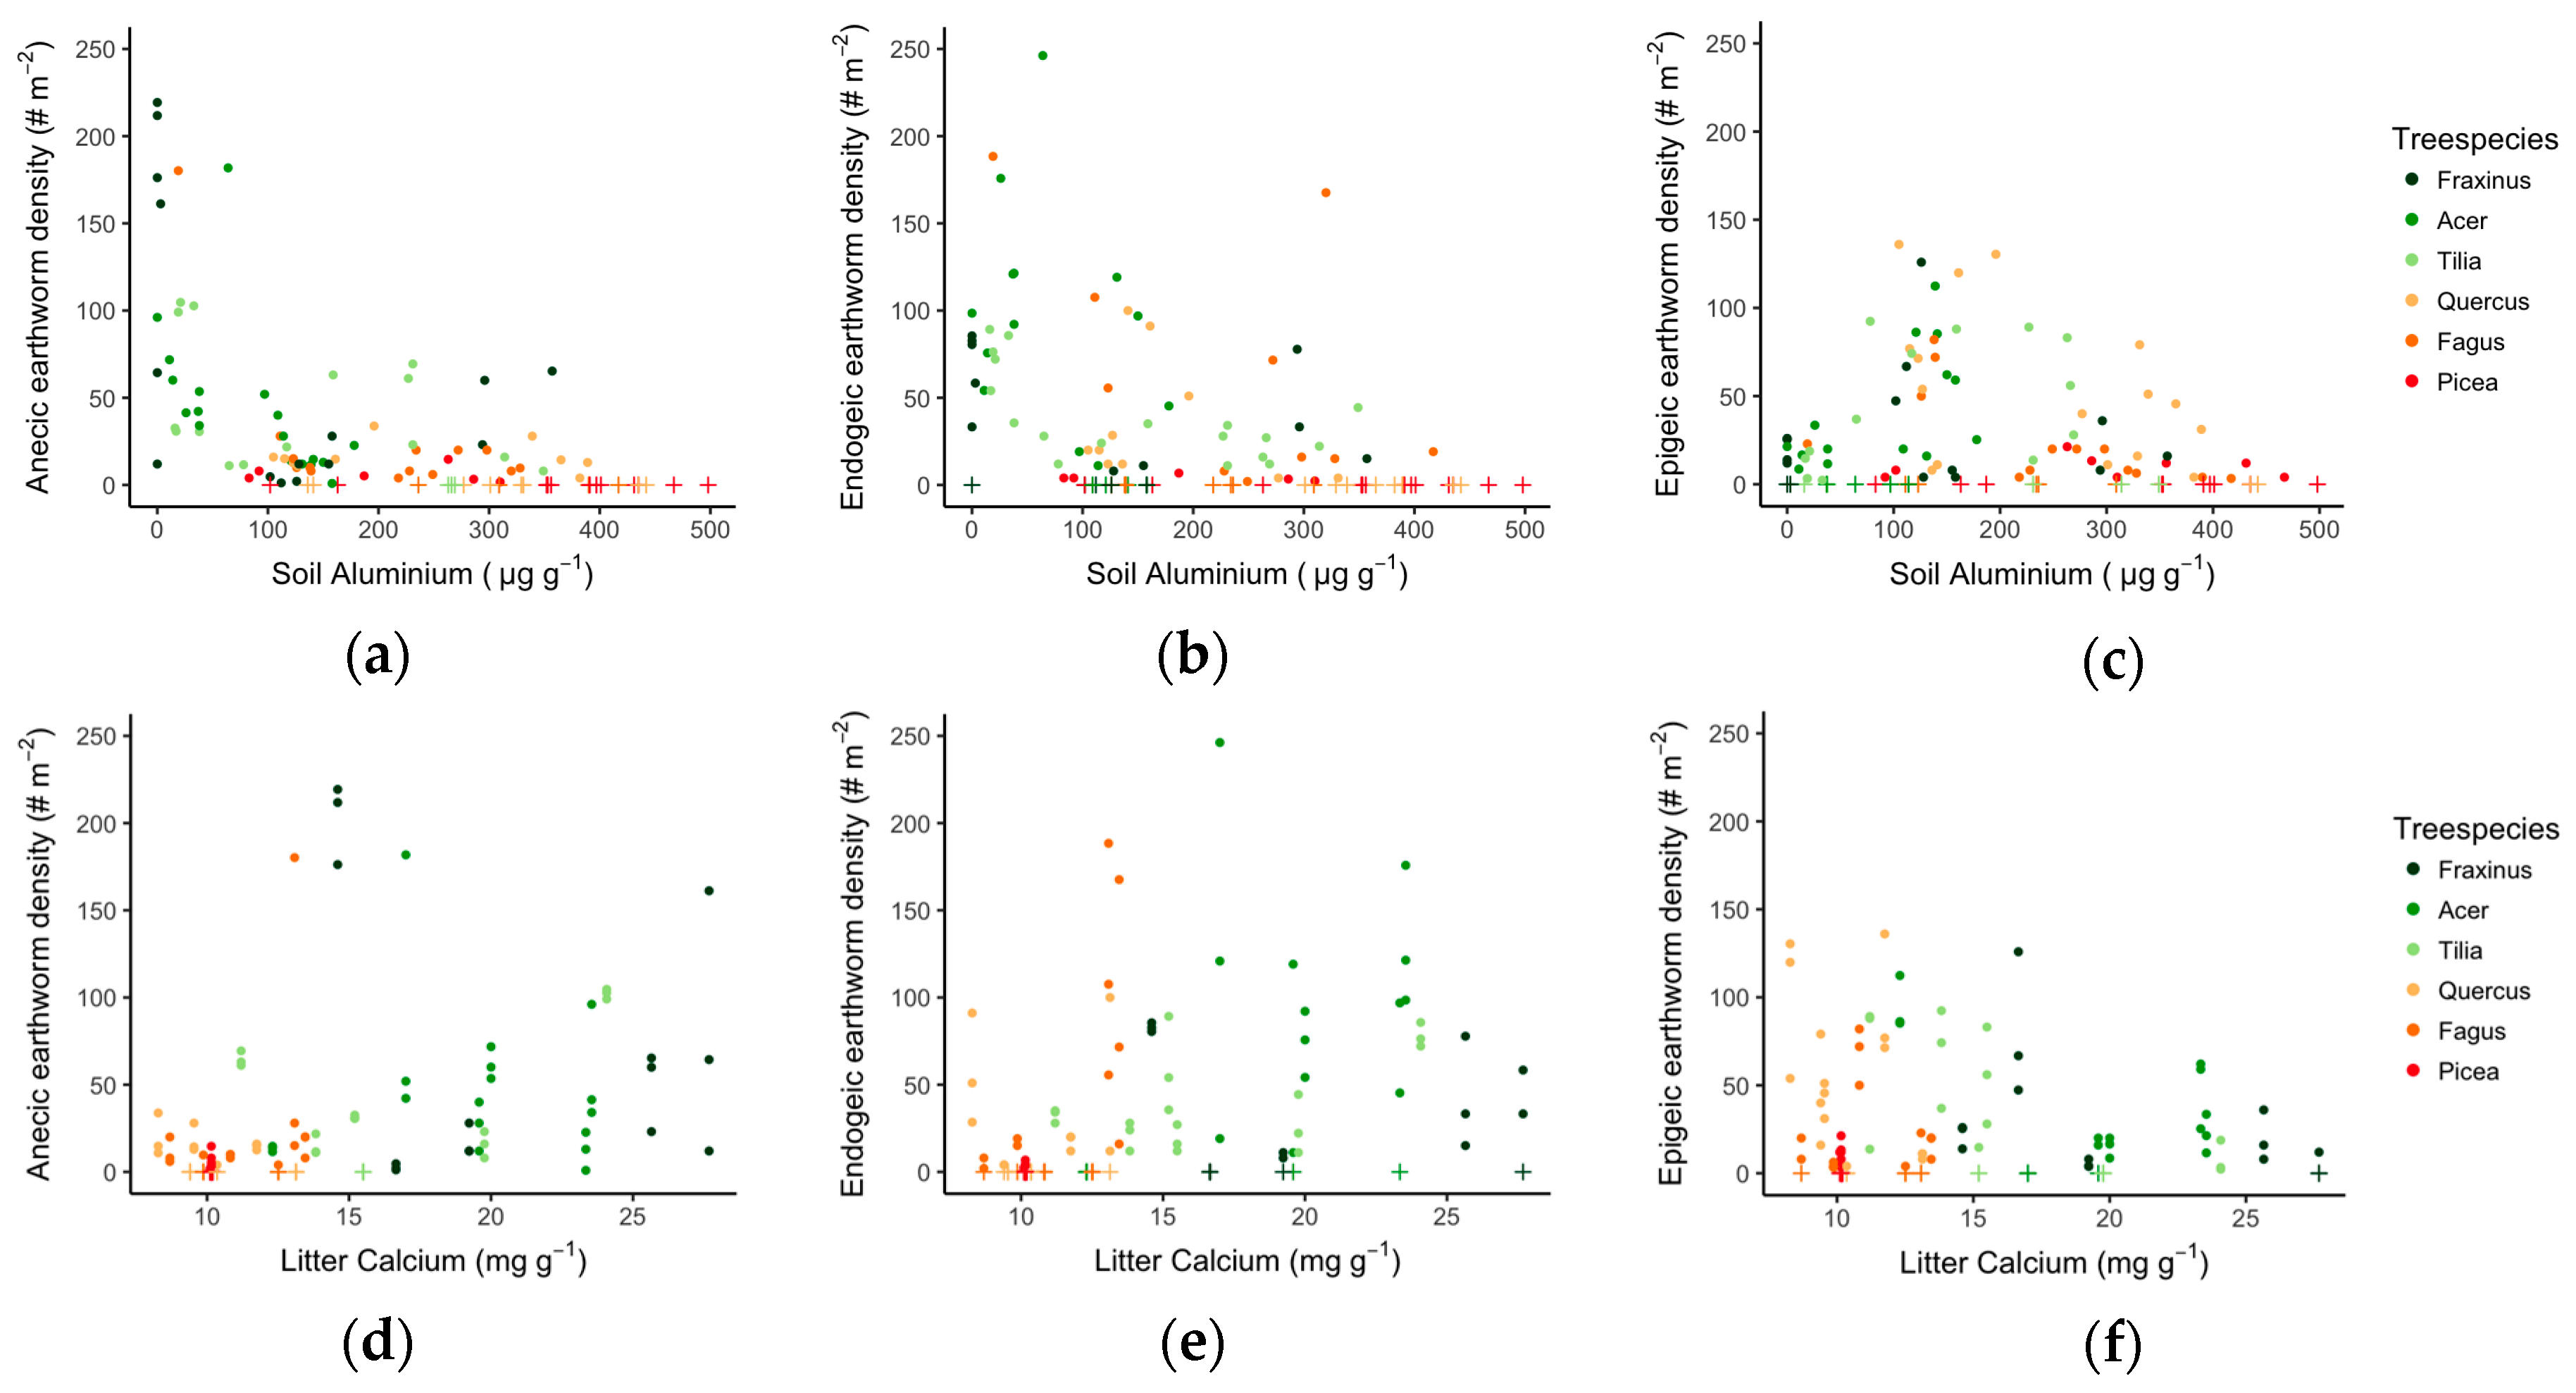
3.3. Links between Soil Quality, Litter Quality and Earthworm Communities

The earthworm groups were significantly linked with various soil and leaf litter characteristics (Table 4 and Table 5; Figure 3). The best model fit was found for total and anecic earthworm density and biomass data. The models on endogeic and epigeic earthworm densities and biomasses showed a low increase in R2 (6%–14%) compared to the null model. In case of endogeic earthworm densities and biomasses, the final R2 was very low (21% and 28%) while these models contained seven selected predictor terms.
Although the explanatory variables differed between the ecological earthworm groups, exchangeable soil Al and leaf litter Ca concentrations were almost always present in the final models for burrowing earthworms (i.e., anecic and endogeic species). Since pH-KCl seems to be better known as a soil variable than exchangeable Al concentrations, we provide more insight into exchangeable Al in Figure 4a. Exchangeable Al concentrations are strongly inversely related with pH-KCl.
Burrowing earthworms related significantly negatively with soil Al concentrations, and were almost absent when soil pH-KCl decreased below a value of 4.0 (Figure 5a,b). Epigeic earthworms showed an optimum between pH-KCl 3.5 and 4.0 (Figure 5c).
Litter Ca concentrations were positively linked with forest floor turnover rates (Figure 4b) and burrowing earthworms (Figure 5d,e). Anecic and endogeic earthworm densities were generally not higher than 50 earthworms m−2 in stands with low litter Ca concentrations (<13 mg·g−1). Litter Ca concentration was not an explanatory variable for epigeic earthworms, which seems to be indifferent for this variable (Figure 5f).
The interaction soil-Al:Litter-Ca represents a measure for the possible interaction between litter quality and soil quality affecting earthworm communities. The effect of litter Ca showed a more positive effect on anecic earthworm density when soil Al concentrations were low. In contrast, this interaction shows a different pattern for endogeic density and biomass: the effect of litter Ca was more positive when soil Al concentrations were high. However, this effect was minor, as the models for endogeic earthworms had a low goodness of fit with the data.
Anecic earthworms were further significantly positively related with other litter quality variables such as N concentrations and C:P ratios. Additionally, lignin concentrations and C:N ratios were explanatory factors for the endogeic earthworms, although the fits were not very good. Finally, litter Mn concentrations and forest floor turnover rates were significant predictors for epigeic earthworms. Furthermore, both endogeic and epigeic earthworms were significantly positively linked with the soil moisture content.
To test whether different earthworm species of an ecological group had the same sensitivity towards soil Al and litter Ca concentrations, we selected the two most common earthworm species of each group (Appendix D). For the anecic species, A. longa was only scarcely present when soil Al concentrations were higher than 50 μg·g−1 (and pH-KCl was below 4.2), while L. terrestris appeared to be abundantly present when litter with high Ca concentration was available. A. longa was the only earthworm species significantly associated with Fraxinus, Acer and Tilia (Appendix E). Similarly, but less pronounced was the difference between the two endogeic species: A. rosea seemed to be slightly more sensitive to high Al concentrations than A. caliginosa (Appendix D). The epigeic species, clearly present at a different pH-optimum (at pH-KCl 3.5–4.0), did not show a difference in sensitivity towards soil Al or litter Ca concentrations.

4. Discussion and Conclusions

Within less than four decades, the observed tree species established specific diverging soil conditions and significantly affected the earthworm communities. Topsoils under Picea, Fagus and Quercus appeared to be, on average, four times more acid than under Tilia, Acer and Fraxinus, and this was independent of the soil type, land use history and climate. From literature, we already knew that intrinsic differences in leaf litter quality among tree species fundamentally create different soil conditions and nutrient cycling, both directly through the chemical composition of the litter, and indirectly through its effects on the size and composition of especially burrowing (endogeic and anecic) earthworm communities [25,27,31]. Tree species, such as Picea, Fagus and Quercus, with Ca-poor leaf litter, contribute to the absence of burrowing earthworm communities, which retards litter decomposition and results in forest floor build-up and high concentrations of exchangeable soil aluminium, which in turn negatively impacts on earthworm communities. Tree species with Ca-rich leaf litter such as Fraxinus, Acer and Tilia appeared to have abundant anecic and endogeic earthworm populations, lowest forest floor masses, highest forest floor turnover rates and highest pH values with lowest exchangeable Al concentrations. Other studies have reported good correlations between forest floor decomposition rates and earthworm populations, because of the positive influence of leaf litter quality on earthworm populations [26,27,31,33,54]. The fact that exchangeable Al concentrations are negatively influencing earthworm populations is less published.
When soils acidify below pHH2O of 5.0, base cations, such as Ca, are removed from the cation exchange complex and are replaced by Al [55]. The increase of exchangeable soil Al concentrations also takes place in the soil solution [55], which is toxic for earthworms [51]. High exchangeable Al concentrations and low pH values were found to inhibit earthworm growth and cocoon production [51]. Earthworms are negatively impacted by soil acidification and Ca-poor litter [27]. The absence of an abundant burrowing earthworm population decreases bioturbation and increases the build-up of a forest floor, which in turn delays cations becoming available again for buffering the proton input. This chain reaction and the complex interactions were well explained in the conceptual model in Figure 6 by De Schrijver et al. [27]. In our study, burrowing earthworm communities (endogeic and anecic species) appeared to be abundant when exchangeable soil Al concentrations were lower than 100 μg·Al·g−1, and soil pH-KCl values were higher than about 4. Further soil acidification with exchangeable soil Al concentrations above 100 mg·Al·g−1 was associated with a complete absence of burrowing earthworms. However, favorable litter quality might compensate for unfavorable soil conditions. Cesarz et al. [34] showed that an acid soil (pH-H2O 3.7–4.5, and probably high exchangeable Al concentrations) combined with Ca-rich leaf litter of Tilia, Acer or Fraxinus resulted in viable endogeic earthworm populations, while the combination of an acid soil with Ca-poor leaf litter of Fagus resulted in earthworm mortality.
In our study, we found a significant interaction between exchangeable Al concentrations and leaf litter Ca concentrations for anecic earthworm densities. The effect of high leaf litter Ca was more positive at low exchangeable Al concentrations. For endogeic earthworm density and biomass, the interaction was the other way around, but very weak. The significance of the interaction in our models indicates context-specificity by these plant–soil interactions: the effects of leaf litter Ca concentration on burrowing earthworms cannot be extrapolated from any one site (e.g., [31]) to other sites with different soil properties.
According to our models, epigeic earthworms were not significantly affected by both high soil Al concentrations or leaf litter Ca concentrations. Epigeic earthworm biomass appeared to be negatively linked with the C:P ratio in litter, which is in accordance with the findings of De Wandeler et al. (2016), and positively to soil moisture content and leaf litter Mn concentrations, which is most bioavailable in the pH-KCl-range of 3.4–4.1 [56].
Picea stands proved to be exceptionally unfavorable for earthworms from all three ecological groups. Next to an acidified topsoil and recalcitrant litter, having negative impacts on burrowing earthworm populations, these stands were also characterized by significantly lower soil moisture contents compared to the other tree species. Also, Christiansen et al. [56] showed consistently decreased soil moisture content in Picea stands compared to Acer, Tilia, Fagus and Quercus stands. In these drier conditions, epigeic earthworms, which were positively linked with soil moisture content according to our model, were almost absent. Epigeic species can endure short drought periods by producing drought-resistant cocoons, but when drought periods take too long they can go extinct locally [57]. The lower soil moisture content under Picea can contribute to low forest floor decomposition rates through its direct negative impact on the activity of soil biota [28].
Further, we found that soil salinization had taken place in the topsoil and deeper soil layers (15–30 cm) of Picea stands. Exchangeable soil Na concentrations were up to three times higher in the topsoil of Picea stands and were mainly increased in the sites enduring more westerly oceanic winds. These sites (Odsherred, Wedellsborg and Viemose) could be more influenced by marine sea salt deposition and Picea stands, known for their high atmospheric dry depositions [58] could, therefore, also capture more Na. Our models showed that anecic species were negatively related with soil Na concentration. In literature, the sensitivity of earthworms towards soil salinity was already reported for the endogeic A. caliginosa and the epigeic Eisenia fetida [59], but not for anecic species.
We combined existing data on various leaf litter quality characteristics and forest floor turnover rates with new data on soil biogeochemistry and earthworm communities to broaden the understanding of plant–soil interactions in this well-studied common garden experiment [35,36,37]. We found that total earthworm biomass in Fraxinus, Acer and Tilia stands was, on average, two times higher than in Quercus and Fagus stands and eight to ten times higher than in Picea stands. A total of 50% of the earthworm biomass in Fraxinus, Acer and Tilia stands was made up of two anecic species, namely L. terrestris and A. longa, which might explain the higher carbon stocks at 15–30 cm soil depth found by Vesterdal et al. [35]. Similar vertical distributions in soil C stock were found in stands of tree species from the same genera in other places, e.g., North America [10], suggesting specific tree species–soil interactions mediated by macrofauna species such as earthworms.
Within the endogeic and anecic ecological groups, a differentiation in sensitivity of earthworm species exists towards leaf litter quality (here illustrated by Ca concentration) and soil quality (here illustrated by exchangeable Al concentration). Because certain earthworm species can be bio-indicators for biological soil quality [21] and for forest site quality [17], studying the earthworm populations at species level can reveal greater detail in response to environmental conditions. The anecic A. longa and endogeic A. rosea appeared to be more sensitive to soil acidification (pH-KCl <4.0) than L. terrestris and A. caliginosa. Also, from our indicator species analyses, A. longa was associated with Fraxinus, Acer and Tilia stands. This is in accordance with the finding that A. longa is a sensitive species towards pH that is closely associated with crop- and grasslands [60] and eutrophic deciduous forests [21]. A. rosea, however, was described previously as a species without a clear preference for a certain habitat type [21] and a tolerance for a broad pH-range [17,20]. In accordance with literature [21], the anecic L. terrestris and endogeic A. caliginosa appear to be species with a broad ecological niche because they were also found in soils with pH-KCl between 3.5 and 4.0. However, they seemed to appear in higher numbers when leaf litter contained more Ca. So, it seemed that the effects of high Al concentrations were mediated by nutrient-rich litter [34] for these two species. These findings imply the need to look beyond the response of rough earthworm ecological groups, and also focus on species-specific responses to varying leaf litter and soil characteristics.
In conclusion, we have shown that ecological earthworm groups are highly influenced by the tree species via several leaf litter and/or soil characteristics, but not all groups and species are affected similarly. According to Millennium Ecosystem Assessment [61], climatic change and atmospheric deposition of reactive N, are two of the major drivers of biodiversity loss in forests. Future climate change may come in the form of higher summer temperatures and/or increased droughts in temperate European regions [62]. On the other hand, atmospheric N deposition is expected to rise even further in temperate European regions and cause acidification [61]. Climate change may even worsen the effects of acidification by air pollution [63]. Future studies of plant–soil interactions should consider how the magnitude of litter impacts on soil organisms and soil processes might depend on how bedrock, climate, and atmospheric pollution have influenced soil acidification. Our results have shown that endogeic and epigeic earthworms were sensitive to drought, and endogeic and anecic earthworms were sensitive to acidification. In our study, we saw that planting Picea on these soils that are prone to acidification, resulted in an almost complete eradication of the earthworm population. To avoid the loss of earthworm biodiversity and functioning, foresters can mitigate these expected global changes by a substantiated choice of tree species.

Acknowledgments

The authors would like to thank Luc Willems and Greet De bruyn for assisting with the chemical analysis of soil samples. Thanks to Gorik Verstraeten for demonstrating earthworm collection in the field. Margot Vanhellemont is thanked for good advice. Special thanks to Klaas Van de Moortel for the illustrations in Figure 1 and the graphical abstract.

Author Contributions

L.V. and A.D.S. conceived and designed the study; S.S., L.V. and A.D.S. carried out the fieldwork; S.S., A.D.S., L.B. and J.M. analyzed the data; S.S., A.D.S., J.M., L.V., K.V. and B.M. wrote the manuscript.

Conflicts of interest

The authors declare no conflict of interest.

Appendix A

Table A1. Longitude and latitude for each site.
Site Longitude, Latitude
Kragelund56°10′N, 9°25′E
Mattrup55°57′N, 9°38′E
Odsherred55°50′N, 11°42′E
Vallø55°25′N, 12°03′E
Viemose55°01′N, 12°09′E
Wedellsborg55°24′N, 9°52′E

Appendix B

Table A2. Details of the results identifying optimal models for total, anecic, endogeic and epigeic density and biomass. We used glmmADMB zero inflated models with Site as random effect. Soil predictor variables were measured in the topsoil (0–5 cm). Soil-Al:Litter-Ca is the interaction between exchangeable soil Al concentration and litter Ca concentration. The foliar litter nutrient concentrations were previously published by Vesterdal et al. [35,36].
Response VariablePredictor Variables in ModelAICcΔAICcWeight
Earthworm density
Total null model112564<0.001
Soil-Al1072110.002
Soil-Al + Litter-Ca107413<0.001
Soil-Al + Litter-Ca + Soil-Al:Litter-Ca106440.11
Soil-Al + Litter-Ca + Soil-Al:Litter-Ca + Litter-Mn106320.25
Soil-Al + Litter-Ca + Soil-Al:Litter-Ca + Litter-Mn + Soil Moisture106100.64
Anecicnull model85084<0.001
Soil-Al78721<0.001
Soil-Al + Litter-N78620<0.001
Soil-Al + Litter-N + Litter-C:P778130.0014
Soil-Al + Litter-N + Litter-C:P + Soil-Na 77050.08
Soil-Al + Litter-N + Litter-C:P + Soil-Na + Litter-Ca76930.17
Soil-Al + Litter-N + Litter-C:P + Soil-Na + Litter-Ca + Soil-Al:Litter-Ca76600.75
Endogeic null model80075<0.001
Soil-Al78863<0.001
Soil-Al +Soil-Al:Litter-Ca78460<0.001
Soil-Al + Soil-Al:Litter-Ca + Litter-Ca78157<0.001
Soil-Al + Soil-Al:Litter-Ca + Litter-Ca + Soil Moisture75026<0.001
Soil-Al + Litter-Ca + Soil-Al:Litter-Ca + Soil Moisture + Litter-C:P74014<0.001
Soil-Al + Litter-Ca + Soil-Al:Litter-Ca + Soil Moisture + Litter-C:P + Litter-C:N735100.0058
Soil-Al + Litter-Ca + Soil-Al:Litter-Ca + Soil Moisture + Litter-C:P + Litter-C:N + Litter-lignin72500.99
Epigeic null model817130.0012
Soil Moisture81060.036
Soil Moisture + Litter-Mn80620.28
Soil Moisture + Litter-Mn + Forest floor turnover rate80400.68
Earthworm biomass
Total null model90279<0.001
Litter-Ca87452<0.001
Litter-Ca +Soil-Al:Litter-Ca86947<0.001
Litter-Ca + Soil-Al:Litter-Ca + Soil-Al833100.006
Litter-Ca + Soil-Al:Litter-Ca + Soil-Al + Soil Moisture82200.99
Anecic null model73977<0.001
Soil-Al68320<0.001
Soil-Al + Litter-N676130.0013
Soil-Al + Litter-N + Litter-C:P67080.020
Soil-Al + Litter-N + Litter-C:P + Soil-Na 66200.98
Endogeic null model56147<0.001
Soil-Al54026<0.001
Soil-Al +Soil-Al:Litter-Ca53219<0.001
Soil-Al + Soil-Al:Litter-Ca + Litter-Ca52916<0.001
Soil-Al + Soil-Al:Litter-Ca + Litter-Ca + Soil Moisture525120.0022
Soil-Al + Litter-Ca + Soil-Al:Litter-Ca + Soil Moisture + Litter-C:P51740.10
Soil-Al + Litter-Ca + Soil-Al:Litter-Ca + Soil Moisture + Litter-C:P + Litter-C:N51620.22
Soil-Al + Litter-Ca + Soil-Al:Litter-Ca + Soil Moisture + Litter-C:P + Litter-C:N + Litter-lignin51400.67
Epigeic null model50927<0.001
Soil Moisture49816<0.001
Soil Moisture + Litter-Mn496140.0012
Soil Moisture + Litter-Mn + Litter-C:P48201.00

Appendix C

Table A3. Mean and standard deviation of the deeper soil (5–15 cm) properties for each tree species across all six common gardens. Significant differences according to the Tukey post-hoc test between tree species are indicated with letters, means with the same letter are not significantly different (Tukey post-hoc tests on LME models, 1|Site).
Tree Species
Soil variables (15–30 cm)f-valuepFraxinusAcerTiliaQuercusFagusPicea
pH-KCl275<0.0014.2 ± 0.58 c4 ± 0.37 bc3.9 ± 0.28 ab3.8 ± 0.27 a3.8 ± 0.17 a3.7 ± 0.26 a
Base saturation (%)10<0.00160 ± 36 bc60 ± 30 c43 ± 27 ab35 ± 28 a36 ± 26 a41 ± 32 a
K in BaCl2 (μg·K·g−1)28<0.00138 ± 17 b54 ± 57 b43 ± 35 b46 ± 34 b36 ± 23 b28 ± 20 a
Na in BaCl2 (μg·Na·g−1)26<0.00117 ± 19 a13 ± 9 a10 ± 5 a9 ± 7 a11 ± 6 a37 ± 47 b
Mg in BaCl2 (μg·Mg·g−1)16<0.00177 ± 81 b61 ± 61 b33 ± 26 a38 ± 42 ab29 ± 25 a53 ± 45 ab
Ca in BaCl2 (μg·Ca·g−1)18<0.001954 ± 1049 b659 ± 603 b375 ± 358 ab357 ± 433 a312 ± 288 a482 ± 481 a
Al in BaCl2 (μg·Al·g−1)57<0.001133 ± 131 a136 ± 87 ab211 ± 118 bc262 ± 133 c232 ± 103 bc248 ± 136 bc
Table A4. Mean and standard deviation of the deeper soil (15–30 cm) properties for each tree species across all six common gardens. Significant differences according to the Tukey post-hoc test between tree species are indicated with letters, means with the same letter are not significantly different (Tukey post-hoc tests on LME models, 1|Site).
Tree Species
Soil variables (15–30 cm)f-valuepFraxinusAcerTiliaQuercusFagusPicea
pH-KCl236<0.0014.4 ± 0.57 b4.2 ± 0.37 ab4.0 ± 0.31 a4.1 ± 0.4 ab4.1 ± 0.43 ab4.1 ± 0.37 ab
Base saturation (%)4.0<0.00560 ± 3855 ± 3339 ± 3346 ± 3351 ± 3551 ± 39
K in BaCl2 (μg·K·g−1)13<0.00129 ± 2132 ± 3829 ± 2634 ± 2927 ± 2426 ± 22
Na in BaCl2 (μg·Na·g−1)17<0.00117 ± 20 a12 ± 7 a9,0 ± 5,4 a10 ± 9,5 a13 ± 8,7 a42 ± 58 b
Mg in BaCl2 (μg·Mg·g−1)8.7<0.00176 ± 94 b47 ± 59 ab28 ± 33 a51 ± 60 ab43 ± 44 ab58 ± 55 ab
Ca in BaCl2 (μg·Ca·g−1)13<0.0011109 ± 1252 b590 ± 694 ab339 ± 402 a522 ± 628 a527 ± 524 ab692 ± 733 ab
Al in BaCl2 (μg·Al·g−1)37<0.001115 ± 113128 ± 86175 ± 105175 ± 117149 ± 97149 ± 113

Appendix D

Figure A1. The density of the most common earthworm species (anecic: L. terrestris (a) and A. longa (b); endogeic: A. caliginosa (c); A. rosea (d); and epigeic: L. rubellus (e) and D. octaedra (f)) in relation with exchangeable soil Al concentration and Ca concentration in litter. Earthworm density is shown by the size of the circles; a cross symbol indicates plots where no earthworms were found. The color of the circle indicates the tree species. The foliar litter Ca concentration was previously published by Vesterdal et al. [36].
Forests 08 00085 g006aForests 08 00085 g006b

Appendix E

The dataset was screened for associations between all earthworm species (density and biomass) and the six tree species by indicator species analysis [64] allowing for the combination of tree species [65] by using the function multipatt (package indicspecies [66]) with “IndVal” as the statistical index with 999 permutations. The calculated Indicator Value is the product of two components: a specificity component (A) and a sensitivity component (B) of earthworm species for a tree species.
Table A5. Indicator species analysis of earthworm density and biomass. The indicator component A (specificity) relates to the probability that the earthworm species only occurs in this group of tree species. The indicator component B (sensitivity) relates to the probability of finding the earthworm species in this group of tree species.
Earthworm SpeciesComponent AComponent BIndValp-Value
Association with tree species group:
Earthworm density
Fraxinus + Acer + TiliaA. longa0.970.330.570.008
Fraxinus + Acer + Tilia + QuercusL. rubellus0.920.590.740.009
Fraxinus + Acer + Tilia + FagusL. terrestris0.920.870.890.001
Fraxinus + Acer + Tilia + Quercus + FagusA. caliginosa0.990.700.840.001
D. octaedra0.980.530.720.006
Earthworm biomass
Fraxinus + Acer + TiliaA. longa0.980.330.570.014
Fraxinus + Acer + Tilia + QuercusL. rubellus0.920.590.740.006
Fraxinus + Acer + Tilia + Quercus + FagusL. terrestris0.970.820.890.001
A. caliginosa0.990.700.830.002
D. octaedra0.960.530.710.010

References

  1. Darwin, C. The Formation of Vegetable Mould Through the Action of Worms with Some Observations on Their Habits; John Murray: London, UK, 1881. [Google Scholar]
  2. Edwards, C.A. Earthworm Ecology, 2nd ed.; CRC Press: Columbus, OH, USA, 2004. [Google Scholar]
  3. Lee, K.E. Earthworms—Their Ecology and Relationships with Soils and Land Use; Academic Press: Sydney, Australia, 1985. [Google Scholar]
  4. Muys, B.; Lust, N. Inventory of the earthworm communities and the state of litter decomposition in the forests of Flanders (Belgium) and its implications for forest management. Soil Biol. Biochem. 1992, 24, 1677–1681. [Google Scholar] [CrossRef]
  5. Lavelle, P.; Bignell, D.; Lepage, M.; Wolters, V.; Roger, P.; Ineson, P.; Heal, O.W.; Dhillion, S. Soil function in a changing world: The role of invertebrate ecosystem engineers. Eur. J. Soil Biol. 1997, 33, 159–193. [Google Scholar]
  6. Lavelle, P.; Decaens, T.; Aubert, M.; Barot, S.; Blouin, M.; Bureau, F.; Margerie, P.; Mora, P.; Rossi, J.P. Soil invertebrates and ecosystem services. Eur. J. Soil Biol. 2006, 42, S3–S15. [Google Scholar] [CrossRef]
  7. Jones, C.G.; Lawton, J.H.; Shachak, M. Organisms as ecosystem engineers. Oikos 1994, 69, 373–386. [Google Scholar] [CrossRef]
  8. Dempsey, M.A.; Fisk, M.C.; Yavitt, J.B.; Fahey, T.J.; Balser, T.C. Exotic earthworms alter soil microbial community composition and function. Soil Biol. Biochem. 2013, 67, 263–270. [Google Scholar] [CrossRef]
  9. Hale, C.M.; Frelich, L.E.; Reich, P.B.; Pastor, J. Effects of European earthworm invasion on soil characteristics in Northern Hardwood Forests of Minnesota, USA. Ecosystems 2005, 8, 911–927. [Google Scholar] [CrossRef]
  10. Vesterdal, L.; Clarke, N.; Sigurdsson, B.D.; Gundersen, P. Do tree species influence soil carbon stocks in temperate and boreal forests? For. Ecol. Manage. 2013, 309, 4–18. [Google Scholar] [CrossRef]
  11. Frouz, J.; Livecková, M.; Albrechtová, J.; Chronáková, A.; Cajthaml, T.; Pizl, V.; Hánel, L.; Stary, J.; Baldrian, P.; Lhotáková, Z.; et al. Is the effect of trees on soil properties mediated by soil fauna ? A case study from post-mining sites. For. Ecol. Manag. 2013, 309, 87–95. [Google Scholar]
  12. Curry, J.P.; Schmidt, O. The feeding ecology of earthworms—A review. Pedobiologia (Jena) 2006, 50, 463–477. [Google Scholar] [CrossRef]
  13. Sheehan, C.; Kirwan, L.; Connolly, J.; Bolger, T. The effects of earthworm functional diversity on microbial biomass and the microbial community level physiological profile of soils. Eur. J. Soil Biol. 2008, 44, 65–70. [Google Scholar] [CrossRef]
  14. Bouché, M.B. Strategies lombriciennes. Ecol. Bull. 1977, 25, 122–132. [Google Scholar]
  15. Sims, R.W.; Gerard, B.M. Earthworms: Notes for the Identification of British Species, 4th ed.; The Linnean Society of London & The Estuarine & Coastal Sciences Association by Field Studies Council: Shrewsbury, UK, 1999. [Google Scholar]
  16. Haimi, J.; Huhta, V. Effects of earthworms on decomposition processes in raw humus forest soil—A microcosm study. Biol. Fertil. Soils 1990, 10, 178–183. [Google Scholar]
  17. Muys, B.; Granval, P. Earthworms as bio-indicators of forest site quality. Soil Biol. Biochem. 1997, 29, 323–328. [Google Scholar] [CrossRef]
  18. Haimi, J.; Einbork, M. Effects of endogeic earthworms on soil processes and plant growth in coniferous forest soil. Biol. Fertil. Soils 1992, 13, 6–10. [Google Scholar] [CrossRef]
  19. Zicsi, A.; Szlavecz, K.; Csuzdi, C. Leaf litter acceptance and cast deposition by peregrine and endemic European lumbricids (Oligochaeta: Lumbricidae). Pedobiologia (Jena) 2011, 54, 1–8. [Google Scholar] [CrossRef]
  20. Potthoff, M.; Asche, N.; Stein, B.; Muhs, A.; Beese, F. Earthworm communities in temperate beech wood forest soils affected by liming. Eur. J. Soil Biol. 2008, 44, 247–254. [Google Scholar] [CrossRef]
  21. Jänsch, S.; Steffens, L.; Höfer, H.; Horak, F.; Roß-nickoll, M.; Russell, D.; Toschki, A.; Römbke, J. State of knowledge of earthworm communities in German soils as a basis for biological soil quality assessment. Soil Org. 2013, 85, 215–233. [Google Scholar]
  22. Schelfhout, S. Tree Species Effect on Earthworm Communities in Danish and Flemish Forests. Master’s Thesis, Ghent University, Ghent, Belgium, June 2010. [Google Scholar]
  23. De Wandeler, H.; Sousa-Silva, R.; Ampoorter, E.; Bruelheide, H.; Carnol, M.; Dawud, S.M.; Dănilă, G.; Finer, L.; Hättenschwiler, S.; Hermy, M.; et al. Drivers of earthworm incidence and abundance across European forests. Soil Biol. Biochem. 2016, 99, 167–178. [Google Scholar] [CrossRef]
  24. Ponge, J.F.; Patzel, N.; Delhaye, L.; Devigne, E.; Levieux, C.; Beros, P.; Wittebroodt, R. Interactions between earthworms, litter and trees in an old-growth beech forest. Biol. Fertil. Soils 1999, 29, 360–370. [Google Scholar] [CrossRef]
  25. Muys, B.; Lust, N.; Granval, P. Effects of Grassland Afforestation with Different Tree Species on Earthworm Communities, Litter Decomposition and Nutrient Status. Soil Biol. Biochem. 1992, 24, 1459–1466. [Google Scholar] [CrossRef]
  26. Hobbie, S.E.; Reich, P.B.; Oleksyn, J.; Ogdahl, M.; Zytkowiak, R.; Hale, C.; Karolewski, P. Tree species effects on decomposition and forest floor dynamics in a common garden. Ecology 2006, 87, 2288–2297. [Google Scholar] [CrossRef]
  27. De Schrijver, A.; De Frenne, P.; Staelens, J.; Verstraeten, G.; Muys, B.; Vesterdal, L.; Wuyts, K.; Van Nevel, L.; Schelfhout, S.; Neve, S.; et al. Tree species traits cause divergence in soil acidification during four decades of postagricultural forest development. Glob. Chang. Biol. 2012, 18, 1127–1140. [Google Scholar] [CrossRef]
  28. Augusto, L.; De Schrijver, A.; Vesterdal, L.; Smolander, A.; Prescott, C.; Ranger, J. Influences of evergreen gymnosperm and deciduous angiosperm tree species on the functioning of temperate and boreal forests. Biol. Rev. 2015, 90, 444–466. [Google Scholar] [CrossRef] [PubMed]
  29. Zhang, D.; Hui, D.; Luo, Y.; Zhou, G. Rates of litter decomposition in terrestrial ecosystems: Global patterns and controlling factors. J. Plant Ecol. 2008, 1, 85–93. [Google Scholar] [CrossRef]
  30. Hobbie, S.E. Plant species effects on nutrient cycling: Revisiting litter feedbacks. Trends Ecol. Evol. 2015, 30, 357–363. [Google Scholar] [CrossRef] [PubMed]
  31. Reich, P.B.; Oleksyn, J.; Modrzynski, J.; Mrozinski, P.; Hobbie, S.E.; Eissenstat, D.M.; Chorover, J.; Chadwick, O.A.; Hale, C.M.; Tjoelker, M.G. Linking litter calcium, earthworms and soil properties: A common garden test with 14 tree species. Ecol. Lett. 2005, 8, 811–818. [Google Scholar] [CrossRef]
  32. Hagen-Thorn, A.; Callesen, I.; Armolaitis, K.; Nihlgard, B. The impact of six European tree species on the chemistry of mineral topsoil in forest plantations on former agricultural land. For. Ecol. Manag. 2004, 195, 373–384. [Google Scholar] [CrossRef]
  33. Neirynck, J.; Mirtcheva, S.; Sioen, G.; Lust, N. Impact of Tilia platyphyllos Scop., Fraxinus excelsior L., Acer pseudoplatanus L., Quercus robur L. and Fagus sylvatica L. on earthworm biomass and physico-chemical properties of a loamy topsoil. For. Ecol. Manag. 2000, 133, 275–286. [Google Scholar] [CrossRef]
  34. Cesarz, S.; Craven, D.; Dietrich, C.; Eisenhauer, N. Effects of soil and leaf litter quality on the biomass of two endogeic earthworm species. Eur. J. Soil Biol. 2016, 77, 9–16. [Google Scholar] [CrossRef]
  35. Vesterdal, L.; Schmidt, I.K.; Callesen, I.; Nilsson, L.O.; Gundersen, P. Carbon and nitrogen in forest floor and mineral soil under six common European tree species. For. Ecol. Manag. 2008, 255, 35–48. [Google Scholar] [CrossRef]
  36. Vesterdal, L.; Elberling, B.; Christiansen, J.R.; Callesen, I.; Schmidt, I.K. Soil respiration and rates of soil carbon turnover differ among six common European tree species. For. Ecol. Manag. 2012, 264, 185–196. [Google Scholar] [CrossRef]
  37. Christiansen, J.R.; Vesterdal, L.; Callesen, I.; Elberling, B.; Schmidt, I.K.; Gundersen, P. Role of six European tree species and land-use legacy for nitrogen and water budgets in forests. Glob. Chang. Biol. 2010, 16, 2224–2240. [Google Scholar] [CrossRef]
  38. Zaborski, E.R. Allyl isothiocyanate: An alternative chemical expellant for sampling earthworms. Appl. Soil Ecol. 2003, 22, 87–95. [Google Scholar] [CrossRef]
  39. Valckx, J.; Govers, G.; Hermy, M.; Muys, B. Optimizing earthworm sampling in ecosystems. In Biology of Earthworms; Karaca, A., Ed.; Soil Biology; Springer: Berlin/Heidelberg, Germany, 2011; Volume 24, pp. 19–38. [Google Scholar]
  40. Bouché, M.B. Lombriciens de France: Ecologie et Systématique. INRA Ann. Zool. Ecol. Anim. 1972, 72, 1–671. [Google Scholar]
  41. Valckx, J.; Hermy, M.; Muys, B. Indirect gradient analysis at different spatial scales of prorated and non-prorated earthworm abundance and biomass data in temperate agro-ecosystems. Eur. J. Soil Biol. 2006, 42, 341–347. [Google Scholar] [CrossRef]
  42. Hansen, K.; Vesterdal, L.; Schmidt, I.K.; Gundersen, P.; Sevel, L.; Bastrup-Birk, A.; Pedersen, L.B.; Bille-Hansen, J. Litterfall and nutrient return in five tree species in a common garden experiment. For. Ecol. Manag. 2009, 257, 2133–2144. [Google Scholar] [CrossRef]
  43. Olson, J.S. Energy storage and the balance of producers and decomposers in ecological systems. Ecology 1963, 44, 322–331. [Google Scholar] [CrossRef]
  44. R-Core-Team. R: A Language and Environment for Statistical Computing; R Foundation for Statistical Computing: Vienna, Austria, 2016. [Google Scholar]
  45. Pinheiro, J.; Bates, D.; Debroy, S.; Sarkar, D.; R-Core-Team. nlme: Linear and Nonlinear Mixed Effects Models, R package version 3.1-128; 2016. Available online: https://CRAN.R-project.org/package=nlme (accessed on 1 December 2016).
  46. Hothorn, T.; Bretz, F.; Westfall, P. Simultaneous inference in general parametric models. Biometr. J. 2008, 50, 346–363. [Google Scholar] [CrossRef] [PubMed]
  47. Skaug, H.; Fournier, D.; Bolker, B.; Magnusson, A.; Nielsen, A. Generalized Linear Mixed Models using “AD Model Builder”, R package version 0.8.3.3; 2016. Available online: http://glmmadmb.r-forge.r-project.org/repos/ (accessed on 1 December 2016).
  48. Martin, T.G.; Wintle, B.A.; Rhodes, J.R.; Kuhnert, P.M.; Field, S.A.; Low-Choy, S.J.; Tyre, A.J.; Possingham, H.P. Zero tolerance ecology: Improving ecological inference by modelling the source of zero observations. Ecol. Lett. 2005, 8, 1235–1246. [Google Scholar] [CrossRef] [PubMed] [Green Version]
  49. Lewin, W.-C.; Freyhof, J.; Huckstorf, V.; Mehner, T.; Wolter, C. When no catches matter: Coping with zeros in environmental assessments. Ecol. Indic. 2010, 10, 572–583. [Google Scholar] [CrossRef]
  50. Sileshi, G. The excess-zero problem in soil animal count data and choice of appropriate models for statistical inference. Pedobiologia (Jena) 2008, 52, 1–17. [Google Scholar] [CrossRef]
  51. Van Gestel, C.A.M.; Hoogerwerf, G. Influence of soil pH on the toxicity of aluminium for Eisenia andrei (Oligochaeta: Lumbricidae) in an artificial soil substrate. Pedobiologia (Jena) 2001, 45, 385–395. [Google Scholar] [CrossRef]
  52. Dormann, C.F.; Elith, J.; Bacher, S.; Buchmann, C.; Carl, G.; Carré, G.; Marquéz, J.R.G.; Gruber, B.; Lafourcade, B.; Leitão, P.J.; et al. Collinearity: A review of methods to deal with it and a simulation study evaluating their performance. Ecography (Cop.) 2013, 36, 027–046. [Google Scholar] [CrossRef]
  53. Hurvich, C.; Tsai, C.-L. Regression and time series model selection in small samples. Biometrika 1989, 76, 297–307. [Google Scholar] [CrossRef]
  54. Bohlen, P.J.; Groffman, P.M.; Fahey, T.J.; Fisk, M.C.; Suarez, E.; Pelletier, D.M.; Fahey, R.T. Ecosystem consequences of exotic earthworm invasion of north temperate forests. Ecosystems 2004, 7, 1–12. [Google Scholar] [CrossRef]
  55. Bowman, W.D.; Cleveland, C.C.; Halada, L.; Hresko, J. Negative impact of nitrogen deposition on soil buffering capacity. Nat. Geosci. 2008, 1, 767–770. [Google Scholar] [CrossRef]
  56. Blake, L.; Goulding, K.W.T.; Mott, C.J.B.; Johnston, A.E. Changes in soil chemistry accompanying acidification over more than 100 years under woodland and grass at Rothamsted Experimental Station, UK. Eur. J. Soil Sci. 1999, 50, 401–412. [Google Scholar] [CrossRef]
  57. Eggleton, P.; Inward, K.; Smith, J.; Jones, D.T.; Sherlock, E. A six year study of earthworm (Lumbricidae) populations in pasture woodland in southern England shows their responses to soil temperature and soil moisture. Soil Biol. Biochem. 2009, 41, 1857–1865. [Google Scholar] [CrossRef]
  58. Augusto, L.; Ranger, J.; Binkley, D.; Rothe, A. Impact of several common tree species of European temperate forests on soil fertility. Ann. For. Sci. 2002, 59, 233–253. [Google Scholar] [CrossRef]
  59. Owojori, O.J.; Reinecke, A.J.; Voua-Otomo, P.; Reinecke, S.A. Comparative study of the effects of salinity on life-cycle parameters of four soil-dwelling species (Folsomia candida, Enchytraeus doerjesi, Eisenia fetida and Aporrectodea caliginosa). Pedobiologia (Jena) 2009, 52, 351–360. [Google Scholar] [CrossRef]
  60. Decaëns, T.; Margerie, P.; Aubert, M.; Hedde, M.; Bureau, F. Assembly rules within earthworm communities in North-Western France-A regional analysis. Appl. Soil Ecol. 2008, 39, 321–335. [Google Scholar] [CrossRef]
  61. Millenium Ecosystem Assessment. Ecosystems and Human Well-Being: Biodiversity Synthesis; World Resources Institute: Washington DC, USA, 2005. [Google Scholar]
  62. European Environment Agency. Climate Change Impacts and Vulnerability in Europe 2016. An Indicator-Based Report; Publications Office of the European Union: Luxembourg, 2017. [Google Scholar]
  63. Sanderson, M.G.; Collins, W.J.; Johnson, C.E.; Derwent, R.G. Present and future acid deposition to ecosystems: The effect of climate change. Atmos. Environ. 2006, 40, 1275–1283. [Google Scholar] [CrossRef]
  64. Dufrêne, M.; Legendre, P. Species assemblages and indicator species: The need for a flexible asymmetrical approach. Ecol. Monogr. 1997, 67, 345–366. [Google Scholar] [CrossRef]
  65. De Cáceres, M.; Legendre, P.; Moretti, M. Improving indicator species analysis by combining groups of sites. Oikos 2010, 119, 1674–1684. [Google Scholar] [CrossRef]
  66. De Cáceres, M.; Jansen, F. Indicspecies: Relationship between species and groups of sites, R package version 1.7.6; 2016. Available online: https://cran.r-project.org/package=indicspecies (accessed on 1 December 2016).
Figure 1. Illustration of the three ecological earthworm groups according to their food preference and behavior. The brown zone represents the soil. Reproduced from [22].
Forests 08 00085 g001
Figure 2. Density (a) and biomass (b) of total, epigeic, endogeic and anecic earthworms (mean + standard error). The tree species were sorted according to decreasing soil pH-KCl (0–5 cm). Significant differences between tree species within each earthworm group are indicated with letters (Tukey post-hoc tests on generalized linear multilevel (glmmADMB) models, 1|Site).
Forests 08 00085 g002
Figure 3. Estimated effects of litter and soil (0–5 cm) variables on the earthworm density (a) and biomass (b). Predictor variables were standardized to the mean and scales by the standard deviation, so that effects correspond to a change in the earthworm density/biomass (on the log-scale) for a one standard deviation change in the predictor. This is true for all predictors, so their relative effects are comparable. The models are shown for total (black), anecic (blue), endogeic (green) and epigeic (red) earthworms. Coefficients are shown with confidence intervals by thick lines for 50% credible intervals and by thin lines for 95% credible intervals. We used glmmADMB zero inflated models with Site as group-level effect. The foliar litter nutrient concentrations were previously published by Vesterdal et al. [35,36].
Forests 08 00085 g003
Figure 4. Relation between pH-KCl and exchangeable Al concentration in the 0–5 cm soil layer ((a) n = 105). In (b), the relation between Ca concentration in foliar litter and the forest floor turnover rate (n = 35) is shown. The points are colored according to the tree species. The foliar litter Ca concentration was previously published by Vesterdal et al. [36].
Forests 08 00085 g004
Figure 5. Relation between exchangeable Al concentration in the 0–5 cm soil layer (ac) or Ca concentration in foliar litter (df), and density of anecic (a,d), endogeic (b,e), and epigeic (c,f) earthworms. Plots where zero earthworms were found are indicated by a cross symbol. The foliar litter Ca concentration was previously published by Vesterdal et al. [36].
Forests 08 00085 g005
Table 1. Mean and standard deviation of topsoil (0–5 cm) properties for each tree species across all six common gardens. Significant differences between tree species are indicated with letters, means with the same letter are not significantly different (Tukey post-hoc tests on linear mixed-effects (LME) models, 1|Site).
Tree Species
Soil variables (0–5 cm)f-valuepFraxinusAcerTiliaQuercusFagusPicea
Moisture (%)1475<0.00114 ± 5 c15 ± 4 c12 ± 3 b13 ± 4 bc12 ± 4 b9 ± 2 a
pH-KCl325<0.0014.2 ± 0.6 c4.2 ± 0.5 c4.0 ± 0.4 c3.7 ± 0.3 b3.7 ± 0.2 b3.5 ± 0.2 a
Base saturation (%)108<0.00173 ± 28 b78 ± 24 b71 ± 20 b49 ± 20 a49 ± 21 a41 ± 19 a
K+ in BaCl2 (μg·g−1)50<0.001100 ± 88 bc114 ± 91 c91 ± 56 bc85 ± 57 bc67 ± 42 ab41 ± 22 a
Na+ in BaCl2 (μg·g−1)28<0.00119 ± 16 a17 ± 11 a15 ± 8 a13 ± 7 a13 ± 7 a38 ± 48 b
Mg2+ in BaCl2 (μg·g−1)48<0.001139 ± 106 c108 ± 72 bc81 ± 39 ab68 ± 53 a49 ± 32 a57 ± 41 a
Ca2+ in BaCl2 (μg·g−1)42<0.0011241 ± 1020 c1050 ± 690 bc796 ± 437 ab481 ± 388 a446 ± 293 a467 ± 351 a
Al3+ in BaCl2 (μg·g−1)42<0.001115 ± 121 a87 ± 58 a151 ± 118 a261 ± 121 bc231 ± 105 b309 ± 133 c
Table 2. Mean and standard deviation of annual litterfall, foliar litter quality and forest floor accumulation for the tree species across all six common gardens. Significant differences between tree species are indicated with letters, means with the same letter are not significantly different (Tukey post-hoc tests on LME models, 1|Site). Litterfall and forest floor foliar mass and nutrient concentrations in litter were previously published by Vesterdal et al. [35,36].
Tree Species
f-valuepFraxinusAcerTiliaQuercusFagusPicea
Litterfall
Foliar mass (Mg·ha−1·year−1)127<0.0012.7 ± 1.0 bc2.8 ± 0.39 c2.4 ± 0.68 ab2.6 ± 0.55 abc2.1 ± 0.34 a3.9 ± 0.46 d
C:N ratio151<0.00125 ± 5.4 a27 ± 2.6 ab28 ± 3.5 ab32 ± 3.0 b42 ± 14 d36 ± 1.9 c
C:P ratio5200<0.001358 ± 128 a477 ± 81 b407 ± 87 a415 ± 44 a575 ± 113 c473 ± 37 b
N (mg·g−1)250<0.00119 ± 3.6 d17 ± 1.7 c18 ± 2.5 c16 ± 1.5 b13 ± 3.6 a13 ± 0.74 a
Ca (mg·g−1)124<0.00121± 5.3 c19 ± 4.0 c17 ± 4.3 b10 ± 1.7 a11 ± 1.8 a10 ± 0.03 a
Mn (mg·g−1)1025<0.0010.23 ± 0.27 a0.63 ± 0.33 b1.1 ± 0.52 c1.6 ± 0.50 d1.6 ± 0.55 d1.2 ± 0.04 c
P (mg·g−1)362<0.0011.5 ± 0.56 d1.0 ± 0.19 ab1.3 ± 0.28 cd1.2 ± 0.13 bc0.87 ± 0.18 a1.0 ± 0.08 ab
Lignin (%)506<0.00118 ± 2.8 a18 ± 3.3 a27 ± 4.1 c27 ± 2.6 bc29 ± 1.6 d25 ± 0.17 b
Forest floor
Foliar mass (Mg·ha−1)39<0.0010.57 ± 0.4 a1.7 ± 1.4 a1.7 ± 1.0 a6.0 ± 2.6 b8.1 ± 2.8 b37 ± 10 c
Foliar forest floor turnover rate (year−1)93<0.0010.80 ± 0.18 e0.68 ± 0.18 de0.60 ± 0.20 d0.35 ± 0.17 c0.23 ± 0.09 b0.11 ± 0.02 a
Table 3. Collected earthworm species, their ecological group according to Sims and Gerard [15], their incidence at the studied sites (K = Kragelund, M = Mattrup, O = Odsherred, V = Vallø, Vi = Viemose, W = Wedellsborg) and tree species (Fr = Fraxinus, Ac = Acer, Ti = Tilia, Qu = Quercus, Fa = Fagus, Pi = Picea).
Earthworm SpeciesEcological GroupSitesTree Species
Allolobophoridella eiseni (Levinsen)EpigeicKPi
Dendrodrilus rubidus (Savigny)EpigeicK M O V WFr Ac Ti Qu Fa Pi
Dendrobaena octaedra (Savigny)EpigeicK M O V Vi W Fr Ac Ti Qu Fa Pi
Eisenia fetida (Savigny)EpigeicViAc
Lumbricus castaneus (Savigny)EpigeicK M O V Fr Ac Ti Qu Fa
Lumbricus festivus (Savigny)EpigeicWAc Ti Qu
Lumbricus rubellus (Hoffmeister)EpigeicK M O V WFr Ac Ti Qu Fa Pi
Lumbricus terrestris (Linnaeus)AnecicK M O V Vi WFr Ac Ti Qu Fa Pi
Aporrectodea longa (Ude)AnecicM WFr Ac Ti Qu Fa Pi
Aporrectodea caliginosa (Savigny)EndogeicK M O V Vi WFr Ac Ti Qu Fa Pi
Aporrectodea rosea (Savigny)EndogeicM O V Vi WFr Ac Ti Qu Fa Pi
Octolasion cyaneum (Savigny)EndogeicO Vi WFr Ac Ti Qu Fa
Table 4. Summary of the results identifying optimal models for total, anecic, endogeic and epigeic density and biomass. We used glmmADMB zero inflated models with Site as random effect, degrees of freedom (df), Akaike information criterion corrected for small sample sizes (AICc) and R2 describing the correlation between fitted and observed values are shown. Soil predictor variables were measured in the topsoil (0–5 cm). Soil-Al:Litter-Ca is the interaction between exchangeable soil Al concentration and litter Ca concentration. The foliar litter nutrient concentrations were previously published by Vesterdal et al. [35,36].
Response VariablePredictor Variables in Optimal ModeldfAICc Optimal ModelAICc Null ModelR2 Optimal ModelR2 Null Model
Earthworm density
Total Soil: Moisture, Al
Litter: Ca, Mn
Soil-Al:Litter-Ca
9106111250.480.14
Anecic Soil: Al, Na
Litter: N, C:P ratio, Ca
Soil-Al:Litter-Ca
107668500.620.12
Endogeic Soil: Moisture, Al
Litter: C:P ratio, C:N ratio, Ca, Lignin
Soil-Al:Litter-Ca
117258000.280.14
Epigeic Soil: Moisture
Litter: Mn
Forest floor turnover rate
78048170.420.36
Earthworm biomass
Total Soil: Moisture, Al
Litter: Ca
Soil-Al:Litter-Ca
78219020.530.12
Anecic Soil: Al, Na
Litter: N, C:P ratio
86627390.660.13
Endogeic Soil: Al, Moisture
Litter: Ca, Lignin, C:P ratio, C:N ratio
Soil-Al:Litter-Ca
115145610.210.13
Epigeic Soil: Moisture
Litter: Mn, C:P ratio
74825090.530.40
Table 5. Summary of the results identifying optimal models for total, anecic, endogeic and epigeic density and biomass. We used glmmADMB zero inflated models with Site as random effect. The foliar litter nutrient concentrations were previously published by Vesterdal et al. [35,36].
Predictor VariablesTotal DensityAnecic DensityEndogeic DensityEpigeic Density
z valuep valuez valuep valuez valuep valuez valuep value
Soil Al−5.7<0.001−6.0<0.001−5.1<0.001
Soil Na −2.80.006
Soil Moisture5.1<0.001 4.9<0.0012.70.007
Litter Ca2.80.0063.4<0.0013.20.001
Litter N 4.7<0.001
Litter Mn2.60.01 3.10.002
Litter lignin 3.4<0.001
Litter C:N ratio −4.5<0.001
Litter C:P ratio 4.63<0.0016.2<0.001
Forest floor turnover rate 2.00.047
Soil-Al:Litter-Ca4.0<0.0012.380.0186.4<0.001
Total BiomassAnecic BiomassEndogeic BiomassEpigeic Biomass
z valuep valuez valuep valuez valuep valuez valuep value
Soil Al−6.2<0.001−6.0<0.001−3.5<0.001
Soil Na −3.10.002
Soil Moisture4.4<0.001 3.7<0.0013.5<0.001
Litter Ca2.40.017 3.20.001
Litter N 5.3<0.001
Litter Mn 3.6<0.001
Litter lignin 3.00.003
Litter C:N ratio −3.4<0.001
Litter C:P ratio 4.0<0.0014.7<0.001-3.9<0.001
Soil-Al:Litter-Ca5.0<0.001 4.6<0.001

