Article

The Influence of Monsoon Climate on Latewood Growth of Southwestern Ponderosa Pine

1
Department of Forestry and Wildland Resources, Humboldt State University, 1 Harpst Street, Arcata, CA 95521, USA
2
School of Forestry and Merriam-Powell Center for Environmental Research, Northern Arizona University, P.O. Box 15018, Flagstaff, AZ 86011, USA
3
Department of Biological Sciences and Center for Ecosystem Science and Society, Northern Arizona University, P.O. Box 5640, Flagstaff, AZ 86011, USA
*
Author to whom correspondence should be addressed.
Forests 2017, 8(5), 140; https://doi.org/10.3390/f8050140
Submission received: 16 March 2017 / Revised: 11 April 2017 / Accepted: 19 April 2017 / Published: 25 April 2017

Abstract

:
The North American Monsoon delivers warm season precipitation to much of the southwestern United States, yet the importance of this water source for forested ecosystems in the region is not well understood. While it is widely accepted that trees in southwestern forests use winter precipitation for earlywood production, the extent to which summer (monsoon season) precipitation supports latewood production is unclear. We used tree ring records, local climate data, and stable isotope analyses (δ18O) of water and cellulose to examine the importance of monsoon precipitation for latewood production in mature ponderosa pine (Pinus ponderosa Dougl.) in northern Arizona. Our analyses identified monsoon season vapor pressure deficit (VPD) and Palmer Drought Severity Index (PDSI) as significant effects on latewood growth, together explaining 39% of latewood ring width variation. Stem water and cellulose δ18O analyses suggest that monsoon precipitation was not directly used for latewood growth. Our findings suggest that mature ponderosa pines in this region utilize winter precipitation for growth throughout the entire year. The influence of monsoon precipitation on growth is indirect and mediated by its effect on atmospheric moisture stress (VPD). Together, summer VPD and antecedent soil moisture conditions have a strong influence on latewood growth.

1. Introduction

The North American Monsoon delivers warm season precipitation to much of the southwestern United States, yet the importance of this water source for forested ecosystems in the region is not well understood. Understanding the relative importance of winter and monsoon precipitation on tree growth in the USA Southwest is important, as drought-induced forest mortality is widespread [1,2,3,4,5] and the region will likely dry substantially in the next century [6,7,8,9,10]. Likely reductions in winter snow in the western USA [11,12,13,14] will decrease winter recharge of forest soils, and projected earlier spring snowmelt will likely increase growing season length [15] and forest water demand. The North American Monsoon System has had major shifts in the past [16,17] and a substantial northward shift in monsoon precipitation distribution is expected in the future [18,19,20]. This shift could reduce summer precipitation in areas that now receive a large fraction of annual precipitation during the summer monsoon season. Understanding the ecological implications of these potential changes in the timing and form of precipitation can be improved by studies of seasonal sources of moisture to dominant vegetation.
Distinct winter and summer inputs to the bimodal precipitation regime of the southwestern United States are caused by seasonal changes in atmospheric circulation [21]. Winter precipitation from northern Pacific systems falls during periods of low evaporative demand and therefore penetrates deep into the soil, while late summer monsoon precipitation derived from subtropical eastern Pacific and Gulf of Mexico air masses occurs as short, intense events when evaporation is high [21,22]. These conditions largely restrict infiltration of monsoon precipitation to upper soil layers [23,24]. Winter and summer precipitation inputs have distinct isotopic signatures, with winter precipitation being more depleted in the heavier isotopes (2H and 18O) than summer precipitation [25]. The combination of greater infiltration by the isotopically more depleted winter precipitation and greater evaporative enrichment of isotopically heavier summer precipitation creates an isotopic gradient from heavier to lighter with increasing soil depth [24,26,27].
The distinct isotopic signatures of seasonal precipitation can be used to determine plant water sources throughout the year. Stable isotope analysis of water in precipitation, soil, and plant stems is commonly used to study plant reliance on seasonal precipitation [7,21,22,24,27,28,29]. Stable isotope analysis of alpha cellulose can also identify seasonal water sources and integrates water use over a longer time period than stem water analyses [30,31,32,33]. Although alpha cellulose δ18O is enriched to varying degrees compared to source water because of leaf water evaporative enrichment and biochemical fractionation during photosynthesis and cellulose synthesis [34,35], it can still be used to detect differences in source water [21,22,33]. Dendrochronology provides a third method to investigate tree seasonal water use by studying correlations between annual or sub-annual ring widths and seasonal precipitation inputs [23,24,36,37].
Our study sought to understand ponderosa pine (Pinus ponderosa Dougl. ex Laws.) use of monsoon precipitation and its relationship to latewood growth. Dendrochronological [25,36,37,38,39,40] and isotopic [24,26,27,33,41,42] analyses suggest utilization of monsoon precipitation for latewood production. Furthermore, at the ecosystem-scale, monsoon-season gross primary productivity in northern Arizona ponderosa pine forests is positively related to the amount of precipitation during this season [43]. However, in this same region, ponderosa pine stem water had a consistent isotopic signature of winter precipitation year round, including the monsoon season, over a two year period [24]. Thus, there is a discrepancy among studies: research using latewood ring widths, cellulose δ18O, and cellulose δ13C measurements show a correlation between summer growth and monsoon precipitation amounts, whereas direct measurement of summer stem water δ2H fails to detect the use of monsoon precipitation for growth.
We reasoned that the positive relationship between monsoon precipitation and latewood growth observed in the above studies, despite the lack of isotopic evidence for direct uptake of this moisture, might be based on the effect of monsoon precipitation on vapor pressure deficit (VPD). A measure of atmospheric water demand, VPD is the driving force for transpiration and influences plant water potential, stomatal conductance, and photosynthesis. Increased VPD, when coupled with limited soil moisture, reduces stomatal conductance and photosynthesis, and in the extreme can drive hydraulic failure, cessation of growth, and depletion of carbohydrates [2,44,45,46]. Our earlier research suggests that winter precipitation supplies the water used by ponderosa pine for latewood growth [24]. In this study, we investigate the possibility that monsoon season precipitation indirectly influences latewood production via its effect on VPD and therefore stomatal conductance and photosynthesis. Specifically, we hypothesize that the reduction in VPD associated with monsoon precipitation, rather than the precipitation input to the soil itself, is the dominant influence on latewood growth. Unlike earlier studies of latewood growth that used either dendrochronological or isotopic analyses, we tested this hypothesis using both dendrochronological and isotopic methods.

2. Materials and Methods

2.1. Study Site and Trees

Our study site was located in the Fort Valley Experimental Forest (USDA Forest Service, Rocky Mountain Research Station) 10 km northwest of Flagstaff, AZ, USA (35°15′58″ N, 111°42′1″ W, elevation 2200 m). The soils are classified as basaltic, fine montmorillonitic complex of frigid Typic Argiborolls and Mollic Eutroboralfs [47]. A 1998 experimental thinning in this forest yielded average post-treatment basal area densities ranging from 15.8 to 38.2 m2 ha−1 [48]. We initially selected seventy-two ≥60 cm diameter at breast height (DBH), healthy, and non-leaning ponderosa pine trees across a range of basal area densities. From these 72 trees, we then randomly selected thirty-six as study trees. These 36 trees had an average height of 28.9 ± 0.76 m; a diameter at breast height of 73.8 ± 1.4 cm; an age of 219 ± 11 year; and a neighborhood basal area density, as measured with a basal area factor 10 angle gauge, of 13.5 ± 1.2 m2 ha−1. For the alpha cellulose δ18O component of this study, we randomly sub-sampled 10 trees from the 36 study trees. These 10 trees for δ18O analysis had an average height of 27.0 ± 1.2 m; a DBH of 73.0 ± 2.2 cm; and an age of 200 ± 23 year.

2.2. Core Collection and Processing

2.2.1. Latewood Ring Width

We sampled increment cores from 36 treetops (average collection height of 22.1 ± 0.5 m) using arborist-style climbing techniques [49] in summer 2009. Treetop increment cores were taken from as high on the bole as was deemed safe to climb (usually within 5 m of apical meristem). In each tree, we collected cores from two treetop radii for a total of 72 cores. Treetops were used because they are the most climatically sensitive position; the methodology for core preparation and analysis has been previously described [50]. Treetop latewood chronology statistics from COFECHA [51] and ARSTAN [52] include: sample size = 27 trees, mean annual growth = 0.25 mm, mean sensitivity = 0.49, series intercorrelation = 0.45, first order autocorrelation = 0.43, and expressed population signal [53] = 0.96. When a core could not be confidently cross-dated, we removed that core from the analysis, resulting in a final sample size of 27 trees. After cross-dating all cores to make a treetop latewood chronology, we truncated the series to 1948 to 2008 because instrumental climate data for VPD at our study site are available only after 1948. All analyses are therefore based on the sixty-year time period 1948–2008. We also constructed an adjusted latewood ring width chronology where the latewood autocorrelation with earlywood ring width was removed [36,37,39,42]. However, for monsoon climate correlations we found the unadjusted latewood ring width index (RWI) chronology more informative and therefore report those analyses in this paper.

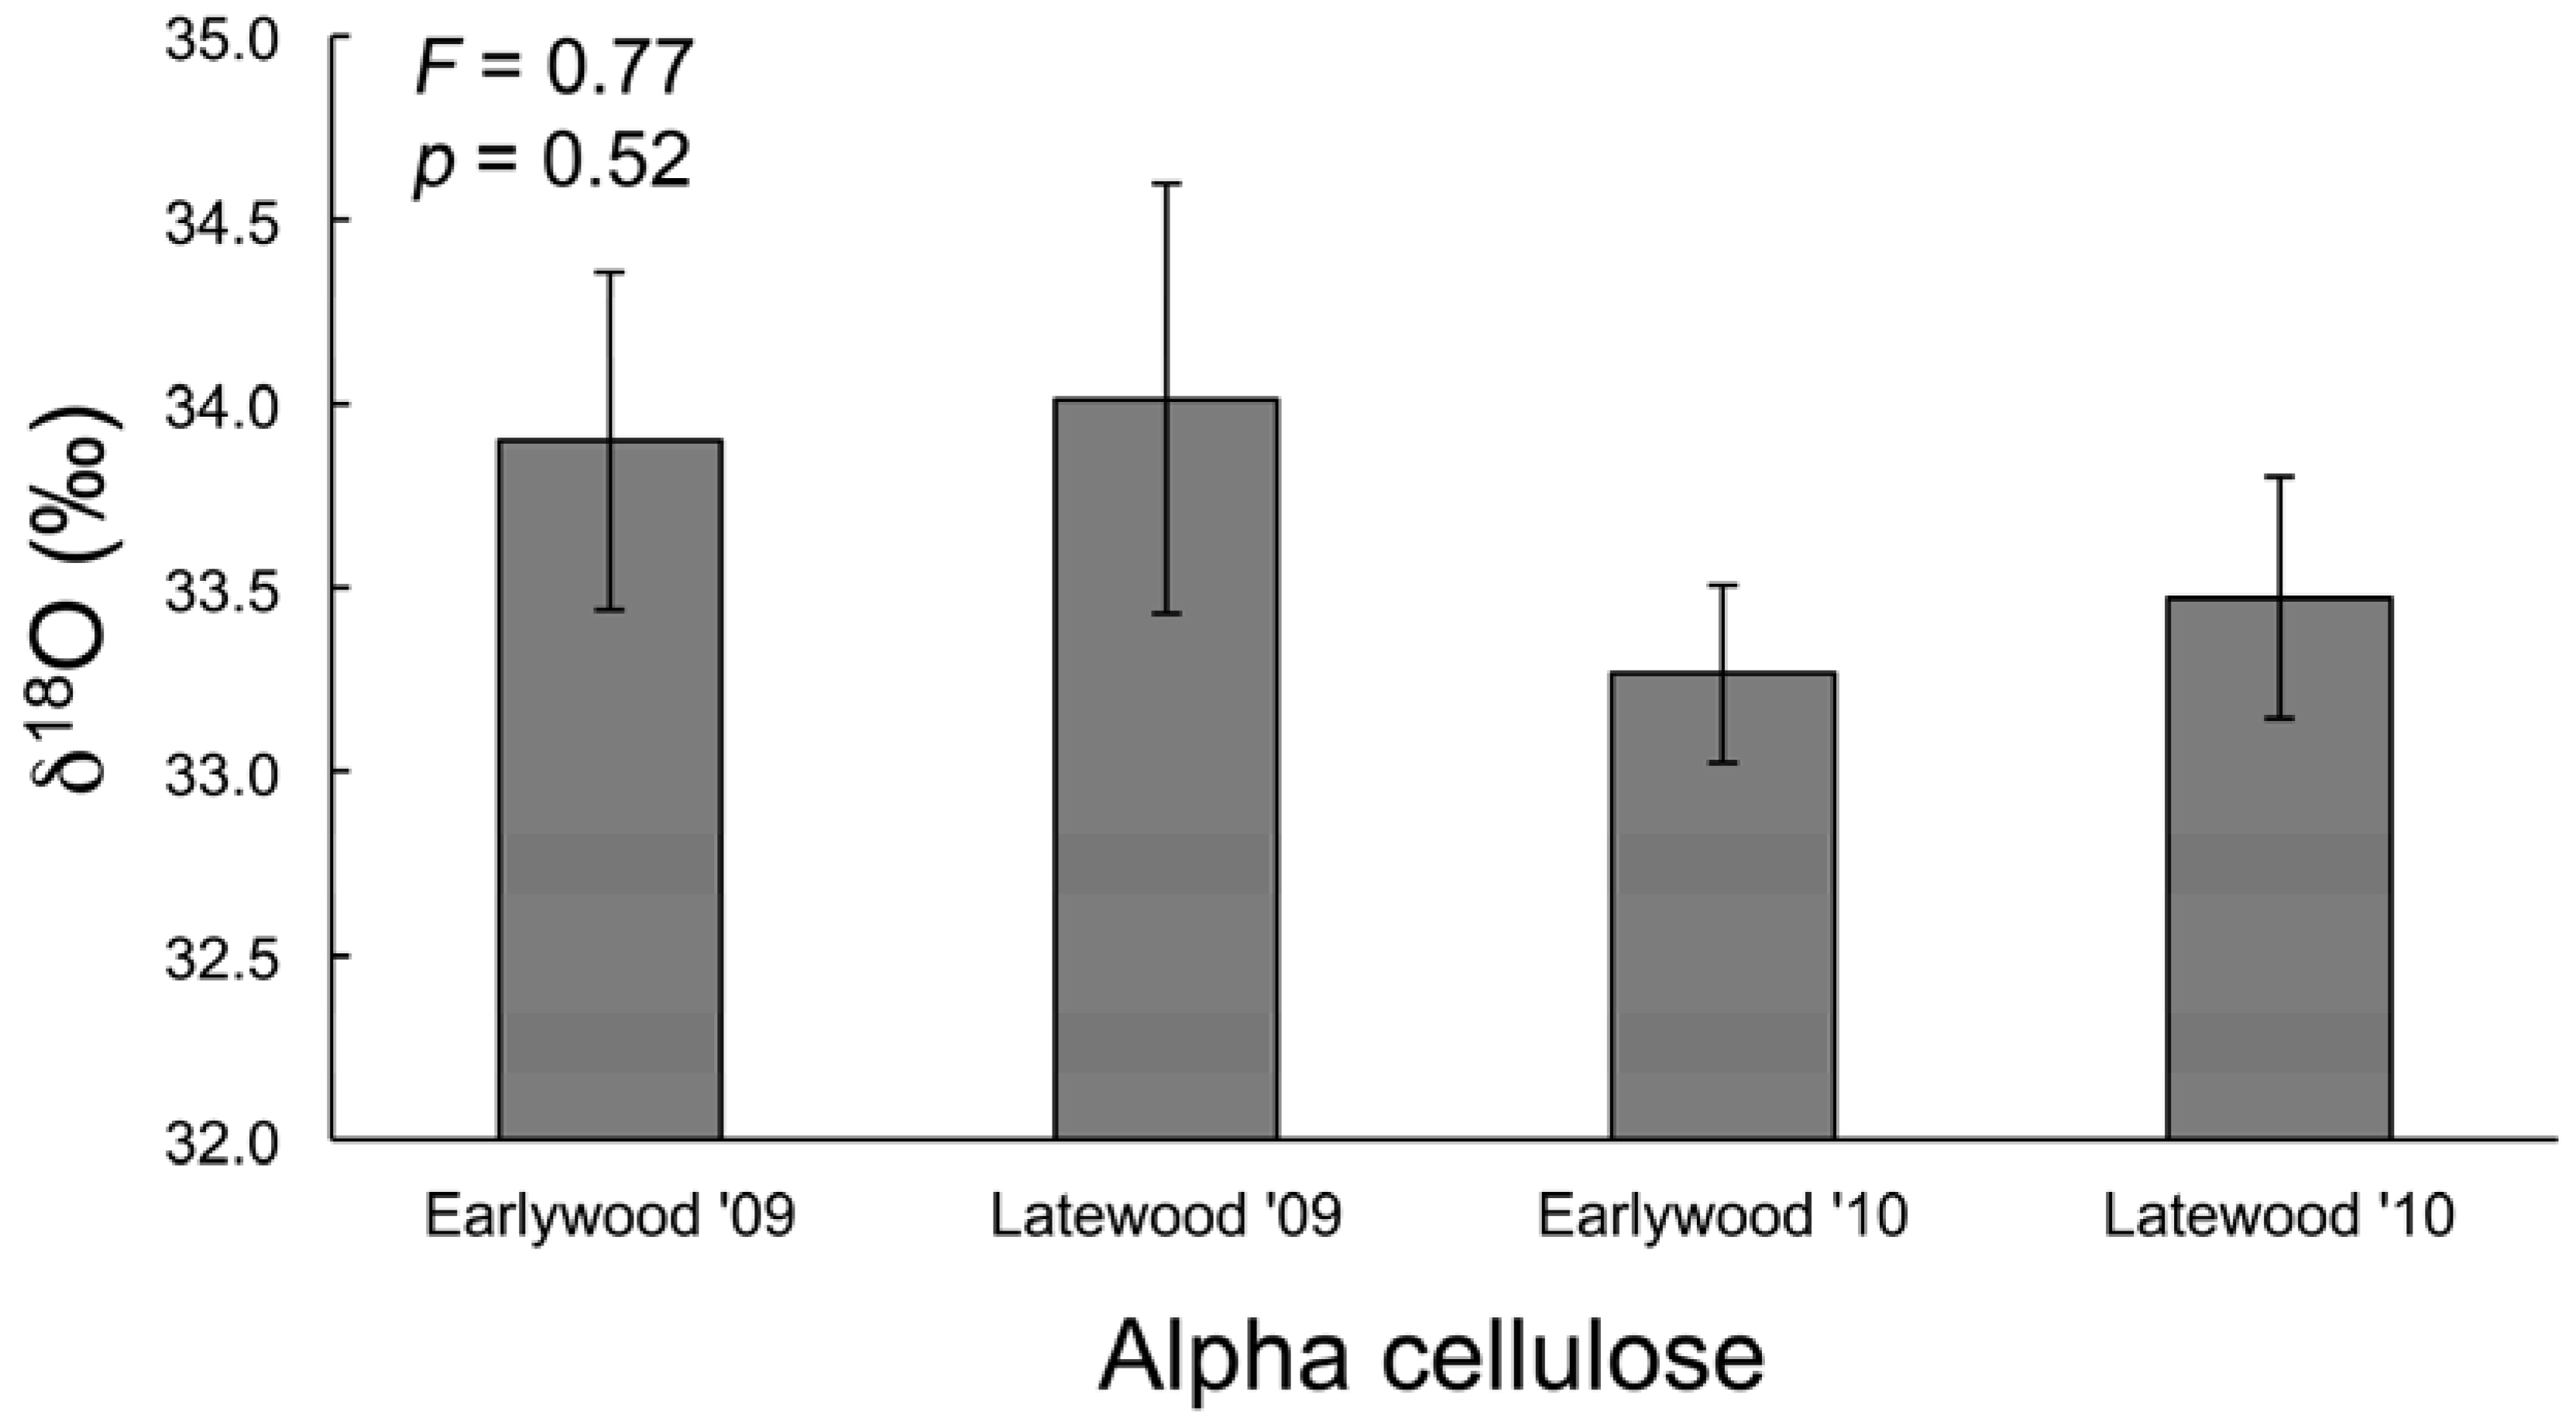
2.2.2. Alpha Cellulose δ18O

For the alpha cellulose component of this study, in December 2010 we used a 12 mm increment borer to collect cores at 1.34 m above the ground at three azimuth angles from each of 10 study trees randomly selected from the 36 study trees used in the dendrochronological portion of this study. As removal of three large-diameter cores would likely damage treetops, we cored at breast height for this portion of our study. These 30 cores were prepared using standard dendrochronological techniques [50].

2.3. Isotopic Analyses

2.3.1. Precipitation Samples

We collected local precipitation between August 2008 and December 2010 by the methods described in Kerhoulas et al. [24]. When estimating seasonal precipitation isotopic signatures, we defined winter precipitation as falling from October through March, spring precipitation as April, May, and June, and monsoon precipitation as July, August, and September. We used the full two-year dataset of precipitation samples to calculate an average and range of isotopic composition for winter, spring, and monsoon season precipitation. For corroboration, we compared our δ18O measurements of local precipitation to those of the United States Network for Isotopes in Precipitation (USNIP) as well as to modeled estimates of local precipitation δ18O values based on our study site’s latitude, longitude, and elevation [54]. Our measured values agreed well with these other estimates, differing by 0.18‰ and 0.22‰ for 18O in winter and monsoon precipitation, respectively.

2.3.2. Soil and Stem Water Samples

We collected soil (40 cm depth) and stem water samples in winter (March 2009, April 2010), spring (June 2009 and 2010), and the late-summer monsoon season (August 2009 and 2010) to characterize seasonal water isotope signatures [24]. We report soil water data from the 40 cm depth, as previous work in this study system showed trees predominantly draw water from this depth [24].

2.3.3. Water Sample Analyses

Rainwater and soil and plant extracted water were analyzed at the Colorado Plateau Stable Isotope Laboratory (CPSIL) by isotope ratio infrared spectroscopy on an off-axis cavity output spectrometer (Los Gatos Research Inc., Mountain View, CA, USA) with a δ18O precision of 0.12‰. Although extracted stem water of some species can contain compounds that interfere with accurate δ18O measurements [55], the effect is small (0.24‰) relative to the differences in δ18O reported here (e.g., winter versus monsoon precipitation δ18O = −13.29‰ versus −4.90‰).

2.3.4. Alpha Cellulose δ18O Samples

For isotopic analysis of tree ring alpha cellulose δ18O, we mounted and sanded the 12 mm cores, then excised the 2009 and 2010 annual rings using a scalpel under a 20× dissecting microscope, dividing each year into earlywood and latewood. A middle section of each annual ring between earlywood and latewood was discarded to minimize risk of contamination in the sub-annual samples. The excised middle sections of each annual ring contained both earlywood and latewood, thereby ensuring that each sub-annual sample was purely earlywood or purely latewood. For each tree, the three samples (one per 12 mm core taken) of each sub-annual ring were pooled, dried at 70 °C for 48 h, and powdered with a ball mill (MM200, Retsch, Haan, Germany). Alpha cellulose was extracted using a Soxhlet apparatus at the University of Arizona’s Laboratory of Tree-Ring Research in Tucson, AZ, USA [56]. Roughly 100 mg of each ground sample was loaded into a fiber filter bag (ANKOM Technology, Macedon, NY, USA) that was then heat sealed for cellulose extraction. To remove secondary compounds such as resins and oils, filter bags were placed in a Soxhlet apparatus to reflux a 2:1 mix of toluene:ethanol for 12 h, dried, extracted for another 12 h in pure ethanol, and dried again. To remove soluble sugars and low molecular mass polysaccharides, sample bags were boiled in deionized (DI) water for five hours. Lignin was removed with a sodium chlorite:glacial acetic acid solution that was periodically replaced over a three day period. Finally, to remove other non-alpha-celluloses, samples were submerged in 17% sodium hydroxide for one hour, rinsed repeatedly with DI water, submerged in 10% glacial acetic acid for one hour, and again rinsed extensively with DI water [57]. Alpha cellulose samples were then dried at 70 °C for 48 h.

2.3.5. Alpha Cellulose δ18O Analyses

For δ18O measurements of alpha cellulose, 0.35 mg of each sample was loaded into a silver capsule and converted to CO by pyrolysis in a hot (1400 °C) alumina:glassy carbon reactor (Thermo-Finnigan TC/EA, Bremen, Germany) and separated from other gases in a 0.6-m molecular sieve 5A gas chromatography (GC) column connected to a Thermo-Quest Finnigan deltaPlus XL isotope ratio mass spectrometer (IRMS, Bremen, Germany) at CPSIL. The precision of δ18O value determinations for organic substances on this IRMS was ±0.14‰.
All δ18O values are reported in “delta” notation, which expresses the isotopic composition of a material relative to that of an accepted standard (Vienna Standard Mean Ocean Water, V-SMOW) on a per mil (‰) basis:
δ = (Rsample/Rstandard − 1) × 1000
where δ is the isotope ratio and R is the molar ratio of heavy to light isotopes.

2.4. Climate Data

Climate parameters investigated in this study included VPD, Palmer Drought Severity Index (PDSI), and precipitation. We calculated monthly and seasonal averages for the monsoon period. We also calculated the average daily maximum VPD for each month using hourly relative humidity and air temperature data from the Flagstaff Pulliam Airport weather station 16 km southeast of our study site (National Climate Data Center). Using data from the Fort Valley weather station approximately 4 km east of our study site (United States Historical Climatology Network), we obtained monthly average PDSI (PDSI hereafter, provided by station) and calculated total precipitation (precipitation hereafter).

2.5. Data Analysis

We used five different analyses to address our research question regarding the relationship of monsoon precipitation to latewood growth. The first three analyses use latewood ring widths to investigate the influences of monsoon VPD, PDSI, and precipitation on latewood growth. The fourth and fifth analyses use isotopic measurements to identify the source water (winter vs. monsoon) used for latewood production.
For the first analysis, we calculated Pearson correlation coefficients (r) for the relationships between standardized latewood ring width and VPD, PDSI, and precipitation for each tree using R (R Foundation for Statistical Computing, Vienna, Austria). For each climate parameter, we investigated both monthly values and a monsoon season average value. Using time (July, August, September, monsoon) and climate parameters (VPD, PDSI, precipitation) as model effects, we performed two-way analyses of variance (ANOVA) on r values (dependent variable) with Tukey’s Honestly Significant Difference (HSD) orthogonal contrast post hoc tests [50]. Levine and Bartlett tests were used to test the assumption of homogeneous variance. Significance was determined at the 95% confidence level (α = 0.05). All ANOVAs were performed using JMP (SAS Institute, Cary, NC, USA).
For the second analysis, we used Akaike’s Information Criterion (AIC) to identify the best model using monsoon climate parameters (VPD, PDSI, and/or precipitation) to explain latewood ring width variation. This analysis used latewood ring widths from the standardized treetop chronology. We calculated AIC values for various models in R using VPD, PDSI, precipitation, and all possible interactions to explain variation in latewood ring width. We then used these AIC values to determine which combination of climate parameters yielded the best model for latewood ring width [58]. We also calculated simple difference values (∆i) for each model. Where ∆i values were greater than 10, models were considered to be poor with no statistical support; models with ∆i values differing by less than 2 were considered approximately equal [58].
For the third analysis, we used reverse order stepwise multivariate linear regression to identify the best model using climate parameters (VPD, PDSI, and/or precipitation) to explain latewood ring width variation. For this analysis, our dependent variable was standardized annual latewood ring width from the treetop chronology. Our independent variables included monthly and seasonal values of monsoon VPD, PDSI, and precipitation.
For the fourth analysis, we investigated the δ18O composition of precipitation, soil, and stem water in 2009 and 2010. We used the 2009–2010 precipitation samples to calculate a seasonal (winter, spring, monsoon) average precipitation value. We then used a one-way ANOVA (see above) to determine the effects of time (July, August, September) on precipitation, soil, and stem water δ18O. We also ran one-way ANOVAs to determine if precipitation, soil, and stem water δ18O differed significantly within a sampling month.
For the fifth analysis, we investigated the δ18O composition of latewood and earlywood cellulose in 2009 and 2010. A two-way ANOVA (see above) tested for differences in cellulose δ18O between years and between earlywood and latewood.

3. Results

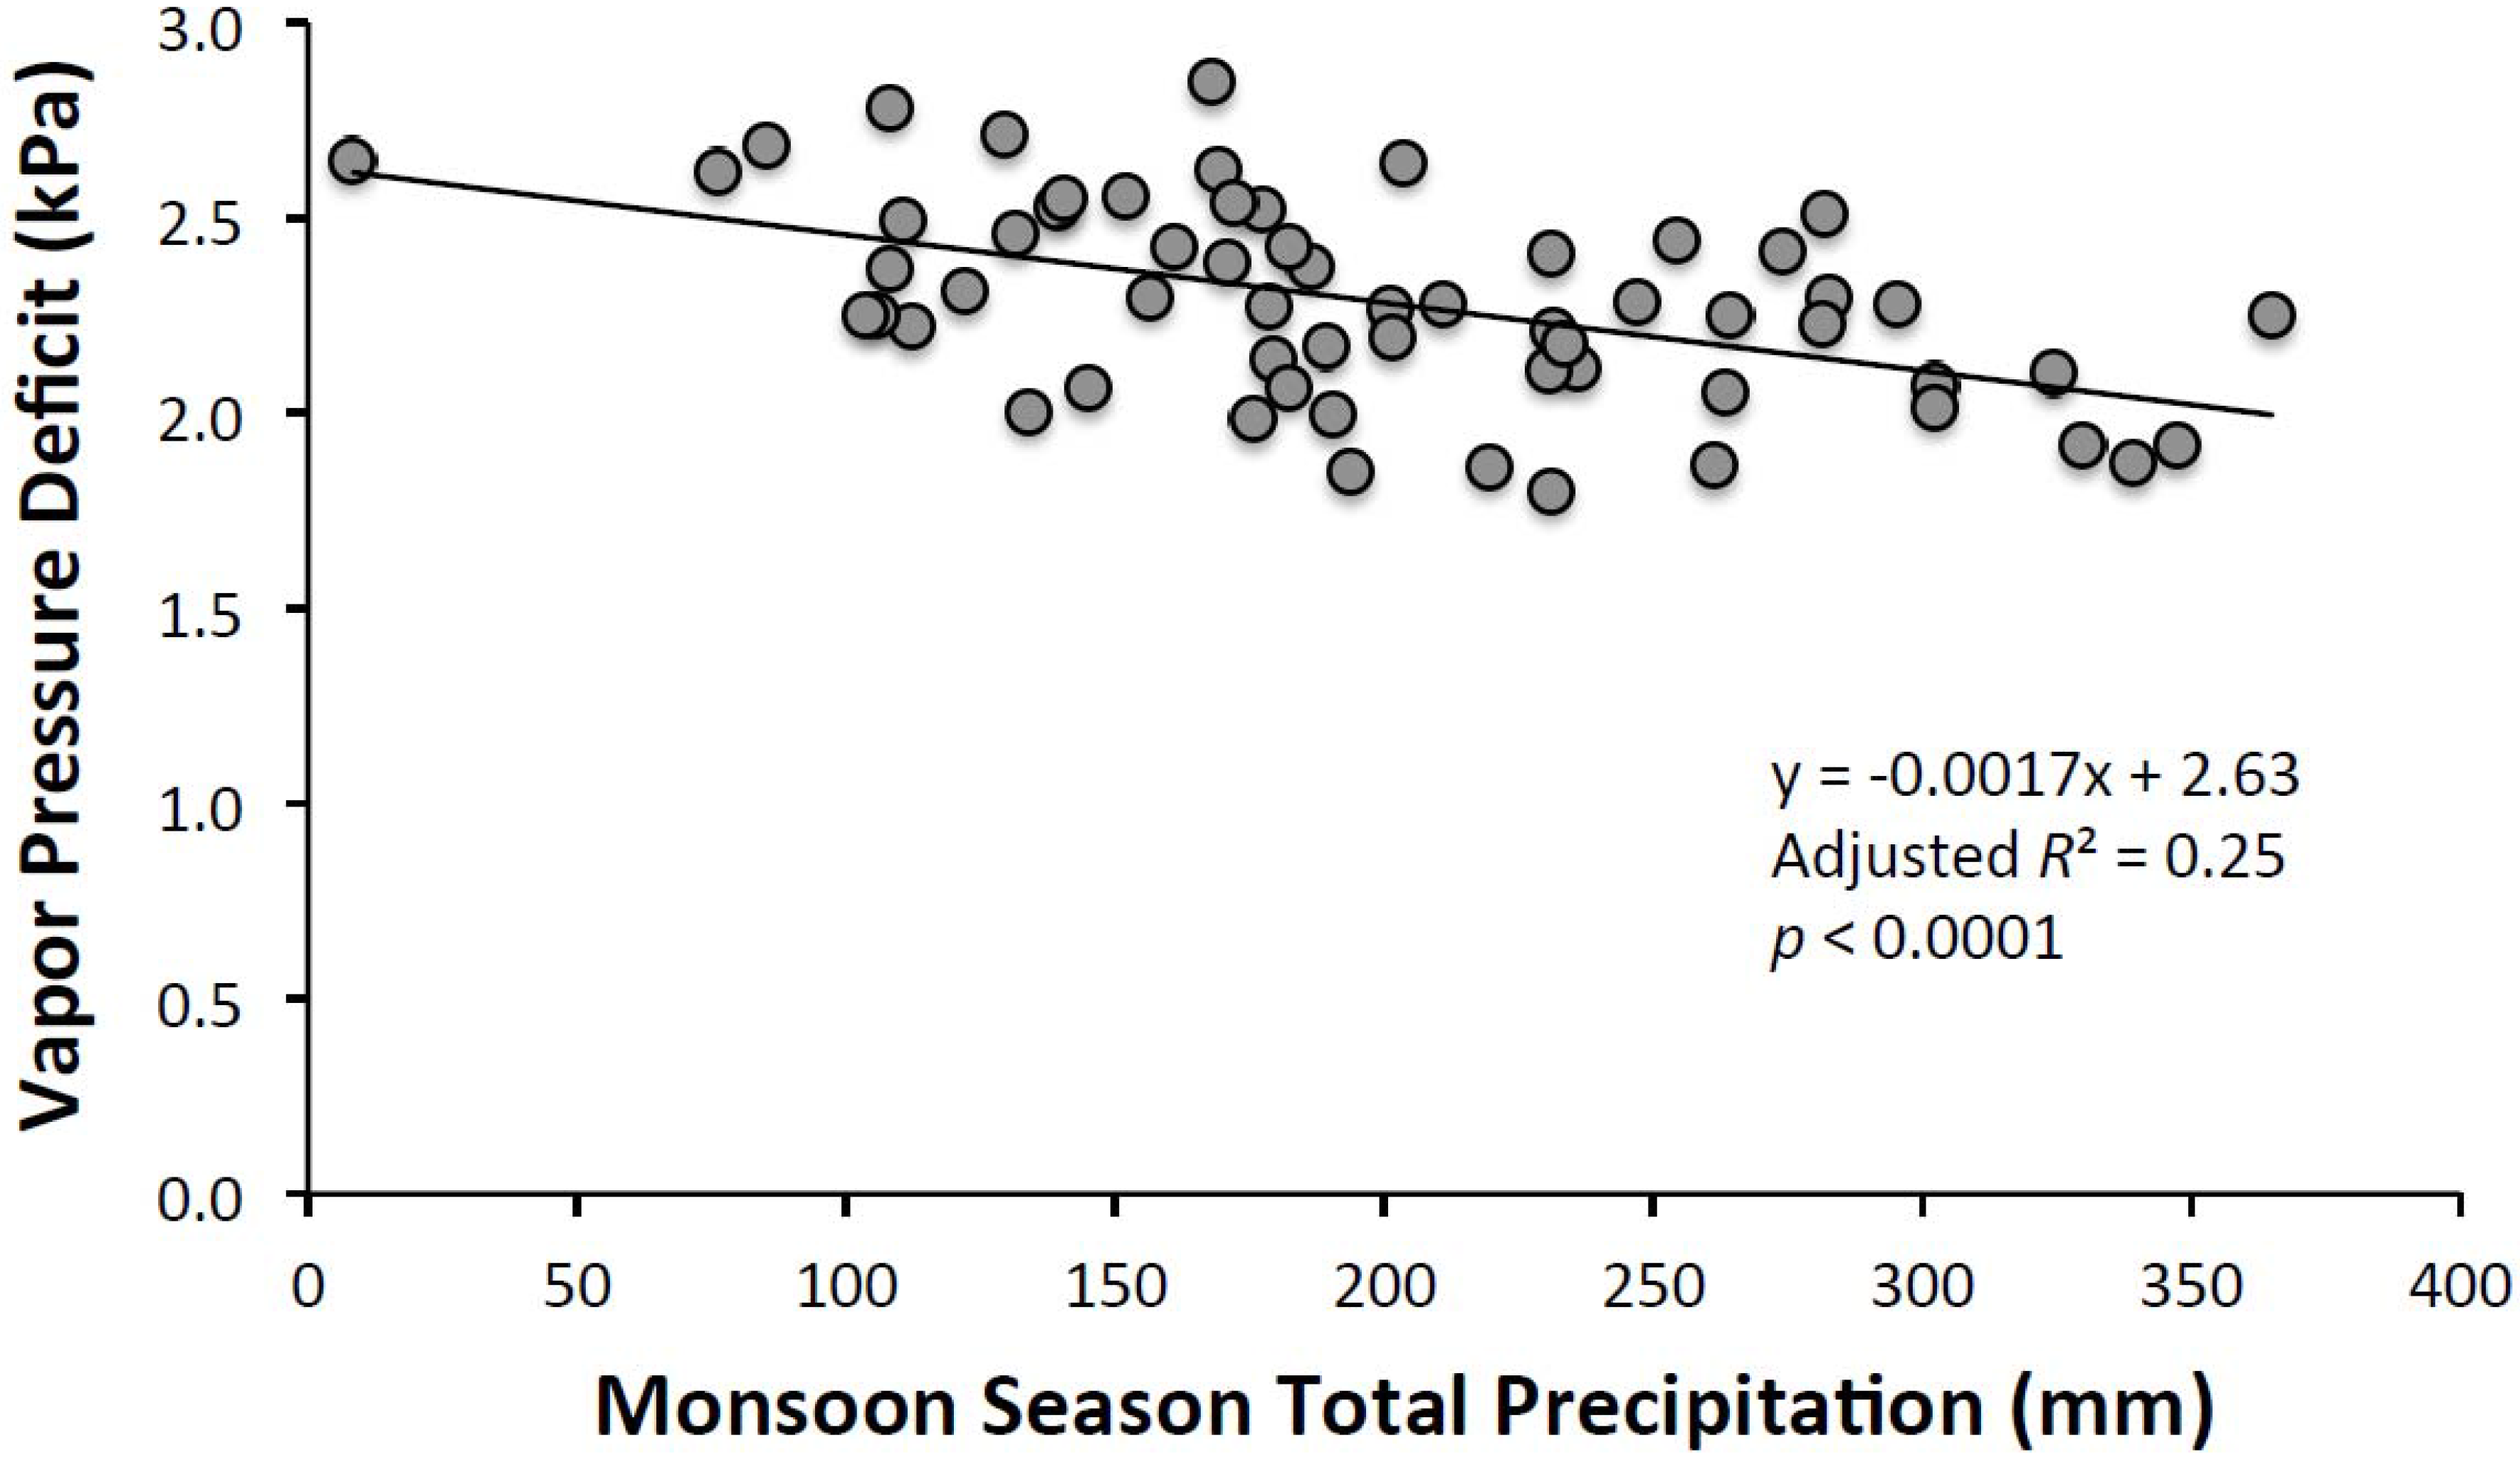
3.1. Climatic Analyses

To investigate the influence of monsoon season precipitation on atmospheric moisture stress, we analyzed the relationship between the sum of July through September precipitation and the average daily maximum VPD during the monsoon season for years 1948 through 2008. During this period, monsoon season average total precipitation was 200 ± 10 mm and maximum daily VPD was 2.28 ± 0.03 kPa. The season-averaged maximum daily VPD was significantly negatively correlated with seasonal precipitation: VPD (kPa) = 2.63 − 0.00174 × Precip (mm) (Figure 1, adjusted R2 = 0.254, p < 0.0001).

3.2. Statistical Analyses

Three sets of statistical measurements (correlation coefficients, AIC values, and multivariate regression) all identified August climate variables as the most important in determining latewood ring width.

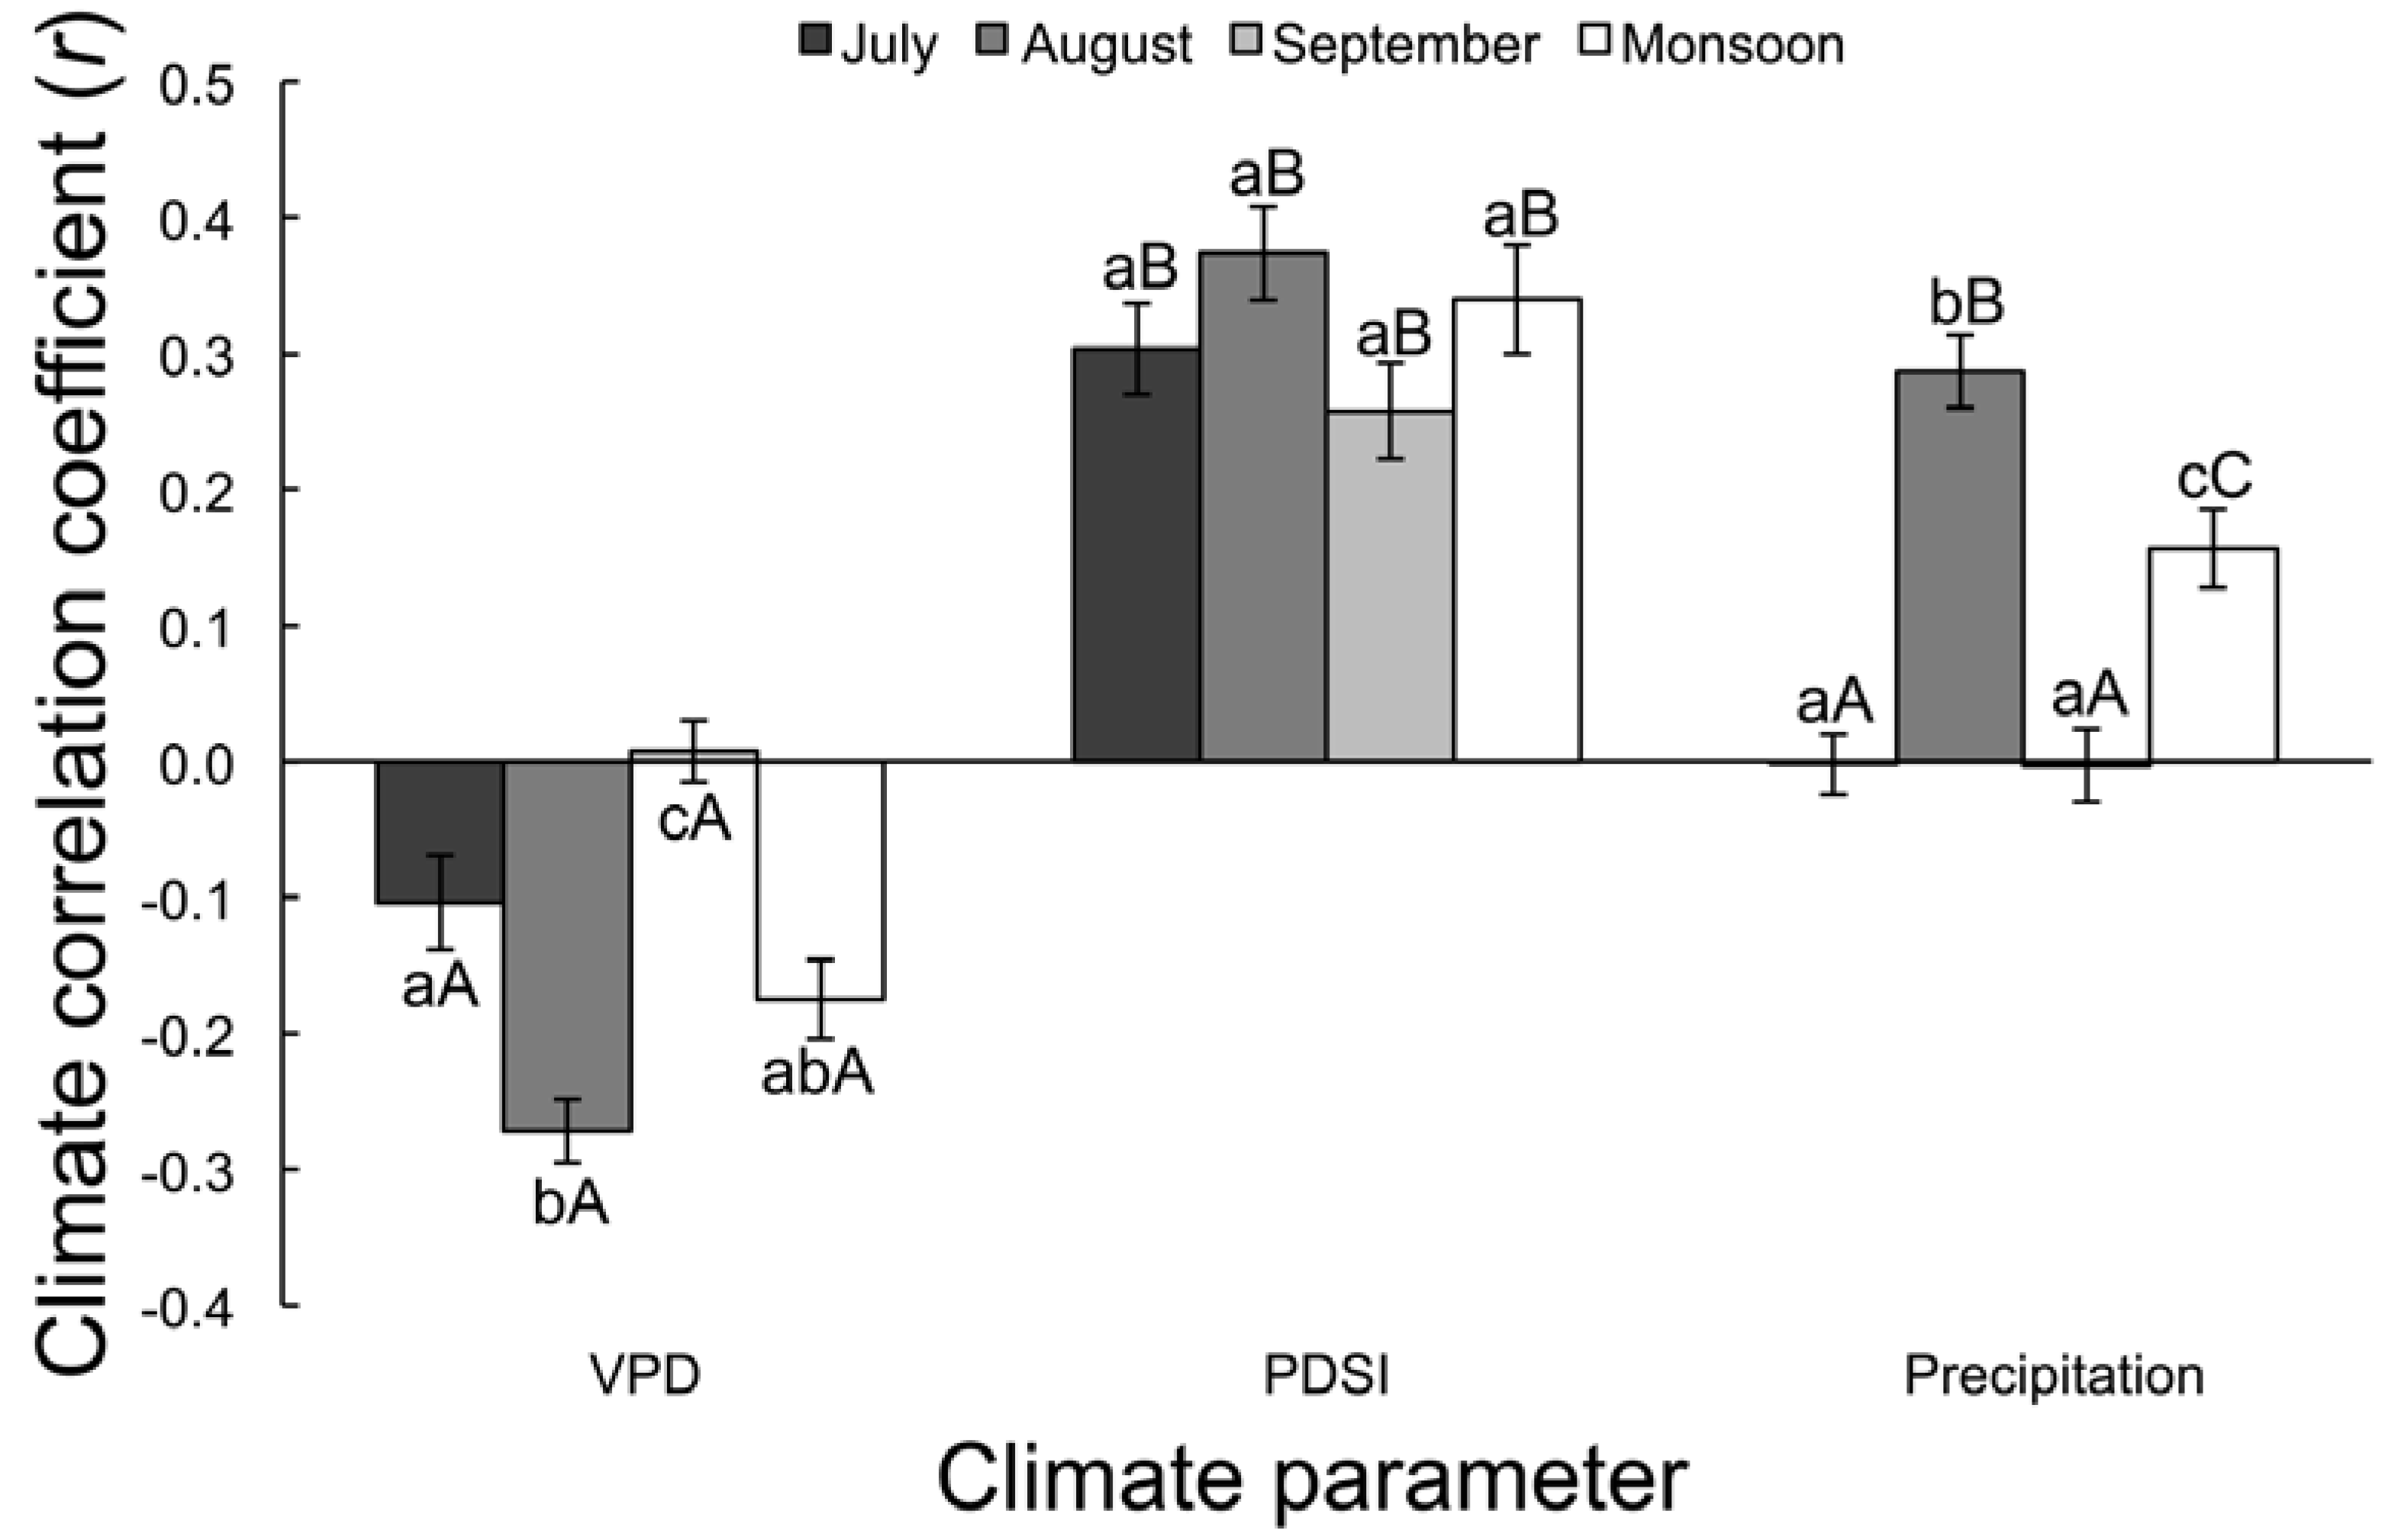
3.2.1. Correlation Analysis

Among individual monsoon season months, August values of the three climate parameters (VPD, PDSI, precipitation) were most strongly correlated with latewood ring width (Figure 2, Table 1). For all months and the monsoon season as a whole, PDSI explained more of the variation in latewood ring width than VPD and precipitation (Figure 2). For all months and the monsoon season as a whole, the strength of correlation between latewood ring width and precipitation was similar to the strength of correlation between latewood ring width and VPD (Figure 2).

3.2.2. Akaike’s Information Criterion

The lowest (best) AIC value, −15.67, was for a model using August VPD, PDSI, and precipitation to explain latewood ring width variability (Table 2). However, a model using only August VPD and PDSI had a similar AIC value of −15.36. That these models differ by less than 2 indicates that they are approximately equal in power. Thus, the addition of precipitation into the model does not significantly improve the model’s predictive capability [58]. August climate parameters generally yielded the lowest AIC values, indicating the strongest models. Precipitation alone as an explanatory variable was ranked last or second to last in all time periods evaluated (July, August, September, monsoon season).

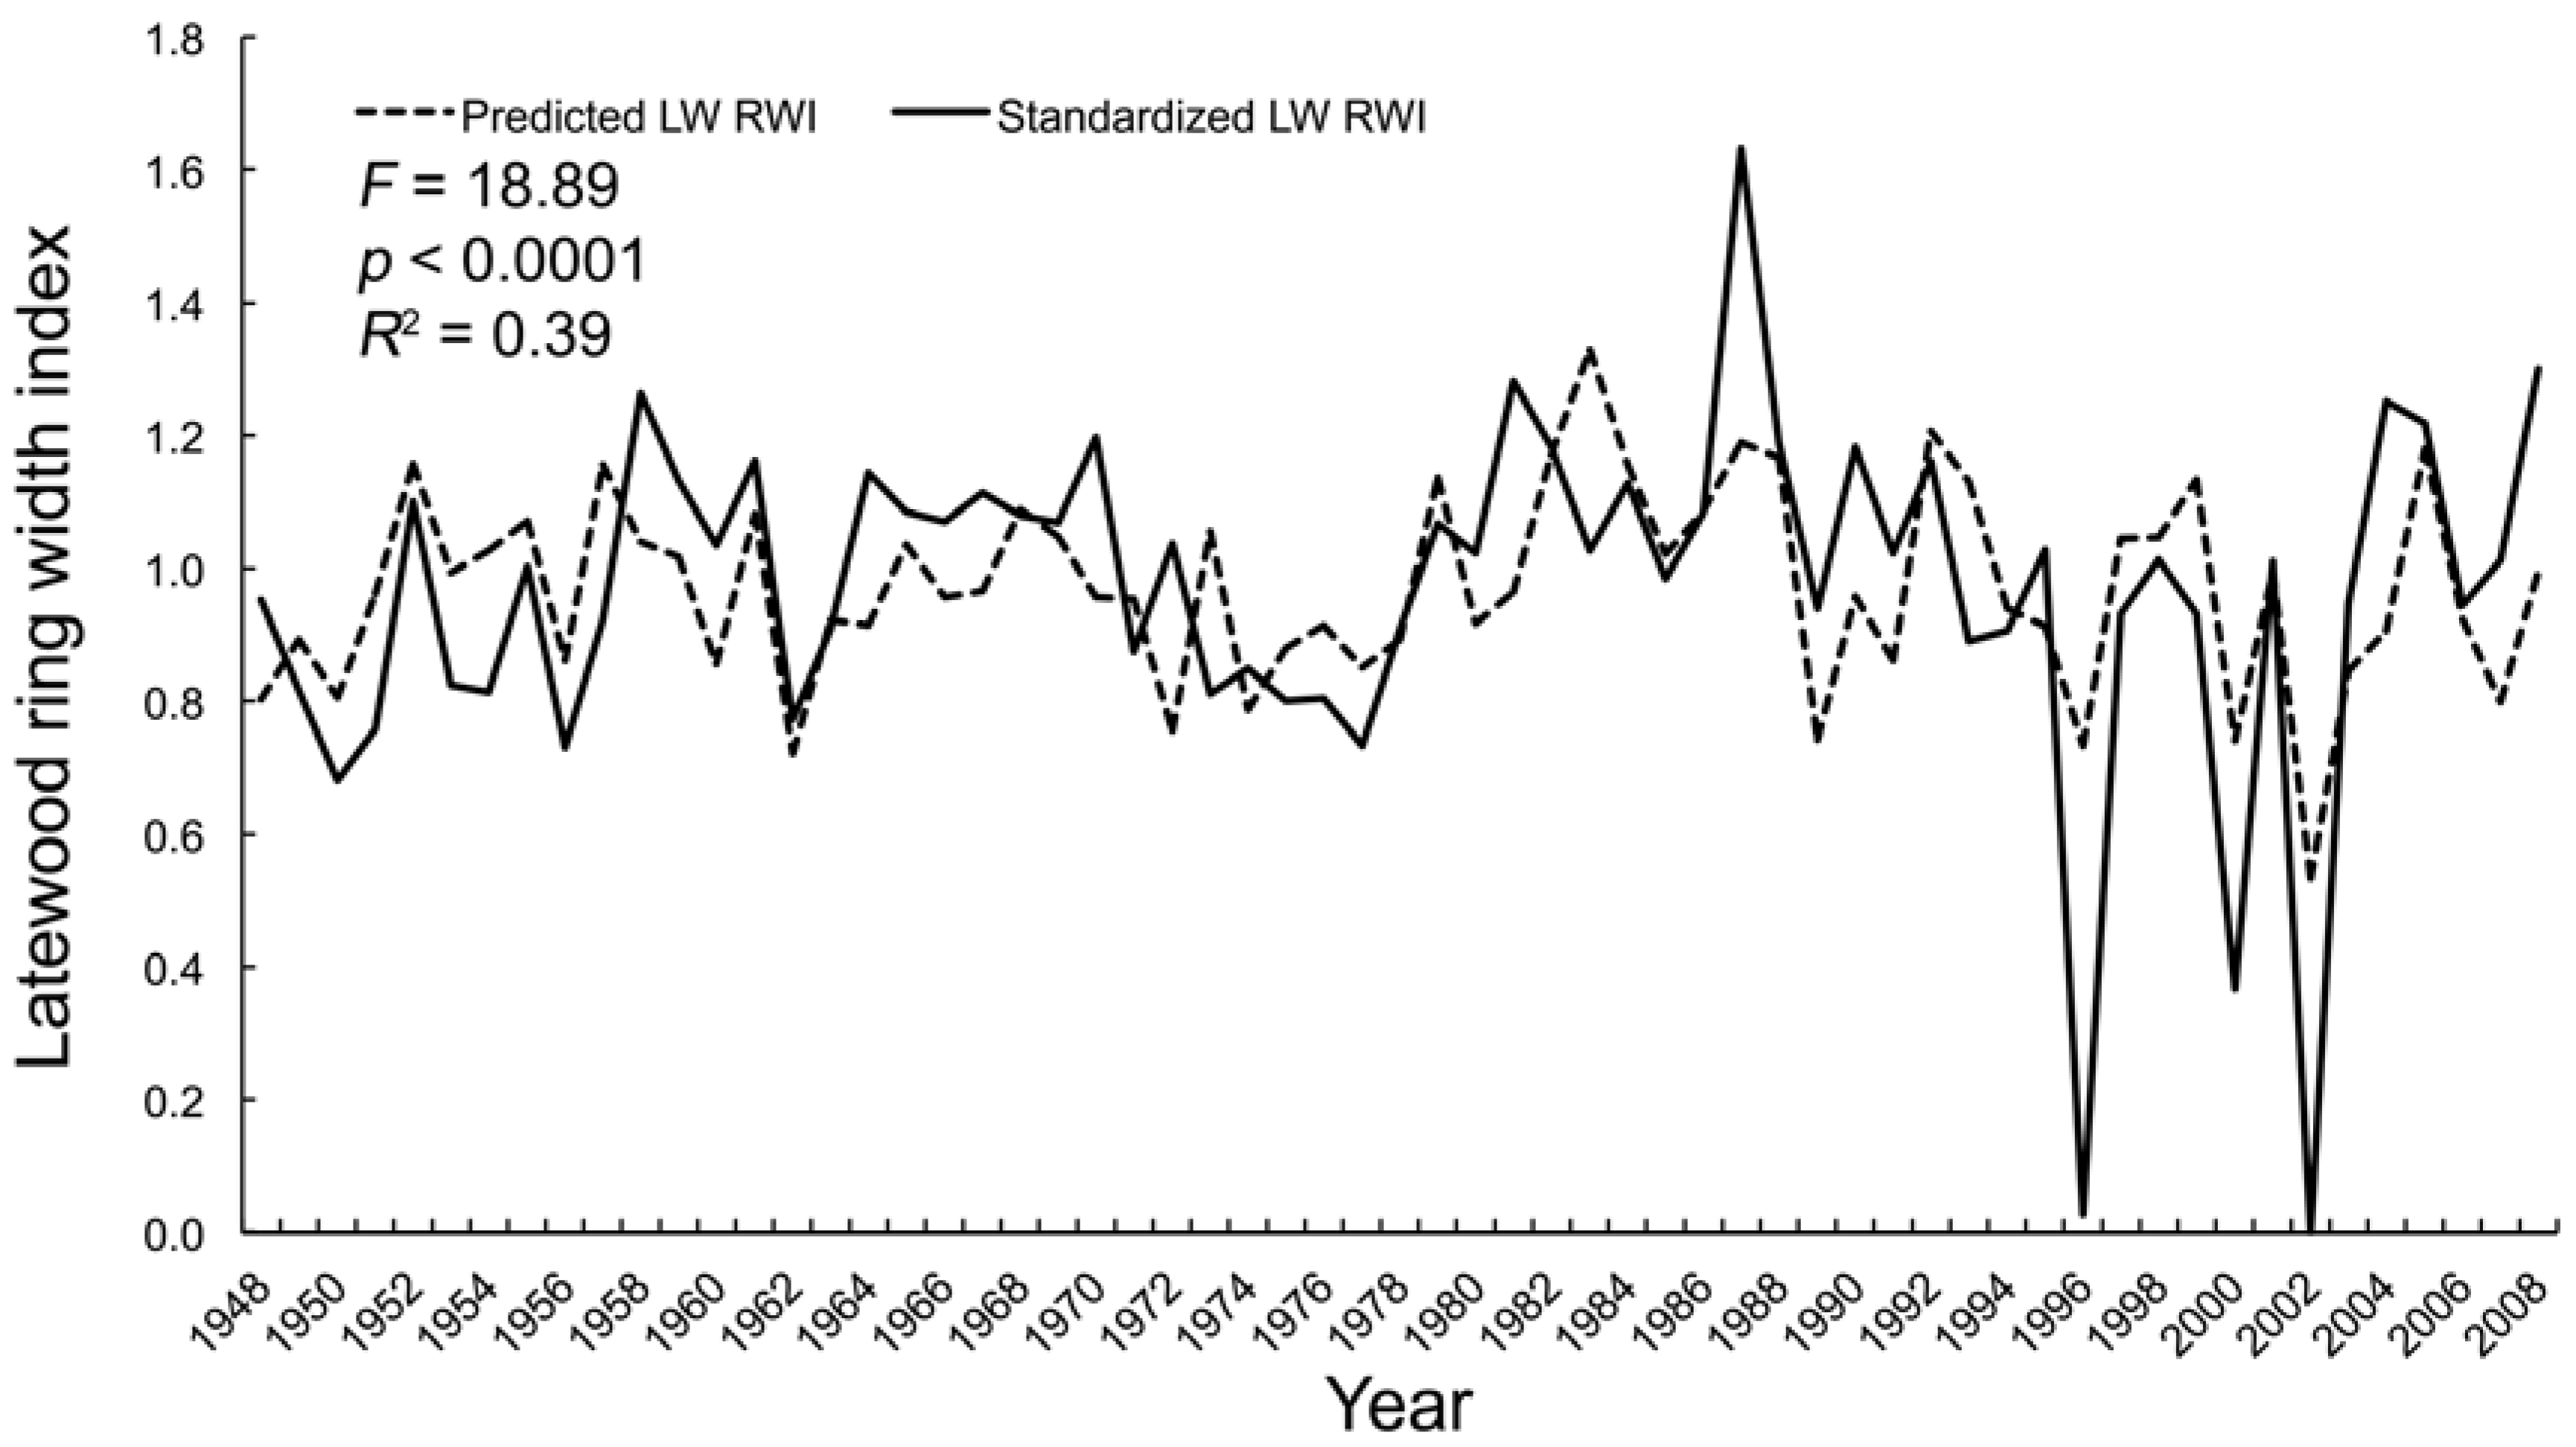
3.2.3. Multivariate Regression

Precipitation in July, August, September, and over the entire monsoon season had no significant effect on latewood ring width (Table 3). For July and September, only PDSI had a significant effect on latewood ring width, while for August and averaged over the monsoon season, both PDSI and VPD were significant effects (Table 3). The model with the highest R2 value used August PDSI and VPD as explanatory variables and explained 39% of the variation in latewood ring width (Figure 3).

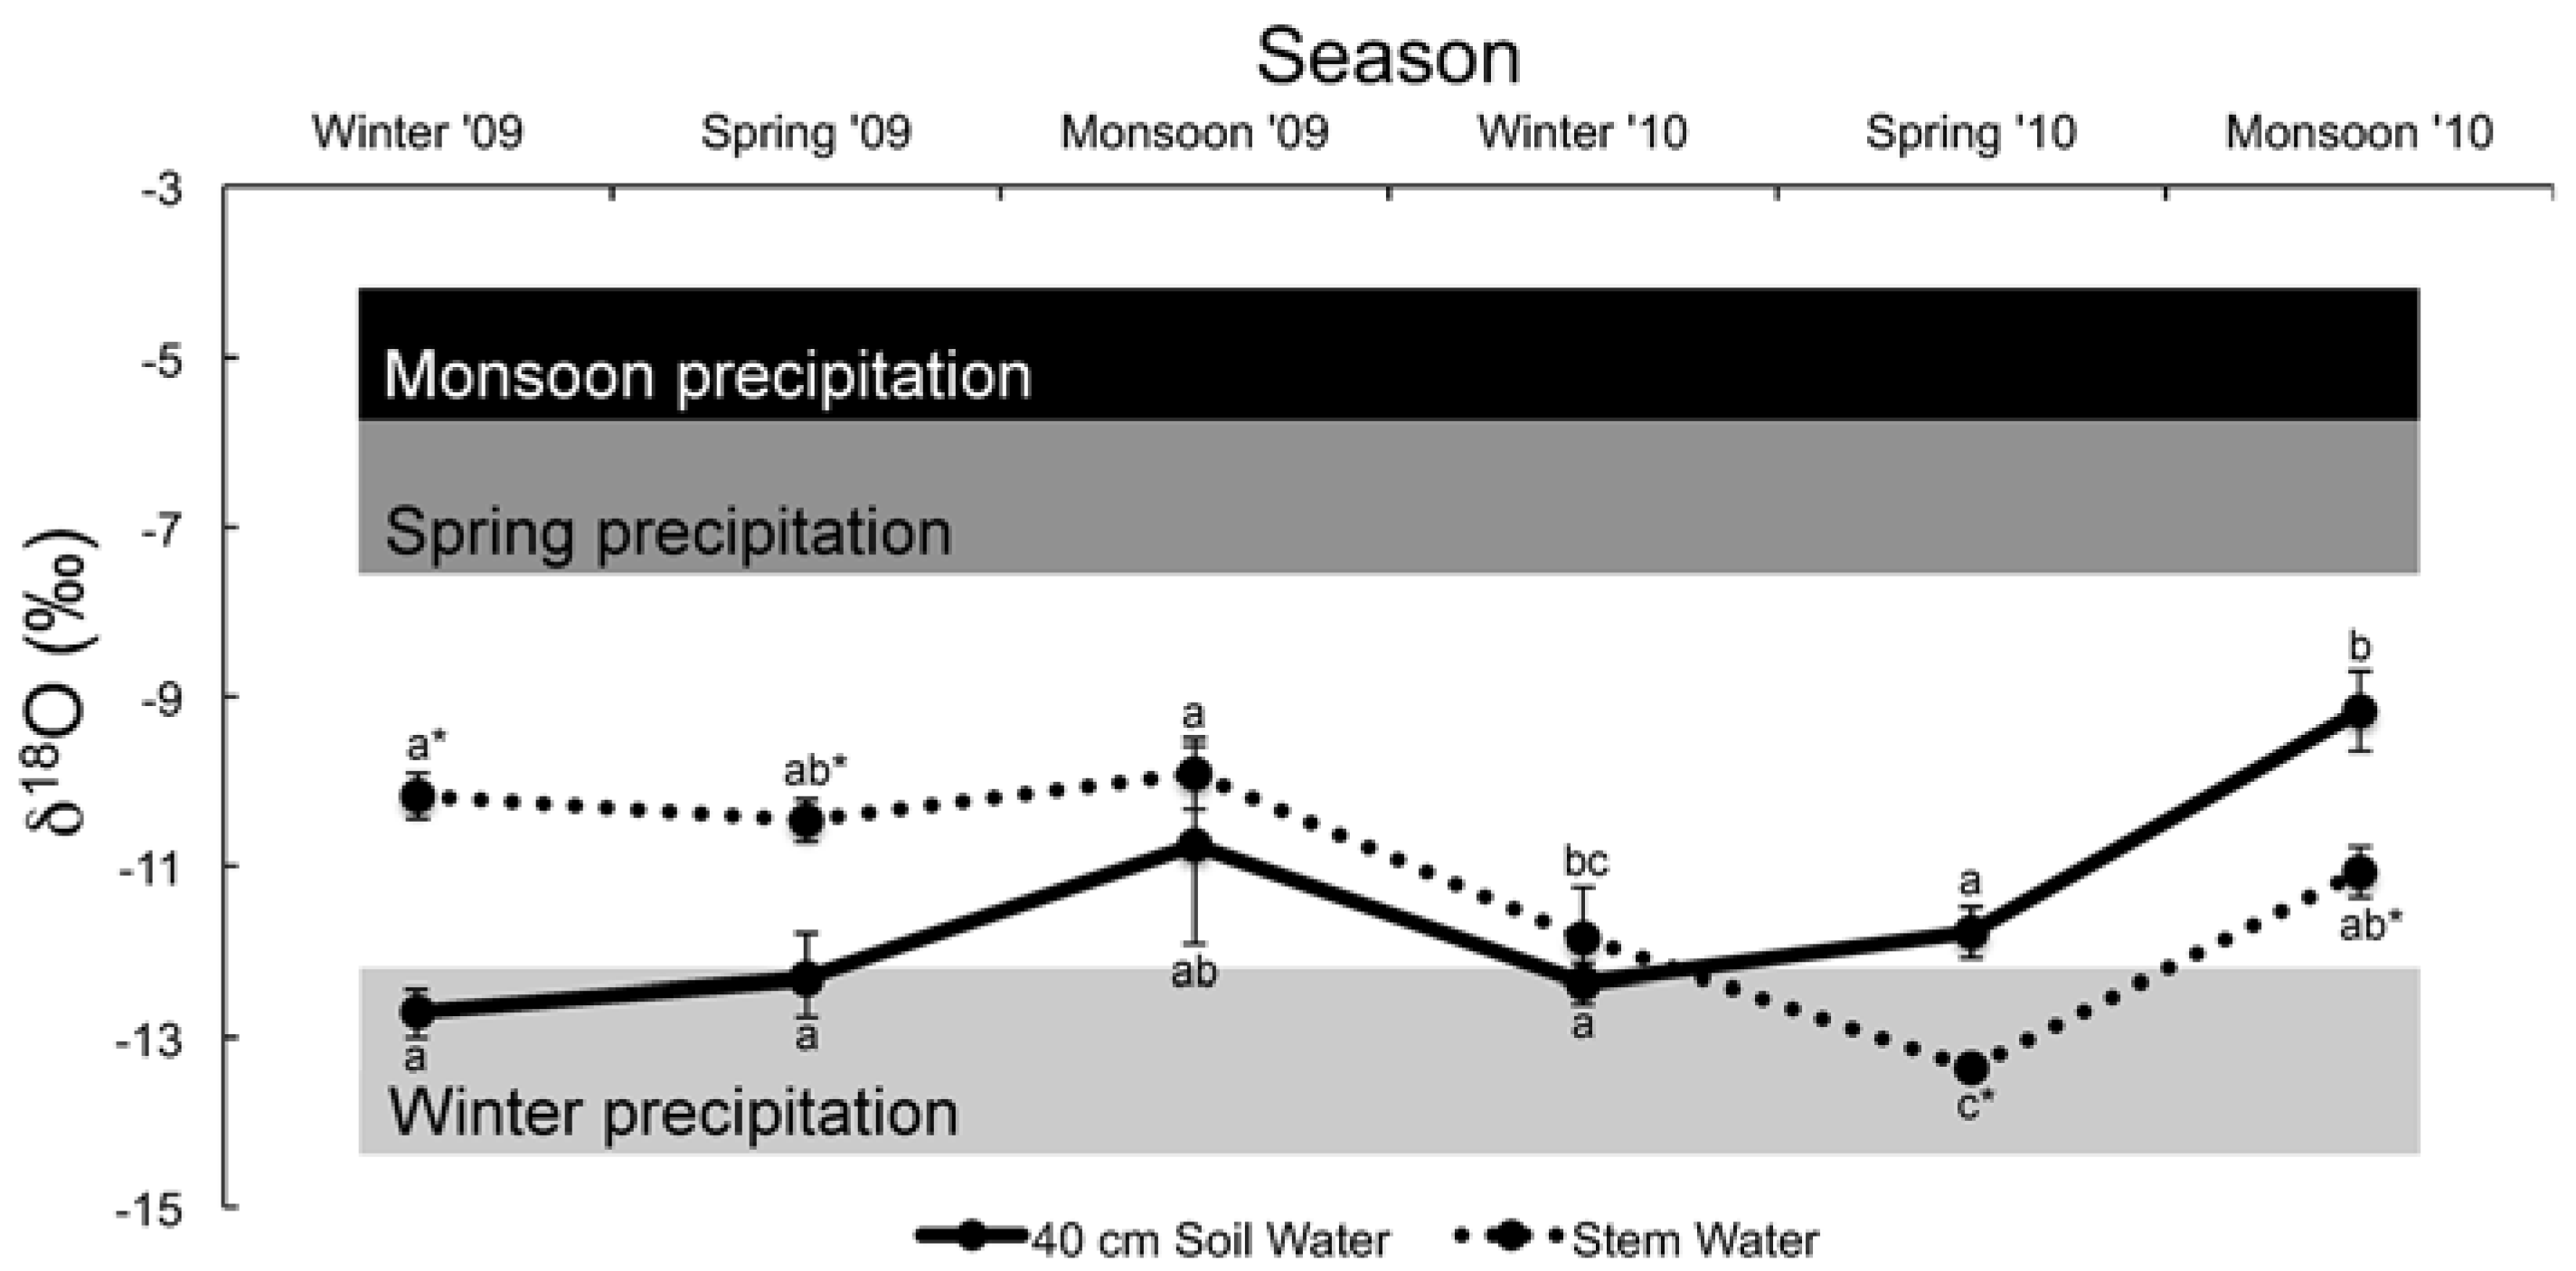
3.3. Water and Cellulose δ18O Analyses

Winter precipitation was significantly more depleted in 18O than spring and monsoon precipitation (Table 4). Stem water δ18O closely tracked soil water δ18O at 40 cm depth, reflecting use of winter and spring precipitation (Figure 4). Stem water collected during the 2009 and 2010 monsoon seasons did not differ significantly from the 2009 and 2010 winter stem water δ18O (Figure 4, Table 4). In 2010, soil (40 cm) and stem water δ18O significantly increased between spring and monsoon seasons. While this enrichment could possibly reflect tree use of monsoon precipitation, monsoon-season stem water δ18O did not significantly differ from winter stem water δ18O, strongly suggesting continued use of winter/spring precipitation during the monsoon season. Earlywood alpha cellulose δ18O did not differ from latewood alpha cellulose δ18O in 2009 and 2010 (F = 0.77, p = 0.52, Figure 5). Likewise, there was no year effect (t = 1.48, p = 0.15) or interaction between year and sub-annual sample (interaction t = 0.12, p = 0.91).

4. Discussion

Our study strongly suggests that mature ponderosa pines in northern Arizona do not use monsoon precipitation to produce latewood. This conclusion is based on five findings: (1) the strength of correlation between latewood ring width and monsoon precipitation is approximately equal to the strength of correlation between latewood ring width and monsoon VPD; (2) AIC identification of monsoon PDSI, not precipitation, as the best model predictor for latewood ring width; (3) multivariate regression identification of PDSI and VPD, but not precipitation, as the best parameters to explain latewood ring width; (4) little to no monsoon precipitation δ18O signal in stem water during the monsoon seasons of 2009 and 2010; and (5) no difference in δ18O values between earlywood and latewood, suggesting a single seasonal water source.
Previous dendrochronological studies show a correlation between latewood ring width and monsoon precipitation [36,37,39,40], yet this correlation does not demonstrate that trees directly use monsoon precipitation for latewood growth. Using δ18O and δ2H values in stem water sampled during the monsoon season, the present study (Figure 4) and other recent work [24] find no evidence that mature ponderosa pines directly use monsoon precipitation. Our relatively high correlation between PDSI and latewood ring width (Figure 2), multivariate model using PDSI and VPD to explain 39% of latewood ring width variation (Figure 3), lack of monsoon δ18O signal in stem water (Figure 4), and lack of significant δ18O enrichment in latewood cellulose compared to earlywood (Figure 5) indicate factors other than monsoon precipitation influence growth during the monsoon season. Because PDSI characterizes long-term drought and at the monthly scale is influenced by the water balance of previous months, monsoon VPD is a more direct way to quantify the immediate short-term effects of monsoon climate on latewood growth. While we found no evidence that study trees used monsoon water, we found evidence that latewood growth increased in response to lower VPD during this season. This likely reflects lower VPD supporting higher stomatal conductance and photosynthesis, thereby allowing more latewood growth in years with a wetter monsoon. Our results agree with the recent finding that high August VPD is associated with low net ecosystem exchange in ponderosa pine forests in northern Arizona [43]. The correlation between monsoon VPD and monsoon precipitation may therefore at least partially explain the correlation between latewood ring width and monsoon precipitation observed in other studies. Our analysis of the long-term relationship between summer precipitation and summer VPD shows that VPD is lower when precipitation is higher. Greater latewood growth in years with higher monsoon season precipitation and lower VPD likely occur due to greater stomatal conductance and net photosynthetic rate in response to low VPD, which has been reported for ponderosa pine and many other species [59,60]. Additionally, increased photosynthesis in response to greater diffuse light associated with cloudiness is possibly a second indirect benefit of higher monsoon season precipitation. Moreover, August PDSI, based on pre-monsoon months’ precipitation and climate, alone explained 27% of latewood ring width variation (Table 2). This finding further implicates precipitation inputs prior to the monsoon season (i.e., winter precipitation) as the water source used for latewood production.
Previous isotopic studies have found evidence of monsoon water use for latewood growth. Roden et al. [33] found that latewood from Arizona ponderosa pine had a higher δ18O than trees from California and Oregon. While this finding is possibly attributable to Arizona pines using monsoon rain for latewood growth, it might also indicate greater evaporative enrichment of soil and leaf waters during AZ summers compared to summers in CA and OR. Similarly, ponderosa pine latewood cellulose δ18O significantly correlates with summer precipitation and summer VPD in southern AZ and NM, indicating the importance of both monsoon rains and the associated reduction in VPD for latewood production in locations where monsoon rain can make up greater than 50% of annual water inputs [61]. Using δ13C, Leavitt et al. [41,42] have similarly shown a correlation between latewood cellulose and monsoon precipitation. However, as δ13C in plants in arid regions is largely a measure of stomatal limitation of photosynthesis, that relationship could also derive indirectly because of the influence of monsoon precipitation on VPD and consequently stomatal conductance, and need not indicate actual use of monsoon precipitation for growth. While we attribute similar alpha cellulose δ18O of earlywood and latewood in our study to the use of a common water source, winter precipitation, we acknowledge that this finding is based on only two years’ of data (2009–2010) and when evaluated over a longer time period significant differences may be found [61].
Our major finding is that although southwestern ponderosa pine latewood growth correlates positively with monsoon precipitation, this correlation is likely due to the effects of VPD, a climate parameter influenced by precipitation via correlation with temperature and humidity, on growth rather than the direct use of monsoon water. In the southwestern USA, monsoon rains generally wet only the upper soil (<15 cm), and mature ponderosa pines draw water from the 40 cm depth or deeper [24]. Our research in northern Arizona strongly indicates an almost exclusive use of winter precipitation from deep soil for earlywood and latewood growth of mature ponderosa pine. Monsoon season precipitation is, however, used by shallow-rooted plants, such as seedling ponderosa pines (N. Umstattd, unpublished data) and annual and perennial grasses and forbs at our sites [62]. Our research highlights the importance of monsoonal VPD as a strong determinant of summer growth. That leaf conductance and photosynthesis decline sharply with increasing VPD in ponderosa pine in northern Arizona [59] provides a physiological basis for our dendrochronological results. Consistent with broader regional assessments of climate variables, our results indicate that winter precipitation and summer VPD are the key factors affecting forest drought stress and tree mortality in the Southwest [5]. The correlation between monsoon precipitation and latewood ring width and isotopes has led to the misunderstanding that large ponderosa pines directly use monsoon water. Our results strongly suggest that this correlation between monsoon precipitation and latewood is merely an artifact of the correlation between monsoon precipitation and VPD. We note that our results apply only to large mature trees and speculate that young ponderosa pine seedlings directly rely on and use monsoon precipitation for establishment and summer growth and encourage further investigation of this topic.

5. Conclusions

We conclude that large ponderosa pines in northern Arizona exclusively use winter precipitation extracted from deep soil for latewood growth. This finding is robust, as it is based on a multi-method approach using correlation, linear modeling, stem water isotopes, and alpha cellulose isotopes. Although not detected in this study, it is possible that in years with extremely limited winter precipitation, monsoon rains would be more important for summer growth. Nonetheless, we speculate that the previously reported relationships between latewood growth and monsoon precipitation [33,36,37,41,42] are due to the dependent relationship between precipitation and VPD. Winter precipitation and summer VPD appear to be the dominant factors affecting earlywood and latewood growth, respectively [5,24]. This seemingly exclusive reliance on winter precipitation extracted from deep soil suggests negative impacts on tree water relations in the Southwest if winter drought severity increases or if precipitation shifts from winter to summer [63]. Furthermore, this heavy reliance on winter precipitation supports the use of restoration thinning treatments producing low stand densities to increase tree access to the most important water source: deep soil water recharged by winter precipitation [24]. It is important to identify the seasonal water source for tree growth during summer months and manage forests to maximize this water source to increase tree resistance to the projected hotter and drier climate in the Southwest [6,7,8,9,10]. As the influence of climate change on precipitation seasonality and forest productivity is not an issue unique to ponderosa pine forests or the Southwest, our findings may inform understanding and management of other semi-arid forest ecosystems.

Acknowledgments

A Graduate Fellowship from The United States Department of Energy Office of Science funded the majority of this research. Additional funding came from the Achievement Rewards for College Scientists and Science Foundation Arizona (CAA 0237-08 to T. Kolb and G. Koch). We thank Nicolas Umstattd and Nicholas Kerhoulas for their help in the field and Jeffrey Kane for his help with tree core preparation and analysis. Thanks to Jamie Brown, Richard Doucett, and the Colorado Plateau Stable Isotope Lab for assistance with stable isotope analyses, to Jeffery Welker at the University of Alaska Anchorage for precipitation δ18O corroboration, and to Steven Leavitt in the Laboratory of Tree-Ring Research for help with alpha cellulose extraction. We also thank Matthew Hurteau, Catherine Gehring, Bruce Hungate, and two anonymous reviewers for their valuable comments and suggestions.

Author Contributions

L.P.K., T.E.K. and G.W.K. together conceived and designed the experiments; L.P.K. performed the experiments, analyzed the data, provided financial support, and wrote the paper; G.W.K. and T.E.K. provided financial support, guidance, and substantial contributions to multiple drafts of this paper.

Conflicts of Interest

The authors declare no conflict of interest. The founding sponsors had no role in the design of the study; in the collection, analyses, or interpretation of data; in the writing of the manuscript, and in the decision to publish the results.

References

  1. Van Mantgem, P.; Stephenson, N. Apparent climatically induced increase of tree mortality rates in a temperate forest. Ecol. Lett. 2007, 10, 909–916. [Google Scholar] [CrossRef] [PubMed]
  2. McDowell, N.; Pockman, W.; Allen, C.; Breshears, D.; Cobb, N.; Kolb, T.; Plaut, J.; Sperry, J.; West, A.; Williams, D. Mechanisms of plant survival and mortality during drought: Why do some plants survive while others succumb to drought? New Phytol. 2008, 178, 719–739. [Google Scholar] [CrossRef] [PubMed]
  3. Van Mantgem, P.J.; Stephenson, N.L.; Byrne, J.C.; Daniels, L.D.; Franklin, J.F.; Fule, P.Z.; Harmon, M.E.; Larson, A.J.; Smith, J.M.; Taylor, A.H.; et al. Widespread increase of tree mortality rates in the western United States. Science 2009, 323, 521–524. [Google Scholar] [CrossRef] [PubMed]
  4. Williams, A.P.; Allen, C.D.; Millar, C.I.; Swetnam, T.W.; Michaelsen, J.; Still, C.J.; Leavitt, S.W. Climate change and water in southwestern North America special feature: Forest responses to increasing aridity and warmth in the southwestern United States. Proc. Natl. Acad. Sci. USA 2010, 107, 21289–21294. [Google Scholar] [CrossRef] [PubMed]
  5. Williams, A.P.; Allen, C.D.; Macalady, A.K.; Griffin, D.; Woodhouse, C.A.; Meko, D.M.; Swetnam, T.W.; Rauscher, S.A.; Seager, R.; Grissino-Mayer, H.D.; et al. Temperature as a potent driver of regional forest drought stress and tree mortality. Nat. Clim. Chang. 2012, 2, 1–6. [Google Scholar] [CrossRef]
  6. Seager, R.; Vecchi, G.A. Greenhouse warming and the 21st century hydroclimate of southwestern North America. Proc. Natl. Acad. Sci. USA 2010, 107, 21277–21282. [Google Scholar] [CrossRef] [PubMed]
  7. Seager, R.; Ting, M.; Held, I.; Kushnir, Y.; Lu, J.; Vecchi, G.; Huang, H.; Harnik, N.; Leetmaa, A.; Lau, N. Model projections of an imminent transition to a more arid climate in southwestern North America. Science 2007, 316, 1181–1184. [Google Scholar] [CrossRef] [PubMed]
  8. Seager, R.; Ting, M.; Li, C.; Naik, N.; Cook, B.; Nakamura, J.; Liu, H. Projections of declining surface-water availability for the southwestern United States. Nat. Clim. Chang. 2012, 3, 482–486. [Google Scholar] [CrossRef]
  9. Cayan, D.R.; Das, T.; Pierce, D.W.; Barnett, T.P.; Tyree, M.; Gershunov, A. Future dryness in the southwest US and the hydrology of the early 21st century drought. Proc. Natl. Acad. Sci. USA 2010, 107, 21271–21276. [Google Scholar] [CrossRef] [PubMed]
  10. Swain, S.; Hayhoe, K. CMIP5 projected changes in spring and summer drought and wet conditions over North America. Clim. Dyn. 2014, 44, 2737–2750. [Google Scholar] [CrossRef]
  11. Knowles, N.; Dettinger, M.D.; Cayan, D.R. Trends in snowfall versus rainfall in the western United States. J. Clim. 2006, 19, 4545–4559. [Google Scholar] [CrossRef]
  12. Hamlet, A.; Mote, P.; Clark, M.; Lettenmaier, D. Effects of temperature and precipitation variability on snowpack trends in the western United States. J. Clim. 2005, 18, 4545–4561. [Google Scholar] [CrossRef]
  13. Mote, P.W.; Hamlet, A.F.; Clark, M.P.; Lettenmaier, D.P. Declining mountain snowpack in western North America. Bull. Am. Meteorol. Soc. 2005, 86, 39–49. [Google Scholar] [CrossRef]
  14. Mote, P.W. Climate-driven variability and trends in mountain snowpack in western North America. J. Clim. 2006, 19, 6209–6219. [Google Scholar] [CrossRef]
  15. Hu, J.; Moore, D.; Burns, S.; Monson, R. Longer growing seasons lead to less carbon sequestration by a subalpine forest. Glob. Chang. Biol. 2010, 16, 771–783. [Google Scholar] [CrossRef]
  16. Sheppard, P.R.; Comrie, A.C.; Packin, G.D.; Angersbach, K.; Hughes, M.K. The climate of the US Southwest. Clim. Res. 2002, 21, 219–238. [Google Scholar] [CrossRef]
  17. Schwinning, S.; Belnap, J.; Bowling, D.; Ehleringer, J. Sensitivity of the Colorado Plateau to change: Climate, ecosystems, and society. Ecol. Soc. 2008, 13, 28. [Google Scholar] [CrossRef]
  18. Houghton, J.T.; Ding, Y.; Griggs, D.J.; Noguer, M.; van der Linden, P.J.; Dai, X.; Maskell, K. IPCC, 2001: Climate Change 2001: The Scientific Basis; Cambridge University Press: Cambridge, UK; New York, NY, USA, 2001; p. 881. [Google Scholar]
  19. Kim, J. Precipitation variability associated with the North American Monsoon in the 20th century. Geophys. Res. Lett. 2002, 29, 1650. [Google Scholar] [CrossRef]
  20. Cook, E.; Woodhouse, C.; Eakin, C.; Meko, D.; Stahle, D. Long-term aridity changes in the western United States. Science 2004, 306, 1015–1018. [Google Scholar] [CrossRef] [PubMed]
  21. Williams, D.; Ehleringer, J. Intra-and interspecific variation for summer precipitation use in pinyon-juniper woodlands. Ecol. Monogr. 2000, 70, 517–537. [Google Scholar]
  22. Ehleringer, J.; Dawson, T. Water uptake by plants: Perspectives from stable isotope composition. Plant Cell Environ. 1992, 15, 1073–1082. [Google Scholar] [CrossRef]
  23. Simpson, E.; Thorud, D.; Friedman, I. Distinguishing seasonal recharge to groundwater by deuterium analysis in southern Arizona. In World Water Balance; UNESCO: Paris, France, 1972; pp. 623–633. [Google Scholar]
  24. Kerhoulas, L.P.; Kolb, T.E.; Koch, G.W. Tree size, stand density, and the source of water used across seasons by ponderosa pine in northern Arizona. For. Ecol. Manag. 2013, 289, 425–433. [Google Scholar] [CrossRef]
  25. Dutton, A.; Wilkinson, B.H.; Welker, J.M.; Bowen, G.J.; Lohmann, K.C. Spatial distribution and seasonal variation in 18O/16O of modern precipitation and river water across the conterminous USA. Hydrol. Process. 2005, 19, 4121–4146. [Google Scholar] [CrossRef]
  26. Tang, K.; Feng, X. The effect of soil hydrology on the oxygen and hydrogen isotopic compositions of plants’ source water. Earth Planet. Sci. Lett. 2001, 185, 355–367. [Google Scholar] [CrossRef]
  27. Eggemeyer, K.D.; Awada, T.; Harvey, F.E.; Wedin, D.A.; Zhou, X.; Zanner, C.W. Seasonal changes in depth of water uptake for encroaching trees Juniperus virginiana and Pinus ponderosa and two dominant C4 grasses in a semiarid grassland. Tree Physiol. 2008, 29, 157–169. [Google Scholar] [CrossRef] [PubMed]
  28. Brunel, J.; Walker, G.; Kennett-Smith, A. Field validation of isotopic procedures for determining sources of water used by plants in a semi-arid environment. J. Hydrol. 1995, 167, 351–368. [Google Scholar] [CrossRef]
  29. Kolb, T.; Hart, S.; Amundson, R. Boxelder water sources and physiology at perennial and ephemeral stream sites in Arizona. Tree Physiol. 1997, 17, 151–160. [Google Scholar] [CrossRef] [PubMed]
  30. Dawson, T.; Ehleringer, J. Isotopic enrichment of water in the “woody” tissues of plants: Implications for plant water source, water uptake, and other studies which use the stable isotopic composition of cellulose. Geochim. Cosmochim. Acta 1993, 57, 3487–3492. [Google Scholar] [CrossRef]
  31. Roden, J.; Ehleringer, J. Hydrogen and oxygen isotope ratios of tree ring cellulose for field-grown riparian trees. Oecologia 2000, 123, 481–489. [Google Scholar] [CrossRef] [PubMed]
  32. McCarroll, D.; Loader, N. Stable isotopes in tree rings. Quat. Sci. Rev. 2004, 23, 771–801. [Google Scholar] [CrossRef]
  33. Roden, J.; Ehleringer, J. Summer precipitation influences the stable oxygen and carbon isotopic composition of tree-ring cellulose in Pinus ponderosa. Tree Physiol. 2007, 27, 491–501. [Google Scholar] [CrossRef] [PubMed]
  34. Roden, J.; Lin, G.; Ehleringer, J. A mechanistic model for interpretation of hydrogen and oxygen isotope ratios in tree-ring cellulose. Geochim. Cosmochim. Acta 2000, 64, 21–35. [Google Scholar] [CrossRef]
  35. Offermann, C.; Ferrio, J.P.; Holst, J.; Grote, R.; Siegwolf, R.; Kayler, Z.; Gessler, A. The long way down—Are carbon and oxygen isotope signals in the tree ring uncoupled from canopy physiological processes? Tree Physiol. 2011, 31, 1088–1102. [Google Scholar] [CrossRef] [PubMed]
  36. Meko, D.; Baisan, C. Pilot study of latewood-width of conifers as an indicator of variability of summer rainfall in the North American monsoon region. Int. J. Climatol. 2001, 21, 697–708. [Google Scholar] [CrossRef]
  37. Stahle, D.; Cleaveland, M.; Grissino-Mayer, H.; Griffin, R.; Fye, F.; Therrell, M.; Burnette, D.; Meko, D.; Villanueva Diaz, J. Cool-and warm-season precipitation reconstructions over western New Mexico. J. Clim. 2009, 22, 3729–3750. [Google Scholar] [CrossRef]
  38. Therrell, M.; Stahle, D.; Cleaveland, M.; Villanueva-Diaz, J. Warm season tree growth and precipitation over Mexico. J. Geophys. Res. 2002, 107, 4205. [Google Scholar] [CrossRef]
  39. Griffin, D.; Meko, D.M.; Touchan, R.; Leavitt, S.W.; Woodhouse, C.A. Latewood chronology development for summer-moisture reconstruction in the US Southwest. Tree-Ring Res. 2011, 67, 87–101. [Google Scholar] [CrossRef]
  40. Griffin, D.; Woodhouse, C.A.; Meko, D.M.; Stahle, D.W.; Faulstich, H.L.; Carrillo, C.; Touchan, R.; Castro, C.L.; Leavitt, S.W. North American monsoon precipitation reconstructed from tree-ring latewood. Geophys. Res. Lett. 2013, 40, 954–958. [Google Scholar] [CrossRef]
  41. Leavitt, S.; Wright, W.; Long, A. Spatial expression of ENSO, drought, and summer monsoon in seasonal δ13C of ponderosa pine tree rings in southern Arizona and New Mexico. J. Geophys. Res.-Atmos. 2002, 107, 4349. [Google Scholar] [CrossRef]
  42. Leavitt, S.W.; Woodhouse, C.A.; Castro, C.L.; Wright, W.E.; Meko, D.M.; Touchan, R.; Griffin, D.; Ciancarelli, B. The North American monsoon in the U.S. Southwest: Potential for investigation with tree-ring carbon isotopes. Quat. Int. 2011, 235, 101–107. [Google Scholar] [CrossRef]
  43. Kolb, T.; Dore, S.; Montes-Helu, M. Extreme late-summer drought causes neutral annual carbon balance in southwestern ponderosa pine forests and grasslands. Environ. Res. Lett. 2013, 8, 015015. [Google Scholar] [CrossRef]
  44. McDowell, N.; Beerling, D.J.; Breshears, D.D.; Fisher, R.A.; Raffa, K.F.; Stitt, M. The interdependence of mechanisms underlying climate-driven vegetation mortality. Trends Ecol. Evol. 2011, 26, 523–532. [Google Scholar] [CrossRef] [PubMed]
  45. Adams, H.D.; Guardiola-Claramonte, M.; Barron-Gafford, G.A.; Villegas, J.C.; Breshears, D.D.; Zou, C.B.; Troch, P.A.; Huxman, T.E. Temperature sensitivity of drought-induced tree mortality portends increased regional die-off under global-change-type drought. Proc. Natl. Acad. Sci. USA 2009, 106, 7063–7066. [Google Scholar] [CrossRef] [PubMed]
  46. Eamus, D.; Boulain, N.; Cleverly, J.; Breshears, D.D. Global change-type drought-induced tree mortality: Vapor pressure deficit is more important than temperature per se in causing decline in tree health. Ecol. Evol. 2013, 3, 2711–2729. [Google Scholar] [CrossRef] [PubMed]
  47. Mast, J.; Fule, P.; Moore, M.; Covington, W.; Waltz, A. Restoration of presettlement age structure of an Arizona ponderosa pine forest. Ecol. Appl. 1999, 9, 228–239. [Google Scholar] [CrossRef]
  48. Skov, K.; Kolb, T.; Wallin, K. Difference in radial growth response to restoration thinning and burning treatments between young and old ponderosa pine in Arizona. West. J. Appl. For. 2005, 20, 36–43. [Google Scholar]
  49. Jepson, J. The Tree Climber’s Companion; Beaver Tree Publishing: Longville, MN, USA, 2000. [Google Scholar]
  50. Kerhoulas, L.P.; Kane, J.M. Sensitivity of ring growth and carbon allocation to climatic variation vary within ponderosa pine trees. Tree Physiol. 2012, 32, 14–23. [Google Scholar] [CrossRef] [PubMed]
  51. Holmes, R.L. Computer-assisted quality control in tree-ring dating and measurement. Tree-Ring Bull. 1983, 43, 69–78. [Google Scholar]
  52. Cook, E.R.; Holmes, R.L. User’s manual for program ARSTAN. In Tree-Ring Chronologies of Western North America: California, Eastern Oregon and Northern Great Basin; Holmes, R.L., Adams, R.K., Fritts, H.C., Eds.; University of Arizona: Tucson, AZ, USA, 1986; pp. 50–56. [Google Scholar]
  53. Wigley, T.; Briffa, K.; Jones, P. On the average value of correlated time series, with applications in dendroclimatology and hydrometeorology. J. Clim. Appl. Meteorol. 1984, 23, 201–213. [Google Scholar] [CrossRef]
  54. Bowen, G.J.; Wassenaar, L.I.; Hobson, K.A. Global application of stable hydrogen and oxygen isotopes to wildlife forensics. Oecologia 2005, 143, 337–348. [Google Scholar] [CrossRef] [PubMed]
  55. West, A.G.; Goldsmith, G.R.; Brooks, P.D.; Dawson, T.E. Discrepancies between isotope ratio infrared spectroscopy and isotope ratio mass spectrometry for the stable isotope analysis of plant and soil waters. Rapid Commun. Mass Spectrom. 2010, 24, 1948–1954. [Google Scholar] [CrossRef] [PubMed]
  56. Leavitt, S.; Danzer, S. Method for batch processing small wood samples to holocellulose for stable-carbon isotope analysis. Anal. Chem. 1993, 65, 87–89. [Google Scholar] [CrossRef]
  57. Sternberg, L.S.L.; DeNiro, M.J.; Savidge, R.A. Oxygen isotope exchange between metabolites and water during biochemical reactions leading to cellulose synthesis. Plant Physiol. 1986, 82, 423–427. [Google Scholar] [CrossRef]
  58. Burnham, K.P.; Anderson, D.R. Model Selection and Multimodel Inference: A Practical Information—Theoretic Approach, 2nd ed.; Springer: New York, NY, USA, 2002; pp. 1–485. [Google Scholar]
  59. Kolb, T.; Stone, J. Differences in leaf gas exchange and water relations among species and tree sizes in an Arizona pine-oak forest. Tree Physiol. 2000, 20, 1–12. [Google Scholar] [CrossRef] [PubMed]
  60. Oren, R.; Sperry, J.; Katul, G.; Pataki, D.; Ewers, B.; Phillips, N.; Schafer, K. Survey and synthesis of intra- and interspecific variation in stomatal sensitivity to vapour pressure deficit. Plant Cell Environ. 1999, 22, 1515–1526. [Google Scholar] [CrossRef]
  61. Szejner, P.; Wright, W.E.; Babst, F.; Belmecheri, S.; Trouet, V.; Leavitt, S.W.; Ehleringer, J.R.; Monson, R.K. Latitudinal gradients in tree-ring stable carbon and oxygen isotopes reveal differential climate influences of the North American Monsoon system. J. Geophys. Res. Biogeosci. 2016, 121, 1978–1991. [Google Scholar] [CrossRef]
  62. Schwinning, S.; Davis, K.; Richardson, L.; Ehleringer, J. Deuterium enriched irrigation indicates different forms of rain use in shrub/grass species of the Colorado Plateau. Oecologia 2002, 130, 345–355. [Google Scholar] [CrossRef]
  63. Cook, B.I.; Seager, R. The response of the North American Monsoon to increased greenhouse gas forcing. J. Geophys. Res.-Atmos. 2013, 118, 1690–1699. [Google Scholar] [CrossRef]
Figure 1. Linear regression relationship between total precipitation (mm) and average daily maximum vapor pressure deficit (kPa) in the monsoon season (July through September) for years 1948 through 2008.
Forests 08 00140 g001
Figure 2. Average ± standard error Pearson correlation coefficients (r) between July (dark grey), August (medium gray), September (light gray), and the monsoon season (white, July through September) climate parameters and ponderosa pine latewood ring width index (n = 27). Within a climate parameter, time periods not sharing the same lower case letter are significantly different (α = 0.05). Within a time period, climate parameters not sharing the same capital letter are significantly different. VPD, vapor pressure deficit; PDSI, Palmer Drought Severity Index.
Forests 08 00140 g002
Figure 3. The best linear model uses August Palmer Drought Severity Index (PDSI) and vapor pressure deficit (VPD) to explain ponderosa pine latewood ring width variation (F = 18.89, p < 0.0001, R2 = 0.39) from 1948 to 2008. The solid line represents actual standardized latewood ring width measurements and the dashed line represents modeled standardized latewood ring widths.
Forests 08 00140 g003
Figure 4. Water δ18O (‰) averages ± standard errors from precipitation, 40 cm soil (solid line), and ponderosa pine stems (dashed line) in 2009 and 2010 winter (previous October through current March), spring (April through June), and monsoon (July through September) seasons. Seasonal precipitation values are based on a pooled data set of 2009 and 2010 precipitation samples. Monsoon, spring, and winter precipitation averages ± standard errors are represented by the black, dark gray, and light gray bars, respectively. Within soil water and stem water lines, seasons not sharing the same lower case letter are significantly different (α = 0.05). * Denotes a significant difference between soil and stem water in a given season.
Forests 08 00140 g004
Figure 5. Alpha cellulose δ18O (‰) averages ± standard errors for ponderosa pine earlywood and latewood in 2009 and 2010. There was no significant difference among wood types or years.
Forests 08 00140 g005
Table 1. Average ± standard error Pearson correlation coefficients (r) between ponderosa pine latewood ring width index (n = 27) and July, August, September, and the monsoon season (July through September) climate parameters.
TimeVPDPDSIPrecipitationFp
July−0.10 ± 0.03 aA0.30 ± 0.03 aB0.16 ± 0.03 aA47.12<0.0001
August−0.27 ± 0.02 bA0.37 ± 0.03 aB0.29 ± 0.03 bB149.59<0.0001
September0.01 ± 0.02 cA0.26 ± 0.04 aB0.16 ± 0.03 aA26.00<0.0001
Monsoon−0.17 ± 0.03 abA0.34 ± 0.04 aB0.16 ± 0.03 cC67.98<0.0001
F17.611.9928.10--
p<0.00010.12<0.0001--
Within a climate parameter, the value of r for time periods not sharing the same lower case letter are significantly different. Within a time period, the values of r for climate parameters not sharing the same capital letter are significantly different. A two-way ANOVA shows that climate parameter is a significant effect on latewood ring width (F = 228.89, p < 0.0001), time is not a significant effect (F = 2.45, p = 0.06), and there is an interaction between climate parameter and time (F = 18.73, p < 0.0001).
Table 2. Akaike’s Information Criterion (AIC), simple difference values (∆i), and R2 values for monsoon climate parameters in July, August, September, and the monsoon season (July through September) modeling ponderosa pine standardized chronology latewood ring width.
SeasonModel ParametersAICiR2
JulyPDSI1.830.000.17
VPD + PDSI3.281.440.18
PDSI + Precipitation3.781.950.17
VPD + PDSI + Precipitation5.233.390.18
VPD12.1410.300.02
Precipitation13.1211.280.00
VPD + Precipitation13.7011.870.02
AugustVPD + PDSI + Precipitation−15.670.000.42
VPD + PDSI−15.360.310.39
PDSI + Precipitation−12.682.990.37
PDSI−5.779.900.27
VPD + Precipitation0.1315.800.22
Precipitation1.2916.960.17
VPD2.7218.400.16
SeptemberPDSI4.840.000.13
VPD + PDSI6.291.450.14
PDSI + Precipitation6.801.960.13
VPD + PDSI + Precipitation7.752.910.14
VPD11.937.090.02
Precipitation12.567.720.01
VPD + Precipitation13.909.070.02
MonsoonVPD + PDSI−5.940.000.29
VPD + PDSI + Precipitation−5.470.470.31
PDSI + Precipitation−4.721.220.28
PDSI−1.214.730.21
VPD7.2613.200.09
VPD + Precipitation7.4913.430.12
Precipitation7.5913.530.09
Lower AIC values indicate a stronger model, ∆i values greater than 10 are considered poor with no statistical support, and models with ∆i values differing by less than 2 are considered approximately equal [58]. Within a time period, models are listed from lowest to highest AIC value. The best models for each time period are listed in bold.
Table 3. Multivariate linear models using monsoon climate parameters in July, August, September, and the monsoon season (July through September) to explain ponderosa pine latewood ring width variation before and after stepwise regression removed insignificant effects.
ModelTimeModel StatisticsParameterst Ratiop
Multivariate Regression Model Using VPD, PDSI, and PrecipitationJulyF = 4.09VPD−0.760.45
p = 0.01PDSI3.260.002
R2 = 0.18Precipitation−0.220.82
AugustF = 13.55VPD−2.230.01
p < 0.0001PDSI4.40<0.0001
R2 = 0.42Precipitation1.460.15
SeptemberF = 3.17VPD−1.020.31
p = 0.03PDSI2.860.01
R2 = 0.14Precipitation−0.730.47
MonsoonF = 8.52VPD−1.640.11
p < 0.0001PDSI3.980.0002
R2 = 0.31Precipitation1.190.24
Model after Reverse Order Stepwise RegressionJulyF = 11.91PDSI3.450.001
p = 0.001---
R2 = 0.17---
AIC = 1.83---
i = 17.19---
AugustF = 18.89VPD−3.500.001
p < 0.0001PDSI4.76<0.0001
R2 = 0.39---
AIC = −15.36---
i = 0.00---
SeptemberF = 8.58PDSI2.930.005
p = 0.005---
R2 = 0.13---
AIC = 4.84---
i = 20.20---
MonsoonF = 11.99VPD−2.620.01
p < 0.0001PDSI4.050.0002
R2 = 0.29---
AIC = −5.94---
i = 9.42---
F, p, and R2 statistics are given for each model, as well as the t Ratio and p value for each effect within a model (α = 0.05). In the model after reverse order stepwise regression, Akaike’s Information Criterion (AIC) and simple difference (∆i) values for each model are given. Lower AIC values indicate a stronger model and ∆i values greater than 10 are considered poorer with no statistical support [58].
Table 4. Water δ18O (‰) averages ± standard errors from precipitation, 40 cm soil, and stems in 2009 and 2010 winter (previous October through current March), spring (April through June), and monsoon (July through September) seasons.
SeasonPrecipitation40 cm Soil WaterStem WaterFp
Winter (2009)−13.29 ± 1.03 aA−12.70 ± 0.22 aAB−10.17 ± 0.27 aB4.690.02
Spring (2010)−6.86 ± 1.23 bA−12.32 ± 0.53 aB−10.46 ± 0.25 abB11.590.0002
Monsoon (2010)−4.90 ± 0.94 bA−10.75 ± 1.17 abB−9.91 ± 0.42 aB12.33<0.0001
Winter (2010)−13.29 ± 1.03 aA−12.37 ± 0.23 aA−11.85 ± 0.60 bcA0.540.59
Spring (2010)−6.86 ± 1.23 bA−11.78 ± 0.30 aB−13.36 ± 0.29 cB18.84<0.0001
Monsoon (2010)−4.90 ± 0.94 bA−9.17 ± 0.47 bB−11.07 ± 0.30 abB17.08<0.0001
F15.995.1811.89--
p<0.00010.001<0.0001--
Seasonal precipitation values are based on a pooled data set of 2009 and 2010 precipitation samples. Within precipitation, soil, and stem water columns, seasons not sharing the same lower case letter are significantly different. Within a season, samples not sharing the same capital letter are significantly different. F and p statistics are given (α = 0.05). A two-way ANOVA shows that season (F = 7.63, p < 0.0001) is a significant effect on water δ18O, sample (40 cm soil or stem) is not a significant effect (F = 1.75, p = 0.19), and there is an interaction between season and sample (F = 6.61, p < 0.0001).

