Article

Influence of Altitude on Biochemical Properties of European Beech (Fagus sylvatica L.) Forest Soils

by
Mauro De Feudis
1,
Valeria Cardelli
2,
Luisa Massaccesi
1,
Alessandra Lagomarsino
3,
Flavio Fornasier
4,
Danielle Janaina Westphalen
2,
Stefania Cocco
2,
Giuseppe Corti
2 and
Alberto Agnelli
1,5,*
1
Department of Agricultural, Food and Environmental Science, University of Perugia, 06121 Perugia, Italy
2
Department of Agricultural, Food and Environmental Science, Polytechnic University of Marche, 60131 Ancona, Italy
3
Council for Agricultural Research and Agricultural Economy Analysis, Research Centre for Agrobiology and Pedology, 50125 Firenze, Italy
4
Council for Agricultural Research and Agricultural Economy Analysis, Research Centre for Soil-Plant System Studies, 34170 Gorizia, Italy
5
Institute for Ecosystem Study, National Research Council, 50019 Sesto Fiorentino (Firenze), Italy
*
Author to whom correspondence should be addressed.
Forests 2017, 8(6), 213; https://doi.org/10.3390/f8060213
Submission received: 5 May 2017 / Revised: 5 June 2017 / Accepted: 13 June 2017 / Published: 17 June 2017

Abstract

:
Climate warming is predicted to raise the mean global temperature by 1 °C in the next 50 years, and this change is believed to be capable of affecting soil organic matter cycling and nutrient availability. With the aim of increasing knowledge on the response of forest soils to the ongoing climate change, we used altitude as a proxy for temperature change and studied chemical and biochemical properties of European beech (Fagus sylvatica L.) forest soils at two altitudes (800 and 1000 m) from central Apennines (Italy). Results showed that 1 °C of mean annual air temperature difference between the sites at the two altitudes had greater effect on the mineral horizons than on the organic horizons. At higher altitude, mineral soil had limited development, higher pH, and higher organic matter content due to the lower efficiency of the microbial community. Enzymatic activities of the organic horizons were generally not affected by altitude. Conversely, we observed a higher activity of xylosidase, β-glucosidase, alkaline phosphomonoesterase, arylsulfatase, and leucine-aminopeptidase in the sub-superficial horizons (Bw1 and Bw2) of the soils at 1000 m. We hypothesized that, as a response to environmental and climatic constraints occurring at higher altitude, plant roots increase the production of enzymes directly and/or indirectly by triggering the microbial community through exudation.

1. Introduction

The global mean surface temperature increased by 0.65–1.06 °C from 1880 to 2012, and a further increase of 1 °C is expected in the next fifty years [1]. The European region with a Mediterranean type of climate is the transition zone between the arid region of north Africa and the temperate and rainy region of central Europe, and could be one of the most affected by climate change [2,3]. Forest ecosystems, besides providing important ecological services [4], store a large amount of organic C in the soil [5], thus contrasting the atmospheric CO2 increase. As forests cover 20–30% of the total Mediterranean land area [6], it is useful to understand the possible impact of the ongoing global warming on the content and dynamic of the soil organic matter (SOM) of these ecosystems. Indeed, SOM affects ecosystem sustainability by influencing many edaphic physical, chemical and biological characteristics [7]. To obtain short-term responses to the expected warming on soil organic C, microbiological and biochemical properties can be used as indicators because of their great sensitivity even to slight environmental modifications [8]. This is an important aspect to investigate as the activity of the soil microbial community strongly affects organic C turnover [9,10] and sequestration [11], influences several biogeochemical cycling of elements, and contributes to soil structure formation and stabilization [12].
In addition to soil moisture, temperature is the most important environmental factor affecting the heterotrophic microbial biomass and activity [13], enzymatic activity [14], and the related biochemical processes such as SOM decomposition [15]. Current soil C and models at Earth-system level estimate a positive and exponential relationship between soil microbial respiration and global warming [16,17]. The model outputs have been confirmed by meta-analyses of the data obtained by experimental warming in forest ecosystems [18,19], which indicated that the boosted soil respiration is the result of increased enzymatic activities [20] and organic C turnover. Temperature influences the kinetics of metabolic processes [21], and warming can increase the rate at which enzymes collide with, and breakdown, substrates. However, enzymes do not all have the same temperature sensitivity; for example, enzymes degrading more complex C compounds may be more sensitive to temperature than those that degrade simple organic molecules [17,22]. Moreover, the temperature sensitivity of enzyme activity is also affected by the environmental conditions in which they are produced [23]. For example, enzymes released in soils of cold regions tend to have lower temperature optima than those produced in soils of warm environments [24].
Many studies were run on the influence of temperature on SOM cycling, but the obtained results were contrasting, possibly because the effect of temperature varied depending on the applied methods and the studied ecosystems. Among the different methodologies used to test the impact of temperature on soil properties, the climatic gradient that occurs over short distances in mountain slopes makes altitude a good proxy for understanding both the dynamic and steady-state response of forest soils to climate change. However, although many studies have been conducted along an altitudinal gradient e.g., [25,26,27,28], very few of them considered the same vegetation at different altitudes. An example of this is the study conducted on beech forests of the northern Apennines (Italy) by Vittori Antisari et al. [29], who found lower soil microbial respiration and metabolic quotient at higher altitude than at lower one, with greater chitinase, acid phosphatase and arylsulfatase activities at higher than at lower altitude. Another case is the study conducted on mixed pine and monospecific pine forests along an altitudinal gradient in the Cuenca Mountains, east-central Spain, by Lucas-Borja et al. [30], who found a general positive trend of the soil microbial and biochemical properties with altitude. To add knowledge about the influence of the temperature on soil microbial and biochemical properties, we explored European beech (Fagus sylvatica L.) forest soils of Apennine Mountains (central Italy) at two altitudes (800 and 1000 m), using altitude as a proxy for temperature change. Specifically, on both organic and mineral soil horizons, we tested whether (i) organic C content increases with altitude; (ii) soil microbial biomass and activity, and enzymatic activity decrease with altitude. To verify these hypotheses, soil samples were analysed for total organic C, total nitrogen, water-extractable organic C, available P, microbial biomass C and basal respiration, and the activities of nine enzymes.

2. Materials and Methods
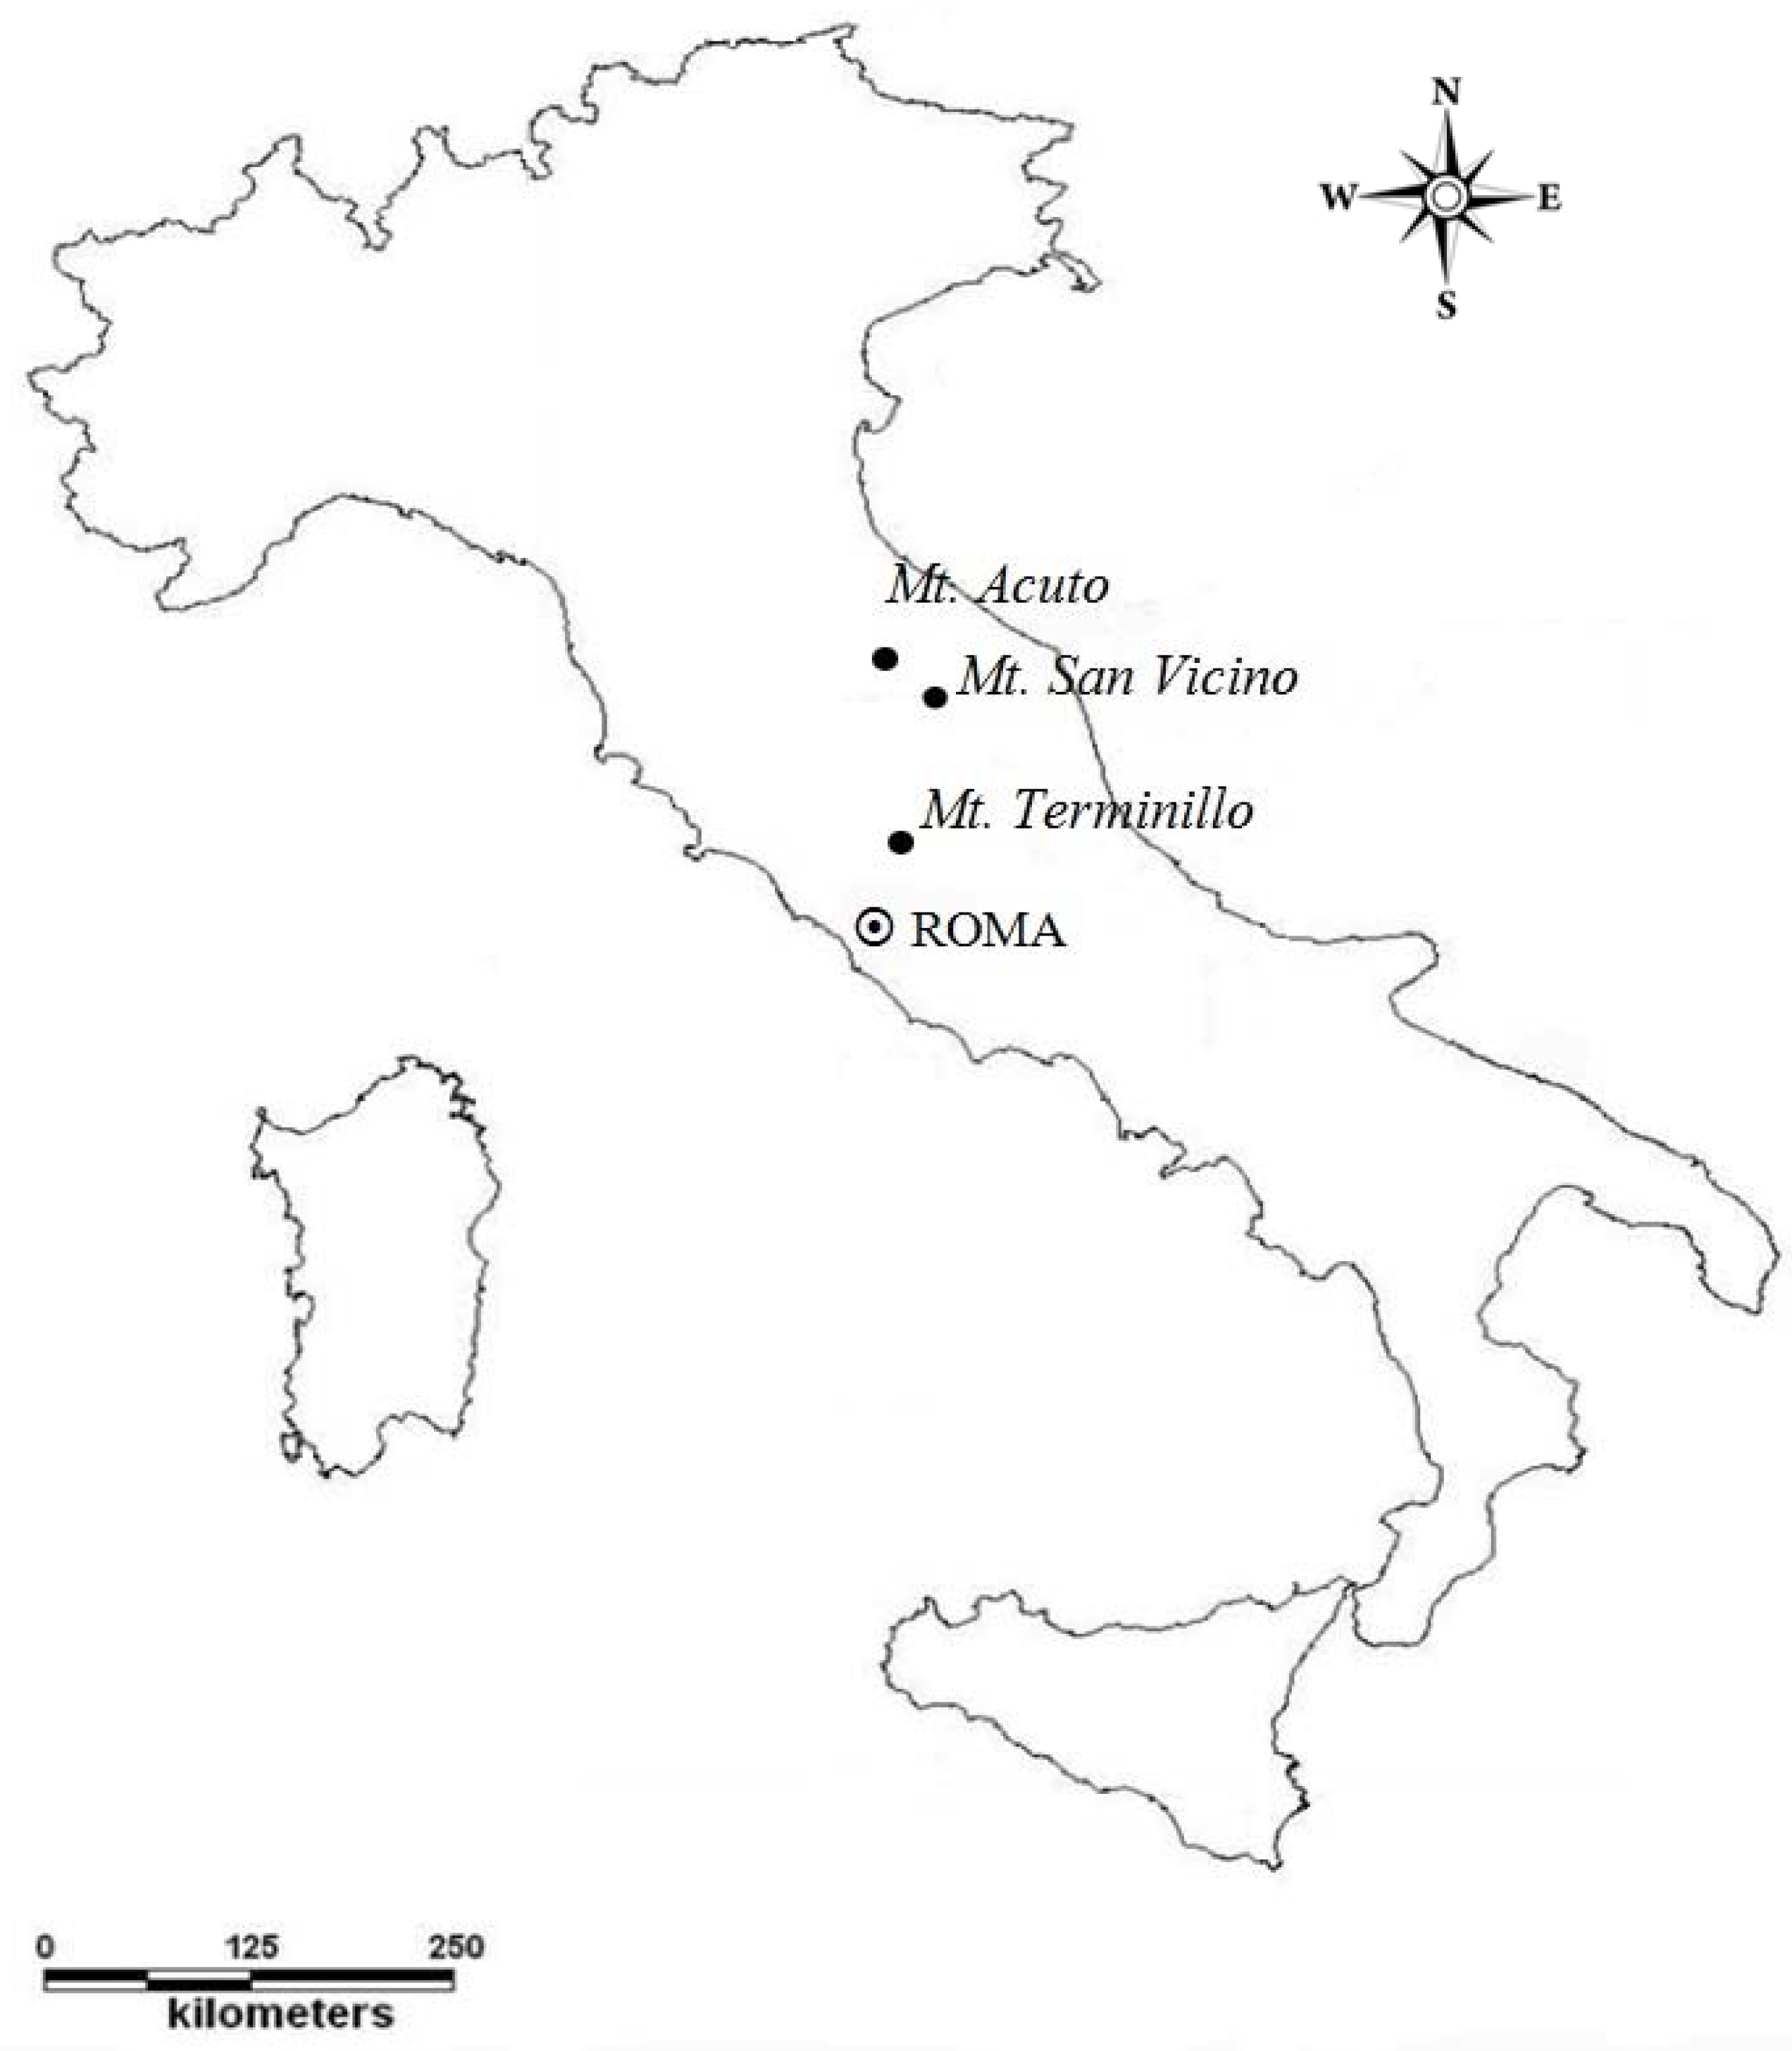
2.1. Study Sites

The studied soils came from three calcareous massifs of the central Apennines chain (Italy): Mount Terminillo (42°28′ N, 12°59′ E), Mount San Vicino (43°19′ N, 13°03′ E), and Mount Acuto (43°28′ N, 12°41′ E) (Figure 1). At each site, two European beech (Fagus sylvatica L.) forests were selected on the north-facing slope, at 800 and 1000 m above sea level (a.s.l.), and with an inclination ranging from 25° to 40°. The mean annual air temperature (MAAT) and the mean annual precipitation (MAP) were recovered from the climatic data supplied by Centro Appenninico “C. Jucci” [31] for Mount Terminillo (1956–2014 series), and from Spina et al. [32] and Amici and Spina [33] for both Mount San Vicino and Mount Acuto (1950–2000 series). According to these data, the study areas at 800 and 1000 m had a MAAT of 10 °C and 9 °C, respectively. The MAP of each site was similar at the two altitudes and it was 1248 mm at Mount Terminillo, 825 mm at Mount San Vicino, and 1430 mm at Mount Acuto. As the only detailed temperature series updated to nowadays was that of Mount Terminillo, to take into consideration temperature anomalies of the last years in each study site, we measured air temperature from March 2014 to March 2016 by YSI thermistors associated with UTL-2 dataloggers (Geotest, Zollikofen, Switzerland). The means obtained by the two-year measurements were 0.2–0.4 °C higher than those of the long series, in agreement with the data of the last two years of the Mount Terminillo series (2013 and 2014) and with the reports of Pasquale et al. [34] and Desiato et al. [35]. However, the MAAT difference between 800 and 1000 m remained about 1 °C. Concerning temperature anomalies, in the years 2003, 2012 and 2015, the study sites experienced very warm and dry summers, but their effect on the soil can be considered as similar at both 800 and 1000 m. All the soils had a mesic soil temperature regime and an udic soil moisture regime.
The selected forests were coppices in conversion, with the conversion that started from about 20 to 40 years ago. The most recent conversions occurred at 800 m at Mount Terminillo and at 1000 m at Mount San Vicino, while the oldest conversions started at 1000 m at Mount Terminillo and at both altitudes of Mount Acuto. At all sites, beech was the dominant tree, always representing more than 80% of the forest composition. The soil cover due to understory ranged from 5 to 50%, with scarce to null signs of erosion. In fact, the soil coverage due to litter was always complete.
A detailed physiographic and climatic description of each site is reported in Table S1 of the Supplementary Materials.

2.2. Soils and Soil Sampling

During the first decade of March 2014, two soil profiles were dug within a plot of about 100 m2 at each altitudinal site, for a total of 12 profiles (2 profiles × 2 altitudes × 3 calcareous massifs). Each profile was opened at about 50–60 cm from the stem of selected beech trees and morphologically described per Schoeneberger et al. [36]. Morphological observations of the profiles are given in Table S1 of the Supplementary Materials. Here, it suffices to recollect that the thickness of the O horizons in the soils at 800 m ranged from 5 to 10 cm, while at 1000 m the range was from 5 to 17 cm. The organic layer rested on mollic A horizons that in most cases were sufficiently thick to allow the soils to be classified as Mollisols according to Soil Survey Staff [37]. In particular, at 1000 m, all the soils belonged to the order of Mollisols, while at 800 m three out of six soils had a too thin mollic horizon and were classified as Inceptisols because of the presence of a sufficiently thick cambic Bw horizon. In all cases, the A horizons showed a moderately to strongly developed structure made of crumbs or sub-angular blocks, while the horizons underneath displayed a less developed structure made of sub-angular and/or angular blocks. The OLv and OH horizons hosted the majority of mycelium, and only in one case (a soil at 800 m from Mount San Vicino) was mycelium also observed in the A horizon. The thickness of the solum (A+B horizons) ranged from 19 to 108 cm in the soils at 800 m, and from 24 to 76 cm in the soils at 1000 m. Analyses were run on all the organic horizons and on the mineral horizons until the first two Bw horizons.
From each soil horizon, a large amount of sample (0.27–0.9 kg for the organic horizons, and about 2 kg for the mineral ones) was collected and stored in a portable refrigerator. Once in the laboratory, an aliquot of each sample was stored at 4 °C for biochemical analysis, while the rest was allowed to air-dry. Then, about one-half of each dried organic sample was left in natural conditions, while the other half was triturated to pass a 1 mm sieve; the mineral samples were deprived of the visible roots under a magnifying lens and sieved with a 2-mm mesh.

2.3. Chemical Analysis

The pH was determined potentiometrically in water with a solid:liquid (w:v) ratios of 1:8 for the organic horizons (non-triturated samples) and 1:2.5 for the mineral horizons. Total organic C (TOC) content was estimated by K-dichromate digestion, heating the suspension at 180 °C for 30 min [38]. Total N (TN) content was determined by a Carlo Erba EA1110 dry combustion analyzer (Carlo Erba Instruments, Milano, Italy). Water-extractable organic C (WEOC) was obtained according to Agnelli et al. [39] with the following procedure: 1 g of sample was placed into a plastic container, submerged with distilled water (solid:liquid ratio 1:10) and shaken overnight with an orbital shaker (140 rpm). The suspension was centrifuged at 1400 g for 10 min, and then filtered through a 0.45 μm membrane filter. The resulting solution was analyzed with a TOC-500A analyzer (Shimatzu, Kyoto, Japan) after the addition of a few drops of concentrated H3PO4 to eliminate carbonates. For the determination of TOC, TN and WEOC contents of the organic horizons, we used triturated samples. Available P was estimated only in the mineral horizons according to Olsen et al. [40].

2.4. Biochemical Analysis

The amount of microbial biomass-C (Cmic) was determined by the fumigation–extraction method [41], after the samples were conditioned for 50 days at 25 °C and at 50% of the total water holding capacity. Briefly, each soil sample (for the organic horizons, we used non-triturated samples) was exposed to alcohol-free chloroform (CHCl3) vapor in a vacuum desiccator at 25 °C for 24 h. Then, CHCl3 was removed from the fumigated soils by repeated evacuations. The fumigated and not-fumigated samples were extracted by shaking for 30 min with 0.5 M K2SO4 (solid:liquid ratio 1:4). The extracted organic C was measured by oxidation with K-dichromate and a subsequent back-titration of the unreduced dichromate [41]. During the incubation period, basal respiration was measured by alkali (1 M NaOH solution) absorption of the CO2 developed and titration of the residual OH with a standardized HCl solution. Basal respiration was expressed as the cumulative amount of CO2–C that evolved during the experiment (ΣCO2–C).
Enzymes were desorbed by heteromolecular exchange using an excess of exogenous protein [42], and enzymatic activity was quantified according to Cowie et al. [43]. Briefly, 150 mg of non-triturated sample for the organic horizons and 250 mg of sample for the mineral horizons were placed in a 2-mL Eppendorf tube with glass beads and 1.2 mL of 50 mM tris-HCl solution at pH 7.0, containing 2% lysozyme as a desorbing protein. The tube was subjected to bead-beating (3 min, 30 strokes s−1) using a Retsch MM400 mill (Retsch, Haan, Germany), and then centrifuged for 5 min at 20,000 g. Enzymatic activity was assayed fluorometrically in microplates using 4-methyl-umbelliferyl and 7-amino-4-methyl coumarine conjugated surrogate substrates (Sigma, St Louis, MO, USA). The activity of cellulase, xylosidase, β-glucosidase, chitinase, acid phosphomonoesterase, and arylsulfatase was determined in 200 mM MES (morpholineptansulfonic acid) solution at pH 5.8; the activity of alkaline phosphomonoesterase was determined in 100 mM tris-HCl solution at pH 9.0, and that of acetate esterase and leucine aminopeptidase in 100 mM tris-HCl solution at pH 7.5.

2.5. Statistical Analysis

To assess differences among horizons at the two altitudes, the results of each horizon were averaged with those of the similar horizon at 800 m, and the same was done for those at 1000 m. However, to obtain solid horizon averages, for the soils where the AB horizons were absent (Mount Terminillo), we considered as AB the A2 horizon of a soil at 800 m and one at 1000 m; the 2Ab horizon of a soil at 1000 m from Mount Acuto was averaged with the above AB horizon. Hence, for both A and AB horizons, the results of each couple of profiles at the three sites were averaged, and these averages were used to calculate the mean for both altitudes (n = 3). Additionally, for the Bw horizons, we had to adjust few situations. At Mount Terminillo, soil was shallow both at 800 and 1000 m, where no Bw horizon was present; for this site, only the Bw1 and Bw2 horizons of one profile per altitude were considered. At Mount San Vicino, one of the soils at 1000 m showed a Bw and a 2Bwb horizon, which were considered as Bw1 and Bw2, respectively. At Mount Acuto, one soil at 1000 m had a 2Bwb horizon that was considered as a Bw1, while the underneath 3Ab and 3Bwb were averaged and considered as Bw2 horizon. After these adjustments, also for Bw1 and Bw2 horizons, a mean for both altitudes was calculated for n = 3.
Two-way ANOVA was performed to assess the effect of altitude and soil horizons on the soil properties. Graphical analyses of residuals were used to ensure that the basic assumptions for linear models were met; otherwise, the data were transformed according to the maximum likelihood procedure suggested by Box and Cox [44]. The results presented are based on mean values and their standard error, and the significance of differences between means was assessed by using Fisher’s least significant difference (LSD) post-hoc test (p < 0.05). The data were analyzed using R software [45].
Non-metric multidimensional scaling (NMDS) performed by using the R package “vegan” with the dissimilarity matrix calculated by the Gower’s distance was used to provide a graphical representation of results for both organic (Stress = 0.105) and mineral (Stress = 0.100) horizons. For this analysis, data were standardized by subtracting the mean and dividing by the standard deviation.

3. Results

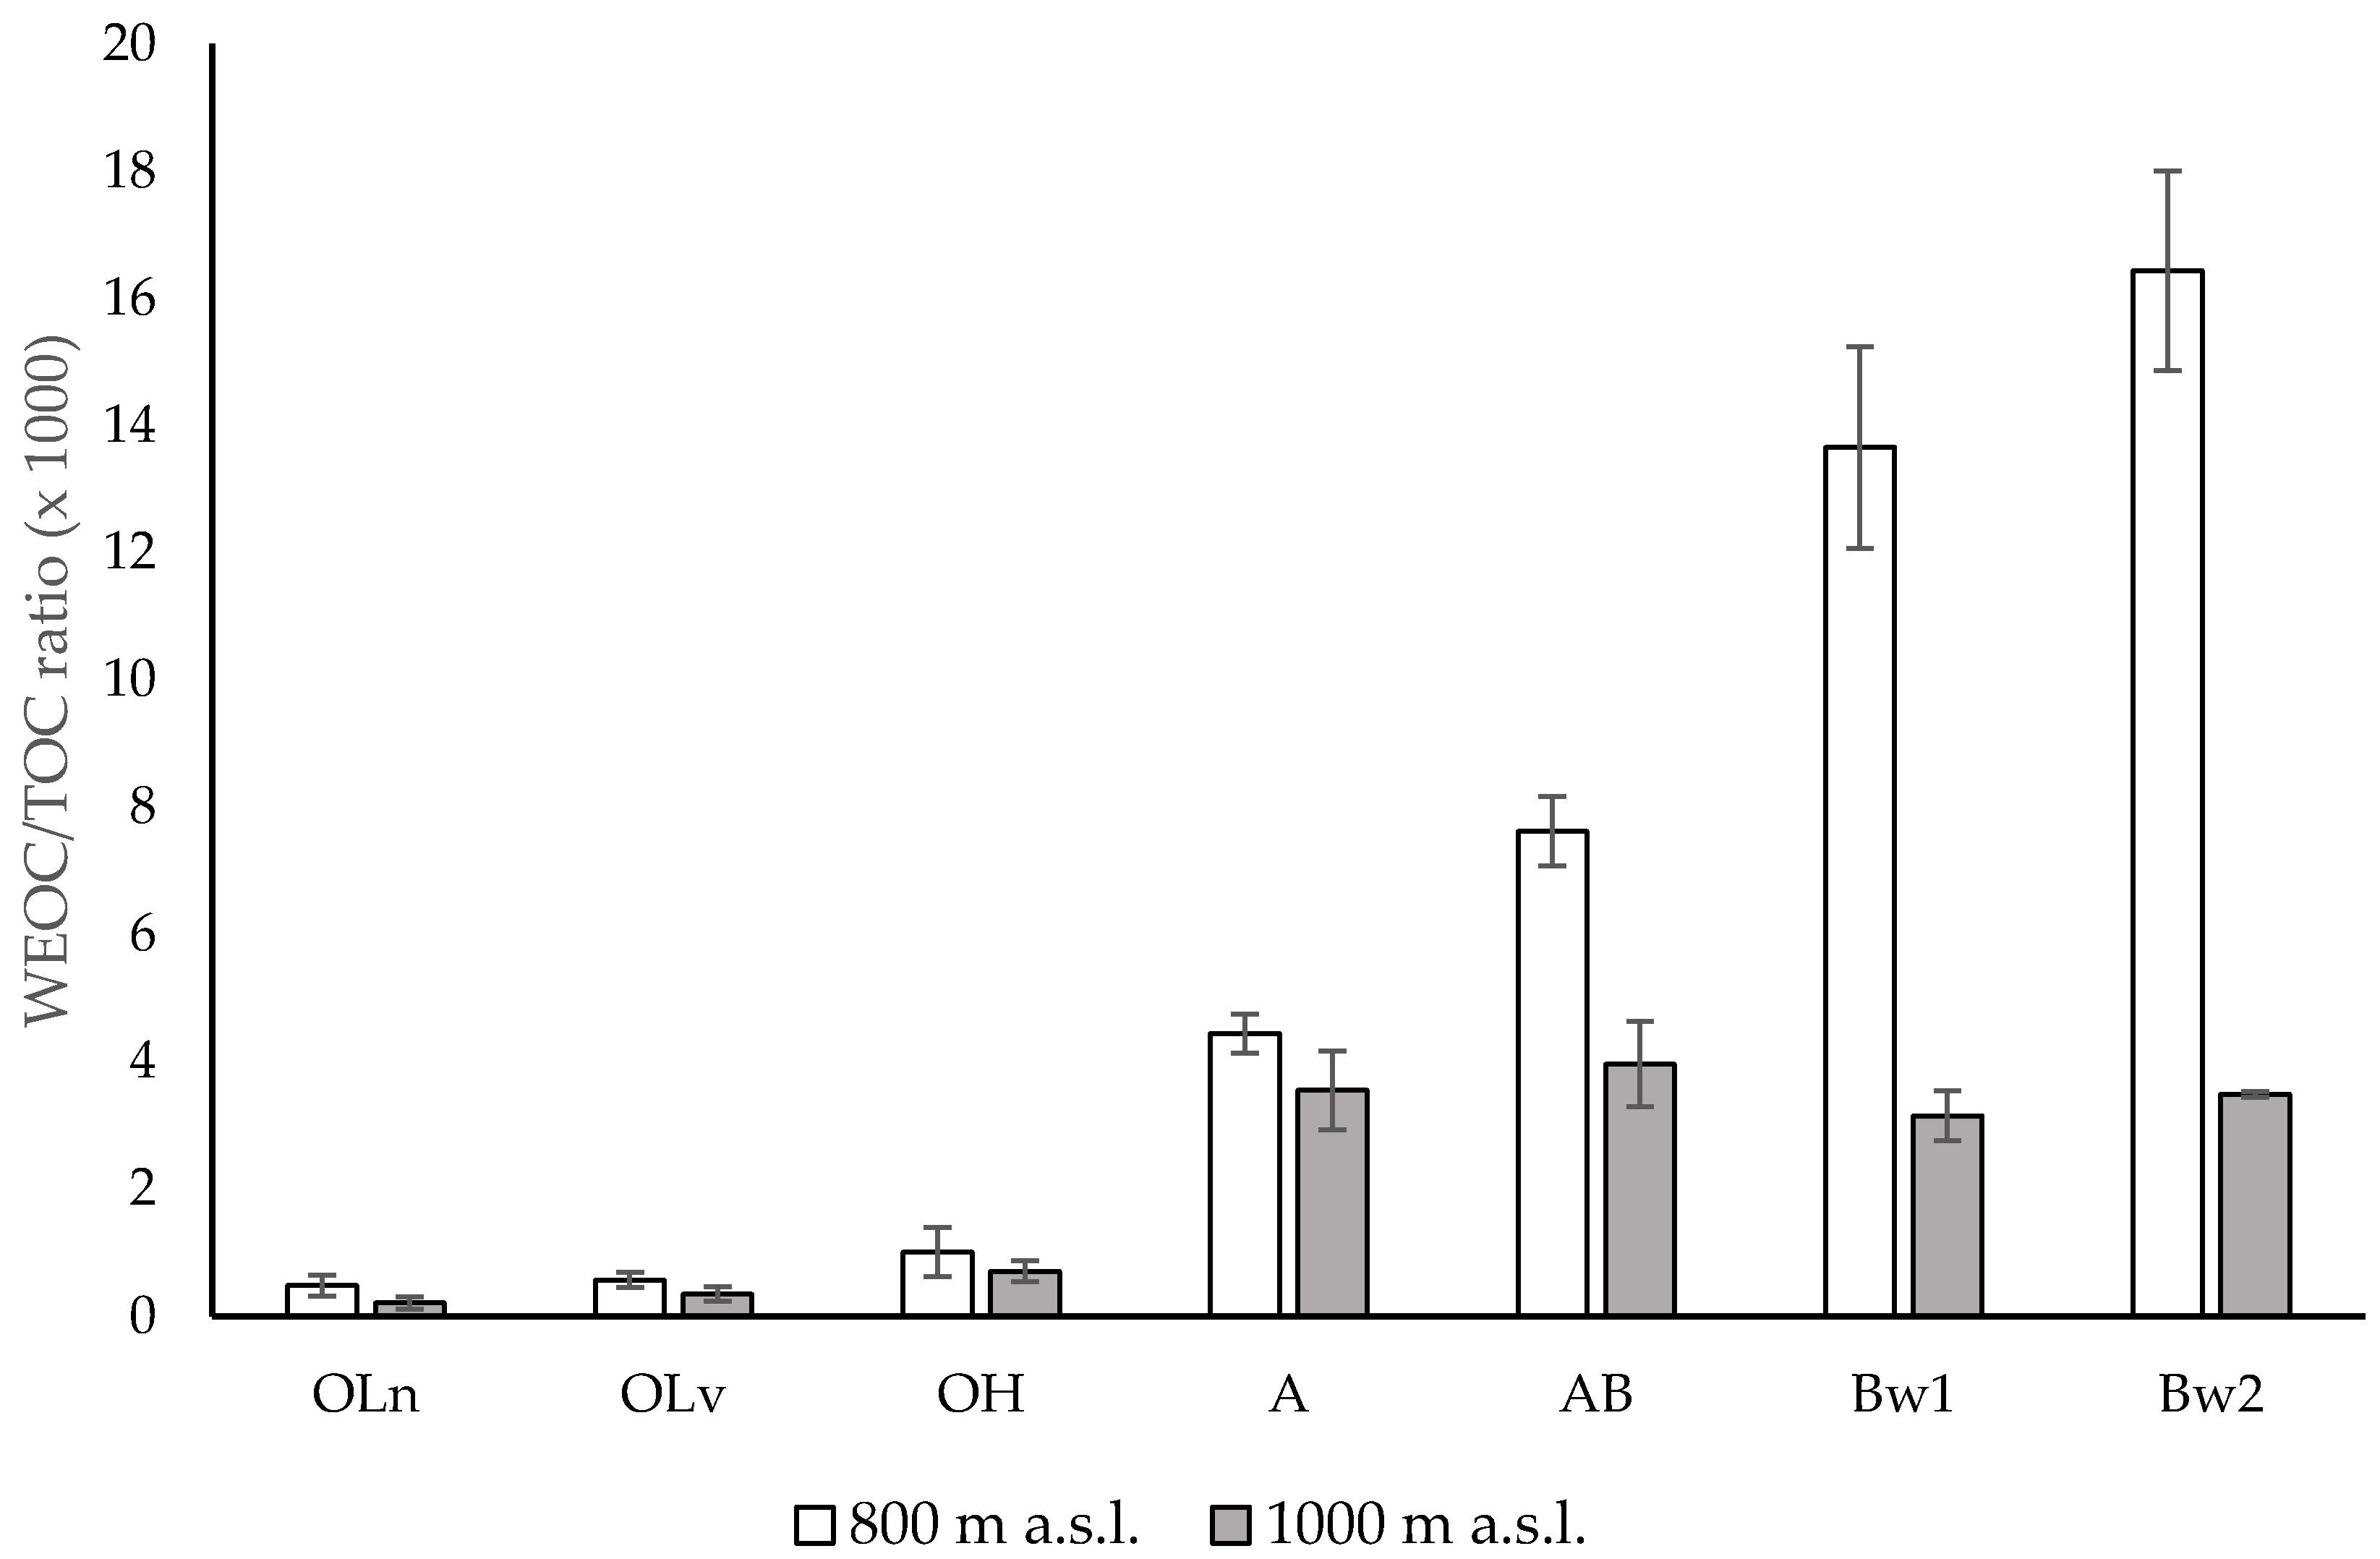
3.1. Chemical Properties

For the soils at 800 m, pH ranged from 6.27 to 7.02, with no substantial difference among the horizons (Table 1). At 1000 m, pH ranged from 6.08 to 7.75 and few mineral horizons showed pH values higher than those of the organic ones. Differences between horizons at the two altitudes occurred only for the sub-superficial horizons (AB, Bw1 and Bw2). At the two altitudes, both TOC and TN contents were much higher in the organic than in the mineral horizons (Table 1). As expected, the two parameters tended to decrease with depth at both altitudes. TOC and TN were similar in the organic horizons at 800 and 1000 m, while they were higher in the mineral horizons at 1000 than at 800 m. The concentration of WEOC showed no variation with depth and between altitudes, with the only exception of the OLn horizon at 1000 m, which showed the lowest value. The available P content tended to decline with depth at both altitudes, and was greater in the sub-superficial horizons (AB, Bw1 and Bw2) of the soils at 1000 than in those at 800 m.

3.2. Microbial Biomass C Content, Basal Respiration and Enzymatic Activity

At low and high altitude, both Cmic content and ΣCO2–C were markedly higher in the organic than in the mineral horizons, and tended to decrease from OLn to OH horizon (Table 2). In the mineral horizons, Cmic decreased with depth only in the soils at 800 m, while at 1000 m it exhibited similar values along the whole soil profiles. Concerning ΣCO2–C, in the mineral horizons at 800 m it decreased with depth from 1984 mg kg−1 (A horizon) to 265 mg kg−1 (Bw2 horizon), but because samples were small, the difference was not statistically significant. At 1000 m, ΣCO2–C was similar in all the mineral horizons.
By contrasting the two biochemical parameters horizon by horizon, only Cmic differed in the sub-superficial horizons (AB, Bw1 and Bw2), with larger values at 1000 than at 800 m.
The activities of most of the enzymes showed the highest values in the OLn horizon and decreased with increasing depth, both within organic and mineral horizons (Table 3). The only exception to this trend was represented by the arylsulfatase activity, which increased at both altitudes from the OLn horizon to the A horizon, to remain rather constant with increasing depth except for the Bw2 horizon at 800 m where it reduced significantly. By contrasting horizon by horizon, the enzymatic activities were generally similar at 800 and 1000 m, although some exceptions occurred. In particular, in the organic horizons at 1000 m, cellulase showed lower activity in the OLv and OH horizons, while the alkaline phosphomonoesterase activity was higher in the OLn horizon. In the mineral soil, alkaline phosphomonoesterase showed greater activity in the sub-superficial horizons (AB, Bw1, Bw2) at 1000 m, whereas xylosidase, β-glucosidase, arylsulfatase and leucine-aminopeptidase displayed, in general, major activities in the deeper horizons of the soils at 1000 m.

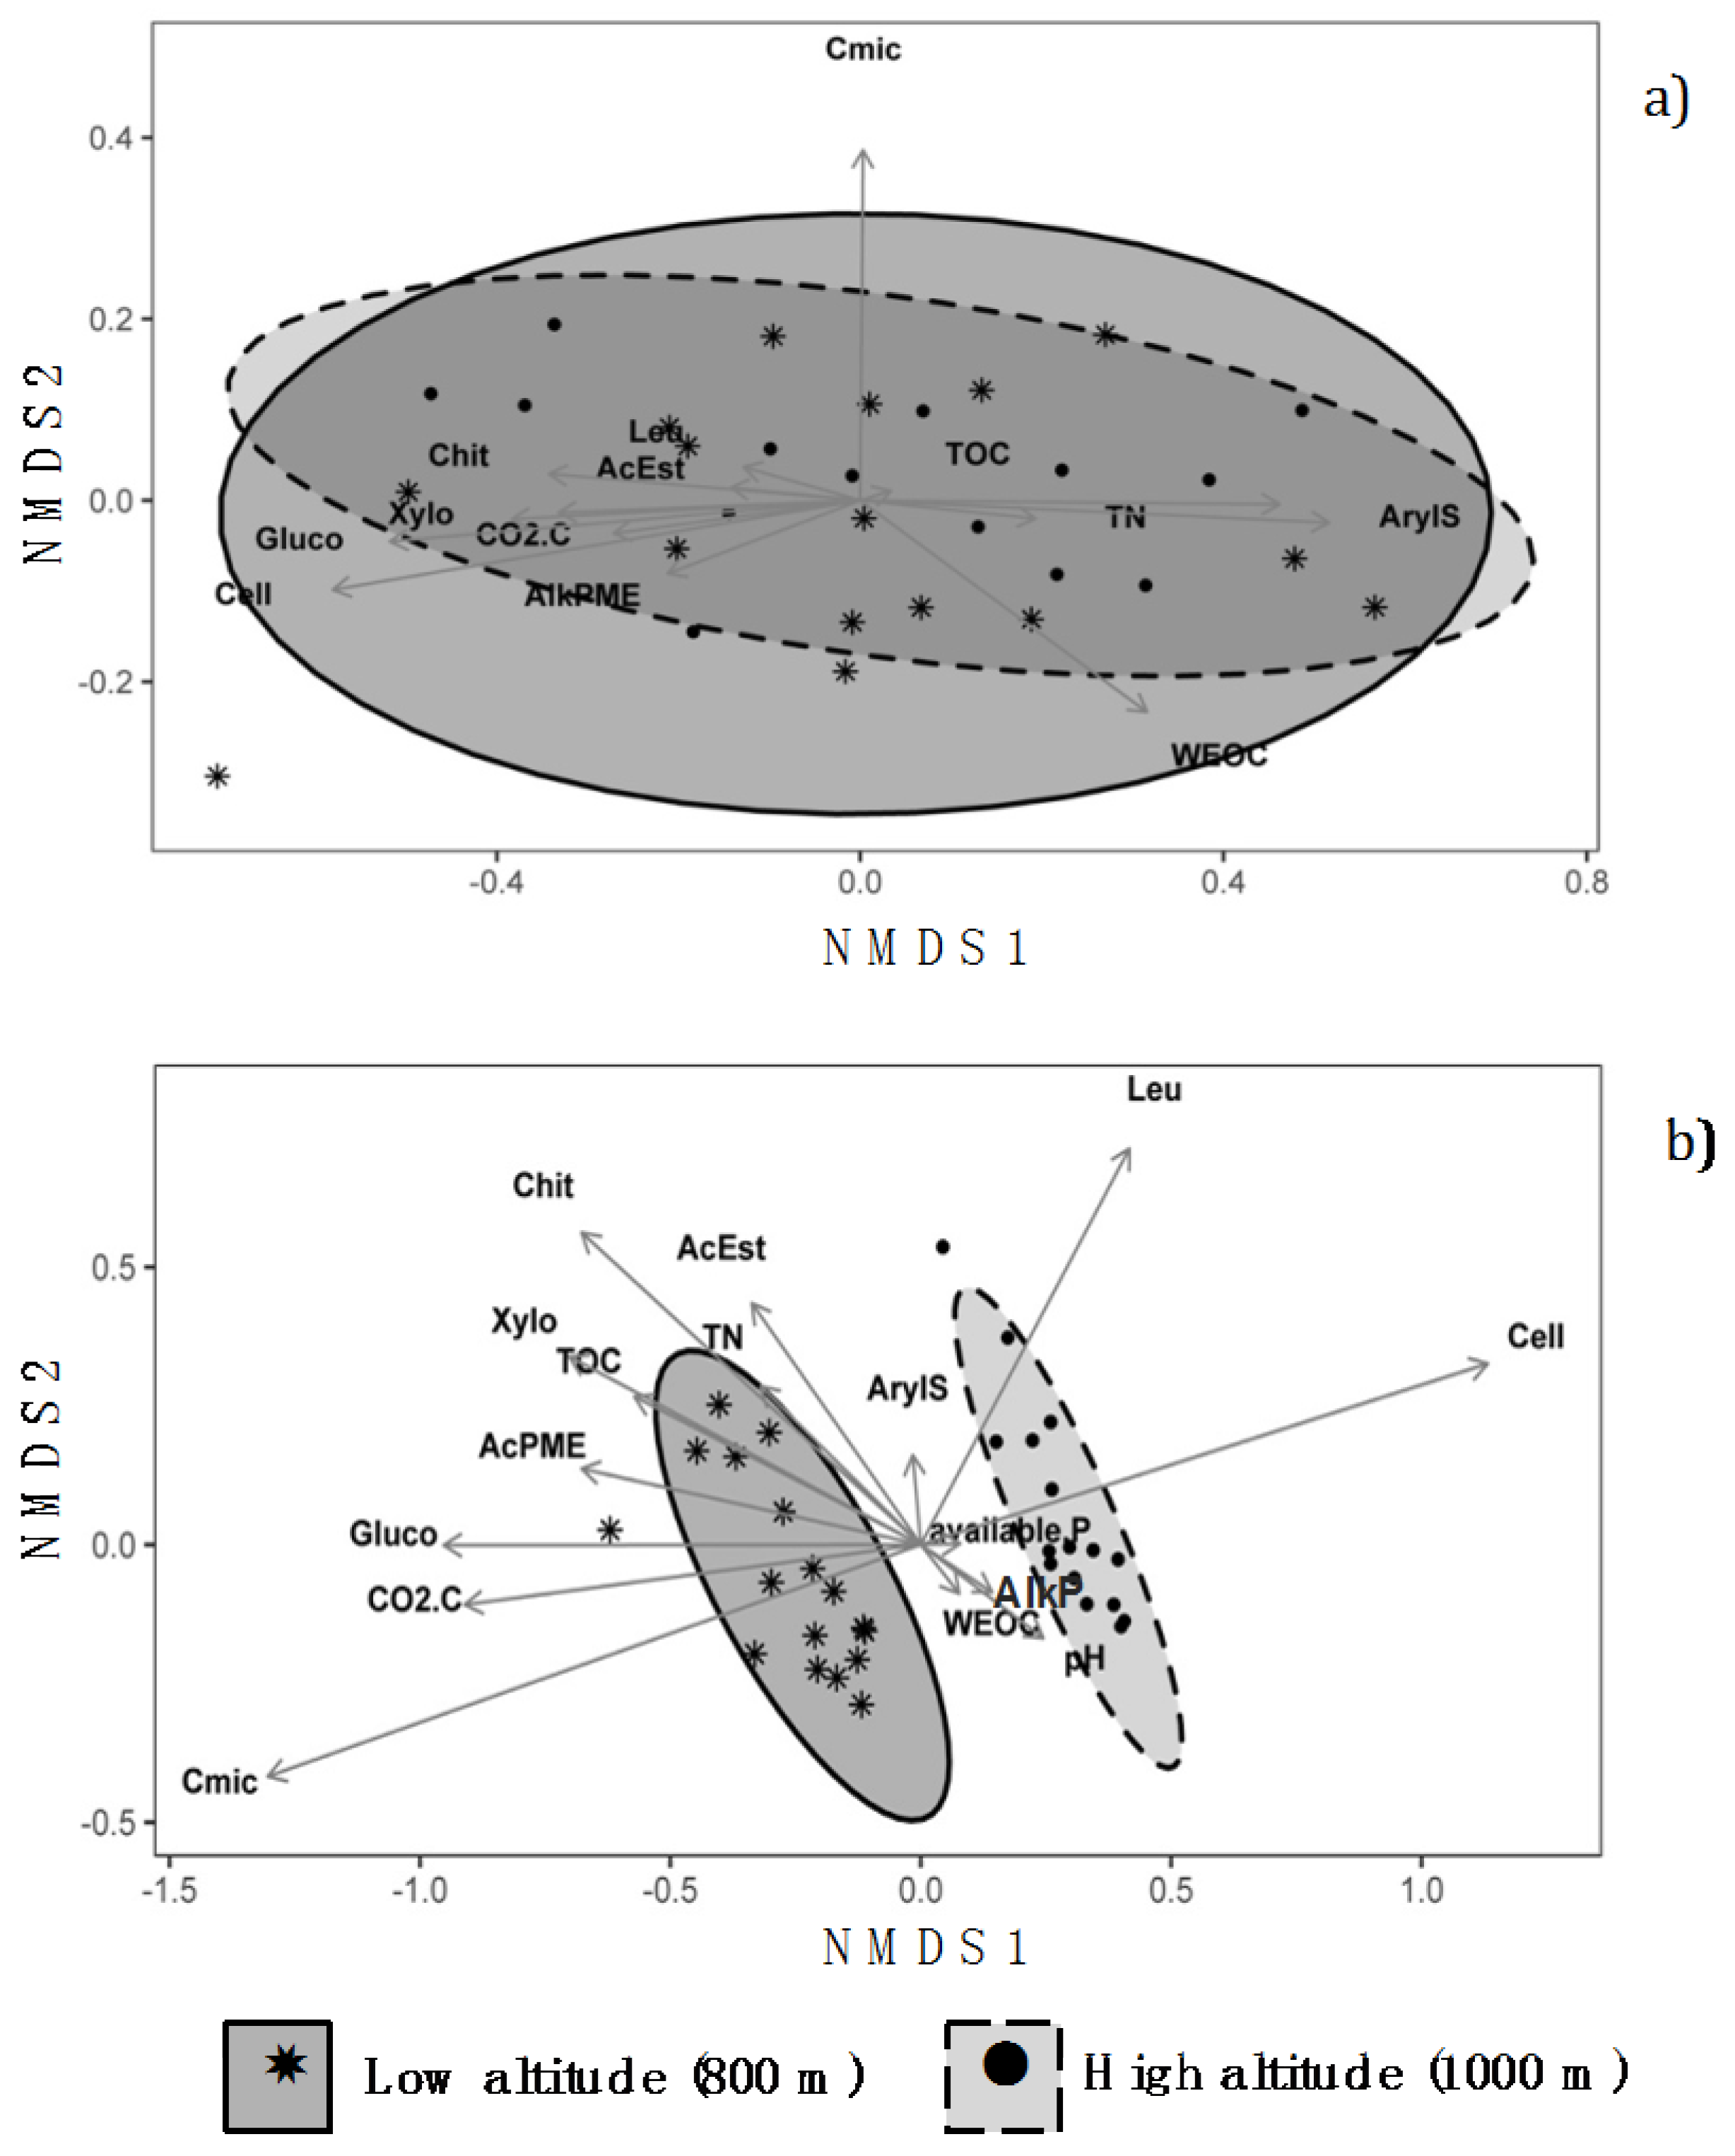
3.3. Non-Metric Multidimensional Scaling Analysis

NMDS analysis provided substantial similarity between chemical and biochemical characteristics of the organic horizons at 800 and 1000 m, as indicated by the almost complete overlapping of the confidence ellipses (Figure 2a). Conversely, NMDS analysis performed on the mineral horizons (Figure 2b) grouped the data into two clusters according to the different altitudes. The separation of the two groups occurred along the axis 1 which appeared to be mainly driven by the contents of TOC and Cmic, the ΣCO2–C, and the activities of β-glucosidase, cellulase, xylosidase and phosphomonoesterase.

4. Discussion

Altitude did not affect the soil pH of the organic horizons and of the upper part of the mineral soil (A horizon), but produced significant differences in the deeper horizons. The higher pH values of the AB, Bw1 and Bw2 horizons at 1000 m than at 800 m were attributed to a lower rate of chemical weathering and decarbonation that occur in the mountain soils with increasing altitude [46,47]. The greater TOC and TN contents in the mineral soil at higher altitude were mostly considered a consequence of the lower mean temperature [48] that, despite reducing the production of plant biomass, lowers the soil microbial activity [49,50,51,52]. However, this effect was not visible in the OLn, OLv and OH horizons where TOC and TN concentrations did not change among the layers (with the exception of the OH horizon at 1000 m) and at the two altitudes. With regard to the altitude effect, the lack of significant differences in TOC and TN contents in the organic horizons at the two altitudes was attributed to the morphological variability among the study sites that spanned about 1° latitude along the Apennine chain. Conversely to TOC, WEOC content did not differ between the soils at 800 and 1000 m. Because of this, the lower WEOC/TOC ratios in the mineral horizons at 1000 m (Figure 3) were evidently due to a higher content of organic matter as a consequence of the lower mean temperature [47].
With regard to Cmic content, while organic horizons did not show significant differences between 800 and 1000 m, the mineral horizons had more abundant microbial biomass in the sub-superficial horizons (AB, Bw1, Bw2) at 1000 m. This latter fact, together with the similar ΣCO2–C released during the incubation experiment, would confirm the low efficiency of the microbial community at higher altitude [51]. The lack of effect of the altitude on the organic horizons for both microbial biomass and respiration may be due to the large availability of microbes of easily degradable substances that occurs in the organic layer. Therefore, the low energetic requirements needed by the microbial community of the O horizons to have access to degradable substrates could mitigate the low thermic constraints (1 °C) of the soils at 1000 m with respect to those at 800 m. Conversely, the reduction of SOM content and its increasing recalcitrance with depth [53] in the mineral horizons with respect to the organic layers made the microbial community more sensitive to the changes occurring at 1000 m because of the lower temperature. In fact, although the thermal damping increases with depth, the microbial community in the deeper horizons partly depends on the easily available substances produced by the degradation processes of the litter layer, which is more exposed to environmental constraints.
In general, although the influence of other factors on soil biogeochemical processes due to the above and belowground heterogeneity cannot be excluded, 1 °C of temperature difference between the sites at 800 and 1000 m seemed to have little effect on the soil enzymatic activity, especially in the organic horizons. The only two enzymes that showed sensitivity to the altitude in the organic horizons were cellulase and alkaline phosphomonoesterase. The reduced activity of cellulase in the OLv and OH horizons at 1000 m with respect to those at 800 m, could be due to the high temperature sensitivity of C-degrading enzymes [54] and to the fact that enzymes that degrade complex compounds (such as cellulose) are more sensitive to temperature than enzymes degrading simple molecules [20,21]. The low cellulase activity might have caused a decrease in the C use efficiency of the decomposer [55,56] and, hence, reduced the rate of decomposition of the organic residue and increased the soil C content at high altitude. The greater activity at 1000 m than at 800 m of the alkaline phosphomonoesterase all along the mineral horizons, other than in the OLn horizon, further supported the general higher amount of available P occurring in the soils at higher altitude. The larger TOC content [57,58] and the higher pH [59] of the soils at greater elevation were considered the main factors able to foster the alkaline phosphomonoesterase activity. Further, the higher enzymatic activities (xylosidase, β-glucosidase, alkaline phosphomonoesterase, arylsulfatase and leucine aminopeptidase) found in the deeper mineral horizons might be due more to plant roots than to the microbial community, which strongly decreases with increasing soil depth. Indeed, plant roots are also responsible for the soil enzyme production, both by direct release of the enzymes [59,60] and by enhancing the microbial activity through rhizodeposition processes [61]. In this regard, we hypothesize that, as a response to climatic constraints occurring at higher altitude, plants may release low molecular weight organic substances [62] able to fuel the activity of the soil microbial community [63] and stimulate the enzymes production.

5. Conclusions

In this work, we evaluated the effect of altitude, and consequently of temperature, on the chemical and biochemical properties of beech forest soils along the Apennine chain (Italy). The analytical results and the NMDS analysis showed that 1 °C of mean annual temperature difference between the sites at 800 m and 1000 m a.s.l. had a greater effect on the mineral horizons than on the organic ones, which are more exposed to environmental constraints. Indeed, the lower mean temperature occurring at 1000 m was responsible for a reduced soil weathering, as suggested by the limited profile development and higher pH, and a general lower organic decomposition, as indicated by the greater concentration of TOC and TN in the mineral horizons but not in the organic horizons. The biochemical data (Cmic and ΣCO2–C) partly supported these findings, indicating a general lower efficiency of the microbial community at higher altitude than at lower altitude. With regard to the enzymatic activities, in general, no statistically significant effect between the sites at 800 m and 1000 m was found in the organic horizons, possibly because of their large availability of easily degradable substances that, stimulating microrganisms, are able to mitigate the low thermic constraints. Conversely, significantly higher activity of some enzymes (xylosidase, β-glucosidase, alkaline phosphomonoesterase, arylsulfatase, and leucine aminopeptidase) in the Bw1 and Bw2 horizons of the soils at 1000 m was probably due to a production of enzymes directly and indirectly promoted by the roots of the plants found at this height.

Supplementary Materials

The following are available online at www.mdpi.com/1999-4907/8/6/213/s1, Table S1: General features and morphology of the soils under Fagus sylvatica L. at 800 and 1000 m of altitude for mountains of central Apennines (Italy).

Acknowledgments

The authors are indebted with Francesco Bigaran for field assistance.

Author Contributions

M.D.F., V.C., M.L., A.L., F.F. S.C., G.C. and A.A. conceived and designed the study; M.D.F., V.C., M.L., S.C., G.C. and A.A. collected the samples and performed the chemical analyses; A.L., F.F., D.J.W. performed the biochemical analyses; M.D.F., V.C., M.L. and A.A. analysed the data; M.D.F., V.C., M.L., A.L., F.F. S.C., G.C. and A.A. wrote the paper.

Conflicts of Interest

The authors declare no conflict of interest.

References

  1. Intergovernmental Panel on Climate Change (IPCC). Summary for policymakers. In Climate Change 2013: The Physical Science Basis; Contribution of Working Group I to the Fifth Assessment Report of the Intergovernmental Panel on Climate Change; Stocker, T.F., Qin, D., Plattner, G.-K., Tignor, M., Allen, S.K., Boschung, J., Nauels, A., Xia, Y., Bex, V., Midgley, P.M., Eds.; Cambridge University Press: Cambridge, UK; New York, NY, USA, 2013; pp. 1–30. [Google Scholar]
  2. Giorgi, F.; Lionello, P. Climate change projections for the Mediterranean region. Glob. Planet. Chang. 2008, 63, 90–104. [Google Scholar] [CrossRef]
  3. Piovesan, G.; Biondi, F.; Di Filippo, A.; Alessandrini, A.; Maugeri, M. Drought-driven growth reduction in old beech (Fagus sylvatica L.) forests of the central Apennines, Italy. Glob. Chang. Biol. 2008, 14, 1265–1281. [Google Scholar] [CrossRef]
  4. Bonan, G.B. Forests and climate change: forcings, feedbacks, and the climate benefits of forests. Science 2008, 320, 1444–1449. [Google Scholar] [CrossRef] [PubMed]
  5. Lal, R. Forest soils and carbon sequestration. Forest Ecol. Manag. 2005, 220, 242–258. [Google Scholar] [CrossRef]
  6. Scarascia-Mugnozza, G.; Oswald, H.; Piussi, P.; Radoglou, K. Forests of the Mediterranean region: Gaps in knowledge and research needs. For. Ecol. Manag. 2000, 132, 97–109. [Google Scholar] [CrossRef]
  7. Knoepp, J.D.; Coleman, D.C.; Crossley, D.A., Jr.; Clark, J.S. Biological indices of soil quality: An ecosystem case study of their use. For. Ecol. Manag. 2000, 138, 357–368. [Google Scholar] [CrossRef]
  8. Gil-Sotres, F.; Trasar-Cepeda, C.; Leiros, M.C.; Seoane, S. Different approaches to evaluating soil quality using biochemical properties. Soil Biol. Biochem. 2005, 37, 877–887. [Google Scholar] [CrossRef]
  9. Kögel-Knabner, I. The macromolecular organic composition of plant and microbial residues as inputs to soil organic matter. Soil Biol. Biochem. 2002, 34, 139–162. [Google Scholar] [CrossRef]
  10. Ludwig, M.; Achtenhagen, J.; Miltner, A.; Eckhardt, K.-U.; Leinweber, P.; Emmerling, C.; Thiele-Bruhn, S. Microbial contribution to SOM quantity and quality in density fractions of temperate arable soils. Soil Biol. Biochem. 2015, 81, 311–322. [Google Scholar] [CrossRef]
  11. Miltner, A.; Bombach, P.; Schmidt-Brücken, B.; Kästner, M. SOM genesis: Microbial biomass as a significant source. Biogeochemistry 2012, 111, 41–55. [Google Scholar] [CrossRef]
  12. Lagomarsino, A.; Moscatelli, M.C.; Di Tizio, A.; Mancinelli, R.; Greco, S.; Marinari, S. Soil biochemical indicators as a tool to assess the short-term impact of agricultural management on changes in organic C in a Mediterranean environment. Ecol. Indic. 2009, 9, 518–527. [Google Scholar] [CrossRef]
  13. Paul, E.A.; Clark, F.E. Soil Microbiology and Biochemistry, 2nd ed.; Academic Press: San Diego, CA, USA, 1996. [Google Scholar]
  14. Burns, R.G.; DeForest, J.L.; Marxsen, J.; Sinsabaugh, R.L.; Stromberger, M.E.; Wallenstein, M.D.; Weintraub, M.N.; Zoppini, A. Soil enzymes in a changing environment: current knowledge and future directions. Soil Biol. Biochem. 2013, 58, 216–234. [Google Scholar] [CrossRef]
  15. Kirschbaum, M.U.F. The temperature dependence of organic-matter decomposition—Still a topic of debate. Soil Biol. Biochem. 2006, 38, 2510–2518. [Google Scholar] [CrossRef]
  16. Friedlingstein, P.; Cox, P.; Betts, R.; Bopp, L.; Von Bloh, W.; Brovkin, V.; Cadule, P.; Doney, S.; Eby, M.; Fung, I. Climate-carbon cycle feedback analysis: Results from the C4MIP model intercomparison. J. Clim. 2006, 19, 3337–3353. [Google Scholar] [CrossRef]
  17. Davidson, E.A.; Janssens, I.A. Temperature sensitivity of soil carbon decomposition and feedbacks to climate change. Nature 2006, 440, 165–173. [Google Scholar] [CrossRef] [PubMed]
  18. Rustad, L.E.; Campbell, J.L.; Marion, G.M.; Norby, R.J.; Mitchell, M.J.; Hartley, A.E.; Cornelissen, J.; Gurevitch, J.; GCTE-NEWS. A meta-analysis of the response of soil respiration, net nitrogen mineralization, and aboveground plant growth to experimental ecosystem warming. Oecologia 2001, 126, 543–562. [Google Scholar] [CrossRef] [PubMed]
  19. Wu, Z.; Dijkstra, P.; Koch, G.W.; Penuelas, J.; Hingate, B.A. Responses of terrestrial ecosystems to temperature and precipitation change: A meta-analysis of experimental manipulation. Glob. Chang. Biol. 2011, 17, 927–942. [Google Scholar] [CrossRef]
  20. Stone, M.M.; Weiss, M.S.; Goodale, C.L.; Adams, M.B.; Fernandez, I.J.; German, D.P.; Allison, S.D. Temperature sensitivity of soil enzyme kinetics under N-fertilization in two temperate forests. Glob. Chang. Biol. 2012, 18, 1173–1184. [Google Scholar] [CrossRef]
  21. Davidson, E.A.; Janssens, I.A.; Luo, Y. On the variability of respiration in terrestrial ecosystems: Moving beyond Q10. Glob. Chang. Biol. 2006, 12, 154–164. [Google Scholar] [CrossRef]
  22. Fierer, N.; Colman, B.P.; Schimel, J.P.; Jackson, R.B. Predicting the temperature dependence of microbial respiration in soil: A continental-scale analysis. Glob. Biogeochem. Cycles 2006, 20, GB3026. [Google Scholar] [CrossRef]
  23. Paz-Ferreiro, J.; Trasar-Cepeda, C.; Leirós, M.D.C.; Seoane, S.; Gil-Sotres, F. Intra-annual variation in biochemical properties and the biochemical equilibrium of different grassland soils under contrasting management and climate. Biol. Fertil. Soils 2011, 47, 633–645. [Google Scholar] [CrossRef]
  24. Siddiqui, K.S.; Cavicchioli, R. Cold-adapted enzymes. Annu. Rev. Biochem. 2006, 75, 403–433. [Google Scholar] [CrossRef] [PubMed]
  25. Miralles, I.; Ortega, R.; Sánchez-Marañón, M.; Leirós, M.C.; Trasar-Cepeda, C.; Gil-Sotres, F. Biochemical properties of range and forest soils in Mediterranean mountain environments. Biol. Fertil. Soils 2007, 43, 721–729. [Google Scholar] [CrossRef]
  26. Cioci, C.; Corti, G.; Agnelli, A.; Cocco, S. Role of the altitude on the organic matter preservation in soils under a secondary prairie on the Majella massif (Italy). Agrochimica 2008, 52, 313–324. [Google Scholar]
  27. Margesin, R.; Minerbi, S.; Schinner, F. Long-term monitoring of soil microbiological activities in two forest sites in South Tyrol in the Italian Alps. Microbes Environ. 2014, 29, 277–285. [Google Scholar] [CrossRef] [PubMed]
  28. Xu, Z.; Yu, G.; Zhang, X.; Ge, J.; He, N.; Wang, Q.; Wang, D. The variations in soil microbial communities, enzyme activities and their relationships with soil organic matter decomposition along the northern slope of Changbai Mountain. Appl. Soil Ecol. 2015, 86, 19–29. [Google Scholar] [CrossRef]
  29. Vittori Antisari, L.; Falsone, G.; Carbone, S.; Marinari, S.; Vianello, G. Douglas-fir reforestation in North Apennine (Italy): Performance on soil carbon sequestration, nutrients stock and microbial activity. Appl. Soil Ecol. 2015, 86, 82–90. [Google Scholar] [CrossRef]
  30. Lucas, R.W.; Casper, B.B.; Jackson, J.K.; Balser, T.C. Soil microbial communities and extracellular enzyme activity in the New Jersey Pinelands. Soil Biol. Biochem. 2007, 39, 2508–2519. [Google Scholar] [CrossRef]
  31. Centro Appenninico “C. Jucci”. Temperature Massime, Minime, Medie Giornaliere, Escursioni Termiche, Precipitazioni Giornaliere e Giorni di Pioggia del Poliennio 1956–2014; Stazione meteorologica di Terminillo; Università degli Studi di Perugia: Perugia, Italy, 2015. [Google Scholar]
  32. Spina, R.; Stortini, S.; Fusari, R.; Scuterini, C.; Di Marino, M. Caratterizzazione Climatologica delle Marche: Campo Medio della Temperatura per il Periodo 1950–2000; Centro di Ecologia e Climatologia, Osservatorio Geofisico Sperimentale: Macerata, Italy, 2006. [Google Scholar]
  33. Amici, M.; Spina, R. Campo Medio della Precipitazione Annuale e Stagionale sulle Marche per il Periodo 1950–2000; Centro di Ecologia e Climatologia, Osservatorio Geofisico Sperimentale: Macerata, Italy, 2002. [Google Scholar]
  34. Pasquale, V.; Verdoya, M.; Chiozzi, P.; Bodri, L.; Bellani, S. Temperature signal in the underground for climate history reconstruction in Italy. Glob. Planet. Chang. 2005, 47, 36–50. [Google Scholar] [CrossRef]
  35. Desiato, F.; Fioravanti, G.; Fraschetti, P.; Perconti, W.; Piervitali, E. Il Clima Futuro in Italia: Analisi delle Proiezioni dei Modelli Regionali; Stato dell ‘Ambiente 58; Istituto Superiore per la Protezione e la Ricerca Ambientale (ISPRA): Roma, Italy, 2015.
  36. Schoeneberger, P.J.; Wysocki, D.A.; Benham, E.C.; Soil Survey Staff. Field Book for Describing and Sampling Soils; Version 3.0.; Natural Resources Conservation Service, National Soil Survey Center: Lincoln, NE, USA, 2012.
  37. Soil Survey Staff. Keys to Soil Taxonomy, 12th ed.; USDA–Natural Resources Conservation Service: Washington, DC, USA, 2014.
  38. Nelson, D.W.; Sommers, L.E. Total carbon, organic carbon, and organic matter. In Methods of Soil Analysis, Part 3. Chemical Methods; Sparks, D.L., Ed.; Soil Science Society of America Inc.: Madison, WI, USA, 1996. [Google Scholar]
  39. Agnelli, A.; Bol, R.; Trumbore, S.E.; Dixon, L.; Cocco, S.; Corti, G. Carbon and nitrogen in soil and vine roots in harrowed and grass-covered vineyards. Agric. Ecosyst. Environ. 2014, 193, 70–82. [Google Scholar] [CrossRef]
  40. Olsen, S.R.; Cole, C.V.; Watanabe, F.S.; Dean, L.A. Estimation of available phosphorus in soils by extraction with sodium bicarbonate. In USDA Circular; U.S. Government Printing Office: Washington, DC, USA, 1954; p. 19. [Google Scholar]
  41. Vance, E.D.; Brookes, P.C.; Jenkinson, D.S. An extraction method for measuring microbial biomass C. Soil Biol. Biochem. 1987, 19, 703–707. [Google Scholar] [CrossRef]
  42. Fornasier, F.; Margon, A. Bovine serum albumin and Triton X-100 greatly increase phosphomonoesterases and arylsulphatase extraction yield from soil. Soil Biol. Biochem. 2007, 39, 2682–2684. [Google Scholar] [CrossRef]
  43. Cowie, A.L.; Lonergan, V.E.; Fazle Rabbi, S.M.; Fornasier, F.; Macdonald, C.; Harden, S.; Kawasaki, A.; Singh, B.K. Impact of carbon farming practices on soil carbon in northern New South Wales. Soil Res. 2013, 51, 707–718. [Google Scholar] [CrossRef]
  44. Box, G.E.P.; Cox, D.R. Analysis of transformations. J. R. Stat. Soc. B (Stat. Methodol.) 1964, 26, 211–252. [Google Scholar]
  45. R Development Core Team. R: A Language and Environment for Statistical Computing; R Foundation for Statistical Computing: Vienna, Austria, 2008; Available online: http//www.cran.r-project.org (accessed on 16 May 2016).
  46. Riebe, C.S.; Kirchner, J.W.; Finkel, R.C. Sharp decrease in long-term chemical weathering rates along an altitudinal transect. Earth Planet. Sci. Lett. 2004, 218, 421–434. [Google Scholar] [CrossRef]
  47. De Feudis, M.; Cardelli, V.; Massaccesi, L.; Bol, R.; Willbold, S.; Cocco, S.; Corti, G.; Agnelli, A. Effect of beech (Fagus sylvatica L.) rhizosphere on phosphorous availability in soils at different altitudes (central Italy). Geoderma 2016, 276, 53–63. [Google Scholar] [CrossRef]
  48. Follett, R.F.; Stewart, C.E.; Pruessner, E.G.; Kimble, J.M. Effects of climate change on soil carbon and nitrogen storage in the US Great Plains. J. Soil Water Conserv. 2012, 67, 331–342. [Google Scholar] [CrossRef]
  49. Zianis, D.; Mencuccini, M. Aboveground net primary productivity of beech (Fagus moesiaca) forest: A case study of Naousa forest, northern Greece. Tree Physiol. 2005, 25, 713–722. [Google Scholar] [CrossRef] [PubMed]
  50. Pietikäinen, J.; Pettersson, M.; Bååth, E. Comparison of temperature effects on soil respiration and bacterial and fungal growth rates. FEMS Microbiol. Ecol. 2005, 52, 49–58. [Google Scholar] [CrossRef] [PubMed]
  51. Xu, M.; Li, X.; Cai, X.; Li, X.; Christie, P.; Zhang, J. Soil microbial community structure and activity along a montane elevational gradient on the Tibetan Plateau. Eur. J. Soil Biol. 2014, 64, 6–14. [Google Scholar] [CrossRef]
  52. Creamer, C.A.; De Menezes, A.B.; Krull, E.S.; Sanderman, J.; Newton-Walters, R.; Farrell, M. Microbial community structure mediates response of soil C decomposition to litter addition and warming. Soil Biol. Biochem. 2015, 80, 175–188. [Google Scholar] [CrossRef]
  53. Agnelli, A.; Celi, L.; Degl ‘Innocenti, A.; Corti, G.; Ugolini, F.C. The changes with depth of humic and fulvic acids extracted from fine earth and rock fragments of a forest soil. Soil Sci. 2002, 167, 524–538. [Google Scholar] [CrossRef]
  54. Koch, O.; Tscherko, D.; Kandeler, E. Temperature sensitivity of microbial respiration, nitrogen mineralization, and potential soil enzyme activities in organic alpine soils. Glob. Biogeochem. Cycles 2007, 21, GB4017. [Google Scholar] [CrossRef]
  55. Allison, S.D.; Wallenstein, M.D.; Bradford, M.A. Soil-carbon response to warming dependent on microbial physiology. Nat. Geosci. 2010, 3, 336–340. [Google Scholar] [CrossRef]
  56. Wallenstein, M.; Allison, S.; Ernakovich, J.; Steinweg, J.M.; Sinsabaugh, R. Controls on the temperature sensitivity of soil enzymes: A key driver of in situ enzyme activity rates. In Soil Enzymology, Soil Biology; Shukla, G., Varma, A., Eds.; Springer: Berlin, Germany, 2011; pp. 245–258. [Google Scholar]
  57. Lemanowicz, J.; Krzyzaniak, M. Vertical distribution of phosphorus concentrations, phosphatase activity and further soil chemical properties in salt-affected Mollic Gleysols in Poland. Environ. Earth Sci. 2015, 74, 2719–2728. [Google Scholar] [CrossRef]
  58. Stutter, M.I.; Shand, C.A.; George, T.S.; Blackwell, M.S.A.; Dixon, L.; Bol, R.; MacKay, R.L.; Richardson, A.E.; Condron, L.M.; Haygarth, P.M. Land use and soil factors affecting accumulation of phosphorus species in temperate soils. Geoderma 2015, 257–258, 29–39. [Google Scholar] [CrossRef]
  59. Nannipieri, P.; Giagnoni, L.; Landi, L.; Renella, G. Role of phosphatase enzymes in soil. In Phosphorus in Action; Bunemann, E.K., Obreson, A., Frossard, E., Eds.; Springer: Berlin, Germany, 2011; pp. 215–243. [Google Scholar]
  60. Rejsek, K.; Vranova, V.; Pavelka, M.; Formanek, P. Acid phosphomonoesterase (E.C. 3.1.3.2) location in soil. J. Plant Nutr. Soil Sci. 2012, 175, 196–211. [Google Scholar] [CrossRef]
  61. Brzostek, E.R.; Greco, A.; Drake, J.E.; Finzi, A.C. Root carbon inputs to the rhizosphere stimulate extracellular enzyme activity and increase nitrogen availability in temperate forest soils. Biogeochemistry 2013, 115, 65–76. [Google Scholar] [CrossRef]
  62. Gunina, A.; Kuzyakov, Y. Sugars in soil and sweets for microorganisms: Review of origin, content, composition and fate. Soil Biol. Biochem. 2015, 90, 87–100. [Google Scholar] [CrossRef]
  63. De Feudis, M.; Cardelli, V.; Massaccesi, L.; Hofmann, D.; Berns, A.E.; Bol, R.; Cocco, S.; Corti, G.; Agnelli, A. Altitude affects the quality of the water-extractable organic matter (WEOM) from rhizosphere and bulk soil in European beech forests. Geoderma 2017, 302, 6–13. [Google Scholar] [CrossRef]
Figure 1. Map of Italy indicating the study sites in central Apennines, Italy.
Forests 08 00213 g001
Figure 2. Non-metric multidimensional scaling (NMDS) plots showing the similarity/dissimilarity among (a) organic; and (b) mineral horizons between the soils under Fagus sylvatica forests at the two altitudes of 800 m and 1000 m in central Apennines, Italy. The drawn ellipses are at 95% confidence. (Legend: TOC: total organic carbon; TN: total nitrogen; WEOC: water extractable organic carbon; available P: available phosphorus; Cmic: microbial biomass carbon; CO2-C: CO2 evolved during basal respiration experiments; Cell: cellulase; Xylo: xylosidase; Gluco: β-glucosidase; Chit: chitinase; AcPME: acid phosphomonoesterase; AlkPME: alkaline phosphomonoesterase, AcEst: acetate esterase; ArylS: arylsulfatase; Leu: leucine aminopeptidase).
Forests 08 00213 g002
Figure 3. WEOC/TOC ratio of the different horizons along the soils under Fagus sylvatica forests at two altitudes, 800 m and 1000 m above sea level (a.s.l.), central Apennines, Italy. Error bars are the standard errors (n = 3).
Forests 08 00213 g003
Table 1. pH values and contents of total organic carbon (TOC), total nitrogen (TN), water extractable organic carbon (WEOC) and available P of the soils under Fagus sylvatica forests at two altitudes (low: 800 m; high: 1000 m), Central Apennines, Italy. Numbers in parentheses are the standard errors (n = 3). For each parameter, mean values with different letters significantly differ for p < 0.05.
HorizonspHTOCTNWEOCAvailable P
LowHighLowHighLowHighLowHighLowHigh
g kg−1mg kg−1
OLn6.28 (0.11) de6.08 (0.05) e468.42 (28.56) ab540.55 (11.48) a12.51 (0.94) b16.13 (1.20) ab0.19 (0.07) ac0.09 (0.04) cndnd
OLv6.33 (0.10) ce6.68 (0.13) bc462.19 (27.70) ab527.29 (15.51) a14.64 (0.74) ab17.14 (0.64) a0.25 (0.03) ab0.16 (0.06) bcndnd
OH7.02 (0.21) ac6.78 (0.30) ad387.70 (42.93) b424.90 (16.04) b16.52 (2.01) ab18.61 (1.89) a0.30 (0.14) ab0.29 (0.10) abndnd
A6.94 (0.30) be7.33 (0.22) ab71.36 (6.57) d95.79 (15.24) c3.47 (0.53) d8.22 (1.00) c0.33 (0.02) ab0.32 (0.05) a17.7 (1.9) ab20.2 (1.0) a
AB6.77 (0.48) be7.72 (0.15) a40.26 (5.83) e62.27 (8.90) d2.86 (0.63) e5.44 (0.77) d0.30 (0.03) ab0.23 (0.03) ab11.0 (2.1) cd15.8 (1.0) b
Bw16.27 (0.33) de7.50 (0.12) ab22.41 (4.11) f62.38 (3.20) d1.14 (0.08) f5.61 (0.37) cd0.31 (0.06) ab0.19 (0.03) ac8.0 (1.8) d15.0 (1.4) bc
Bw26.63 (0.45) be7.75 (0.02) a12.64 (1.19) g52.79 (2.55) de1.04 (0.11) f5.43 (2.28) d0.20 (0.02) ac0.18 (0.01) ac7.5 (1.6) d12.7 (0.3) bc
nd = not determined.
Table 2. Content of microbial biomass C (Cmic), and amount of CO2 evolved during basal respiration experiments (ΣCO2–C) of the soils under Fagus sylvatica forests at two altitudes (low: 800 m; high: 1000 m). Central Apennines, Italy. Numbers in parentheses are the standard errors (n = 3). For each parameter, mean values with different letters significantly differ for p < 0.05.
HorizonsCmicΣCO2–C
LowHighLowHigh
mg kg−1
OLn169.00 (46.80) ab302.37 (17.98) a18,539 (3843) ab20,088 (1993) a
OLv189.60 (47.76) a108.41 (23.25) ab14,082 (2731) bc12,967 (1772) cd
OH56.99 (33.19) b186.51 (27.08) ab8128 (2023) de7073 (1869) e
A0.07 (0.01) cd0.19 (0.02) c1984 (561) f697 (67) f
AB0.07 (0.02) de0.19 (0.02) c768 (276) f421 (84) f
Bw10.03 (0.01) ef0.19 (0.01) c308 (117) f584 (323) f
Bw20.02 (0.01) f0.12 (0.06) cd265 (93) f480 (57) f
Table 3. Soil enzymatic activities of the soils under Fagus sylvatica forests at two altitudes (low: 800 m; high: 1000 m). Central Apennines, Italy. Numbers in parentheses are the standard deviations (n = 3). For each parameter, mean values with different letters significantly differ for p < 0.05.
HorizonsCellXyloβ-GlucoChitAcPMEAlkPMEAcEstArylSLeu
Nanomoles of 4-methylumbelliferone (7-amino-4-methyl coumarine) • g−1 dry soil • hour−1
Low Altitude (800 m)
OLn71.3 (25.1) a54.5 (11.6) a509.1 (142.4) a196.8 (25.6) a408.1 (116.8) a294.5 (49.7) b3278.8 (258.0) ab6.5 (1.8) d335.4 (54.8) a
OLv38.3 (11.7) b35.2 (5.2) ab215.8 (82.2) b134.5 (15.4) ab291.1 (43.1) ac318.9 (64.5) b3421.3 (239.8) ab8.7 (2.4) cd357.0 (511.9) a
OH4.4 (1.5) d6.8 (2.2) c34.1 (15.2) c38.6 (5.1) d129.1 (21.3) de362.9 (62.6) ab1807.3 (548.0) cd19.4 (8.9) b110.0 (29.0) b
A0.2 (0.1) ef1.2 (0.2) d5.1 (0.6) d5.6 (1.7) e105.4 (11.1) df143.7 (17.7) cd1810.9 (358.0) c67.5 (5.6) a25.6 (2.3) d
AB0.1 (0.0) f0.6 (0.1) e2.3 (0.2) e3.4 (1.6) ef72.0 (15.4) eg66.4 (41.7) d1074.1 (345.5) df86.84 (31.4) a14.1 (2.8) d
Bw10.0 (0.0) f0.4 (0.1) ef0.8 (0.2) fg1.0 (0.2) fg47.8 (11.8) gh11.3 (6.1) e777.6 (197.3) f56.4 (18.0) a5.7 (0.7) e
Bw20.0 (0.0) f0.2 (0.0) f0.5 (0.2) g0.7 (0.2) g32.3 (9.9) h20.4 (10.6) e578.8 (195.6) f26.0 (5.2) b4.3 (1.3) e
High Altitude (1000 m)
OLn96.6 (23. 6) a63.7 (6.8) a581.7 (106.3) a202.8 (32.0) a338.3 (16.2) ab456.0 (70.0) a4143.1 (301.6) a7.3 (1.8) cd364.6 (60.5) a
OLv15.8 (4.7) c20.5 (3.5) b118.0 (32.2) b92.6 (21.28) bc236.9 (42.5) bc408.6 (48.6) ab2741.4 (354.7) b13.7 (3.3) bc280.4 (95.2) a
OH0.8 (1.0) e3.8 (2.1) c17.2 (8.6) c50.7 (15.4) cd175.1 (28.8) cd278.5 (35.5) b1372.8 (212.3) ce25.8 (9.1) b73.7 (10.1) bc
A0.0 (0.0) f0.5 (0.2) e3.3 (0.6) de2.5 (0.9) ef70.3 (10.5) fg165.3 (20.4) bc1000.2 (232.3) ef62.7 (4.0) a19.2 (5.2) d
AB0.0 (0.0) f0.3 (0.2) ef2.0 (0.6) ef2.4 (1.1) f46.7 (9.6) gh115.3 (7.8) c660.5 (173.4) f62.0 (11.5) a17.5 (7.5) d
Bw10.1 (0.0) ef0.8 (0.4) de3.1 (0.8) de3.4 (3.1) ef57.6 (10.5) fh104.5 (29.3) cd935.5 (422.0) ef77.4 (20.5) a30.7 (18.7) cd
Bw20.1 (0.1) ef0.7 (0.6) de2.1 (1.2) ef2.3 (2.2) fg42.9 (21.6) gh82.8 (30.0) cd731.9 (552.0) f82.4 (19.6) a21.7 (17.5) d
Cell = cellulase; Xylo = xylosidase; β-Gluco = β-glucosidase; Chit = chitinase; AcPME = acid phosphomonoesterase; AlkPME = alkaline phosphomonoesterase; AcEst = acetate esterase; AryS = arylsulfatase; Leu = leucine aminopeptidase.

