1. Introduction
Water availability is a key driver of biogeochemical processes in all terrestrial ecosystems, especially in arid and semi-arid ones, which are very sensitive to climatic variation [
1]. In these ecosystems, both carbon assimilation (photosynthesis) and soil CO
2 efflux (i.e., soil respiration, SR) are driven by the seasonal changes in the precipitation regime [
2,
3,
4,
5]. It is supposed that the impact of water limitation can be longer lasting on assimilation than on soil CO
2 efflux [
6], due to the likely different capacity of leaves (and consequently canopy) to reverse to pre-drought conditions compared to microorganisms’ ability [
7,
8,
9]. However, as soil respiration represents one of the largest fluxes of CO
2 [
10], it is essential to determine how water availability directly and indirectly affects carbon release from the perspective of climate change.
Soil CO
2 efflux (SR) results from the respiratory activity of the autotrophic and heterotrophic components of the pedosphere, deriving from both plant (root respiration) and microorganisms (microbial respiration; [
11]). The contribution of microbial respiration in different ecosystems can account for 10–90% [
12,
13] of the total CO
2 efflux, depending on biotic (plant community, phenological stage, relative contribution of coarse and fine roots, microbial biomass and community; [
14,
15,
16]) and abiotic factors (climatic drivers, soil conditions, such as pH and soil structure, topography, sampling period, management type; [
17,
18,
19]).
Several studies show that the microbial community structure and activity can vary according to plant activity [
20], as long as there are labile soil carbon inputs and available substrates [
21,
22]. In fact, plants sustain soil CO
2 efflux by “pumping” fresh carbon assimilated via photosynthesis to roots, therefore feeding roots and the microorganisms inhabiting the narrow region of soil that is directly influenced by root secretions (plant assimilates and rhizodepositions), the so-called rhizosphere [
23,
24,
25]. Thus, the contribution of this root-derived CO
2 is strongly dependent on plant activity, decreasing during plant dormant periods or under stress conditions and increasing during the non-moisture limited growing period.
Microbial activity is strongly controlled by temperature but other constraints can modify the temperature response, by altering the microbial structure and function [
26].
Especially when water availability is the most limiting environmental factor, due to a combination of high temperatures and low rainfall, the physiological performance of soil fauna can be directly and indirectly reduced, subjecting the microbial community to strong adaptive adjustments [
27].
Microbial communities and functionality show elevated plasticity in terms of composition, diversity and physiological modifications. According to Allison and Martiny [
28], microbial communities can be resistant to environmental changes, remaining unaltered, but they can also exhibit resilience and quickly return to their original state after a disturbance; further, there are cases showing redundancy, consisting in microbial composition changes but unaffected functionality.
These observations become particularly evident under drought conditions, when bacterial community assortments show higher diversity compared to wet conditions, highlighting the role of rainfall regime in determining soil microbial properties [
29,
30]. According to frequency and intensity of drought events, microbial structure may be selected towards groups that are more tolerant to desiccation. Moreover, different drought patterns may result in different community assemblages of functional groups, able to differently respond to moisture stress [
31], and to regulate heterotrophic respiration [
32,
33,
34,
35]. This microbial behaviour appears particularly striking in a Mediterranean climate, where the intense seasonality of soil water availability and temperature, in the long run, may have selected microbial communities able to tolerate this strong seasonal shift [
36].
In order to determine how the response of SR to drought can be modulated by plant activity and soil microbial characteristics, we analysed the seasonal change of: (1) plant performances (assimilation, stomatal conductance) and water status (pre-dawn water potential); (2) soil CO2 efflux and its components; and (3) substrate availability (soil carbon pools, water-extractable organic carbon); (4) microbial activity (by induced respiration) and composition (by ester-linked fatty acid methyl ester-EL-FAME), analysing relationship between leaf gas exchange, soil carbon pools and soil respiration sources and the role of soil carbon pools on microbial populations and soil respiration. We monitored two different sites: a summer deciduous Mediterranean and a winter deciduous temperate shrubland experiencing a dry summer period.
2. Materials and Methods
2.1. Study Site
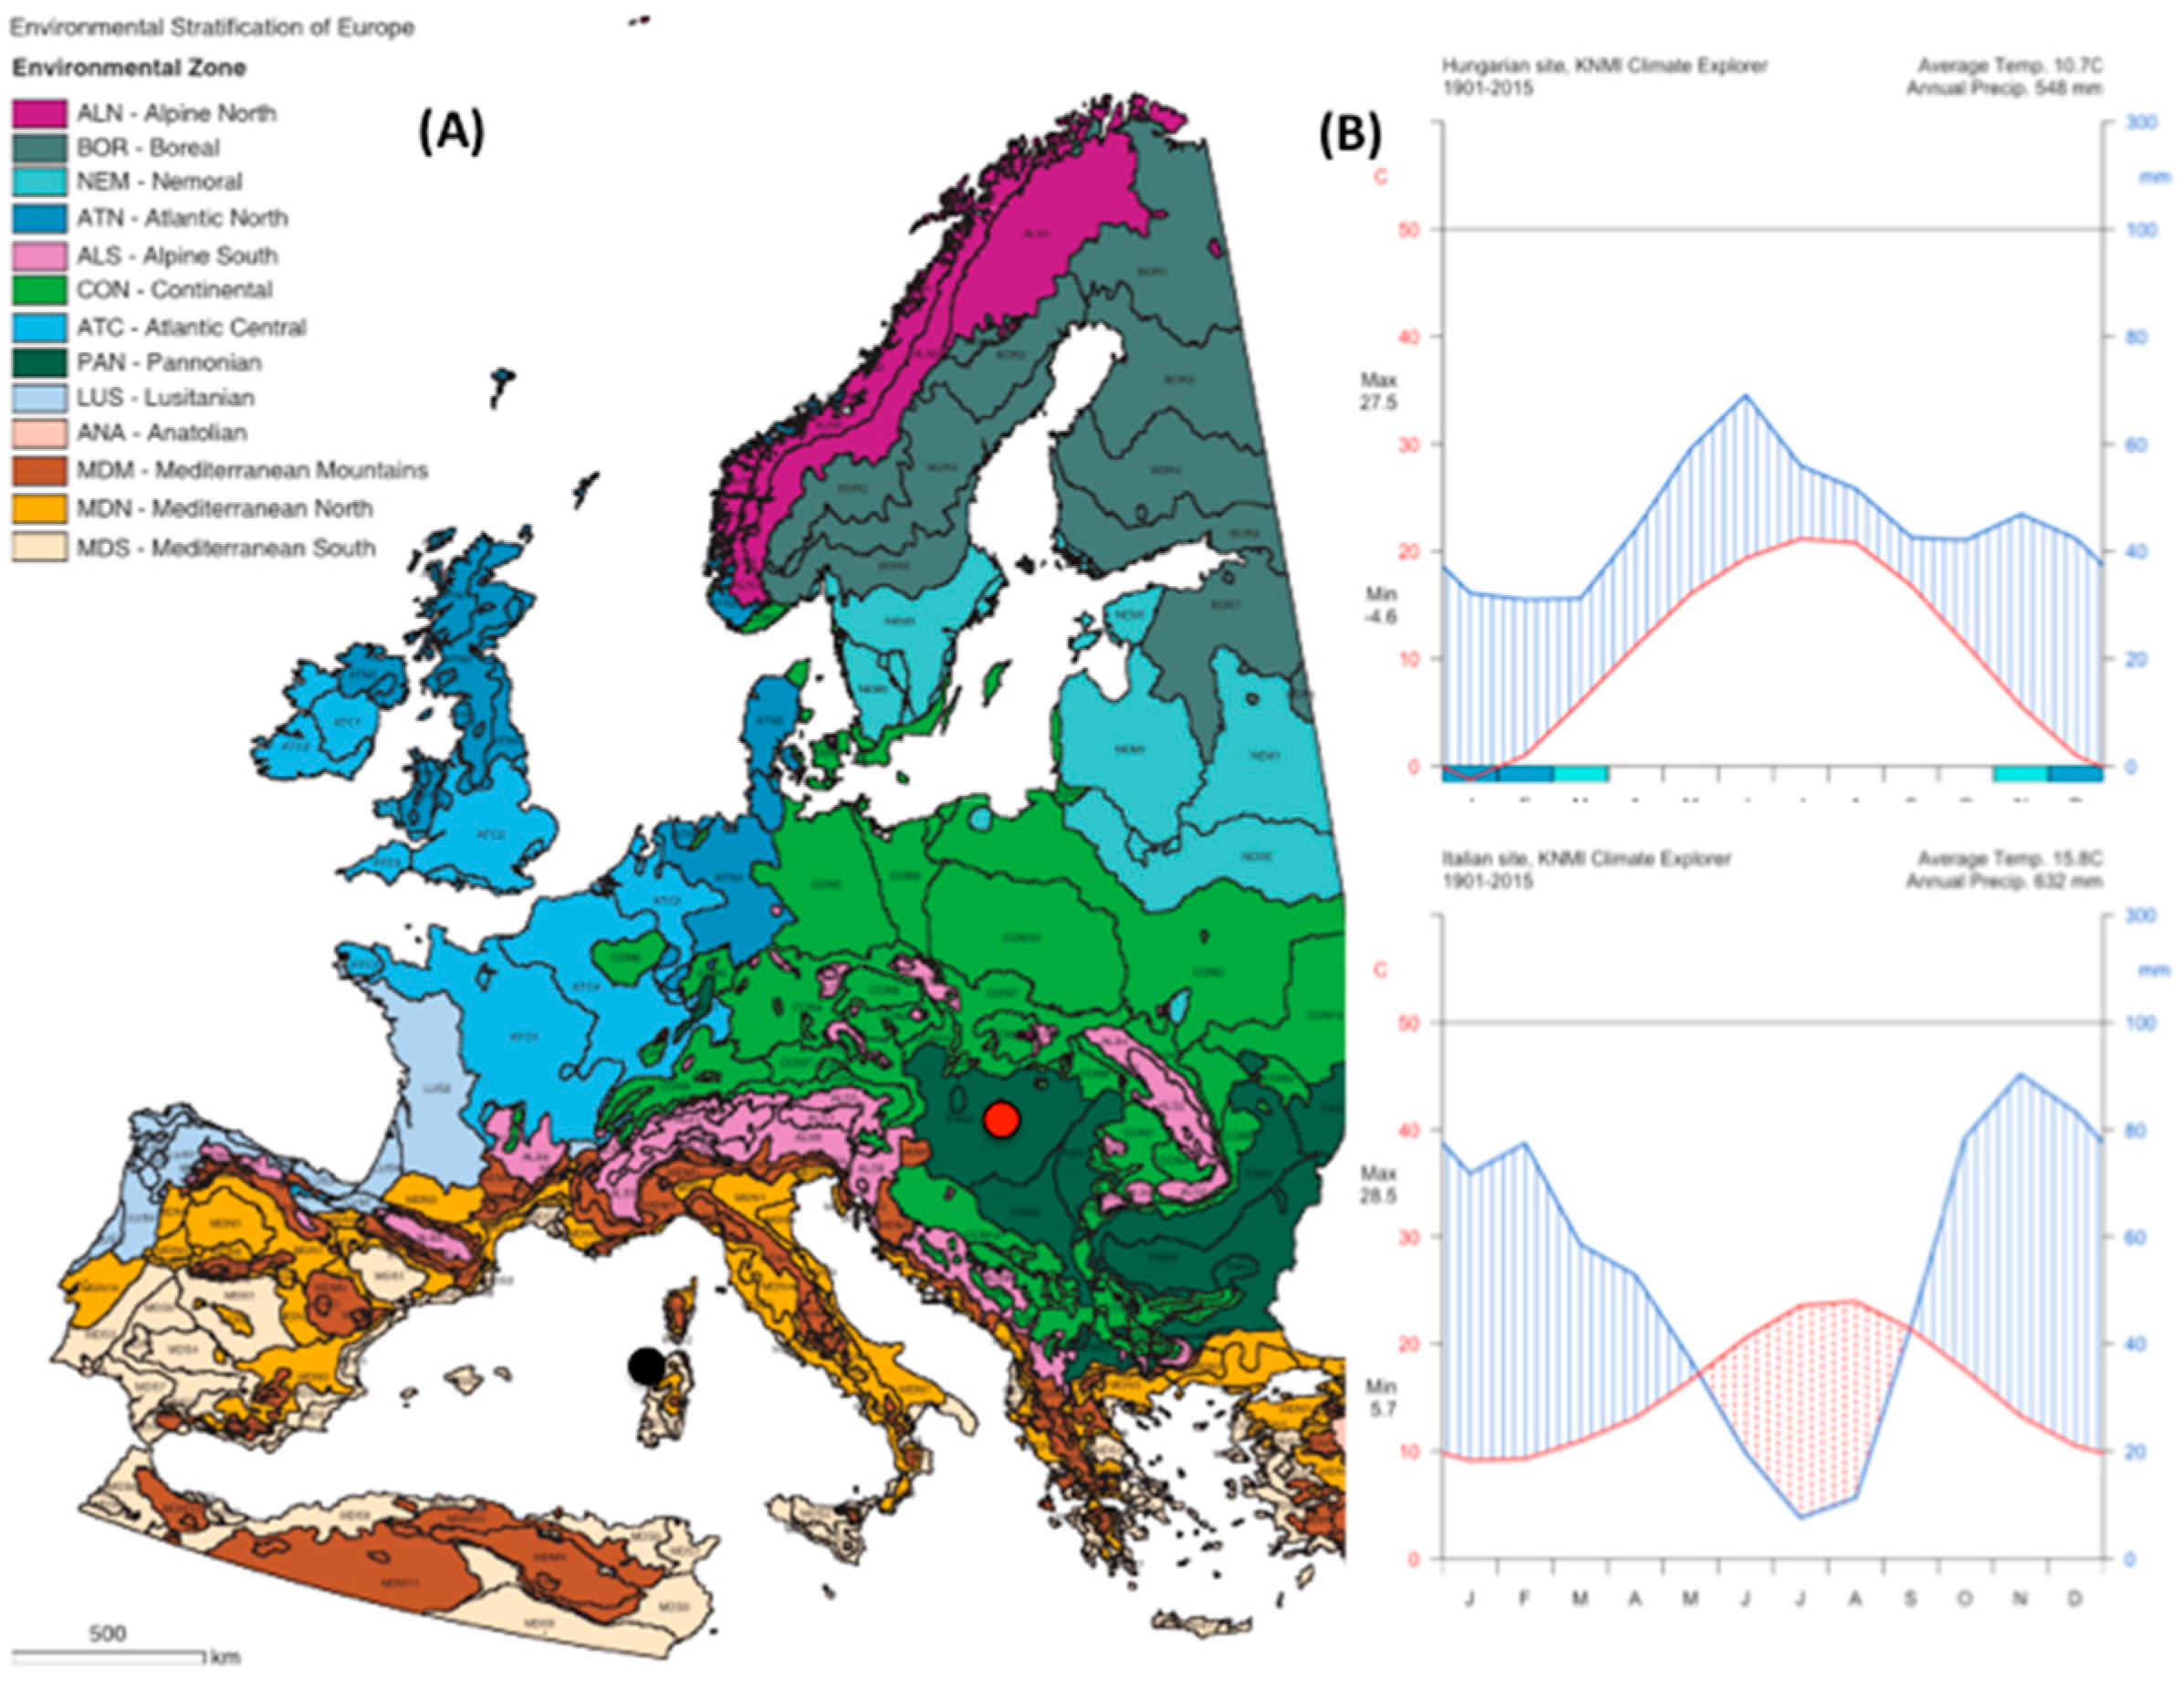
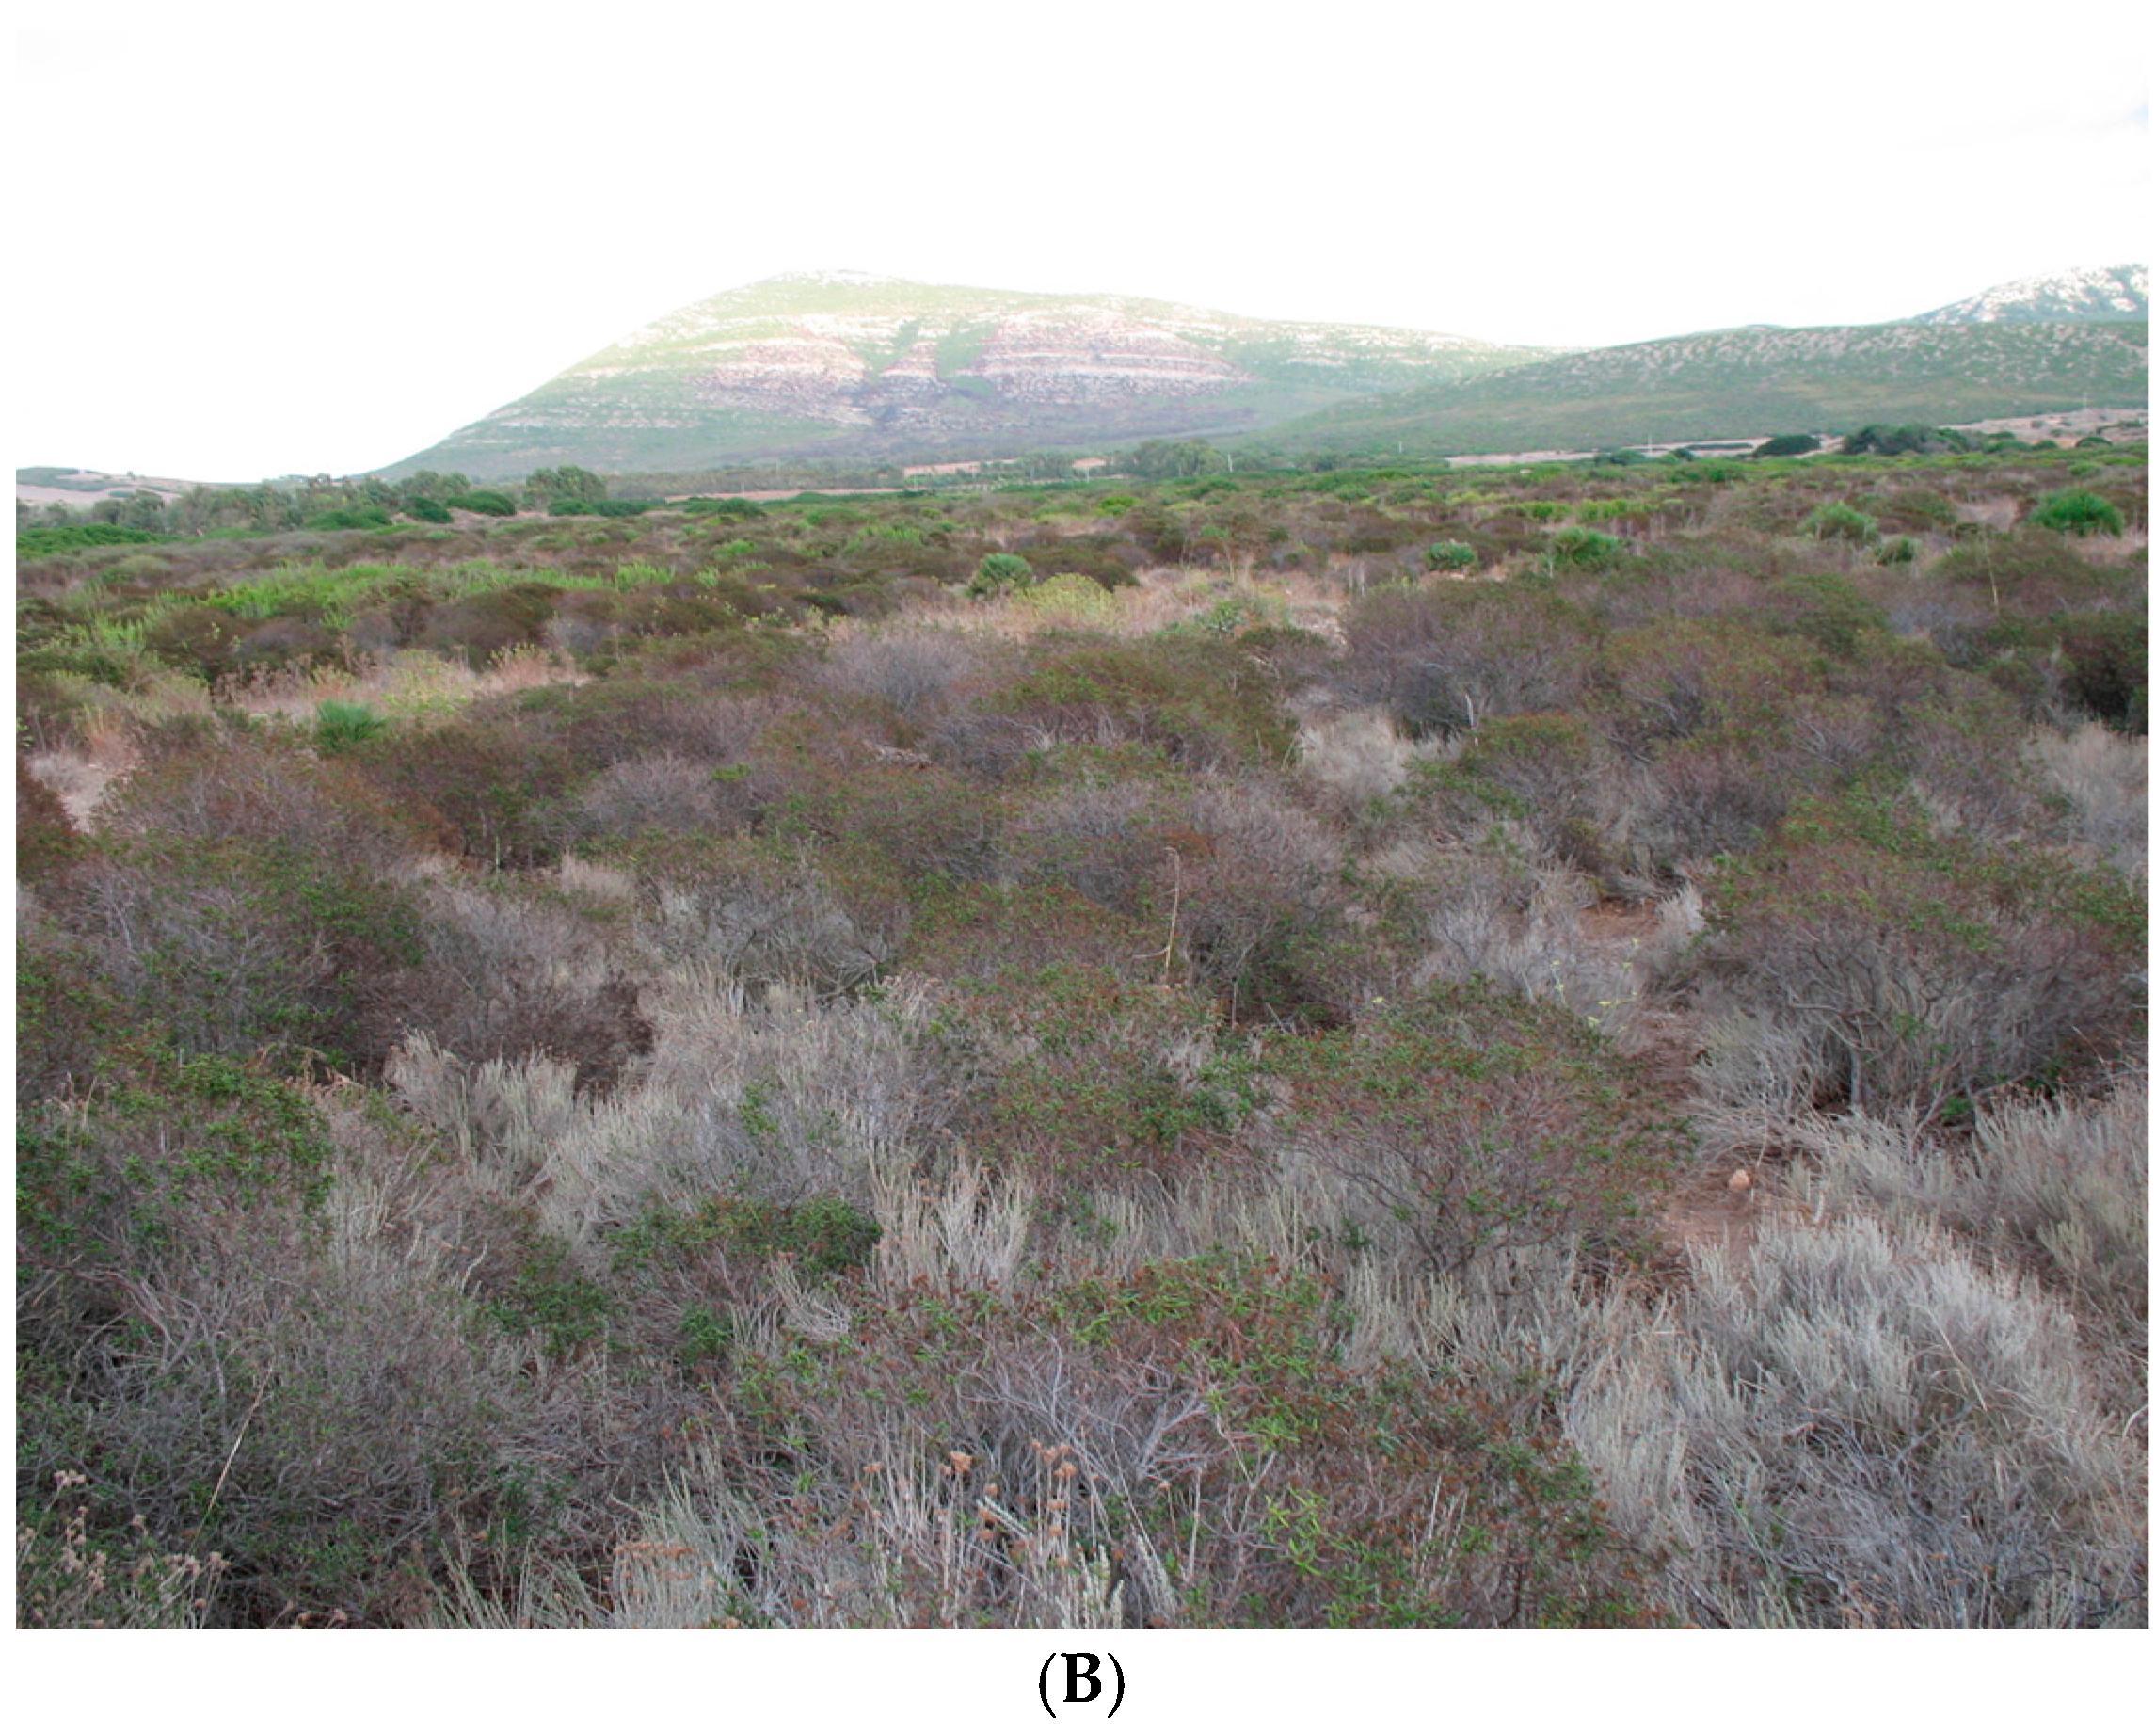
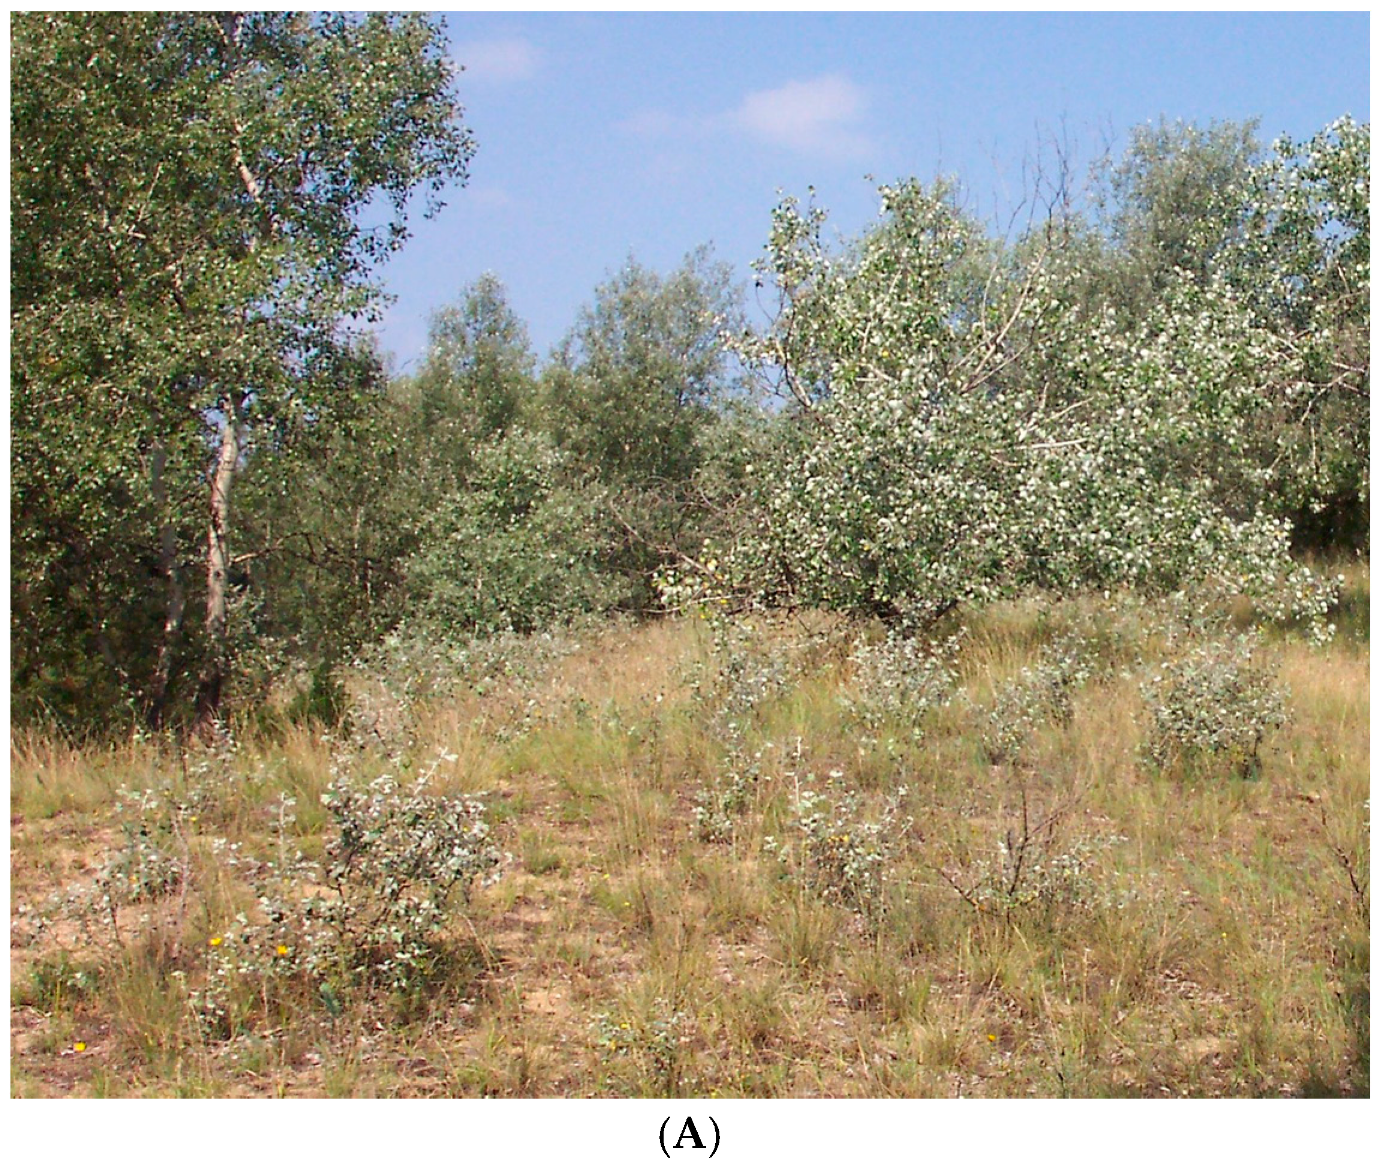
The Italian site (
Table 1;
Figure A1 and
Figure A2) is located in the Regional Park Porto Conte-Capo Caccia in northwest Sardinia, Italy. The climate of the area is Dry Thermo-Mediterranean [
37] with the dry period extending from May to September. The soil is rocky and shallow; the texture is sandy loam, with an ABC profile. Vegetation cover is a typical Mediterranean shrubland made up of plants with 1 m maximum height, constituted of
Cistus monspeliensis L.,
Helichrysum italicum G. Don. and
Dorycnium pentaphyllum L. As with many summer semi-deciduous plants,
Cistus is characterised by a drought-avoiding phenology, with summer leaf shedding. Hereafter, this site will be referred to as summer deciduous shrubland (SDS).
The Hungarian site (
Table 1;
Figure A1 and
Figure A2) is located in the Kiskunság National Park. The climate is Pannonian—a temperate climate with continental and sub-Mediterranean influence [
38], with cold winters and warm, dry summers. Peak precipitation usually occurs in June, often followed by a midsummer drought. Soil of the Kiskunság region is Pleistocene sand from the River Danube. The coarse sandy soil, very poor in organic matter (<1%), is mainly in the upper 0–10 cm horizon and has an extreme heat and water regime. The vegetation is characterized by the presence of a forest–steppe transitional biome. The dominant species are the winter deciduous clonal
Populus alba L. and the perennial C
3 bunchgrass
Festuca vaginata W. et K. In the warm and dry summers the activity of C
3 grasses decreases, while the activity of poplar clones is continuous during the vegetation period. Hereafter, this site will be referred to as winter deciduous shrubland (WDS).
We sampled at three occasions during 2010, under different conditions of water availability, soil temperature and plant phenological status: in Italy, the three campaigns were in March, August and October; in the Hungarian site the campaigns were in May, July and November. The different timings will be named Spring, Summer and Autumn in the following text. These campaigns were chosen in order to find comparable climatic conditions but different phenological stages (
Table 2).
All the measurements described below were taken, during the different campaigns, on the same ten dominant individuals of C. monspeliensis in SDS and P. alba in WDS and on the soil around the canopy of these plants.
2.2. Leaf Gas Exchange and Pre-Dawn Water Potential
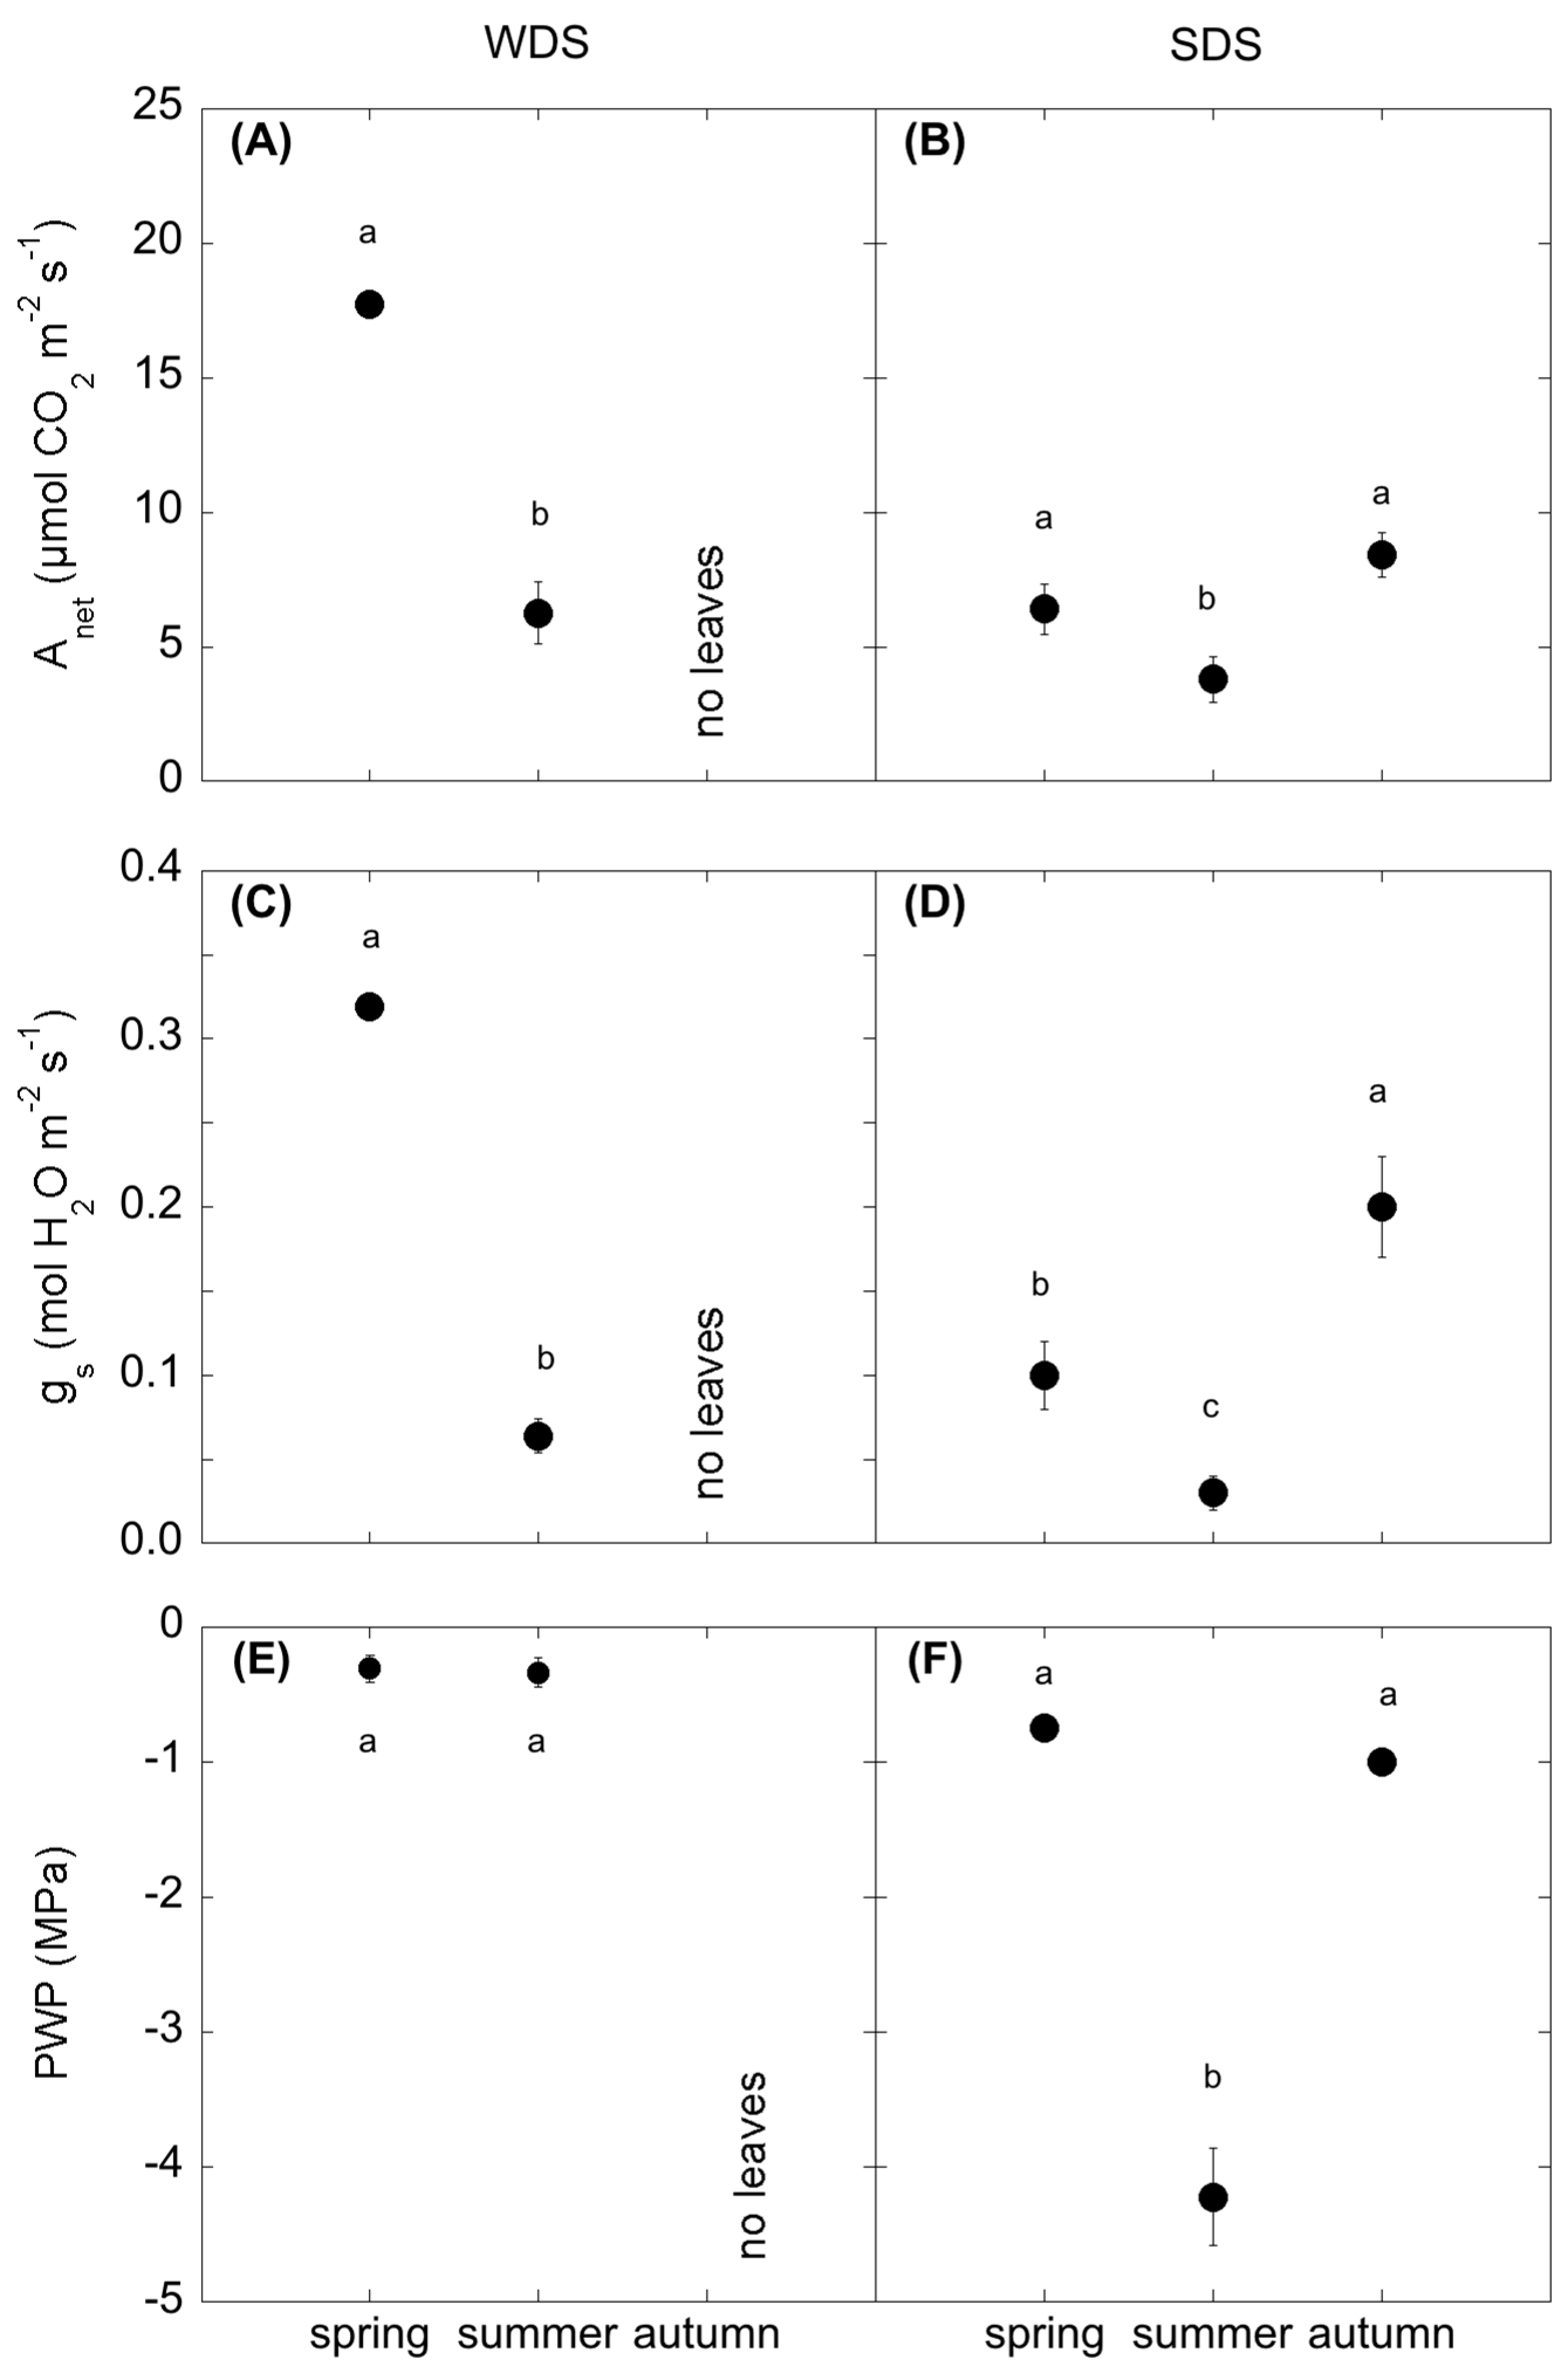
Plant activity and water status were determined by measuring photosynthesis (Anet), stomatal conductance (gs) and pre-dawn leaf water potential (PWP).
Due to differences in leaf shape of the two analysed species, A
net was measured by Li-6400 (Licor Biosciences, Inc., Lincoln, NE, USA), equipped with 6400-02B LED light source during the Hungarian campaigns, and with the 6400-22L Package (which combines the 6400-22 Opaque Conifer Chamber and the 6400-18 RGB Light Source) during the Italian ones. Photosynthesis was measured on attached leaves of 10 dominant plants at midday. The cuvette was conditioned according to the season by setting the internal values of the photon flux density (PAR), the relative humidity and the air temperature equal to the external values (
Table A1), while [CO
2] was always set to 400 ppm. Leaf area clipped during the Hungarian campaigns was equal to the chamber area (6 cm
2), being the cuvette totally filled in with the poplar leaves; in the Italian site,
Cistus shoots were cut after each measurement and leaves were scanned.
At each sampling date, pre-dawn leaf water potential was measured by the pressure bomb SKPM 1400 (Skye Instruments Ltd, Llandrindod Wells, UK) on C. monspeliensis shoots in SDS, because of the lack of an evident petioles, while in WDS it was measured on poplar leaves. The measurements were done on one sample per plant. The shoots were cut and put in plastic bags in an insulated box and measured within some minutes.
2.3. Soil CO2 Efflux
Soil CO2 efflux (SR) was measured on fixed PVC collars (one collar next to each of the 10 dominant individuals, inserted into the soil for 5 cm at a distance from the plant base of 30–50 cm under the projection of the plant canopy) by Licor 8100 (Licor Biosciences, Inc., Lincoln, NE, USA) equipped with the 8100–102 (10 cm) chamber. The collars were installed a couple of days prior the start of each measurement campaign and kept free of vegetation.
The Soil Temperature Probe Type E (Licor Biosciences, Inc., Lincoln, NE, USA) was used to measure soil temperature (Ts) at each sampling point. Soil water content at the time of measurements was determined on a soil sub-sample deriving from the soil cores collected inside each collar and used for the determination of the heterotrophic component of SR (SRh, see below) in the laboratory. These sub-samples were dried in an oven at 110 °C until they reached constant weight.
2.4. Soil Heterotrophic Respiration, Heterotrophic Basal Respiration and Temperature Sensitivity
After SR measurements, one soil core (mineral layer 0–5 cm) inside each collar was collected. The cores were sampled by an undisturbed soil corer (07.53.SC, Eijkelkamp Soil & Water, Giesbeek, The Netherlands), having an area of 19.63 cm
2 (ø 5 cm) and height of 5 cm. After sampling, cores were stored at 5 °C for 2–3 days until performing the incubation in the laboratory, in order to exclude from the measurement the contribution of the autotrophic component of CO
2 efflux and to minimize the decomposition of dead roots [
39].
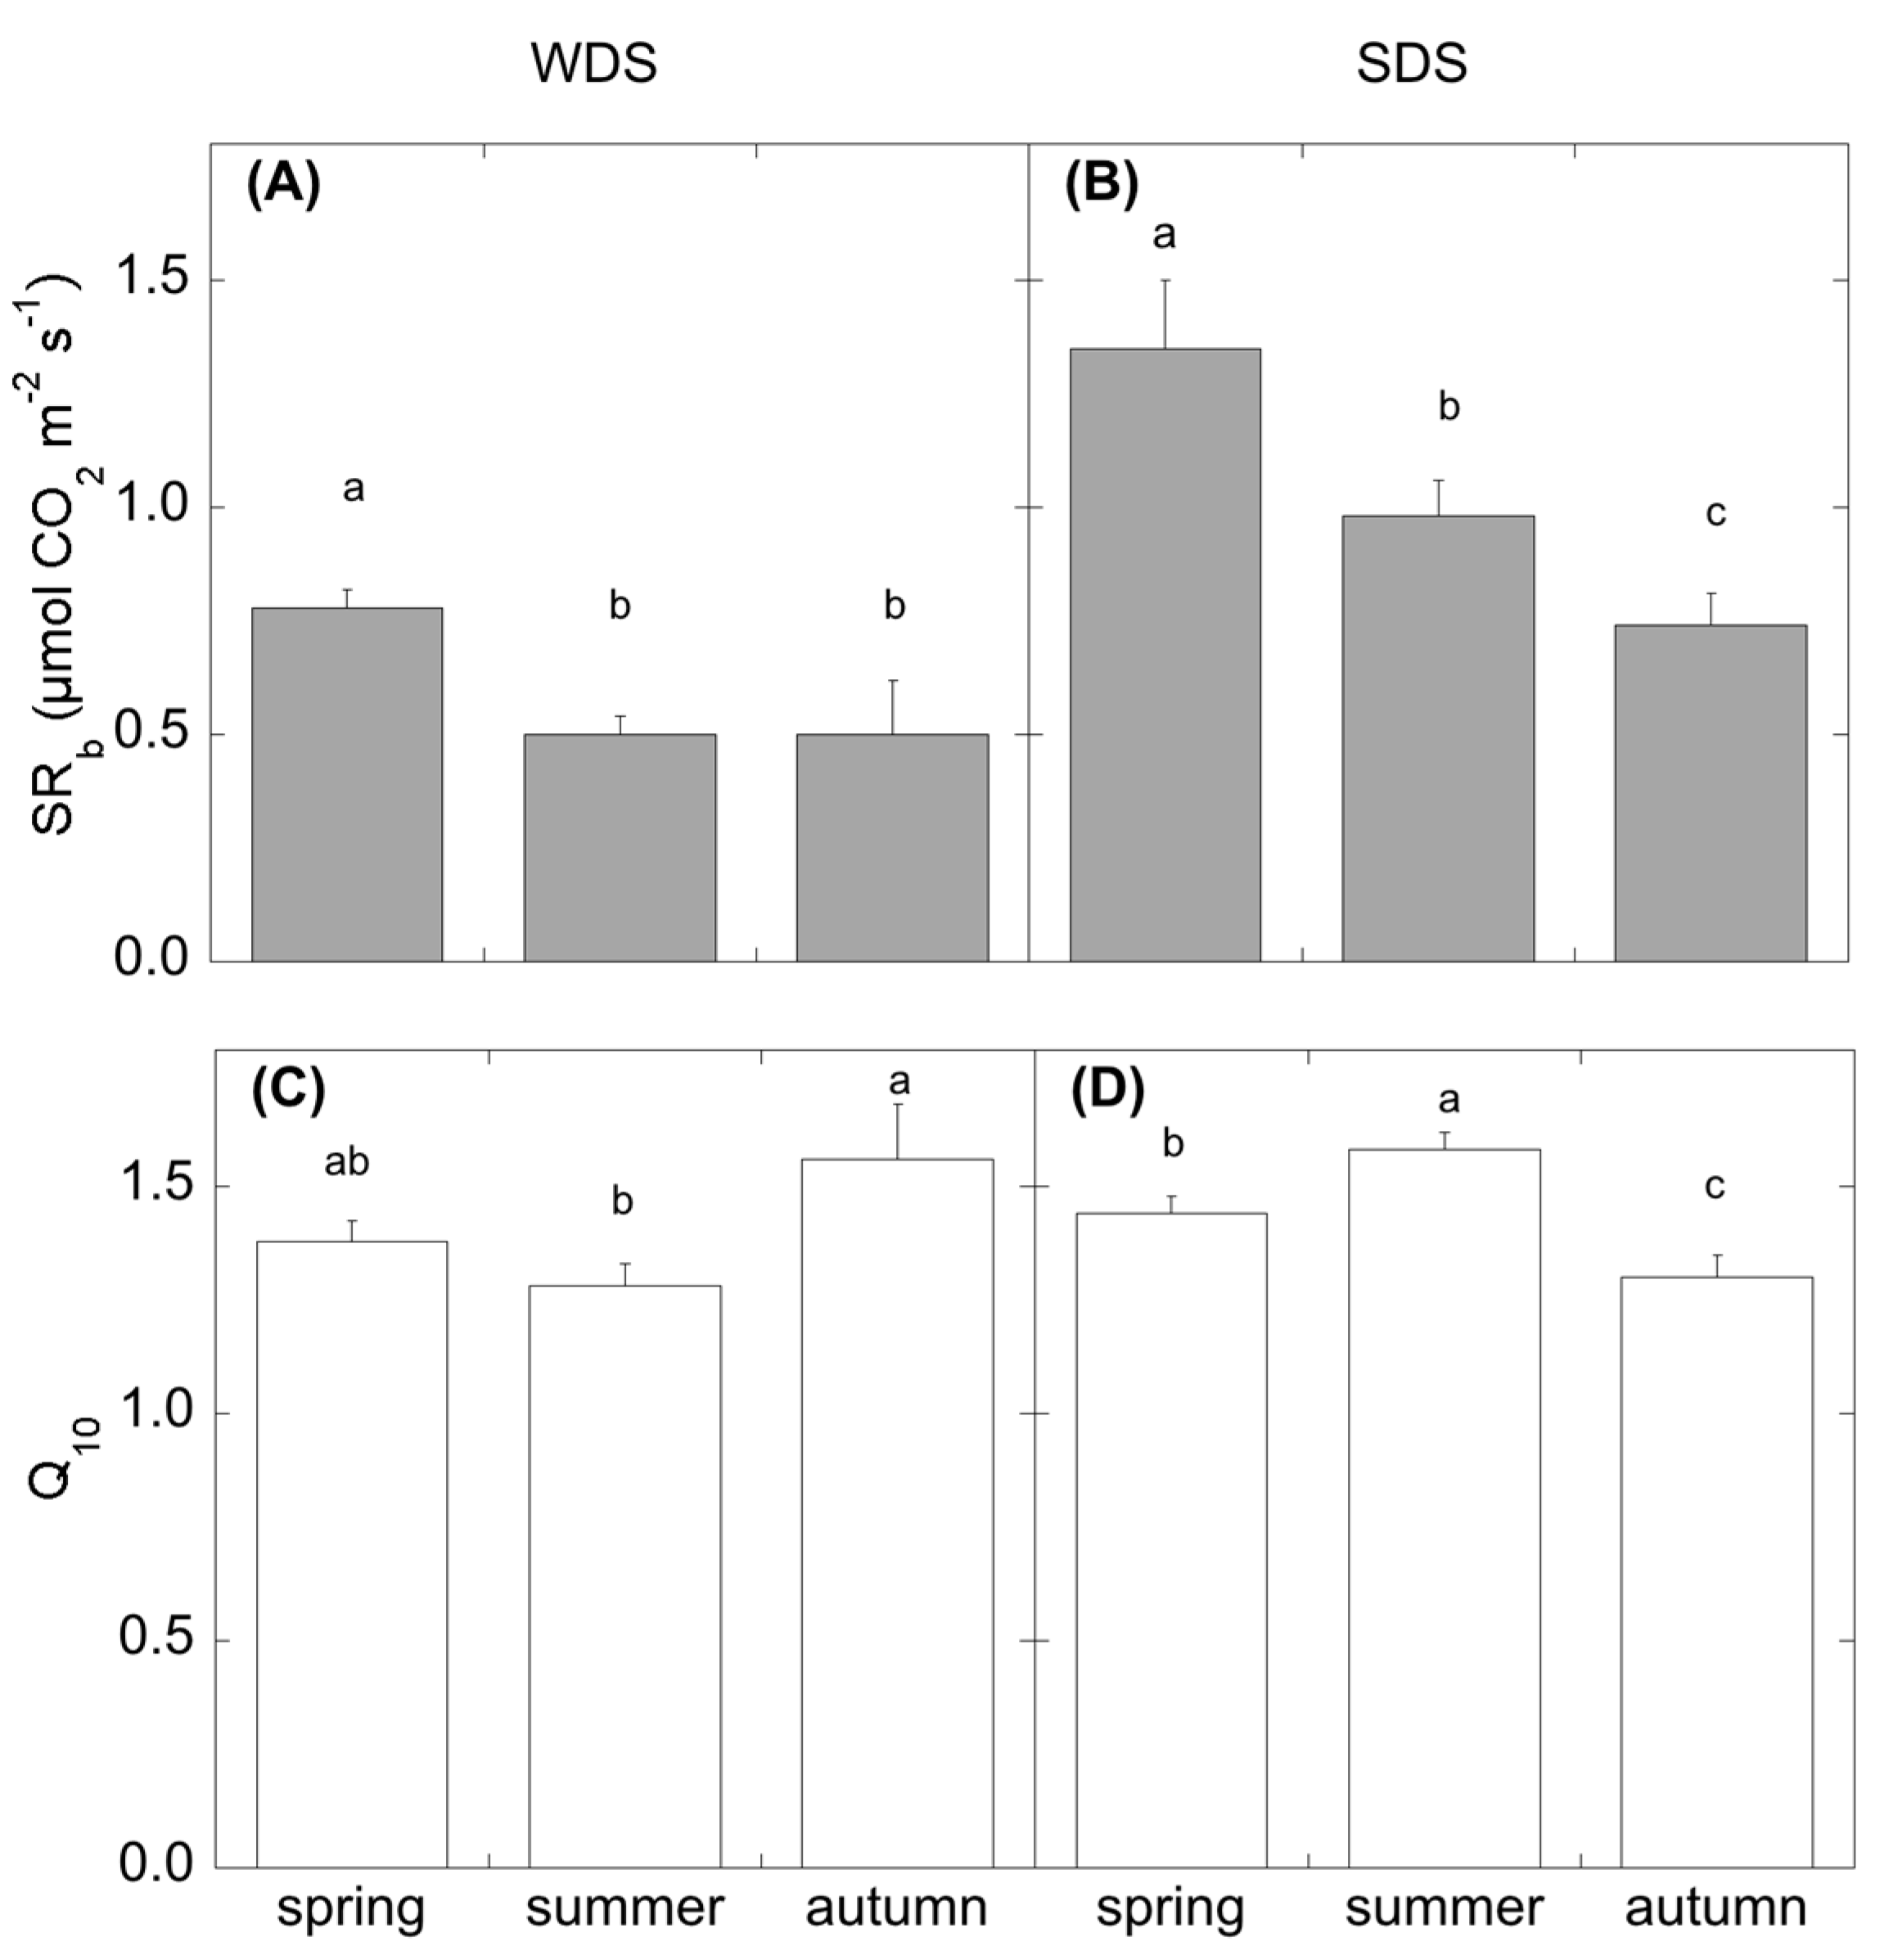
The incubation was performed by a water bath (Haake, type Q with F3 digital controller) equipped with a tank. Soil cylinders were inserted into plastic glasses (ø 6 cm), which were attached to the bottom part of the tank lid and dipped into the water flowing in the tank. Attached on the top of the lid, concentric to the holes for soil cylinders, plastic rings (ø 10 cm) were placed, in order to fit the Licor 8100–102 chamber connected to a Licor 8100 (Licor Biosciences, Inc., Lincoln, NE, USA), used for CO2 efflux measurements. Soil temperature was monitored by thermocouples (Tecno.el, s.r.l., Formello, Roma, Italy) connected to a datalogger (CR10X, Campbell Scientific, Inc., Logan, UT, USA). After the soil had reached the desired temperature (Ts of 5-10-15-18-20-25-30 °C, and midday field soil temperature, therefore varying with the seasons and defined as actual soil temperature), we started CO2 efflux measurements in 20–30 min. CO2 efflux measurement at field temperature was used to determine the heterotrophic respiration (SRh). Heterotrophic respirations at the different temperature steps were fitted by the exponential equation SRh = a*exp(k*Ts) (Equation (1)), where SRh is the heterotrophic soil CO2 efflux, a and k are estimated parameters, and Ts is the soil temperature. From these curve, we derived the heterotrophic basal respiration SRb = a for Ts = 0 °C, and the temperature coefficient of the heterotrophic respiration Q10 = exp(10*k).
2.5. Soil C Pools
Total soil Organic (TOC) and total N (TN) were determined at the beginning of the campaigns (in spring) in the bulk (non-fractionated) soil and in particle and aggregate-size fractions. Between 20 and 40 mg oven-dried material of each unit was weighed into AGram−foil capsules. The method was based on dry combustion using an elemental analyser (FlashEA 1112, Thermo Fisher Scientific Inc., Waltham, MA, USA).
Water-extractable organic carbon (WEOC) was determined after extraction of 15 g of soil in 30 mL of deionised cold water. Total C in the aqueous extracts was measured by dry combustion on a C and N soil analyser Flash 2000 Series (Thermo Fisher Scientific Inc.).
2.6. Community Level Physiological Profiles (CLPP) Based on Substrate-Induced Respiration (SIR)
Microbial activity was determined by analysis of CLPP using the MicroResp soil respiration system (MicroResp™ Macaulay Scientific Consulting Ltd., Aberdeen, UK), as described in Campbell et al. [
40] and Lagomarsino et al. [
39]. Mineralization of 15 carbon substrates was tested for CLPP (
Table A2): five carbohydrates (glucose, galactose, fructose, arabinose, trehalose); five amino acids (lysine, alanine, ɣ-aminobutyric acid, arginine); four carboxylic acids (citric acid, oxalic acid, ascorbic acid, malic acid); and one amide (N-acetyl-glucosamine). Carbon substrates were selected depending on their ecological relevance to soil and their similarity to substrates used for enzyme activities. In particular, rhizospheric sources (carboxylic acids and carbohydrates) were chosen considering the importance of root inputs for microbial metabolism.
The sources were dissolved in deionised water and added before the soil to ensure that the soil contacted the source at the same time for all wells. For each soil a water control was present in the plate. To obtain the substrate induced respiration (SIR), the soil respiration values for the various carbon sources were adjusted by subtracting the average value of the water control. Three laboratory replicates were used for each field replicate. To estimate the evolved CO
2, a colorimetric method relying on the change in the pH of a gel-based solution of bicarbonate was used. The absorbance at 590 nm was read with a Biolog MicroStation (Microlog™ Release 4.20.04, Biolog, Inc., Hayward, CA, USA) immediately before and after 6 h of incubation at 28 °C. The absorbance after 6 h was normalized for any differences recorded at time zero and then converted to % CO
2 by using the following calibration curve: y = A + B/(1 + D x Ai), where A = −0.3409, B = −1.4604, D = −7.882 and Ai is the absorbance at 590 nm. The % CO
2 was then converted to µg CO
2 g
−1 h
−1 production rate using gas constant, T (°C), soil d.w. (g) and the incubation time (hour) (
Table A1).
2.7. Microbial Community Composition by EL-FAME Characterization
Microbial community structure was characterized by ester-linked fatty acid methyl ester (EL-FAME) analysis, which employed a mild alkaline methanolysis method to extract ester-linked (EL) fatty acids but not free fatty acids [
41]. In brief, 16.6 mL of 0.2 M potassium hydroxide (KOH) in methanol and 5 μL of internal standard solution (0.023 mg mL
−1 methylnonadecanoate 19:0) were added to a 50-mL centrifuge tube containing 5 g of freeze-dried soil. The tubes were incubated at 37 °C for 1 h in an orbital shaker. Then 6.6 mL of 1.0 M acetic acid were added to neutralize the pH of the tube contents. Extracted FAMEs were partitioned into an organic phase by adding 10 mL of hexane followed by centrifugation at 4500 rpm for 15 min. The hexane layer was transferred into a clean glass tube, dehydrated with Na
2SO
4, filtered and evaporated under a steam of N
2. Finally, FAMEs were dissolved in 200 μL of dichloremethane and transferred to an amber vial for GCMS analysis for quantification. Mass spectra were recorded by the use of a QP-5050 (Shimadzu, Kyoto, Japan) spectrometer equipped with an AT 20 capillary column (0.25 mm i.d., 25 m) (Alltech, Nicholasville, KY, USA) at 80–280 °C with a splitless injection and an isothermal program at 89 °C for 2 min, then 6 °C min
−1 up to 280 °C and finally isothermal at 280 °C for 5 min. Methylated fatty acids were identified according to their mass spectra and using BAME 24 (47080 U) and 37 FAME Mix (47885-U, Sigma–Aldrich) as chemical standards.
Standard nomenclature is used to describe FAs (
Table A3), which are designated by the total number of carbon atoms/number of double bonds, followed by the position of the double bond from the methyl (aliphatic) end (ω) of the molecule. The prefixes “a” and “i” refer to anteiso- and iso-branched FAs. The prefix “10Me” indicates a methyl group on the tenth carbon atom from the carboxyl end of the molecule and “cy” indicates cyclopropane FAs. Biomarkers of specific functional groups were assigned according to
Table A2 reporting the classification used. Total bacteria were calculated as the sum of Gram+ (G+), Gram− (GRAM−), General and Actinomycetes.
2.8. Statistical Analysis and Functional Diversity Calculation
Temporal variation of CO2 assimilation, pre-dawn water potential, soil CO2 efflux, water soluble carbohydrates, EL-FAMEs and induced respiration was detected by analysis of variance (ANOVA) separately for the two sites with season as the independent variable.
Correlations among the fluxes with biotic and abiotic variables were performed.
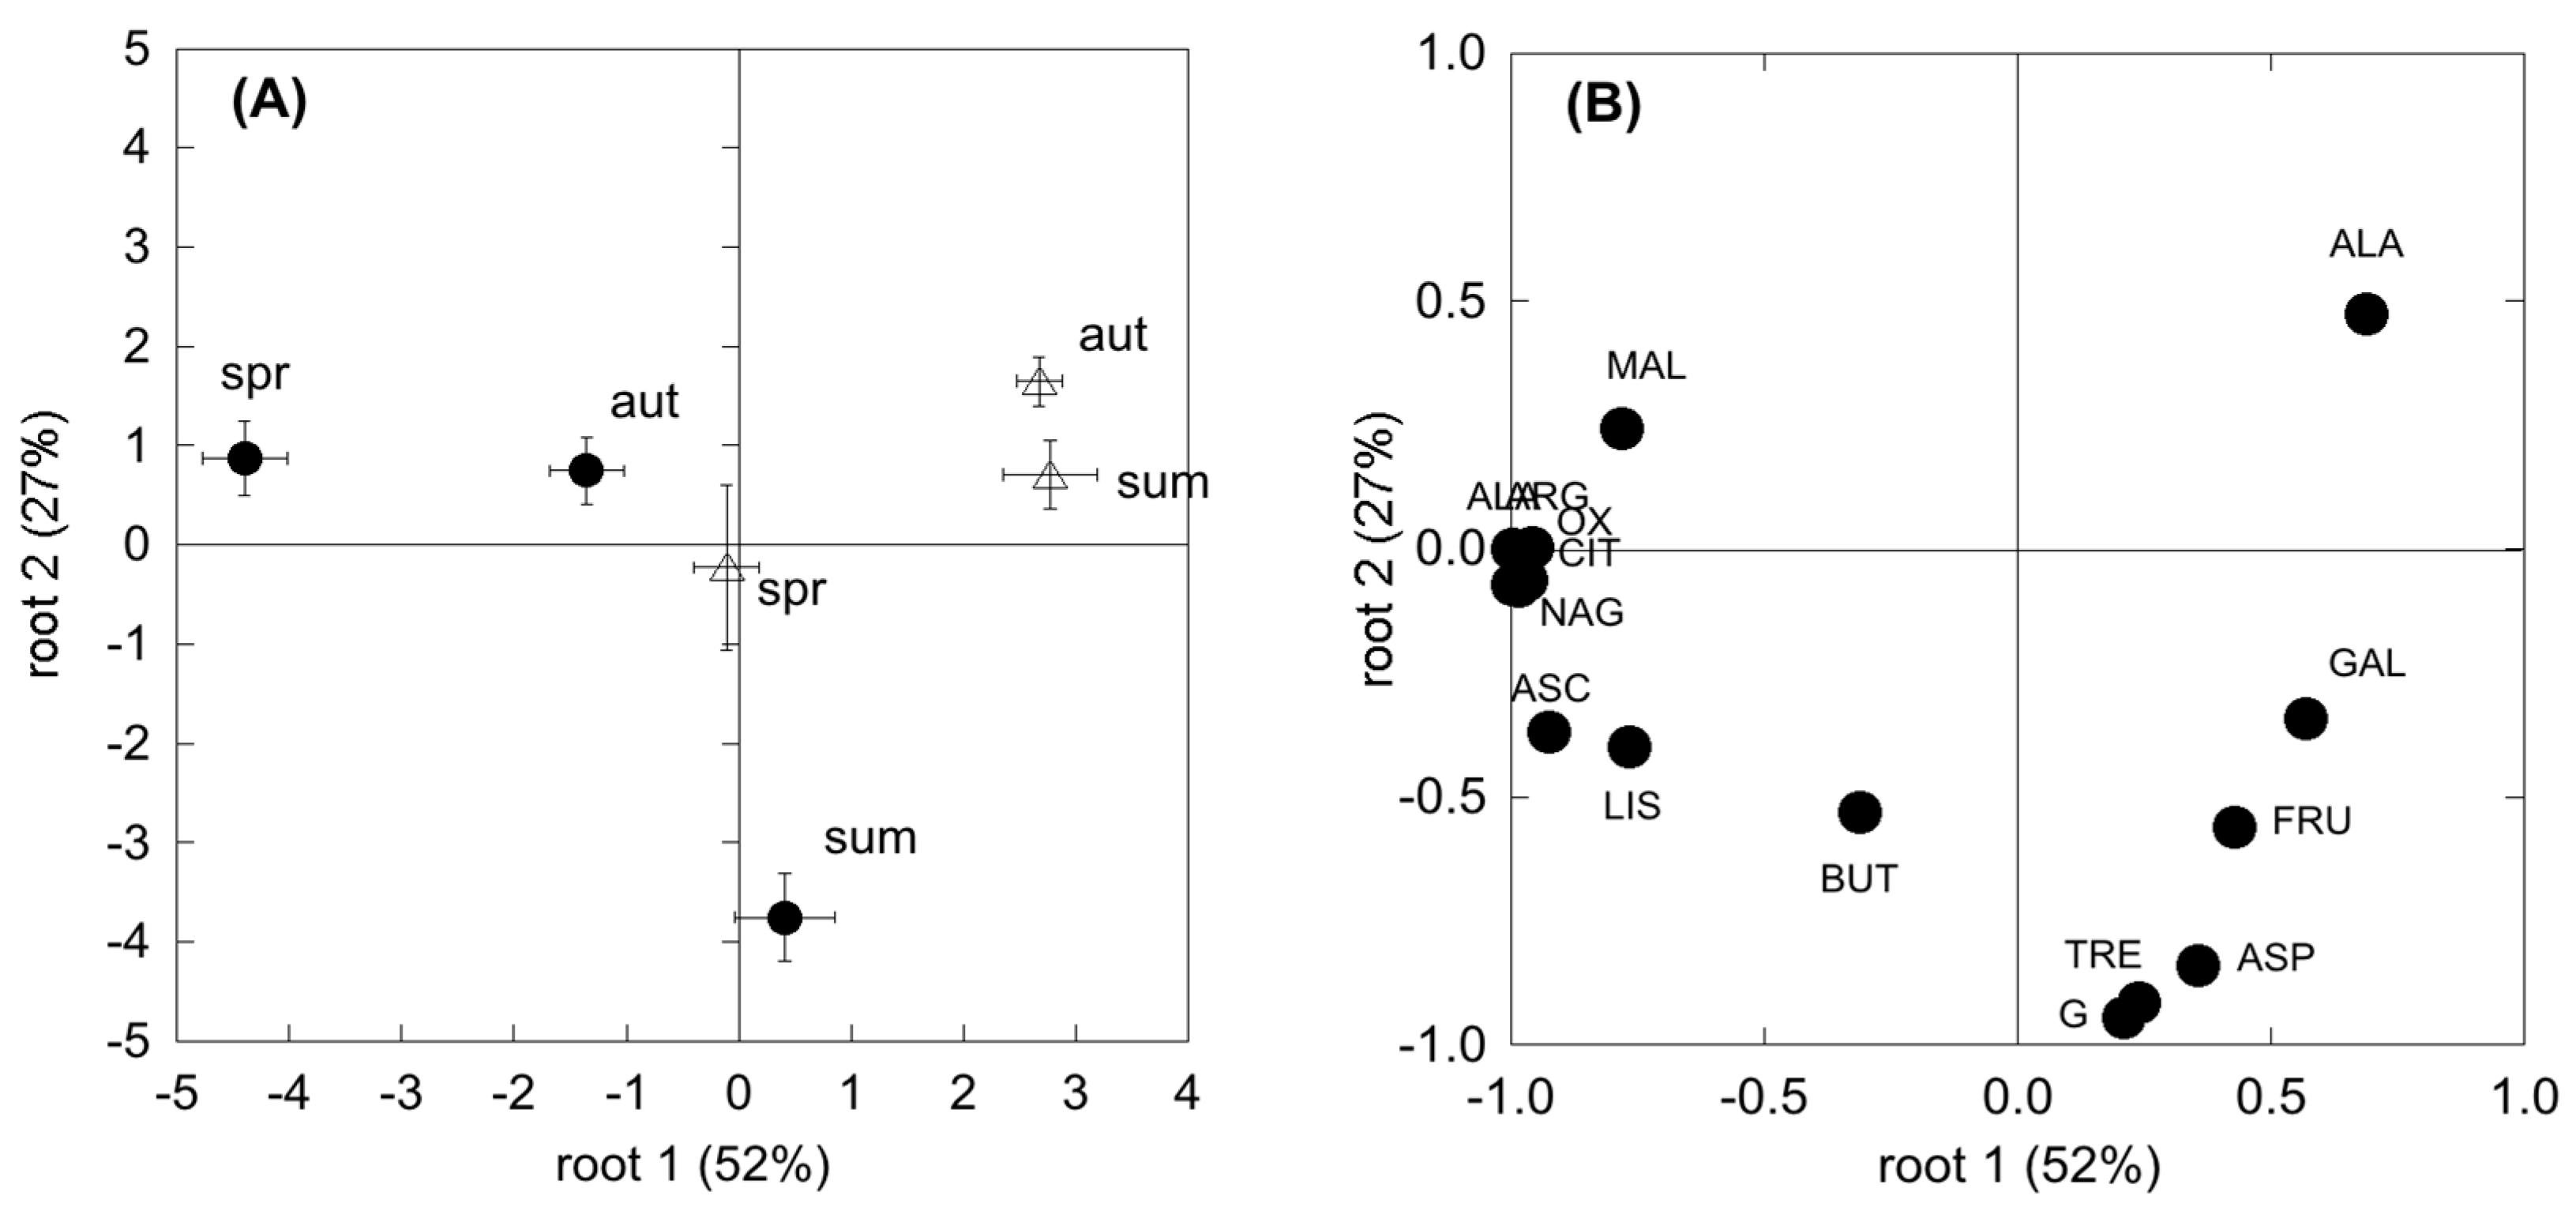
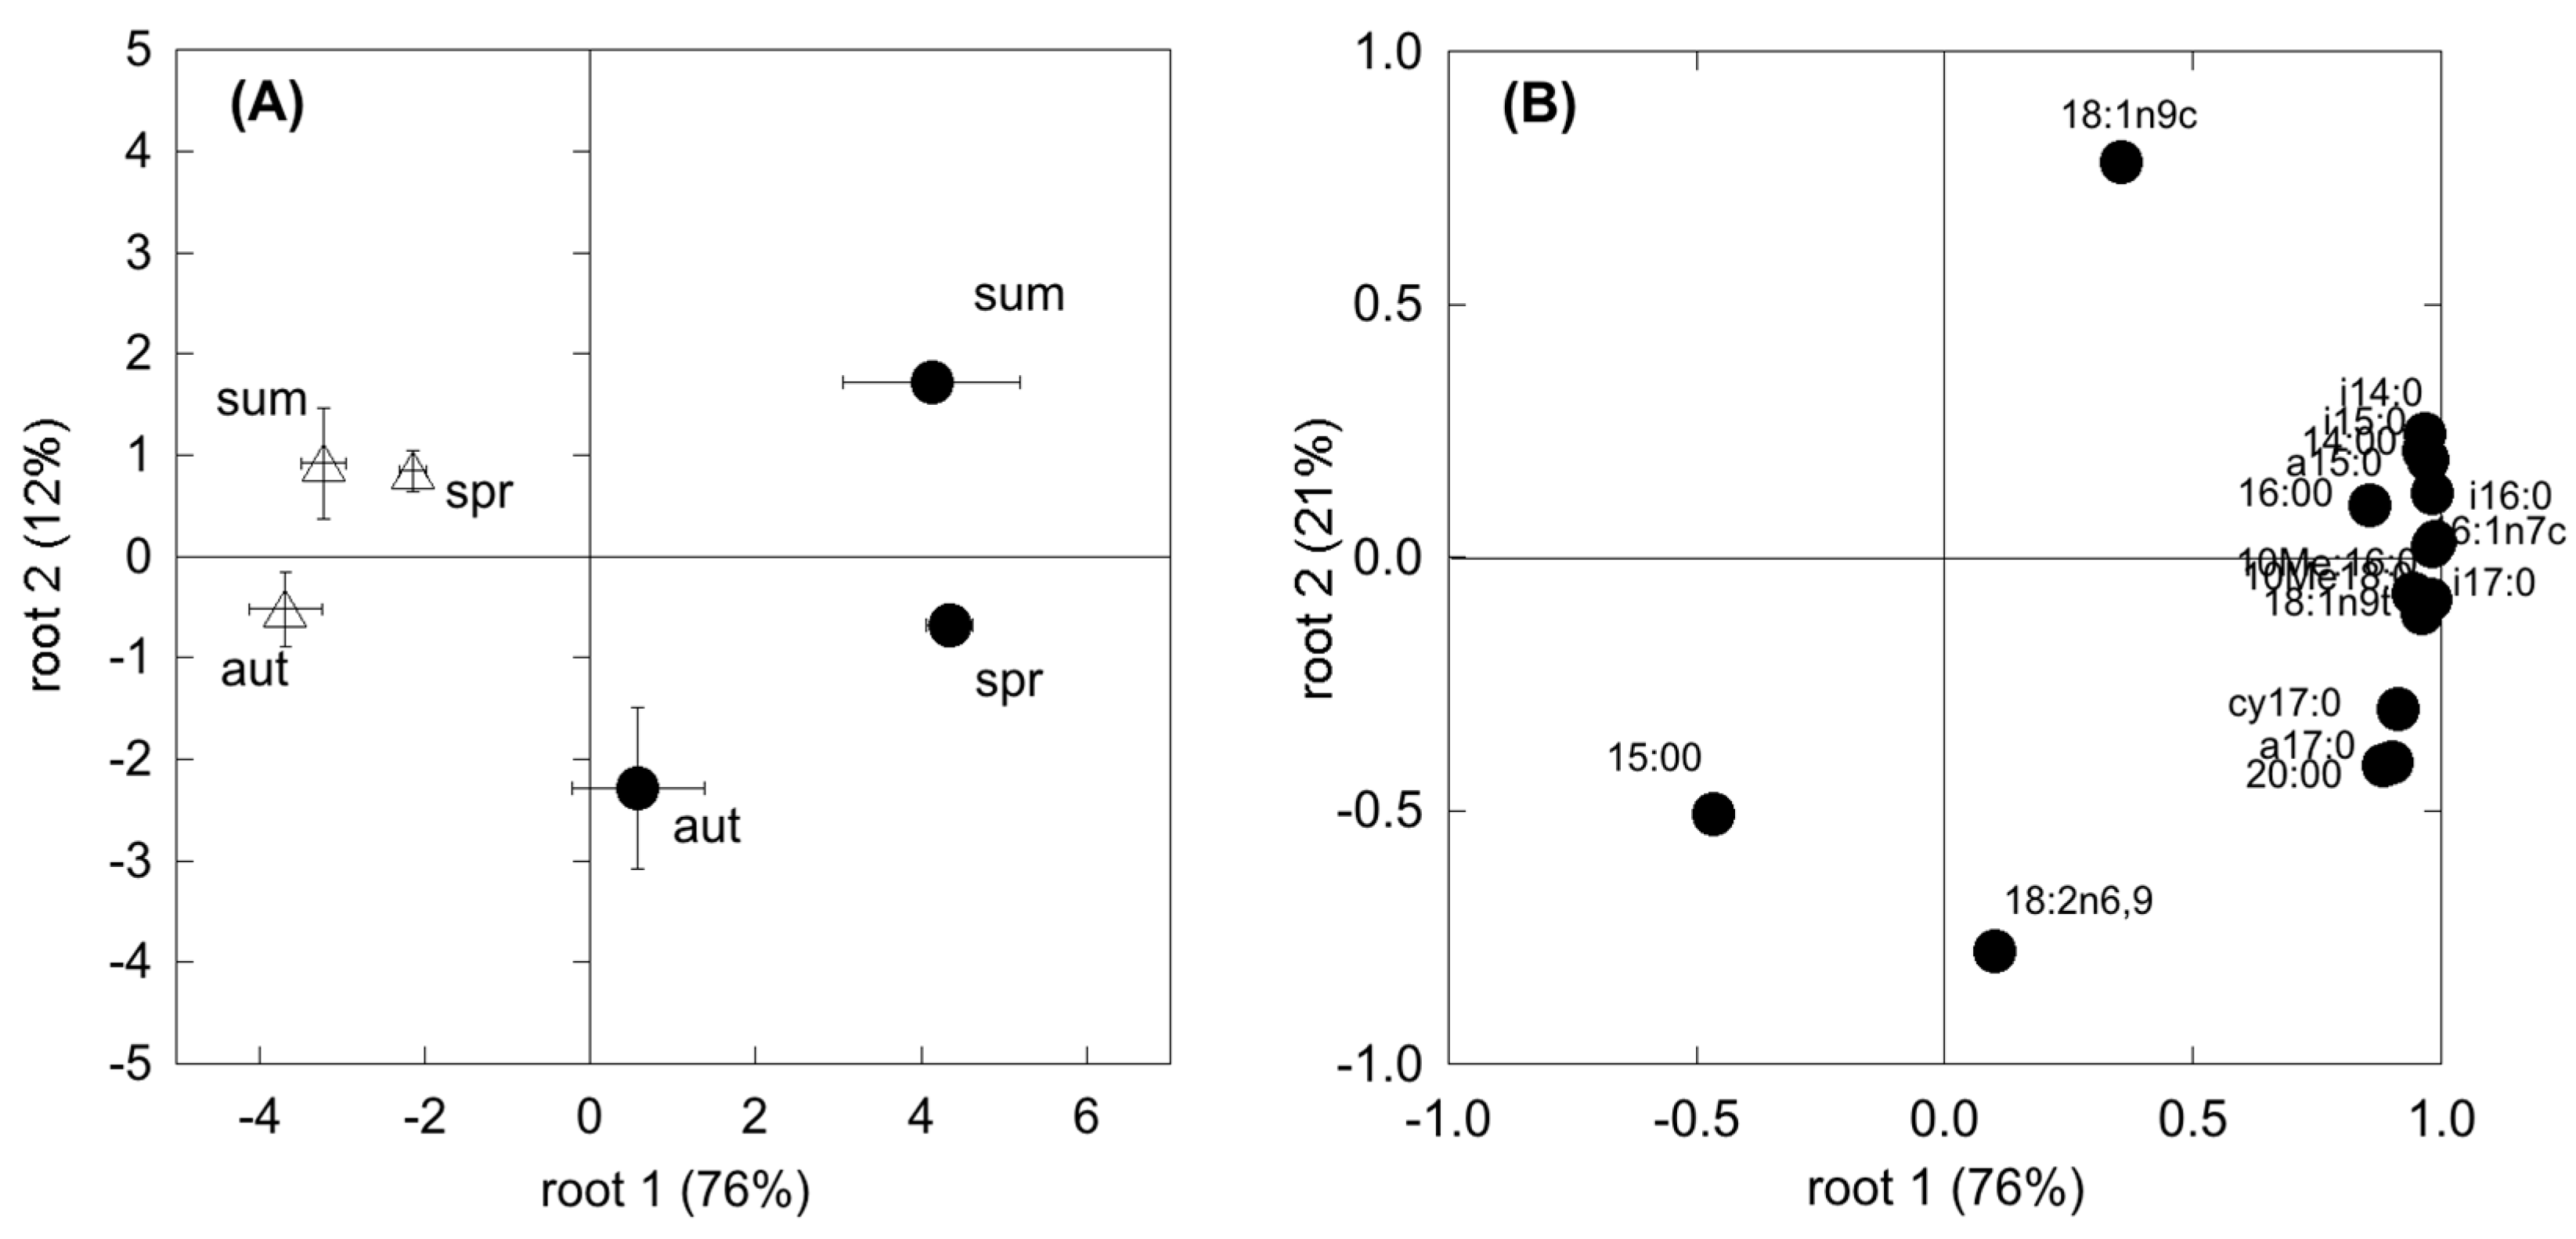
The responses of microbial population to substrates (CLPPs data) and population structures (EL-FAME data) to sampling time and abiotic factors were analysed by Principal Component Analysis (PCA). Dependent data are expressed as relative amounts. Prior to the analyses, data were transformed for normalization.
Statistical analyses were run by Systat 13 (Systat Software, Inc., Chicago, IL, USA) using the GLM model for ANOVA and the multivariate analysis for the PCA.
4. Discussion
In ecosystems facing severe spells of drought, plant assimilation is strictly dependent on water availability [
42,
43,
44,
45], whose duration controls the length of the growing season [
46,
47,
48]. In this study, photosynthesis showed a strong seasonal variation, as confirmed by the significant correlation of A
net with the environmental variables (soil and air temperature and soil water content;
Table A4) in both species. In both WDS and SDS, the highest assimilation rates were coupled with the highest stomatal conductance (g
s), while summer A
net was reduced due to a drop of g
s. The summer drop was consistently different for the two species, with a more evident shrink in poplar compared to
Cistus, underlined by the higher correlation of A
net with SWC. This can be attributed to the different water use efficiency of the two species. In fact, poplar is a winter deciduous plant; it boosts its assimilation rates, at the expense of water control, during the more favourable period [
49,
50]. Differently,
C. monspeliensis, a summer deciduous Mediterranean species, taking advantage of the autumn period to extend the growing season after the summer drought, adopts more constant and lower assimilation rates in order to minimize both water loss throughout the year and the unit cost of leaf production [
51,
52].
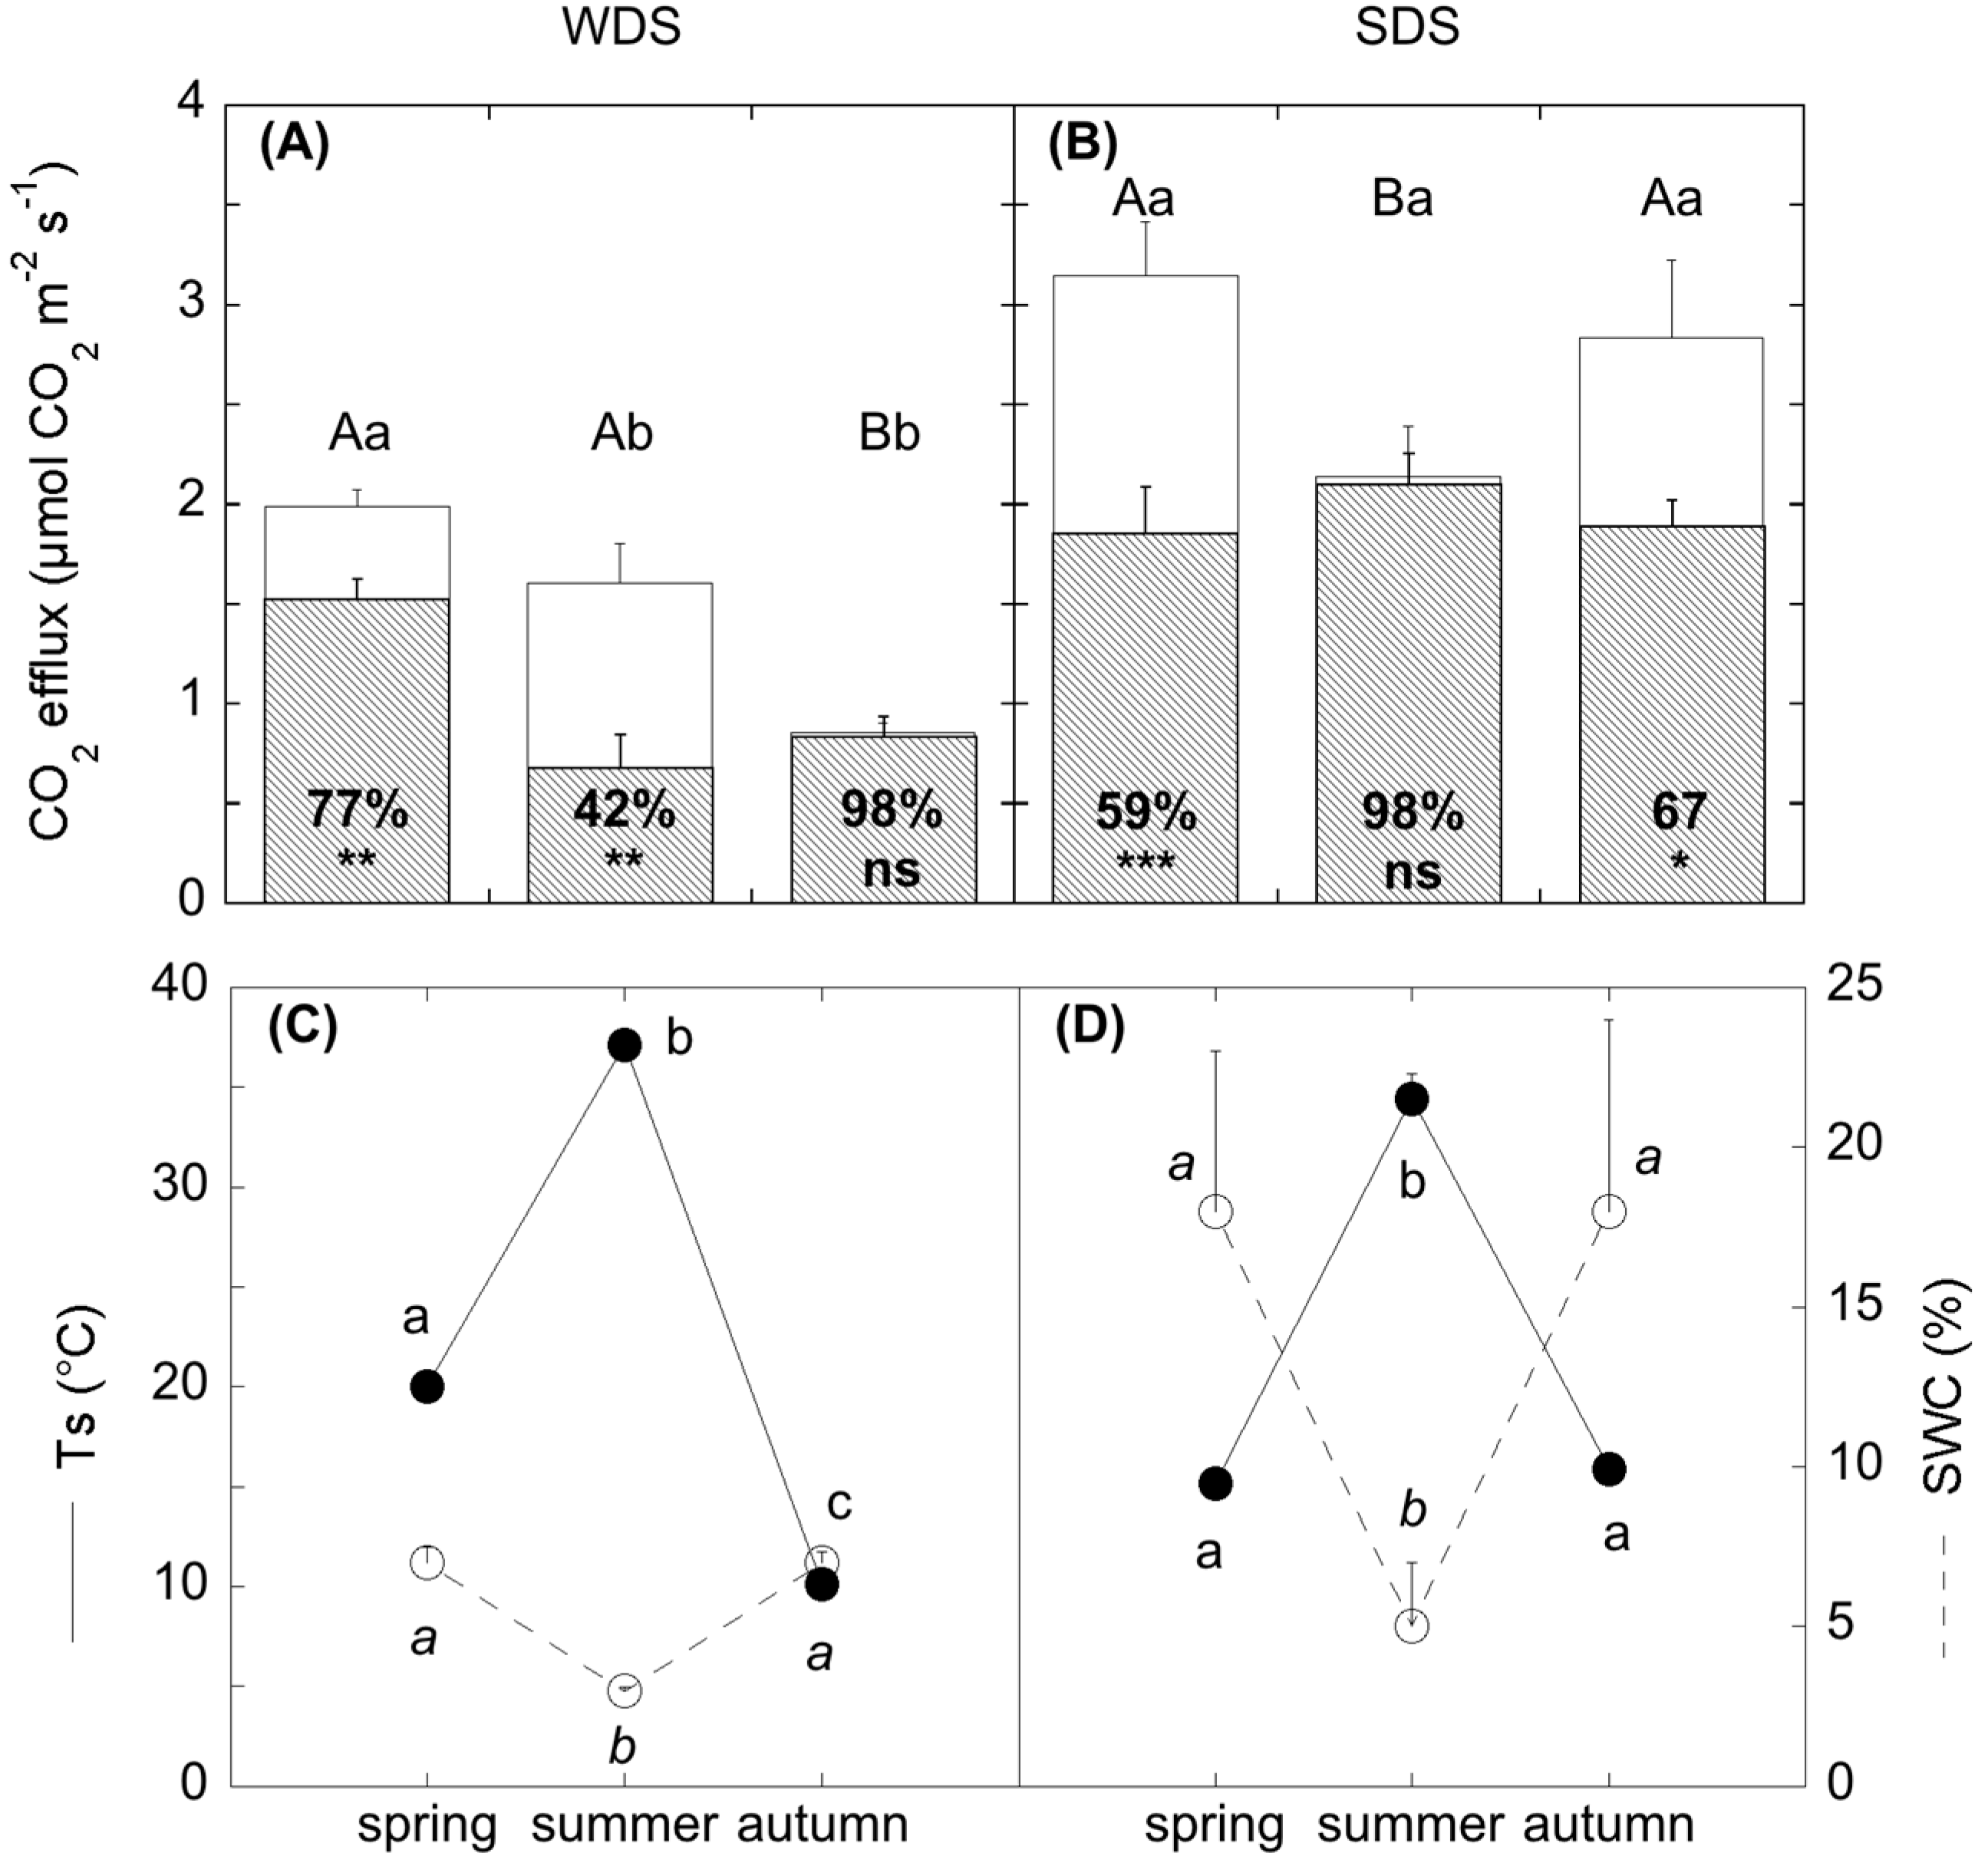
Soil water shortage also affected the relation between total belowground fluxes (SR) and soil temperature. In fact, the response of SR to summer drought was different in the two sites: in SDS, SR was reduced, while in WDS it did not change and was similar to spring values. This was evidenced by the SR-Ts correlation; (
Table A5), that was significant in both sites, but with opposite signs. This difference was attributable to the concurrent reversed sign of the correlation SR-SWC, confirming the stronger role of SWC than the solely temperature in regulating SR in dry ecosystems subjected to drought. These results are in line with the most recent outcomes on SR modelling in ecosystems facing drought, pointing to include soil moisture, inversely related to soil temperature [
53,
54,
55].
SR partitioning demonstrated a different response of the two components of SR (autotrophic and heterotrophic-SR
h) to summer drought. In WDS, although SR did not change, SR
h contribution halved spring values and compensated with higher autotrophic respiration, probably due to an increase in root activity to maintain constant leaf water potential under water shortage [
56]. In SDS, SR
h did not change in summer and was comparable to spring values. This different dynamic of CO
2 efflux partitioning under water shortage can be explained by factors other than aridity. These factors can be different in the two sites. In fact, Kuzyakov and Gavrichkova [
24] reported that in plants with a high root allocation of photosynthates and during a period that is not water-limited, together with the climatic drivers, the direct effect of plant activity on soil respiration also has to be taken into account because of the close link between photosynthesis and rhizosphere processes [
23,
57]: photosynthesis supplies carbohydrates to roots, modulating substrates’ availability to the rhizosphere. During summer in SDS, the
Cistus plant community, unable to access deep water, moved to a dormant status in order to maintain turgor. This caused a reduction in photosynthates and substrate availability; however, the observed summer depression of SR was not due to a modification of SR
h but to the suppression of autotrophic respiration, as already similarly observed in other ecosystem types under drought [
13,
58,
59], and SR
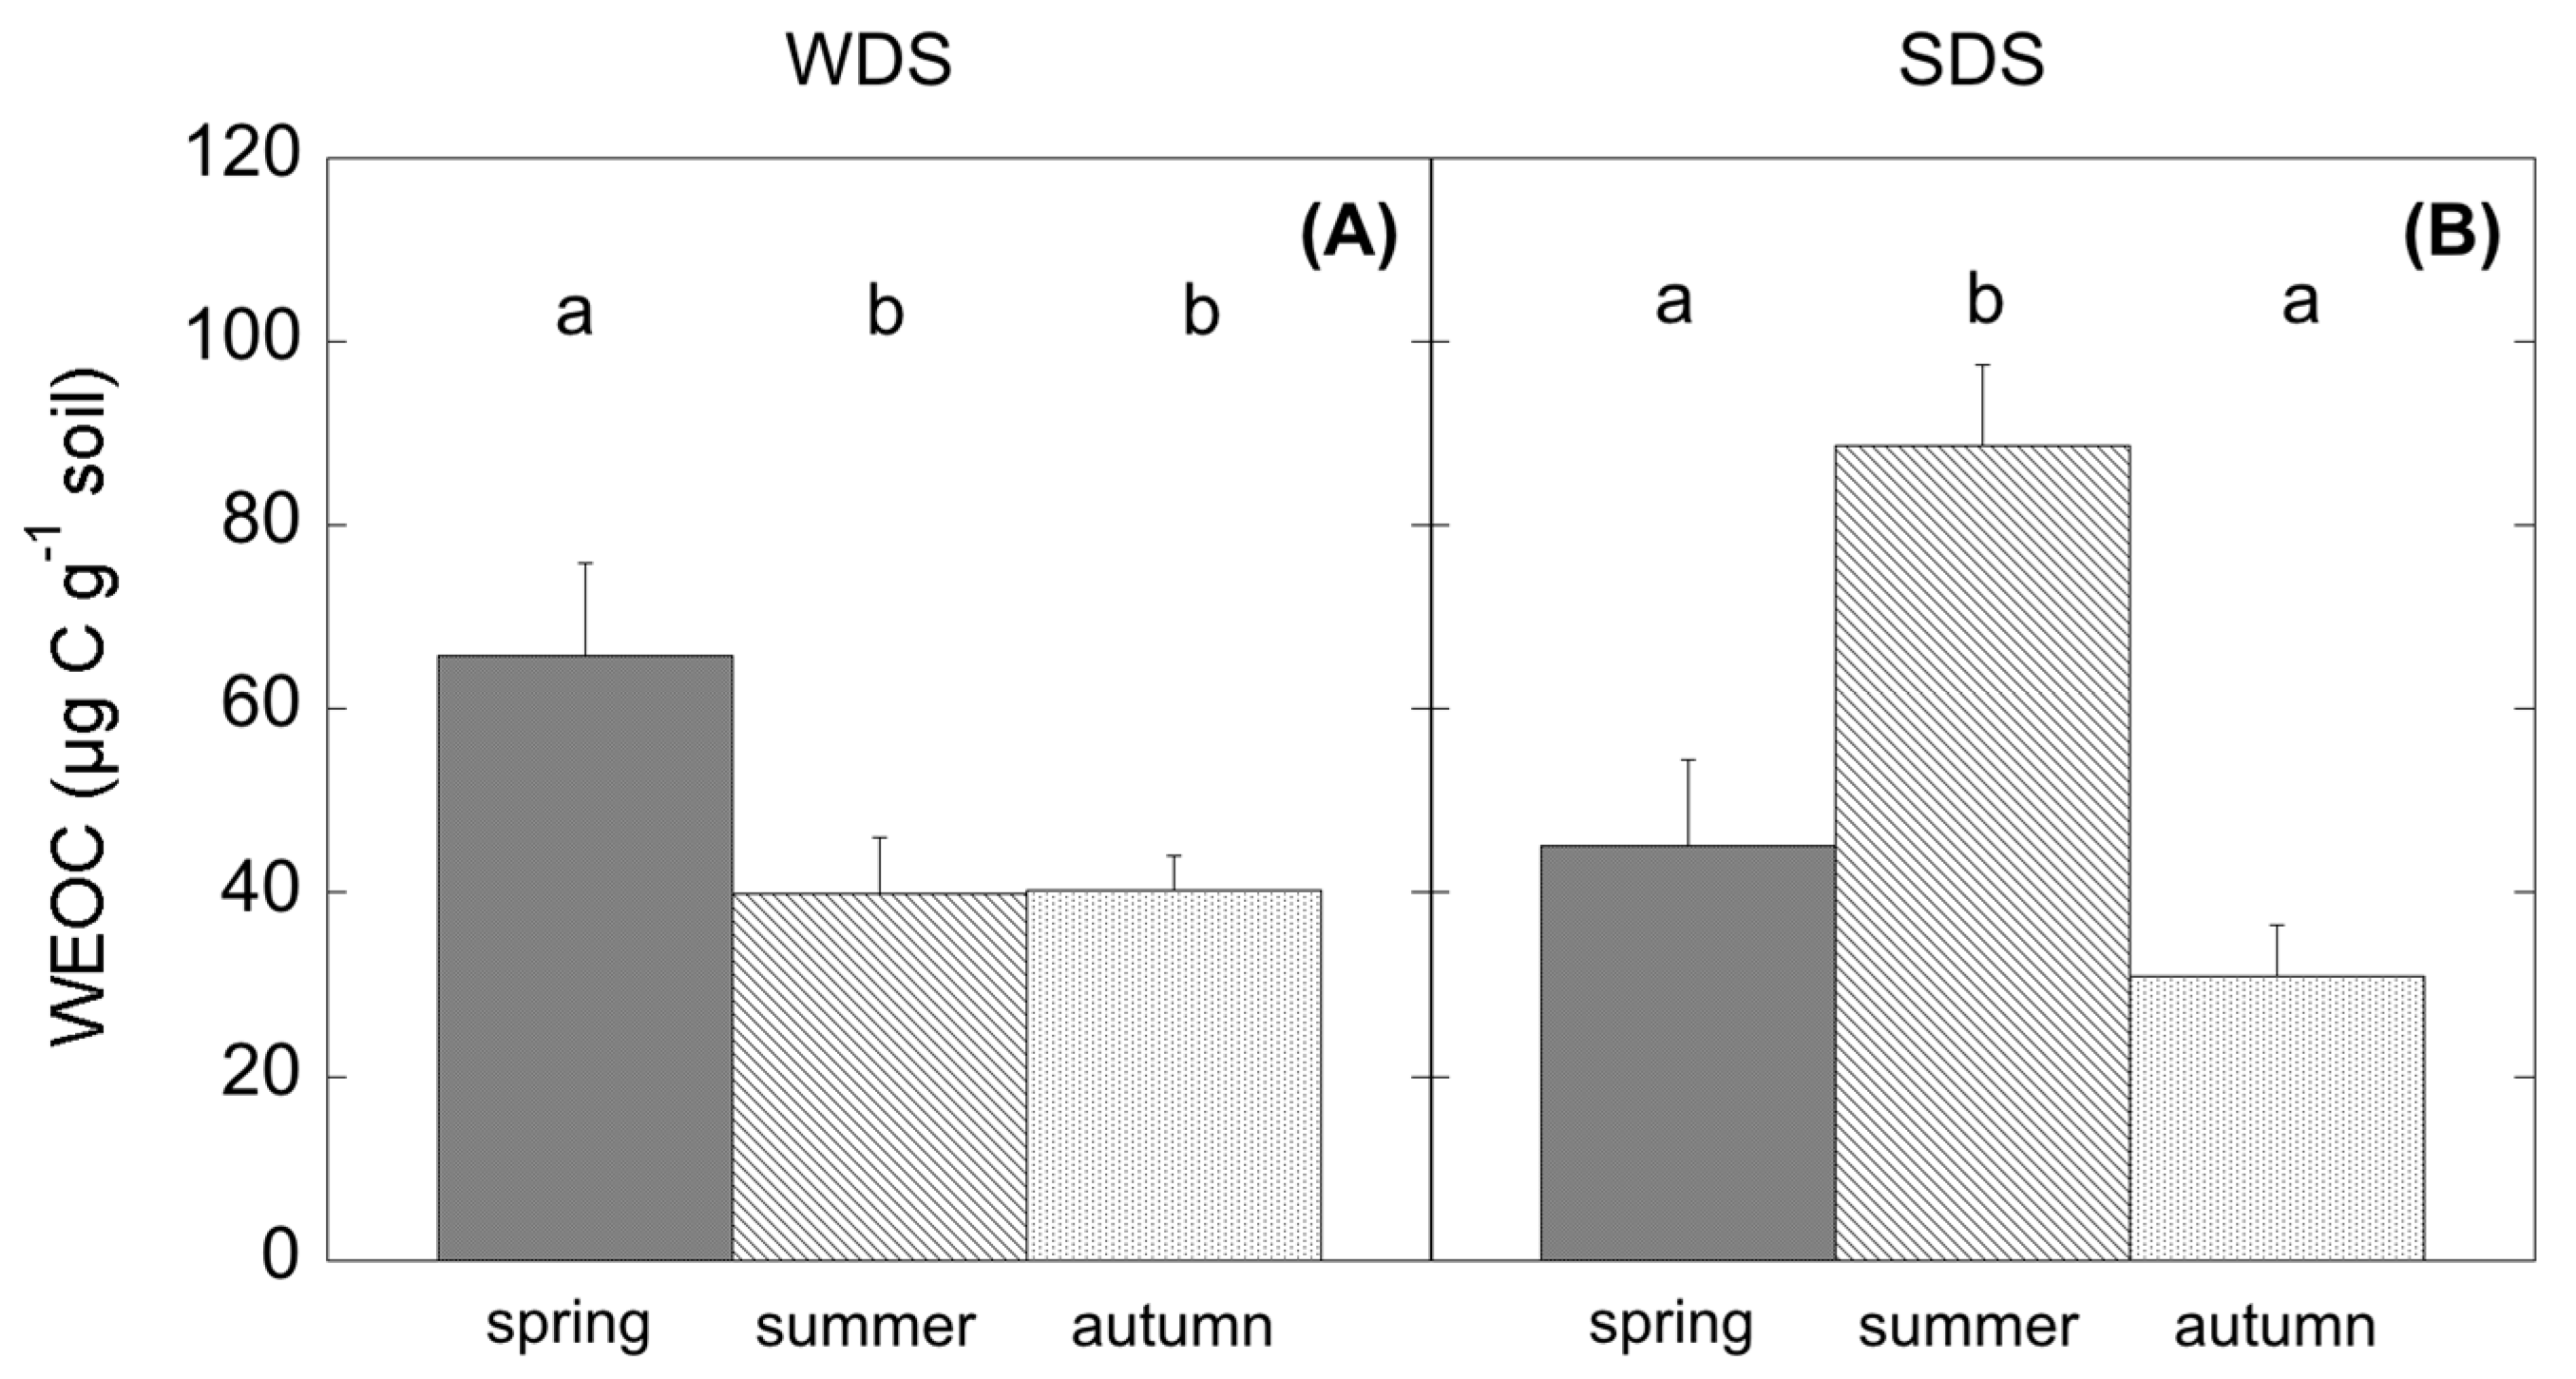
h accounted for almost 100% of SR. Concurrently, a significant increase in WEOC was observed, likely because of the high root mortality occurring in summer in Mediterranean ecosystems [
60,
61] and the simultaneous photodegradation of surface litter at high irradiance [
62,
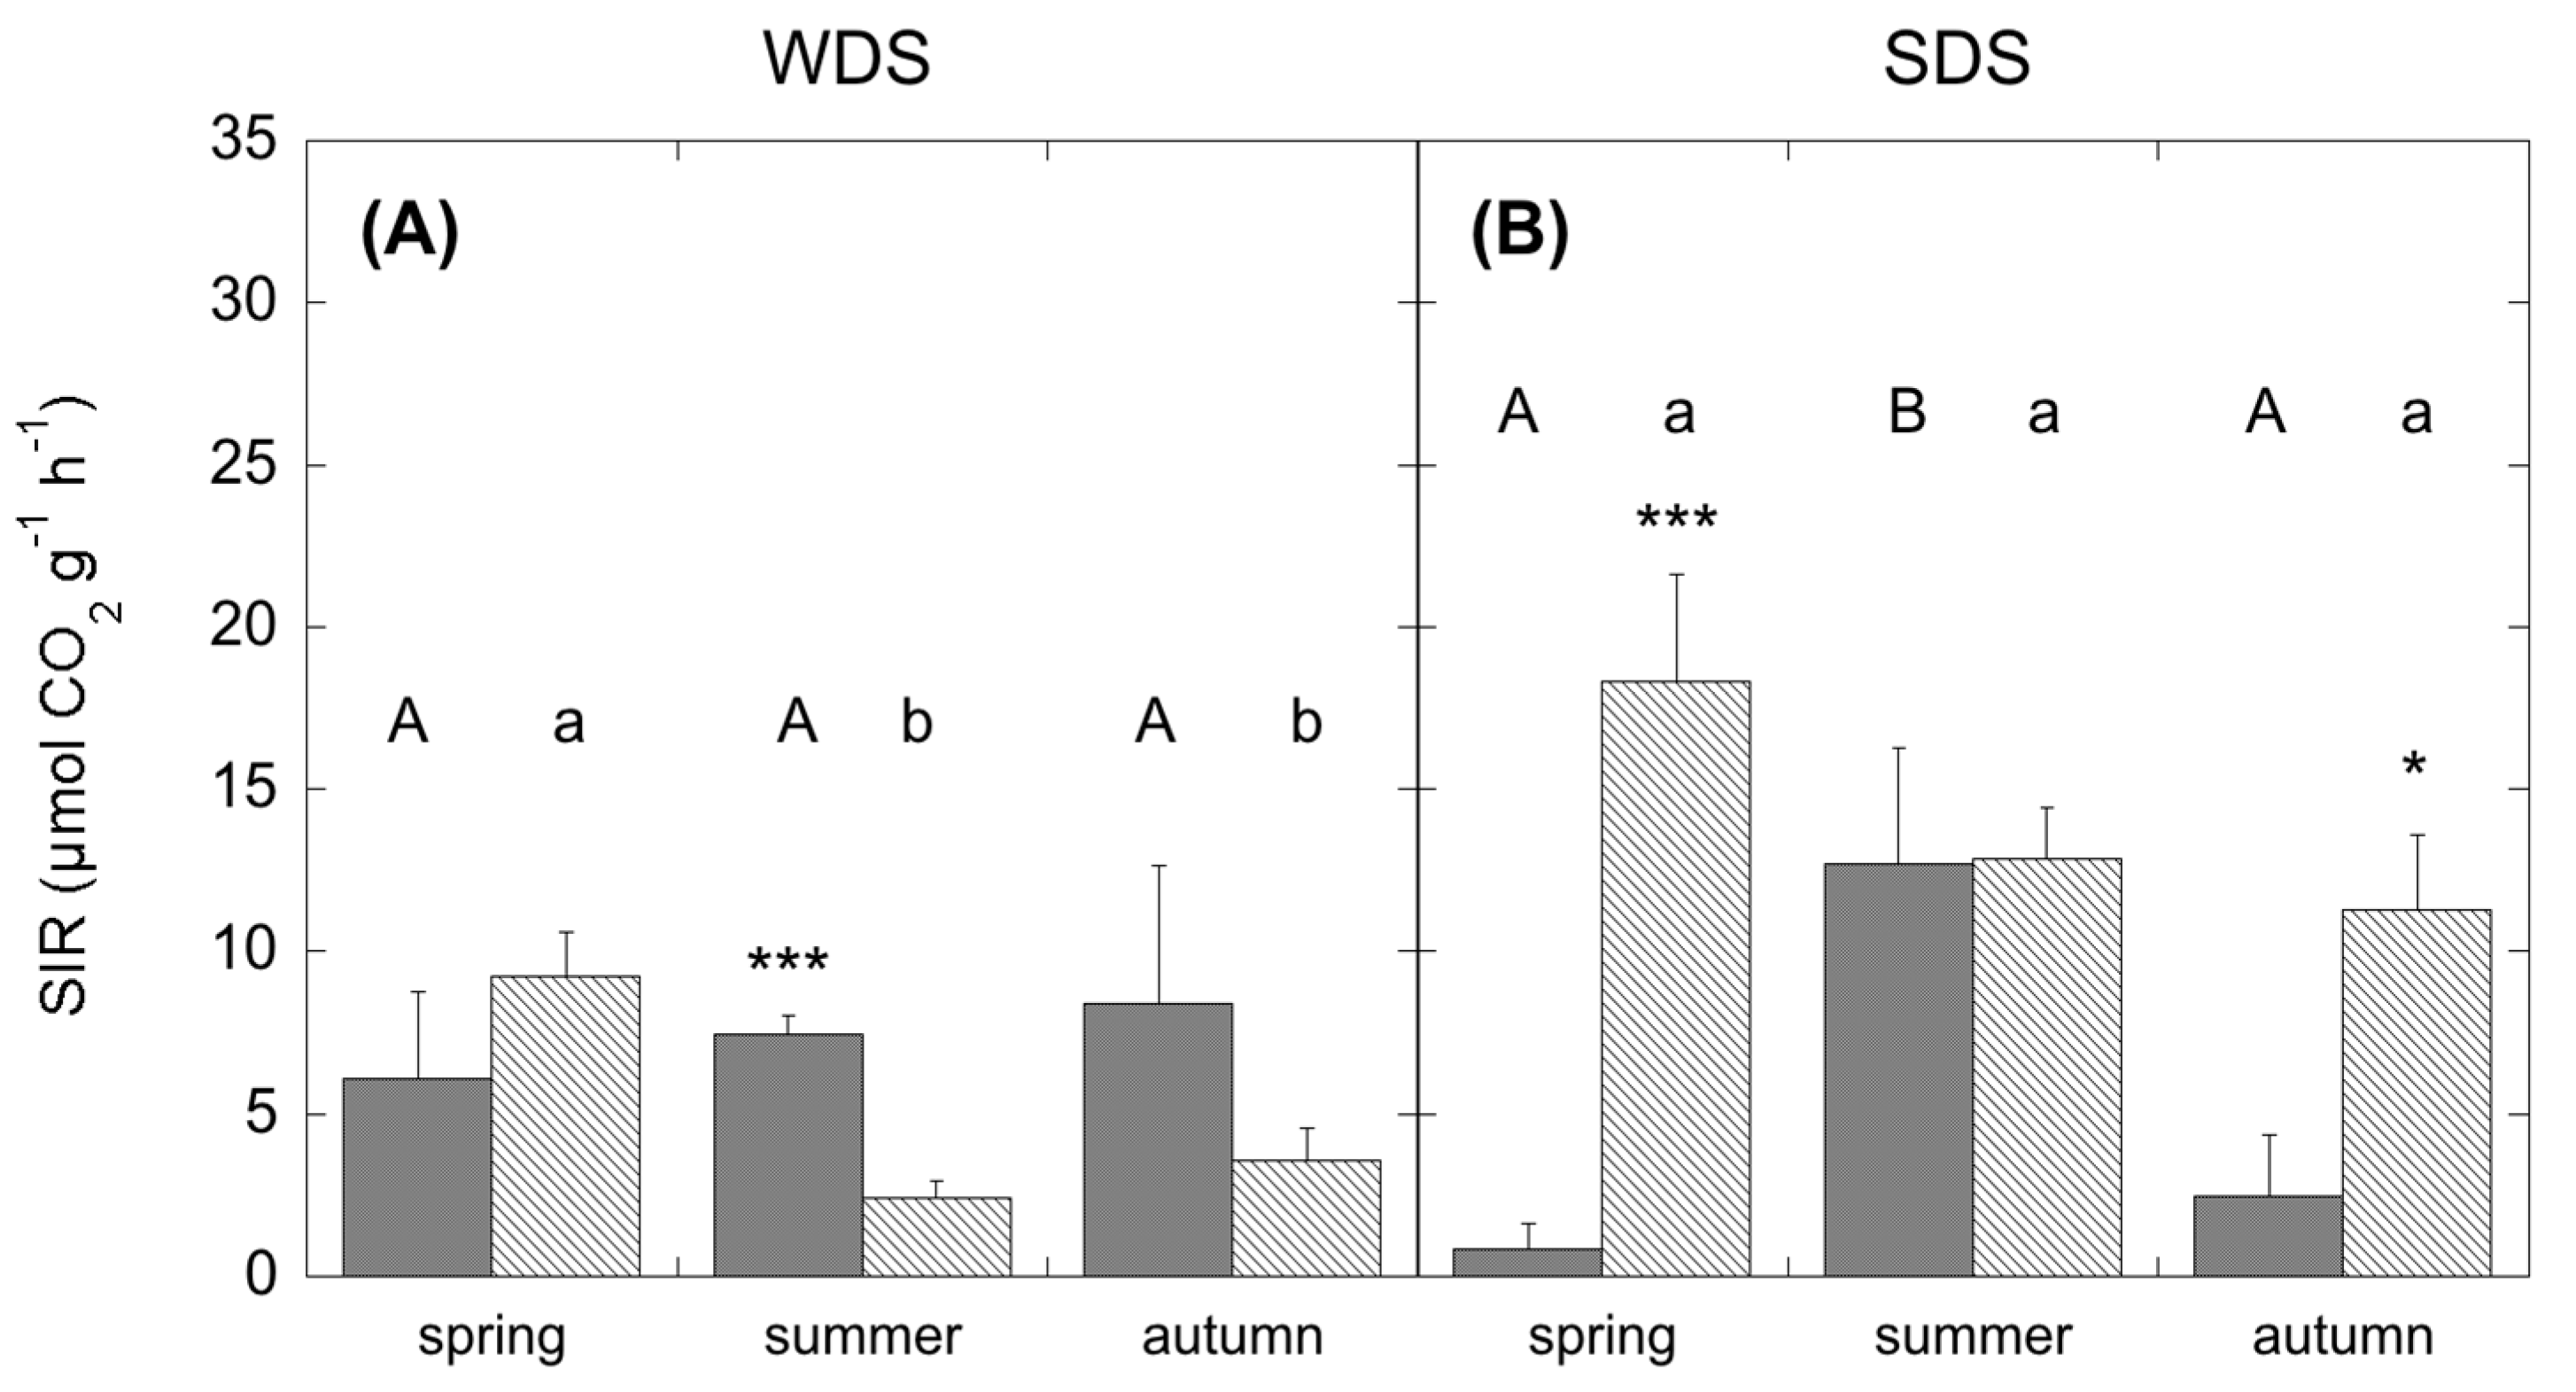
63], which both release high amounts of C into the soil. At the same time, a change in the microbial community assemblage could be detected. In WDS, during summer the reduced assimilation was related to a decrease of SR
h and also coupled with limited substrate availability. In this case, WEOC, which is strictly connected to the release of root exudates [
64] changed accordingly. As reflected by SIR analysis, summer microbial community in WDS was able to respire carbohydrates rather than more complex substrates. Thus, a reduction of fresh C from aboveground, because of low stomatal conductance and reduced phloem transport, negatively affected SR
h. In this case, substrate quality and quantity more than water availability can modulate CO
2 release in this ecosystem. This result is further confirmed by autumn fluxes, showing low SR
h fluxes because of the leaf shedding and the absence of photosynthate production.
The drought season differently affected the temperature coefficient of the heterotrophic respiration (Q
10). In WDS, the dry period corresponded with the lower Q
10, reflecting the low bacterial activity in this site reported by [
65]. For SDS, the dry period corresponded to the higher Q
10, as was already observed by de Dato et al. [
53]. Davidson and Janssens [
66] reported that the decomposition of more complex substrates could likely lead to higher Q
10. In summer, when the microbial community is potentially able to feed on substrates more easily, the presence of root residues from root mortality might have acted as a priming effect, increasing the decomposition of more complex substrates (high Q
10), thus compensating for the climatic constraint.
The composition of the microbial community may differ among plant communities and season, likely translating into functional shifts in microbial metabolic capacity. In the present study, CLPP and EL-FAME revealed a dynamic assemblage of microbial communities, as could be expected under seasonal drought cycles [
30,
67]. However, SDS revealed a more plastic and opportunistic behaviour of microbial community than the WDS. In fact, in the WDS there was a constant use of carbohydrates no matter the season. Differently, in the SDS the complex substrates’ use was constant all through the year and higher than carbohydrate use in both spring and autumn. Since substrates like carboxylic acids, amino acids and glucosamine are considered to mainly derive from roots (exudates and tissue degradation) [
64,
68], higher belowground C allocation in dry Mediterranean ecosystems [
69] determines microbial survival even with a low presence of photosynthates. This was further confirmed by a significant relationship between SR and the degradation of these substrates, which was shown to be mostly used by the microbial communities. In addition, the generally more complex and physiologically diverse microbial community at the Mediterranean site, evidenced by the higher FAME, determined a higher resilience to unfavourable climatic and edaphic conditions. Unexpectedly f [
70], fungi were shown to be less involved in CO
2 production in these two ecosystems, suggesting a larger sensitivity to drought with respect to other microbial groups. However, microbial communities in SDS appeared to be more driven by fungi than in WDS, which points to the importance of these groups in Mediterranean ecosystems [
71].


 ,
, 

