Article

Variation in the Concentrations of Major Secondary Metabolites in Ginkgo Leaves from Different Geographical Populations

Co-Innovation Center for Sustainable Forestry in Southern China, Nanjing Forestry University, Nanjing 210037, China
*
Author to whom correspondence should be addressed.
These authors contributed equally to this study.
Forests 2017, 8(8), 266; https://doi.org/10.3390/f8080266
Submission received: 19 June 2017 / Revised: 19 July 2017 / Accepted: 24 July 2017 / Published: 28 July 2017

Abstract

:
Ginkgo biloba L. is a well-known relict tree species and an important medicinal plant. Ginkgo is rich in secondary metabolites (SMs), mainly including flavonoids, lactones, and ginkgolic acid. The aim of this study was to determine variations in the concentrations of these SMs in Ginkgo leaves from different geographical populations. The SMs in the leaves of 298 clones from 10 geographical populations grafted under the same conditions were extracted and measured by high performance liquid chromatography (HPLC). The results showed that there were significant differences in concentrations of SMs in leaves from different populations (p < 0.01). The concentrations of both flavonoids and lactones were significantly negatively correlated with that of ginkgolic acid. Altitude and annual rainfall were important factors influencing the concentrations of lactones, and the frost-free period influenced the concentration of isorhamnetin. Population Yingdianjie (YDJ) was ideal for the plantations from which medicinal flavonoids and lactones are extracted, followed by populations Xiaopu (XP), Anlu (AL) and Wuchuan (WC). As variations within each population were found, attention should be paid to selection within populations.

1. Introduction

Ginkgo biloba L. is a unique species of Ginkgoatae and is known as the “living fossil”, as it is one of the oldest species on the planet. The living history of Ginkgo dates back to the Permian 300 million years ago [1], and Ginkgo species were distributed almost worldwide during the Jurassic 190 million years ago. Due to changing climate, only G. biloba survived and is the native plant of China. Therefore, as the origin of existing Ginkgo trees in the world, China not only owns 90% of worldwide Ginkgo resources, but also has natural populations with significant variations.
In China and throughout the world, Ginkgo is a very important medicinal plant. The secondary metabolites (SMs) contained in Ginkgo leaves can be divided into three main types: flavonoids, lactones and ginkgolic acid [2]. The flavonoids are a series of compounds with two benzene rings and a phenol hydroxyl connected by the central three carbon atoms, and mainly include quercetin, kaempferol and isorhamnetin [3], which have immunity enhancement [4], anticancer [5,6,7] and anti-aging [8,9] activities, and can be used in the prevention and treatment of vascular disease [10]. As alicyclic compounds, lactones can be divided into ginkgolide (A, B, C) and bilobalide [11], and the ginkgolides are platelet activating factor antagonists with important effects on cardiovascular disease, endotoxin shock, and organ transplant rejection [12,13]. The ginkgolides were first extracted by Furukawa in 1932, and are only found in Ginkgo [14]. Ginkgolic acid is a natural product with the function of sterilization and insect resistance [15], which is one of the reasons why Ginkgo trees have few diseases and insect pests. However, ginkgolic acid was also a toxic by-product, when extracting the SMs, due to its irritability and mutagenicity [16,17].
The concentration of SMs is an important indicator when evaluating medicinal plants, as it is directly associated with the efficiency of the SMs extracts. According to the national standard [18], the minimum concentration of total lactone (flavonoid) in dry leaves used for extractions was 2.5 (4.0) mg·g−1 dw. In general, the concentration of SMs is influenced by both genetic and environmental factors and shows geographical diversity [19]. Some excellent germplasm resources have been formed in special ecological environments [20,21]. However, this is still controlled by genes, and genetic factors play major roles [22,23,24]. China has many widely distributed ancient Ginkgo populations, which have abundant diversity [25,26], and many potential germplasm resources have been obtained from these populations. In the past, Ginkgo plantations of SMs were established without genetic selection in China, while variations in SMs concentrations have been found among different families, clones, etc., in some studies [27,28,29]. However, no related studies have been reported on the variations among and within geographical populations. In this study, 298 clones from 10 geographical populations grafted under the same environmental conditions were selected for studying the variations in SMs concentrations among and within geographical populations (Table 1, Figure 1). The results of this study would provide a theoretical basis for the protection and application of germplasm resources.

2. Materials and Methods

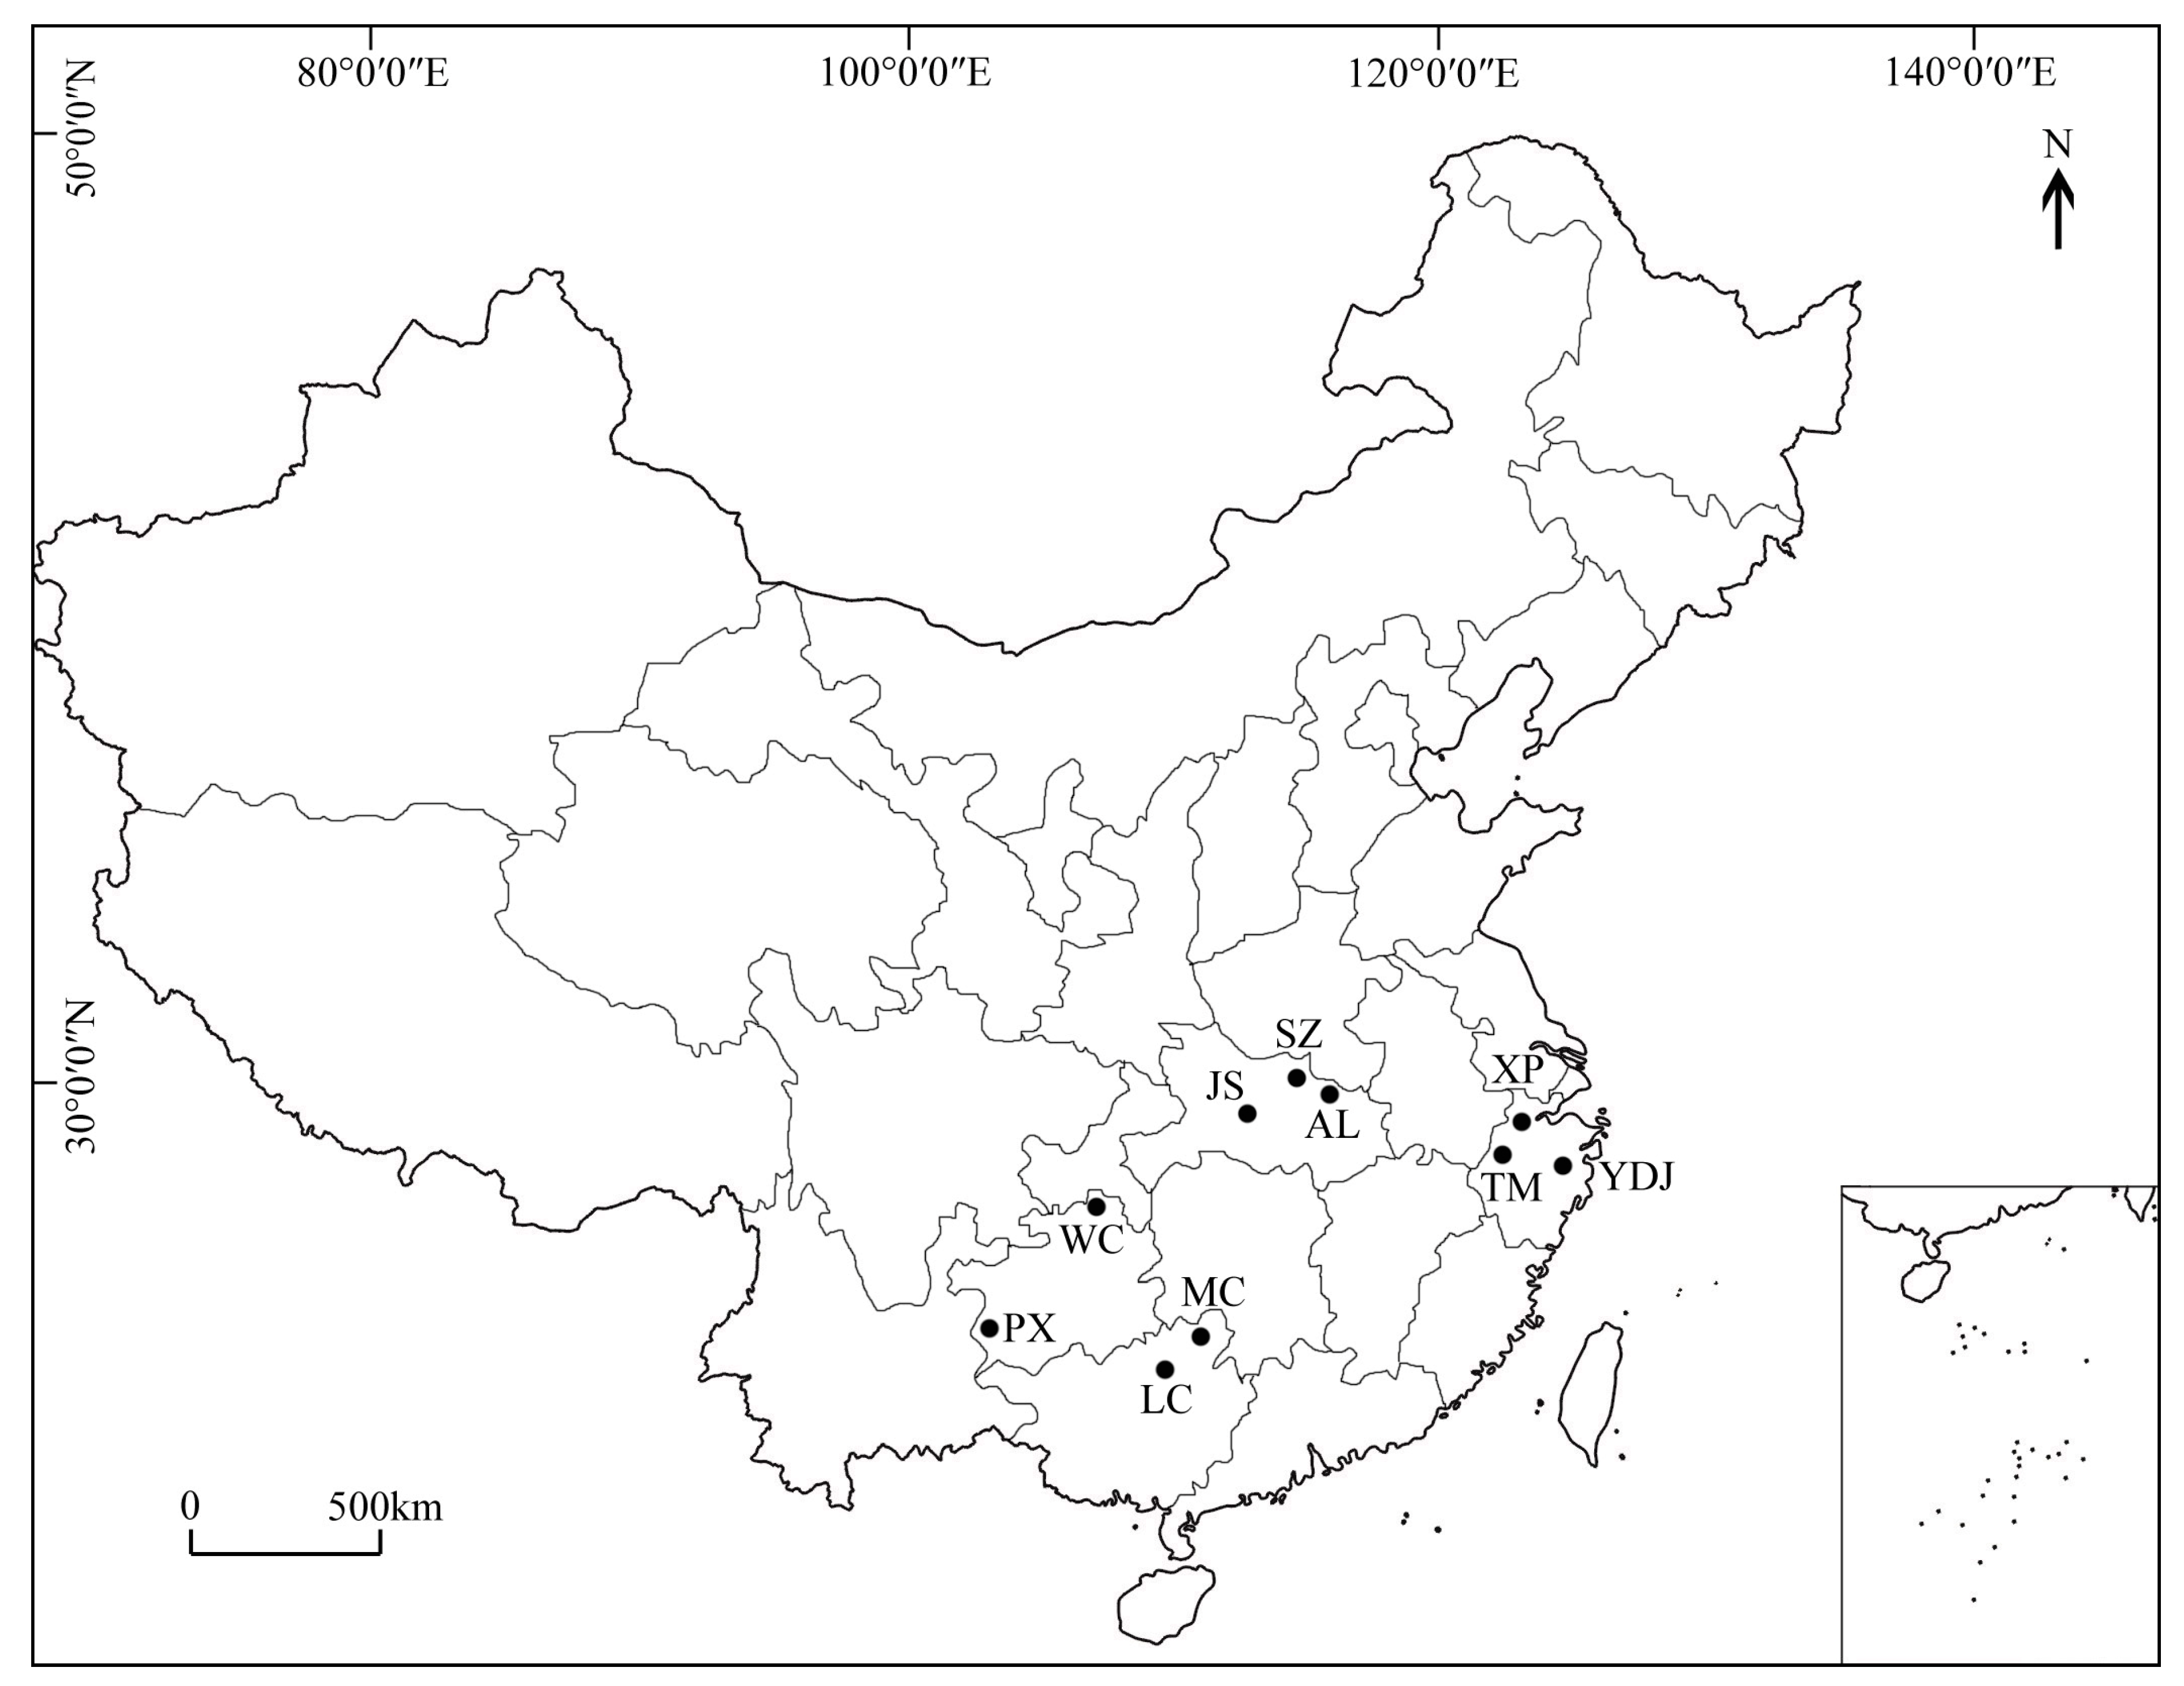
2.1. Plant Materials

Between 2012 and 2013, after researching major areas nationwide with ancient Ginkgo trees (more than 100 years old) populations, more than 30 samples were collected from each geographical population, with the exception of small populations. The distance between trees was at least 50 m, in order to reduce the probability of sampling trees that were closely related. The scions were grafted onto three-year-old rootstocks in the Ginkgo germplasm nursery at Nanjing Forestry University Base (31°66′ N, 119°01′ E, 368 m above sea level) under the same conditions, including the source and size of rootstocks, sunshine, soil, and cultivation management measures. The study area is in a subtropical zone, with seasonal pluvial heat and significant monsoon activity. The area is characterized by a mean annual temperature 15.5 °C, an annual rainfall of 1037 mm, an annual sunshine duration of 2146 h, and an annual frost-free period of 237 days. Each clone had at least six ramets and random distribution with plant spacing of 1 m × 1 m.
In July 2015, 298 clones of 10 populations from four provinces in China were collected with an average of 22 to 34 clones for each population. Fifteen to 30 normally grown leaves for one clone (3 to 5 leaves per ramet) were selected and were immediately taken back to the laboratory. The origins, number of samples per population and geographical information are shown in Table 1 and Figure 1.

2.2. Extraction

The collected leaves were dried to a constant weight, after washing and placing in ventilated shade for 12 h. Leaves from each clone were ground with a blender, and the powder passed through a coarse sieve of 60 mesh.
Three grams of powder were extracted with 24 mL of an 85% v/v ethanol: water solution by homogenation for 3 min, and centrifuged for 10 min at 8000× g (4 °C). The solvent in the supernatant was removed with a micropipette and the residue was evaporated to dryness using a rotary evaporator (for approximately 20 min). An amount of 14 mL methyl alcohol was added to the dried residue and the extract was dissolved in an ultrasonic water bath for 1 min.
Seven milliliters of extract were passed through an acidic alumina adsorption column, and the filtrates were the test solutions for lactone concentration assessment; 3 mL of extract were used to assess ginkgolic acid concentration; the remaining extract (about 4 mL) was mixed with 1 mL of 25% v/v HCl: water solution in a round-bottomed flask and refluxed for 1 h at 80 °C. The remaining solution was transferred to a 5-mL volumetric flask, diluted with methyl alcohol to volume, and mixed. The mixture was used to assess the flavonoid concentration [30,31].
Three test solutions were passed through a 0.22-μm organic membrane before use, and then placed in HPLC bottles at 4 °C.

2.3. HPLC Analysis

The three SMs were analyzed using a Waters Series Alliance e2695 HPLC system (for flavonoids and ginkgolic acid) and a 1525 analytical/semi-preparative HPLC system (for lactones, Waters Corporation, Milford City, MA, USA) with a Waters X-Bridge C18 reversed phase column (5 μm, 4.6 × 250 mm, Waters, MA, USA). The binary gradient employed the following mobile phases: (flavonoids) a mixture of phosphoric acid and methyl alcohol (52:48, v/v), (lactones) 33% methyl alcohol in H2O and (ginkgolic acid) a mixture of ethylic acid and methyl alcohol (8:92, v/v) with a flow rate of 1.0 mL/min. The 2998 photo-diode array detector was set at 360 nm (flavonoids) and 310 nm (ginkgolic acid), and the 2424 evaporative light-scattering detector was used for lactones [32].
The concentrations of three major SMs in each sample were calculated using respective standard curves (R2 > 0.99 for each composition) based on standards purchased from Chengdu Push Bio-technology (Sichuan, China). Three flavonoids (quercetin, kaempferol and isorhamnetin) and four lactones (ginkgolide A, B, C and bilobalide) were identified by comparing the retention times with those of standard solutions under the same HPLC conditions. All samples were analyzed using the same HPLC column and system.

2.4. Data Analysis

The data were processed using SPSS v19.0 software (IBM Inc., Chicago, IL, USA). One-way analysis of variance (ANOVA; with post hoc Duncan’s multiple range test with a probability p < 0.05 and p < 0.01) was used to analyze the differences in concentrations of SMs among ten populations, and Pearson’s correlations between pairs of SMs and geographic climate factors were calculated. Prior to the ANOVA and Pearson’s correlation analysis, all SMs data were tested for normality with the Shapiro–Wilk W test and for homogeneity of variance with the Levene’s test, and the non-normal data were logarithmic transformed. The histograms were completed using Origin v8.5 software (Origin Lab Corporation, Hampton, MA, USA). The total concentrations of SMs were calculated by the following formulas:
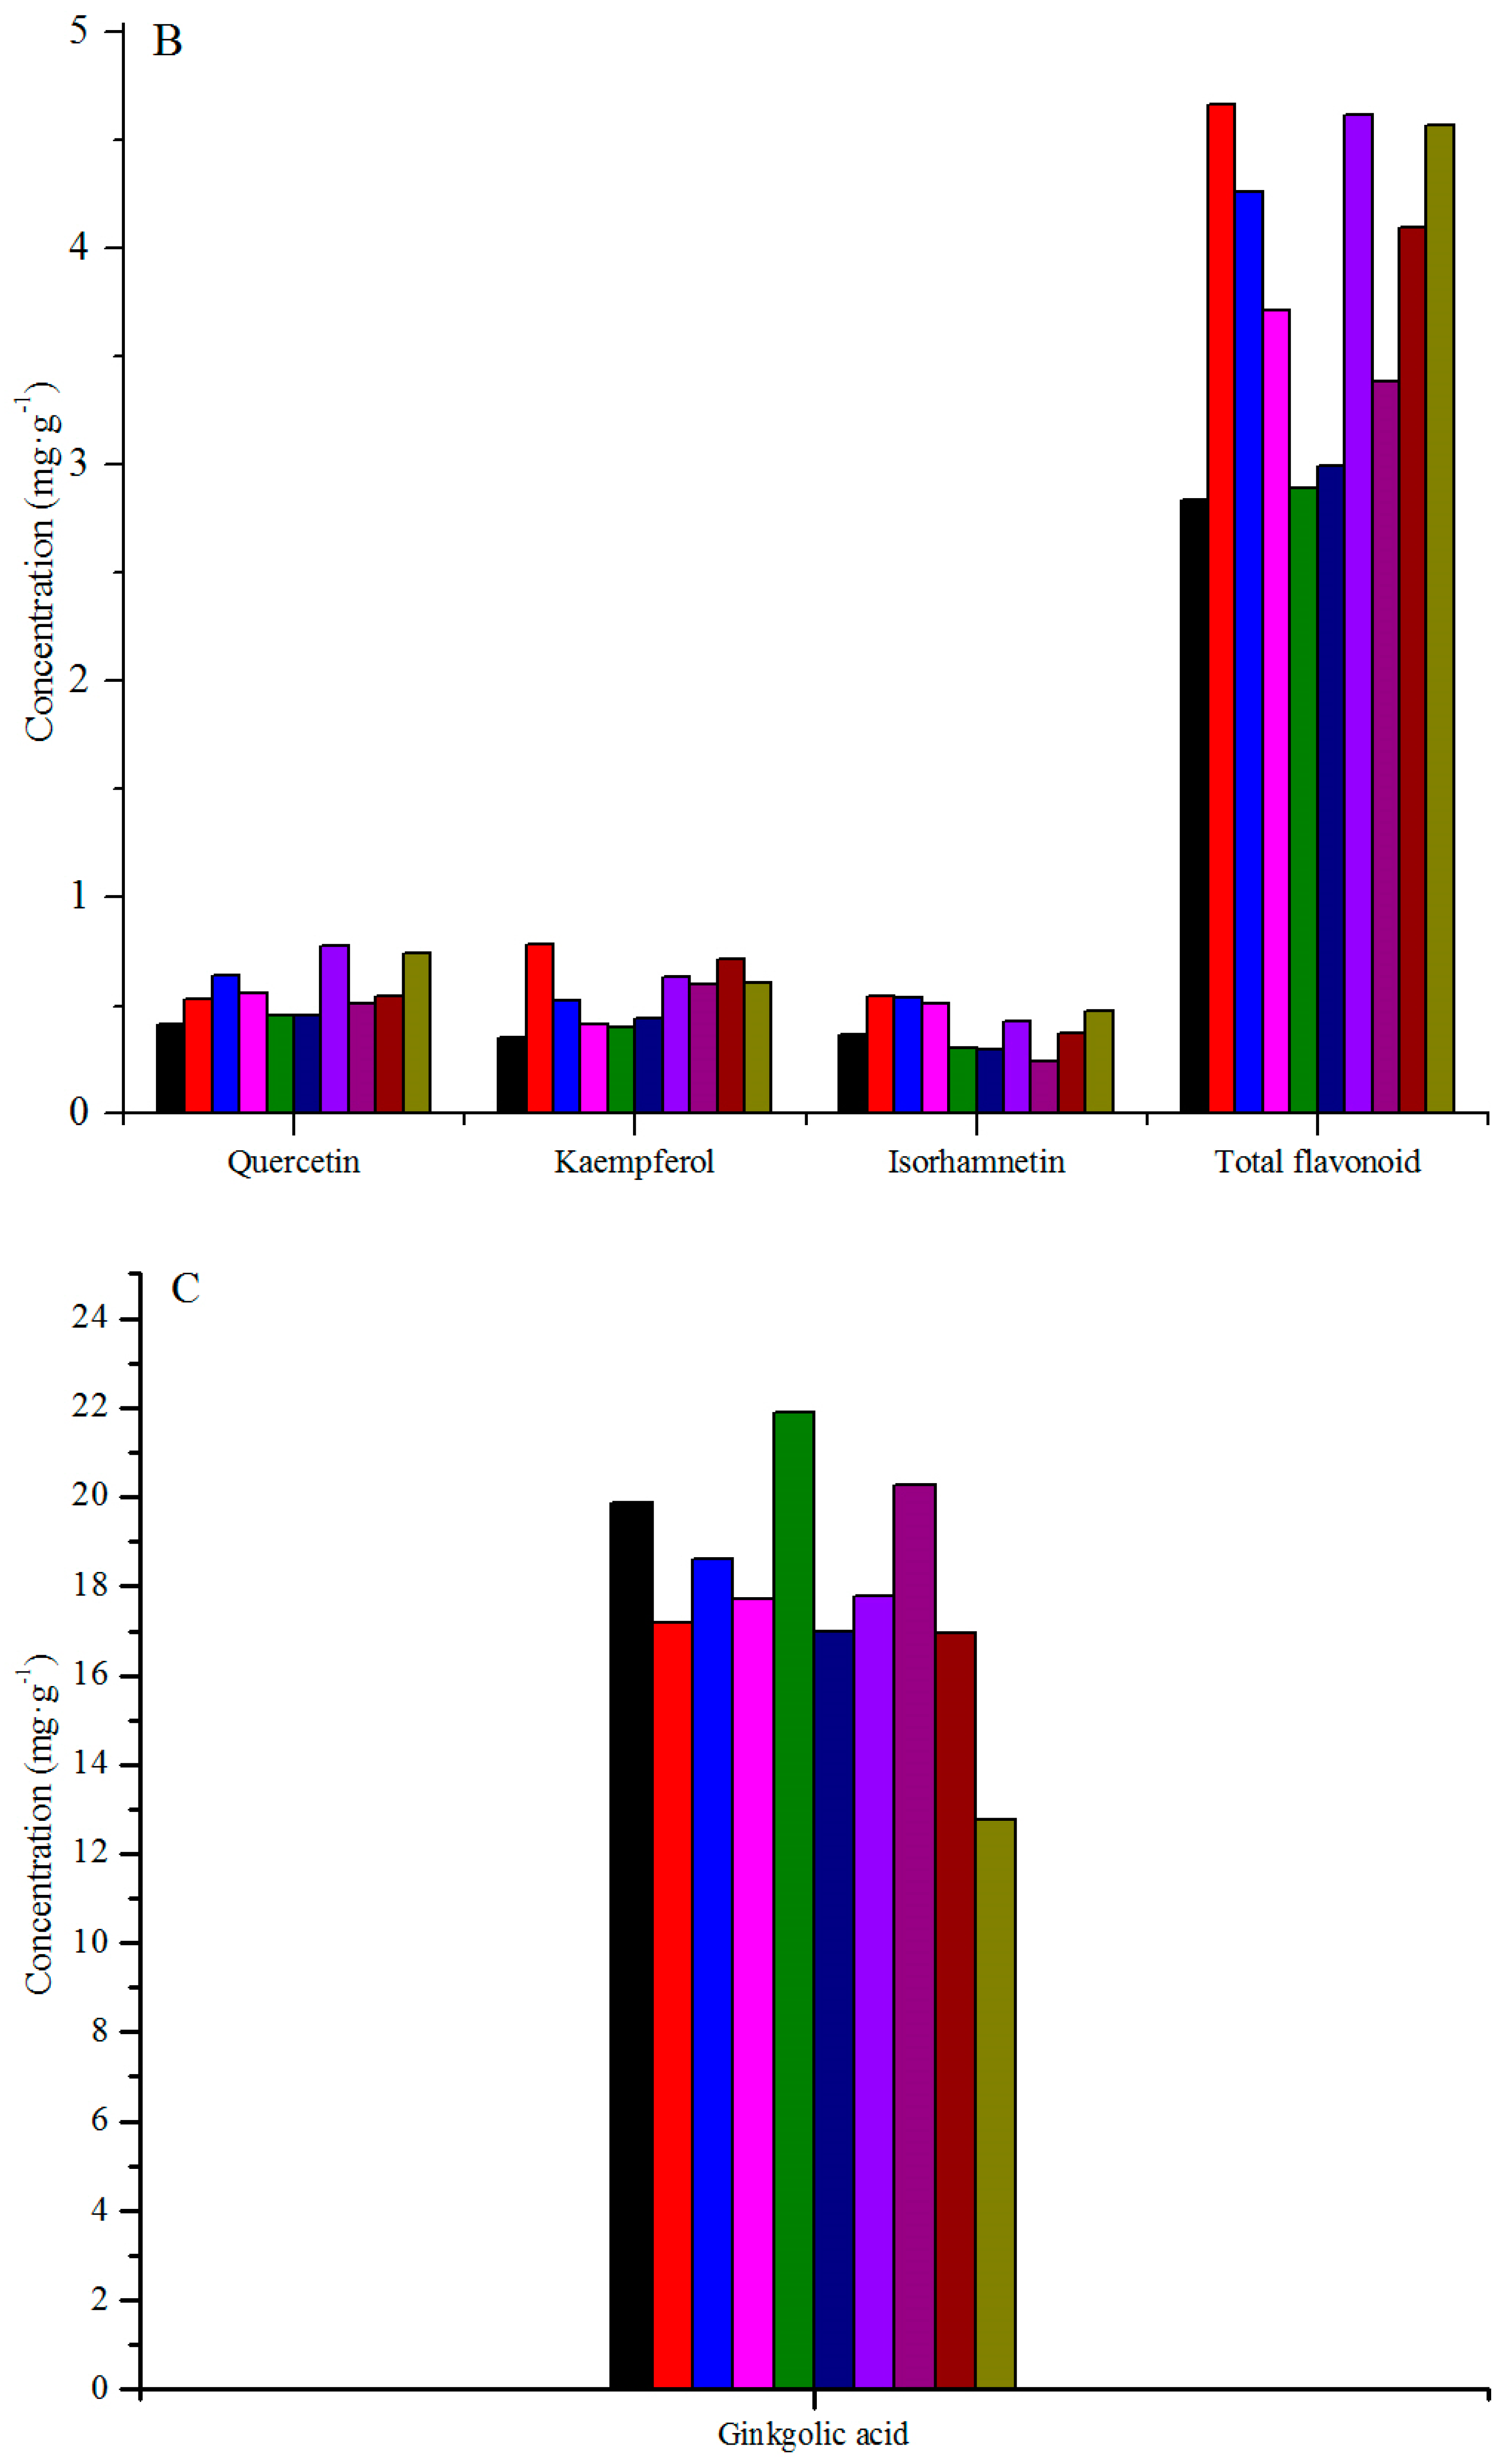
  • Total flavonoid = (quercetin + kaempferol + isorhamnetin) × 2.51 [18];
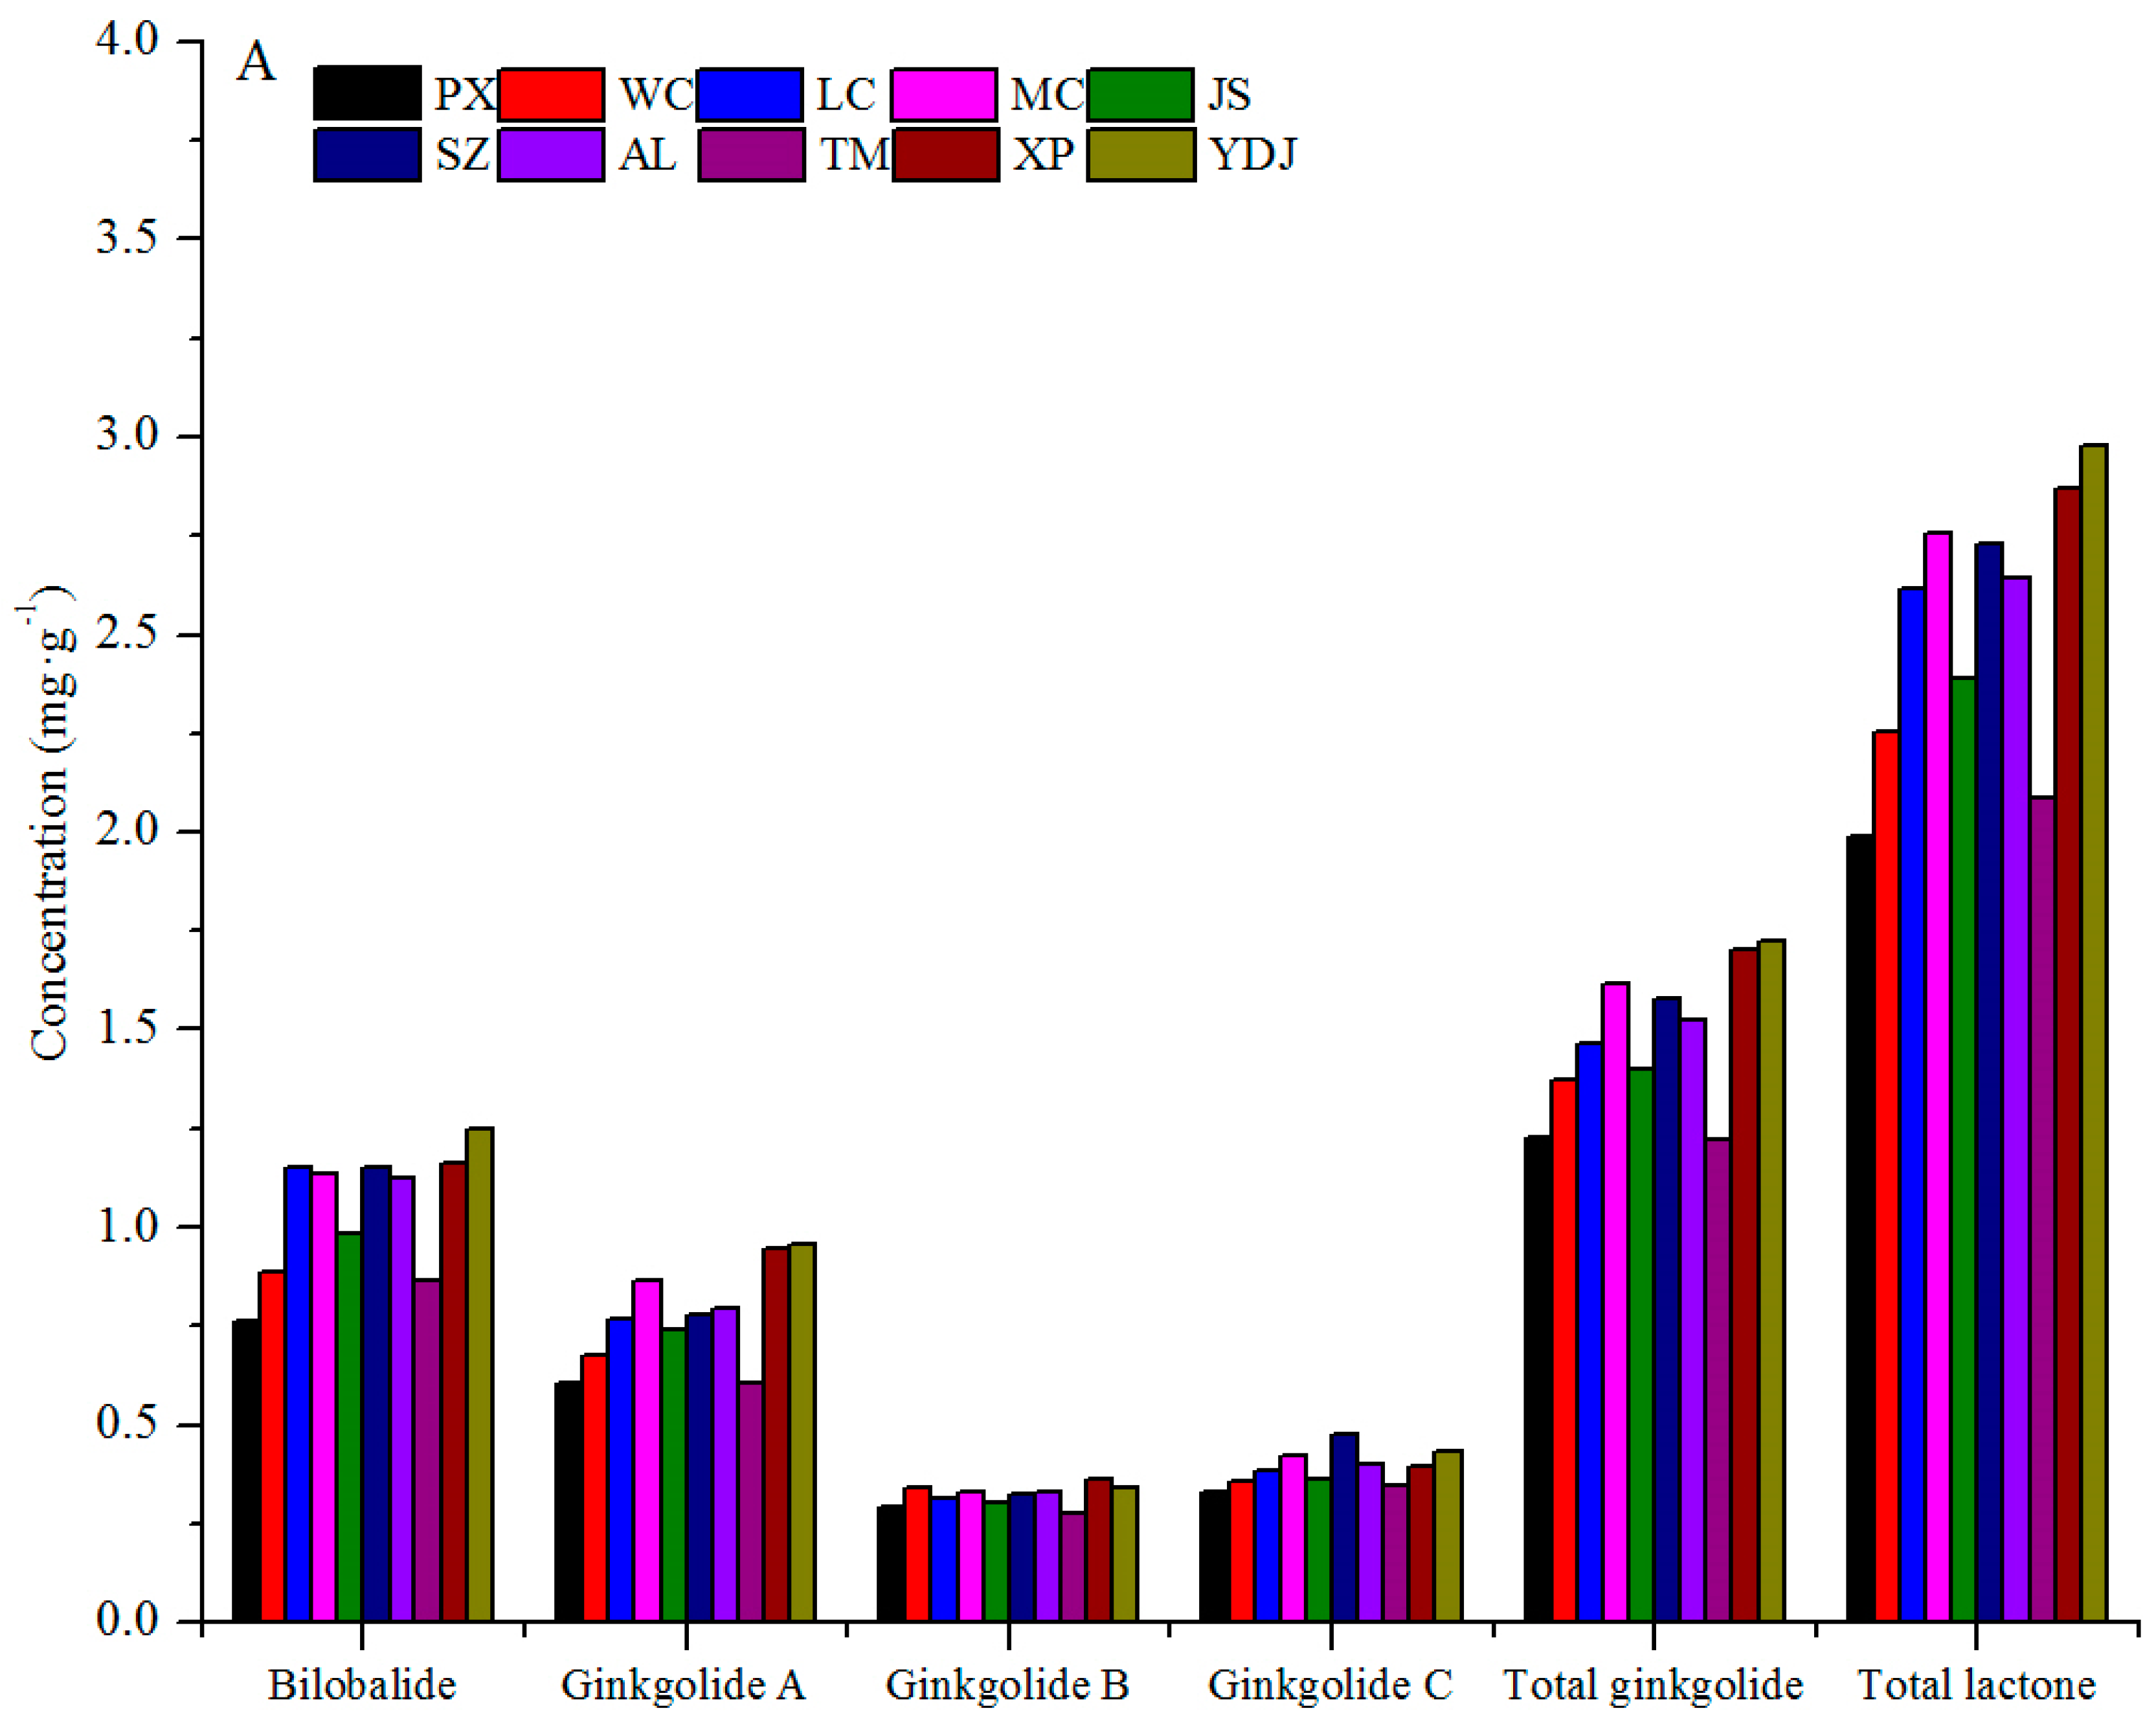
  • Ginkgolide = ginkgolide A + ginkgolide B + ginkgolide C;
  • Total lactone = ginkgolide + bilobalide.

3. Results and Discussion

3.1. Variation among Geographical Populations

The differences in concentrations of SMs among ten geographical populations are shown in Table 2. The average concentrations of SMs in dry leaves from 10 populations are presented in Figure 2. Of the three types of SMs, the concentration of ginkgolic acid was greatest and ranged from 12.76 mg·g−1 dw to 21.90 mg·g−1 dw, with an average of 18.00 mg·g−1 dw. This was followed by flavonoids which ranged from 2.84 mg·g−1 dw to 4.67 mg·g−1 dw, with an average of 3.80 mg·g−1 dw. The concentration of lactone was lowest and ranged from 1.22 mg·g−1 dw to 1.62 mg·g−1 dw for total ginkgolide (with an average of 1.48 mg·g−1 dw), and 1.99 mg·g−1 dw–2.98 mg·g−1 dw for total lactone (with an average of 2.53 mg·g−1 dw). The concentrations of bilobalide were greater than those of ginkgolide (A, B, C). The total lactone concentrations in Ginkgo trees from Shanxi province in China ranged from 1.9 mg·g−1 dw to 4.6 mg·g−1 dw [27], while the total flavonoid and total lactone concentrations in two-year-old Ginkgo seedlings from six provinces in China ranged from 7.4 mg·g−1 dw to 15.0 mg·g−1 dw and 1.52 mg·g−1 dw to 3.19 mg·g−1 dw, respectively [28]. Thus, the concentrations of SMs in our study were reasonable. The flavonoid concentrations in our study were lower than those in previous studies, which may be due to the different age of samples and seasonal changes in SMs concentration in Ginkgo leaves [33,34,35]. The concentration of flavonoids and lactones would be higher, if leaves of 298 samples were collected before and after May and September.
The concentrations of total lactone in the leaves of population Panxian (PX) and Tianmu (TM) were significantly lower than those of other populations with the exception of population Wuchuan (WC) (p < 0.05; Table 2; Figure 2A). In addition, the concentrations of the lactones (except ginkoglide B) in leaves of population Yingdianjie (YDJ) were significantly higher than those of other populations (p < 0.05), with the exception of population Xiaopu (XP), Mochuan (MC), Suizhou (SZ) and Anlu (AL), suggesting that the population YDJ was a preferential choice for Ginkgo plantation.
The population WC, AL and YDJ had significantly higher concentrations of total flavonoid than the other populations (p < 0.05; Table 2; Figure 2B), with the exception of population LC and XP. Population PX and Jingshan (JS) had significantly lower concentrations of total flavonoid (p < 0.05), with the exception of population TM and SZ. Of flavonoid components, the concentrations of kaempferol in population WC were significantly higher than those of other populations (p < 0.05) with the exception of population XP, while the concentrations of quercetin in population AL were significantly higher than those of other populations (p < 0.05), with the exception of population YDJ. The lowest concentration of isorhamnetin was found in population TM. Hence, when selecting excellent trees for extract of flavonoid, populations WC, AL and YDJ were preferential choices.
The laws of variation in concentration of ginkgolic acid among the populations were different from those of flavonoids and lactones (Figure 2C). Population YDJ with the highest concentrations of total lactone, which also had high concentrations of total flavonoid (slightly lower than populations WC and AL), had significantly lower concentrations of ginkgolic acid than other populations (p < 0.01; Table 2). Populations PX and TM with low concentrations of flavonoids and lactones had higher concentrations of ginkgolic acid than other populations, with the exception of population JS, which had the highest concentrations of ginkgolic acid.
Grafting has long been used to produce superior tree clones for conservation and breeding, and grafting of a species is more successful on the stock of the same species [36,37]. In this study, all Ginkgo clones were grafted onto three-year-old Ginkgo seedlings and grown under the same environmental conditions, thus environmental effects on the concentrations of SMs were removed; in addition, the high (or low) concentrations of SMs in leaves from the ten populations did not depend on the similar (or dissimilar) growth conditions to their natural origins. Therefore, the significant variations detected were mainly caused by genetic factors, and the variation in SMs may reflect a large degree of genotypic variation, suggesting that the selection among populations was effective. Flavonoids and lactones are beneficial for human health [4,5,6,7,8,9,10,11,12,13], while ginkgolic acid is not [16,17]. Cultivars, which have high concentrations of flavonoids and lactones, would be appreciated, if they also have a low concentration of ginkgolic acid. Of ten populations, population YDJ had the highest concentration of total lactone and a high concentration of total flavonoid, while the concentration of ginkgolic acid in it was the lowest. Hence, in order to extract the SMs, population YDJ was the preferred choice in Nanjing and its surrounding areas, such as Jiangsu and Shandong provinces, where the most important plantation areas for Ginkgo in China were located, and it should be further tested, when applied in a wider area. Furthermore, considerable geographical variations among the populations may provide a good foundation for the selection of excellent cultivars. Variations in concentrations of flavonoids in Ginkgo leaves have not been found among geographic populations. However, significant differences in the concentrations of flavonoids among populations of Cyclocarya paliurus [38], Matricaria recutita [39] and Epimedium sagittatum [19] have been found.

3.2. Correlations between Pairs of Concentrations and Geographical Climate Factors

Correlation analysis to determine relationships among the concentrations of SMs was carried out (Table 3). Overall, the concentration of ginkgolic acid showed a significant negative correlation with the concentrations of both total flavonoid and total lactone (p < 0.05), which indicated that populations with higher concentrations of flavonoids and lactones also had lower concentrations of ginkgolic acid. The concentrations of total flavonoid had significant correlations with its components (p < 0.05 or p < 0.01); similarly, the concentrations of total ginkgolide and total lactone also had significant correlations with their components (p < 0.05 or p < 0.01). Significant correlations were observed among lactone components, except between ginkgolide B and C (p < 0.05 or p < 0.01).
Ginkgolic acid is a negative indicator [16,17], when flavonoids and lactones are extracted for medical applications. Significant positive [40] correlations were found between the concentrations of flavonoids and lactones in the leaves of two-year-old Ginkgo full-sib families, while negative [28] correlations with no statistical significance were found between these concentrations in the leaves of two-year-old half-sib Ginkgo families from seven regions. However, little research on the correlations between concentrations of ginkgolic acid and flavonoids (or lactones) has been reported. In this study, the concentration of ginkgolic acid had significantly negative correlations with those of total flavonoid and total lactone (p < 0.05), and positive correlations were found between the concentrations of flavonoids and lactones. Hence, it is feasible to select trees with high concentrations of both flavonoids and lactones, and a low concentration of ginkgolic acid. Flavonoids and ginkgolic acid are phenolic compounds, which may have a similar substrate of biosynthesis [41,42,43], and when more of one is produced, less of the other is produced. However, the biosynthetic pathways of phenolic (flavonoids and ginkgolic acid) and terpene compounds (lactones) [44] were independent, and the relationships between them require further study.
The concentrations of SMs in dry leaves from different populations were influenced by geographical climate factors in their original habitats, but only altitude, annual rainfall and the frost-free period had significant effects on the concentrations of SMs (p < 0.05, Table 4). With an increase in annual rainfall and the frost-free period, the concentration of isorhamnetin significantly increased (p < 0.05). The correlation between annual rainfall and the concentrations of flavonoids was also found in other species, such as Gynostemma pentagynum [45]. In addition, with increased altitude, the concentrations of total lactone significantly reduced (p < 0.01), and the concentrations of lactone components (with exception of ginkgolide B) were significantly influenced by altitude (p < 0.05).

3.3. Variation within Geographical Populations

The variations in concentrations of SMs within each population are shown in Table 5, and the coefficient of variation (CV) ranged from 6.76% (ginkgolide C within population PX) to 57.53% (isorhamnetin within population TM), with an overall average of 27.53%. On average, the CVs of each population showed little difference, and ranged from 22.84% (population PX) to 30.78% (population XP); however, the CVs of each SMs concentrations showed many differences, and ranged from 15.74% (ginkgolide C) to 41.33% (isorhamnetin). Furthermore, the concentrations of total flavonoid and components showed the greatest variations, while the concentrations of total lactone and components showed the least variations, followed by ginkoglic acid.
Of the variations in the concentrations of flavonoids within each population, the variations in the concentrations of isorhamnetin (CV = 57.53%) and total flavonoid (CV = 42.09%) within population TM were greater than those within other populations, and the concentrations of quercetin in population SZ (CV = 50.43%) and the concentrations of kaempferol in population WC (CV = 48.88%) showed greater variations than those within other populations. The variation in the concentrations of ginkgolic acid in population XP with a CV of 40.90% was greater than those within other populations.
Population XP showed greater variations in the concentrations of ginkgolide A (35.95%), total ginkgolide (27.40%) and total lactone (29.10%) than other populations. The variations in concentration of bilobalide and ginkgolide C within population LC with a CV of 28.82% (for bilobalide) and 25.10% (for ginkgolide C) were greater than those within other populations. However, the greatest variations in ginkgolide B were found within population WC with a CV of 23.68%.
Although many ancient Ginkgo are widely distributed in China, the plantations for the SMs have been carried out without selection. In this study, the overall CVs of SMs concentrations within 10 populations all exceeded 20.00%, and the highest reached 30.78% (XP). In addition, many individuals had higher concentrations of total flavonoid and lactone than the national standard (4 mg·g−1 dw for total flavonoid and 2.5 mg·g−1 dw for total lactone) [18]. The maximum concentration of total flavonoid and total lactone reached 7.98 mg·g−1 dw (from population AL) and 5.9 mg·g−1 dw (from population XP), respectively. These individuals with higher concentrations of flavonoids and lactones should be included in Ginkgo plantations.

4. Conclusions

For the first time, the concentrations of SMs in dry leaves from different geographical populations were detected, and significant differences among and within populations were found (p < 0.01). The clones were grafted under the same environmental condition; hence, the variations were almost attributed to genetic factors.
The concentrations of both flavonoids and lactones were significantly negatively correlated with that of ginkgolic acid (p < 0.05). A positive correlation was detected between the same types of SMs (p < 0.05 or p < 0.01). Altitude, annual rainfall and the frost-free period had significant effects on the concentrations of SMs (p < 0.05).
Population YDJ was ideal for plantations from which flavonoids and lactones are extracted, followed by populations XP, AL and WC. To obtain ginkgolic acid, population JS may be the ideal choice.
Due to the variations detected within populations, attention should not only be paid to selections among populations, but also within populations. However, a progeny test should be undertaken to determine the heritability of individuals with high concentrations of SMs.

Acknowledgments

This work was supported by the Special Fund for Forest Scientific Research in the Public Welfare (201204403-3) and the Priority Academic Program Development of Jiangsu Higher Education Institutions (PAPD). We wish to thank Prof. Shouxian Huang, Dr. Tiandao Bai (Guangxi University), researcher Xinye Zhang (Hubei Academic of Forestry), and associate researcher Yingang Li (Zhejiang Academic of Forestry) for collecting the plant materials in the wild.

Author Contributions

All authors conceived and designed the experiments; Qi Zhou, Kemin Mu, Zhouxian Ni, and Jianwen Wang collected the samples; Qi Zhou, Kemin Mu, and Xueying Ma performed the experiments; Qi Zhou and Kemin Mu analyzed the data, with contributions from Meng Xu and Li-an Xu. Qi Zhou wrote the paper.

Conflicts of Interest

The authors declare no conflict of interest.

References

  1. Zhou, Z.Y.; Zheng, S.L. Palaeobiology: The missing link in Ginkgo evolution. Nature 2003, 423, 821–822. [Google Scholar] [CrossRef] [PubMed]
  2. Wang, Y.; Liu, Y.; Wu, Q.; Yao, X.; Cheng, Z.Q. Rapid and sensitive determination of major active ingredients and toxic components in Ginkgo biloba leaves extract (EGb 761) by a validated UPLC–MS-MS Method. J. Chromatogr. Sci. 2017, 4, 459–464. [Google Scholar] [CrossRef]
  3. Yu, F.C.; Lai, S.M.; Suen, S.Y. Extraction of flavonoid glycosides from Ginkgo biloba leaves and their adsorption separations using hydrophobic and anion-exchange membranes. Sep. Sci. Technol. 2003, 5, 1033–1050. [Google Scholar] [CrossRef]
  4. Tian, Y.M.; Tian, H.J.; Zhang, G.Y.; Dai, Y.R. Effects of Ginkgo biloba extract (EGb 761) on hydroxyl radical-induced thymocyte apoptosis and on age-related thymic atrophy and peripheral immune dysfunctions in mice. Mech. Ageing Dev. 2003, 8, 977–983. [Google Scholar] [CrossRef]
  5. Brown, D.M.; Kelly, G.E.; Husband, A.J. Flavonoid compounds in maintenance of prostate health and prevention and treatment of cancer. Mol. Biotechnol. 2005, 3, 253–270. [Google Scholar] [CrossRef]
  6. Moon, Y.J.; Wang, X.D.; Morris, M.E. Dietary flavonoids: Effects on xenobiotic and carcinogen metabolism. Toxicol. In Vitro 2006, 2, 187–210. [Google Scholar] [CrossRef] [PubMed]
  7. Niering, P.; Michels, G.; Wätjen, W.; Ohler, S.; Steffan, B.; Chovolou, Y.; Kampkotter, A.; Proksch, P.; Kahl, R. Protective and detrimental effects of kaempferol in rat H4IIE cells: Implication of oxidative stress and apoptosis. Toxicol. Appl. Pharm. 2005, 2, 114–122. [Google Scholar] [CrossRef] [PubMed]
  8. Heim, K.E.; Tagliaferro, A.R.; Bobilya, D.J. Flavonoid antioxidants: Chemistry, metabolism and structure-activity relationships. J. Nutr. Biochem. 2002, 10, 572–584. [Google Scholar] [CrossRef]
  9. Seufi, A.M.; Ibrahim, S.S.; Elmaghraby, T.K.; Hafez, E.E. Preventive effect of the flavonoid, quercetin, on hepatic cancer in rats via oxidant/antioxidant activity: Molecular and histological evidences. J. Exp. Clin. Cancer Res. 2009, 1, 80–87. [Google Scholar] [CrossRef] [PubMed]
  10. Esmaillzadeh, A.; Azadbakht, L. Dietary flavonoid intake and cardiovascular mortality. Brit. J. Nutr. 2008, 4, 695–697. [Google Scholar] [CrossRef] [PubMed]
  11. Van Beek, T.A. Chemical analysis of Ginkgo biloba leaves and extracts. J. Chromatogr. A 2002, 1, 21–55. [Google Scholar] [CrossRef]
  12. Kondratskaya, E.L.; Krishtal, O.A. Effects of Ginkgo biloba extract constituents on glycine-activated strychnine-sensitive receptors in hippocampal pyramidal neurons of the rat. Neurophysiology 2002, 2, 155–157. [Google Scholar] [CrossRef]
  13. Zhu, G.Y.; Zhu, X.L.; Geng, Q.X.; Zhang, X.H.; Shao, J.H. Change of peripheral blood monocytes derived macrophage scavenger receptors activity in patients with coronary heart disease, and the intervention effect of Ginkgo biloba extract. Chin. J. Integr. Tradit. West. Med. 2004, 12, 1069–1072, (In Chinese with English abstract). [Google Scholar]
  14. Furukawa, S. Constituents of Ginkgo biloba L. leaves. Sci. Papers Inst. Phys. Chem. Res. 1932, 19, 27–38. [Google Scholar]
  15. Itokawa, H.; Totsuka, N.; Nakahara, K.; Takeya, K.; Lepoittevin, J.P.; Asakawa, Y. Antitumor principles from Ginkgo biloba L. Chem. Pharm. Bull. 1987, 35, 3016–3020. [Google Scholar] [CrossRef] [PubMed]
  16. Hecker, H.; Johannisson, R.; Koch, E.; Siegers, C.P. In vitro evaluation of the cytotoxic potential of alkylphenols from Ginkgo biloba L. Toxicology 2002, 177, 167–177. [Google Scholar] [CrossRef]
  17. Baron-Ruppert, G.; Luepke, N.P. Evidence for toxic effects of alkylphenols from Ginkgo biloba in the hen’s egg test (HET). Phytomedicine 2001, 8, 133–138. [Google Scholar] [CrossRef] [PubMed]
  18. Chinese, P.C. Pharmacopoeia of the People’s Republic of China; China Medico-Pharmaceutical Science & Technology Publishing House: Beijing, China, 2010. (In Chinese) [Google Scholar]
  19. Chen, J.J.; Xu, Y.Q.; Wei, G.Y.; Liao, S.H.; Zhang, Y.J.; Huang, W.J.; Yuan, L.; Wang, Y. Chemotypic and genetic diversity in Epimedium sagittatum from different geographical regions of China. Phytochemistry 2015, 116, 180–187. [Google Scholar] [CrossRef] [PubMed]
  20. Brinckmann, J.A. Emerging importance of geographical indications and designations of origin–authenticating geo-authentic botanicals and implications for phytotherapy. Phytother. Res. 2013, 27, 1581–1587. [Google Scholar] [CrossRef] [PubMed]
  21. Zhao, Z.; Guo, P.; Brand, E. The formation of daodi medicinal materials. J. Ethnopharmacol. 2012, 140, 476–481. [Google Scholar] [CrossRef] [PubMed]
  22. Kliebenstein, D.J.; Lambrix, V.M.; Reichelt, M.; Gershenzon, J.; Mitchell-Olds, T. Gene duplication in the diversification of secondary metabolism: Tandem 2-oxoglutarate-dependent dioxygenases control glucosinolate biosynthesis in Arabidopsis. Plant Cell 2001, 13, 681–693. [Google Scholar] [CrossRef] [PubMed]
  23. Schlag, E.M.; McIntosh, M.S. The relationship between genetic and chemotypic diversity in American ginseng (Panax quinquefolius L.). Phytochemistry 2013, 93, 96–104. [Google Scholar] [CrossRef] [PubMed]
  24. Suhre, K.; Gieger, C. Genetic variation in metabolic phenotypes: Study designs and applications. Nat. Rev. Genet. 2012, 13, 759–769. [Google Scholar] [CrossRef] [PubMed]
  25. Gong, W.; Chen, C.; Dobeš, C.; Fu, C.X.; Koch, M.A. Phylogeography of a living fossil: Pleistocene glaciations forced Ginkgo biloba L. (Ginkgoaceae) into two refuge areas in China with limited subsequent postglacial expansion. Mol. Phylogenet. Evol. 2008, 48, 1094–1105. [Google Scholar] [CrossRef] [PubMed]
  26. Shen, L.; Chen, X.Y.; Zhang, X.; Li, Y.Y.; Fu, C.X.; Qiu, Y.X. Genetic variation of Ginkgo biloba L. (Ginkgoaceae) based on cpDNA PCR-RFLPs: Inference of glacial refugia. Heredity 2005, 94, 396–401. [Google Scholar] [CrossRef] [PubMed]
  27. Qiao, D.K.; Tang, D.R.; He, J.L.; Chen, D. Correlation analysis between growth indices and contents of of ginkgolides in the leaves of Ginkgo biloba in Shaanxi. J. NW For. Univ. 2009, 3, 49–53, (In Chinese with English abstract). [Google Scholar]
  28. Xue, P.; Li, B.H.; Xiao, X.H.; Zhang, Y.Y. Genetic variation of the chemical constituents in Ginkgo leaves. Econ. Forest Res. 2000, 3, 31–33, (In Chinese with English abstract). [Google Scholar]
  29. Yu, W.W.; Liu, X.L.; Cao, F.L.; Wang, G.B.; Zhang, W.X. Cluster analysis on the main medicinal components in differential leaves of Ginkgo clones. Chin. Bull. Bot. 2014, 3, 292–305, (In Chinese with English abstract). [Google Scholar]
  30. Wang, Y.Q.; Xu, L.; Cao, F.L.; Chen, T.C.; Yan, Y.H.; Lei, M.; Chen, Y.; Tang, Y.; Jiang, G.B.; Wang, G.B. Optimization of homogenization conditions for the extraction of proanthocyanidin from Ginkgo biloba leaves using response surface methodology. Food Sci. 2012, 22, 12–16, (In Chinese with English abstract). [Google Scholar]
  31. Zhao, C.J.; Zu, Y.G.; Fu, Y.J.; Li, C.Y.; Wang, Y.B.; Hou, C.L. Homogenated extraction of total flavonoids from fruits of sea buckthom (Hippophae rhamnoides L.). Chem. Ind. For. Prod. 2006, 2, 38–40, (In Chinese with English abstract). [Google Scholar]
  32. Ma, Y.C.; Mani, A.; Cai, Y.L.; Thomson, J.; Ma, J.; Peudru, F.; Chen, S.; Luo, M.; Zhang, J.Z.; Chapman, R.G.; et al. An effective identification and quantification method for Ginkgo biloba flavonol glycosides with targeted evaluation of adulterated products. Phytomedicine 2016, 4, 377–387. [Google Scholar] [CrossRef] [PubMed]
  33. Hasler, A.; Sticher, O.; Meier, B. Identification and determination of the flavonoids from Ginkgo biloba by high-performance liquid chromatography. J. Chromatogr. A 1992, 1, 41–48. [Google Scholar] [CrossRef]
  34. Lobstein, A.; Rietsch-Jako, L.; Haag-Berrurier, M.; Anton, R. Seasonal variations of the flavonoid content from Ginkgo biloba leaves. Planta Med. 1991, 5, 430–433. [Google Scholar] [CrossRef] [PubMed]
  35. Sun, X.L.; Zhou, J.C.; Long, H.P.; Han, L.L. Total flavonol glucoside and lactone content changes of flavonol glucoside in different growing seasons. Cent. South Pharm. 2009, 8, 564–567, (In Chinese with English abstract). [Google Scholar]
  36. Duan, H.J.; Cao, S.; Zheng, H.Q.; Hu, D.H.; Lin, J.; Lin, H.Z.; Hu, R.Y.; Sun, Y.H.; Li, Y. Variation in the Growth Traits and Wood Properties of Chinese Fir from Six Provinces of Southern China. Forests 2016, 7, 192. [Google Scholar] [CrossRef]
  37. Zheng, H.Q.; Hu, D.H.; Wang, R.H.; Wei, R.P.; Yan, S. Assessing 62 Chinese Fir (Cunninghamia lanceolata) breeding parents in a 12-year grafted clone test. Forests 2015, 6, 3799–3808. [Google Scholar] [CrossRef]
  38. Yang, W.X.; She, C.Q.; Fang, S.Z. Geographic variation of flavonoid compounds in Cyclocarya paliurus leaves. J. Zhejiang For. Coll. 2009, 4, 522–527, (In Chinese with English abstract). [Google Scholar]
  39. Gosztola, B.; Németh-Zámbori, É. Variability of total flavonoid and mucilage content of wild growing chamomile (Matricaria recutita L.) populations. Julius-Kühn-Archiv 2016, 453, 112–114. [Google Scholar] [CrossRef]
  40. Xie, B.D.; Wang, H.T. Effects of light spectrum and photoperiod on contents of flavonoid and terpene in leaves of Ginkgo biloba L. J. Nanjing For. Univ. 2006, 2, 51–54, (In Chinese with English abstract). [Google Scholar]
  41. Elmastaş, M.; Demir, A.; Genx, N.; Dölek, Ü.; Gxneş, M. Changes in flavonoid and phenolic acid contents in some Rosa species during ripening. Food Chem. 2017, 235, 154–159. [Google Scholar] [CrossRef] [PubMed]
  42. Robbins, R.J. Phenolic acids in foods: An overview of analytical methodology. J. Agric. Food Chem. 2003, 10, 2866–2887. [Google Scholar] [CrossRef] [PubMed]
  43. Schijlen, E.G.; De Vos, C.R.; Van Tunen, A.J.; Bovy, A.G. Modification of flavonoid biosynthesis in crop plants. Phytochemistry 2004, 19, 2631–2648. [Google Scholar] [CrossRef] [PubMed]
  44. Lu, X.; Yang, H.; Liu, X.G.; Shen, Q.; Wang, N.; Qi, L.W.; Li, P. Combining metabolic profiling and gene expression analysis to reveal the biosynthesis site and transport of ginkgolides in Ginkgo biloba L. Front. Plant Sci. 2017, 8, 1–11. [Google Scholar] [CrossRef] [PubMed]
  45. Li, Z.Y.; Liu, S.B. Study on leaf shape variation and total flavonoids in different populations of Gynostemma pentagynum Z.P. Wang. Amino Acids Biot. Res. 2015, 4, 53–56, (In Chinese with English abstract). [Google Scholar]
Figure 1. Geographical distribution of the 10 populations of G. biloba. The 10 populations come from the major areas with centralized distributions of ancient Ginkgo trees in China. Codes for the population are given in Table 1.
Forests 08 00266 g001
Figure 2. Concentrations of lactones (A), flavonoids (B), ginkgolic acid (C) in dry leaves from ten populations. The data represent mean concentrations of three types of secondary metabolites (SMs).
Forests 08 00266 g002aForests 08 00266 g002b
Table 1. Location, and some characteristics (longitude, latitude, elevation, frost-free period, annual rainfall and sample size (N)) of 10 populations of G. biloba.
PopulationLocationLongitude (East)Latitude (North)Elevation (m)Frost-Free Period (Day)Annual Rainfall (mm)N
1.PXPanxian, Guizhou104°31′25°36′1619271139032
2.WCWuchuan, Guizhou108°8′28°38′994280127222
3.LCLingchuan, Guangxi110°33′25°18′323318192628
4.MCMochuan, Guangxi110°48′25°29′325293184229
5.JSJingshan, Hubei113°3′31°16′238230108532
6.SZSuizhou, Hubei113°18′31°26′23523096831
7.ALAnlu, Hubei113°20′31°24′120246110033
8.TMMt. Tianmu, Zhejiang119°26′30°19′48123495634
9.XPXiaopu, Zhejiang119°47′31°1′64240130931
10.YDJYingdianjie, Zhejiang120°5′28°49′166236137426
Total 298
Note: The population orders were from the west to the east.
Table 2. Differences in SMs concentrations in dry leaves from different G. biloba populations.
SMsPXWCLCMCJSSZALTMXPYDJ
Q **e (C)cde (BC)bc (AB)cd (BC)de (C)de (C)a (A)cde (BC)cde (BC)ab (A)
K **e (E)a (A)cd (CDE)de (E)de (E)de (DE)bc (ABC)bc (BCD)ab (AB)bc (BCD)
I **bcd (ABC)a (A)a (A)ab (AB)cd (BC)cd (BC)abc (ABC)d (C)bcd (ABC)ab (AB)
TF **e (C)a (A)ab (AB)bcd (ABC)e (C)de (C)a (A)cde (BC)abc (AB)a (A)
B **c (D)bc (CD)a (AB)a (AB)b (BC)a (AB)a (AB)bc (CD)a (AB)a (A)
GA **d (F)cd (DEF)bc (BCD)ab (ABC)bc (CDE)bc (BCD)a (ABCD)d (EF)a (AB)a (A)
GB **de (CD)ab (AB)bcd (BCD)abc (ABC)cd (BCD)abc (ABC)abc (ABC)e (D)a (A)abc (AB)
GC **e (D)cde (BCD)bcd (ABC)ab (A)cde (BCD)a (A)ab (AB)de (CD)abc (ABC)a (A)
TG **g (E)ef (DE)cde (BCD)abc (ABC)de (CDE)abcd (ABCD)bcde (ABCD)fg (E)ab (AB)a (A)
TL **f (E)de (CDE)bc (ABC)ab (AB)cd (BCD)ab (AB)abc (AB)ef (DE)ab (A)a (A)
G **abc (AB)bc (B)bc (AB)bc (B)a (A)c (B)bc (B)ab (AB)c (B)e (C)
Note: Q = quercetin; K = kaempferol; I = isorhamnetin; TF = total flavonoid; B = bilobalide; GA = ginkgolide A; GB = ginkgolide B; GC = ginkgolide C; TG = total ginkgolide; TL = total lactone; G = ginkgolic acid; the significance levels for one-way ANOVA across SMs concentrations are indicated beneath each variable; ** p < 0.01; different lowercase letters within the same row indicate significant differences between populations at p < 0.05 (Duncan’s multiple range test); different uppercase letters in parentheses within the same row indicate significant differences between populations at p < 0.01 (Duncan’s multiple range test).
Table 3. The correlation between concentrations of SMs at the level of population (n = 10).
SMsQKITFBGAGBGCTGTLG
Q1
K0.4511
I0.5090.3031
TF0.826 **0.791 **0.727 *1
B0.6180.1400.3210.4451
GA0.5240.2110.3350.4450.904 **1
GB0.3710.5190.5410.6070.640 *0.780 **1
GC0.325−0.0440.1140.1560.833 **0.680 *0.5351
TG0.4990.2120.3390.4370.930 **0.979 **0.821 **0.800 **1
TL0.5660.1810.3370.4490.981 **0.960 **0.748 *0.830 **0.984 **1
G−0.586−0.437−0.476−0.634 *−0.652 *−0.695 *−0.701 *−0.635 *−0.744 *−0.713 *1
Note: Q = quercetin; K = kaempferol; I = isorhamnetin; TF = total flavonoid; B = bilobalide; GA = ginkgolide A; GB = ginkgolide B; GC = ginkgolide C; TG = total ginkgolide; TL = total lactone; G = ginkgolic acid;* p < 0.05; ** p < 0.01.
Table 4. The correlation between the concentrations of SMs and geographical climate factors, including longitude, latitude, altitude, annual rainfall, mean annual temperature and frost-free period.
SMsLongitudeLatitudeAltitudeAnnual RainfallMean Annual TemperatureFrost-Free Period
Q0.3620.039−0.5040.2190.3670.092
K0.3980.34−0.206−0.172−0.204−0.074
I−0.335−0.60.0470.762 *0.5650.760 *
TF0.224−0.035−0.2950.2850.2590.28
B0.5120.153−0.833 **0.2780.456−0.047
GA0.5370.131−0.708 *0.290.277−0.117
GB0.1860.133−0.3820.2160.0190.046
GC0.3270.232−0.638 *0.0270.186−0.188
TG0.4830.17−0.708 *0.2380.241−0.123
TL0.5060.165−0.781 **0.2630.35−0.088
G−0.3690.0060.291−0.164−0.0270.051
Note: Q = quercetin; K = kaempferol; I = isorhamnetin; TF = total flavonoid; B = bilobalide; GA = ginkgolide A; GB = ginkgolide B; GC = ginkgolide C; TG = total ginkgolide; TL = total lactone; G = ginkgolic acid; * p < 0.05; ** p < 0.01.
Table 5. Minimum value, maximum value and variation coefficients (CV) of concentrations of SMs within each population.
SMs PXWCLCMCJSSZALTMXPYDJMean CV%
Min0.180.230.270.210.170.180.360.170.180.3237.37
QMax0.760.940.960.830.980.961.250.950.831.20
CV%32.7741.7927.1533.7746.1350.4331.4445.5732.0432.63
Min0.100.240.200.200.160.140.210.170.310.2440.38
KMax0.671.341.110.730.700.881.271.111.341.23
CV%39.6948.8837.1630.4841.9248.6139.5344.2837.9235.35
IMin0.100.120.150.210.080.110.130.090.170.2441.33
Max0.690.770.940.890.490.600.810.600.690.71
CV%42.3546.6039.1139.0237.2542.5540.3857.5340.7227.82
TFMin1.081.631.541.591.141.251.831.441.672.2134.37
Max5.336.736.595.764.745.587.985.836.047.24
CV%36.2341.0429.3331.3236.8738.4331.7542.0927.7828.90
BMin0.600.610.620.700.630.700.820.660.720.6521.41
Max1.081.262.031.841.371.711.631.182.002.20
CV%14.5419.8728.8225.5418.6722.2218.5815.0625.4125.38
GAMin0.430.440.470.500.440.430.520.340.460.5226.49
Max0.861.361.281.621.491.331.200.891.921.39
CV%17.2029.9925.9331.3726.5429.1824.1521.6335.9523.00
GBMin0.230.250.230.240.230.240.250.210.240.2318.46
Max0.400.610.500.540.390.540.550.340.600.56
CV%12.5123.6819.2120.0414.4120.3220.3511.1321.2521.71
GCMin0.300.290.300.310.290.330.340.300.300.3015.74
Max0.380.450.790.700.460.580.540.620.680.68
CV%6.7612.1825.1019.7311.3114.2512.5115.2320.1420.19
TGMin0.981.021.021.050.961.021.190.890.991.0719.41
Max1.642.322.312.552.312.242.161.533.202.60
CV%12.2021.5821.8422.2818.4420.9017.2612.7927.4019.44
TLMin1.631.631.771.761.591.721.861.641.611.7420.36
Max2.673.124.344.733.685.723.972.715.904.80
CV%12.5118.3422.3524.6617.7127.8117.8112.4129.1020.91
GMin13.2510.6711.3610.3611.878.769.709.218.138.1827.48
Max29.2026.7435.1024.8136.8924.9225.6529.0928.0022.08
CV%24.5025.0134.8422.7326.7722.9323.1627.2840.9026.71
Mean CV% 22.8429.9028.2627.3626.9130.6925.1727.7330.7825.6427.53
Note: SMs = secondary metabolites; Q = quercetin; K = kaempferol; I = isorhamnetin; TF = total flavonoid; B = bilobalide; GA = ginkgolide A; GB = ginkgolide B; GC = ginkgolide C; TG = total ginkgolide; TL = total lactone; G = ginkgolic acid; CV = standard deviation /mean × 100%; Mean CV = the average of the CVs for each population (or SMs).

