Impacts of Climate Change and Bioenergy Markets on the Profitability of Slash Pine Pulpwood Production in the Southeastern United States


1
School of Forest Resources and Conservation, University of Florida, P.O. Box 110410, Gainesville, FL 32611, USA
2
Clean Energy and Sustainability Analytics Center, Montclair State University, Montclair, NJ 07043, USA
*
Author to whom correspondence should be addressed.
Forests 2018, 9(10), 656; https://doi.org/10.3390/f9100656
Submission received: 19 July 2018
/
Revised: 25 September 2018
/
Accepted: 18 October 2018
/
Published: 20 October 2018
(This article belongs to the Special Issue Forest Bioenergy and Bioproducts)
Abstract
:In this study, we assessed the impacts of climate change on the production of pulpwood and biomass for bioenergy, and the profitability of slash pine stands in the Southeastern United States. We employed the 3-PG (Physiological Processes Predicting Growth) model to determine the effects of future climates on forest growth and integrated it with a stand-level economic model to determine their impacts on optimal forest management. We found that the average production of pulpwood increased for all sites by 7.5 m3 ha−1 for all climatic scenarios and productivity conditions. In the case of forest biomass for bioenergy, the average increase was less than 1 Mg ha−1. Considering a payment for forest biomass for bioenergy of $4.2 per green Mg−1, the land expectation values (LEVs), on average, increased by $242.1 ha−1 under extreme climatic conditions and high productivity conditions. However, the increase in LEVs due to payments for biomass for bioenergy was small, accounting for $23 ha−1. We also found that the combined effect of increased site productivity and climate change reduced the optimal harvest age of slash pine. Our results confirm that emerging bioenergy markets coupled with changing climatic conditions can increase the economic returns for landowners.
1. Introduction
Concerns about greenhouse gas emissions from fossil fuels, rising energy demands, high energy prices, and political stability surrounding the production of foreign oil have led to new policies to diversify energy sources. Forest biomass is a renewable and more carbon-neutral energy resource that could provide a potential solution to the problem of dependency of energy on foreign markets [1,2].
Southern forestlands in the United States (US) occupy approximately 99 million hectares (ha) representing 32% of the total forestland area in the country [3]. This region provides 12% of the world’s industrial roundwood and 19% of the world’s pulp and paper products [4]; and 54% and 74% of the total sawlog and pulpwood production in the country [3]. However, the total US global industrial roundwood share has declined from 28% in 1998 to 17% in 2013 [5]. This has been particularly relevant in the case of pulpwood production; a decline of 33% in 2000 to 28% in 2013 (wood pulp), and 40% in 1960 to 18% in 2013 (paper and paperboard production), primarily due to the growth in electronic media and offshoring of US manufacturing [6]. The promotion of government policies that encourage the use of biomass for bioenergy such as the Energy Independence and Security Act of 2007 through the Renewable Portfolio Standards and the 2014 Farm Bill, coupled with further advances in conversion technologies has also helped develop new opportunities for forest landowners in the region [7]. For example, the use of wood fiber for recently built wood pellet mills has boosted jobs and economic opportunities in Southern US [8].
The development of forest biomass for bioenergy markets is expected to impact other forest product markets [9]. An increased demand for forest bioenergy would lead to intensified forest management, and increase softwood timber prices, providing an incentive for expanding pine plantations in the South [9]. It is expected that the harvesting of biomass for bioenergy would range between 170 and 336 million green tons by 2050 [9], and the area of forest plantations would be increased by 11 million ha [10]. This increase in timber growth is expected predominantly from the production of small diameter timber products with a strong interaction between paper and bioenergy industries [9].
The competition for raw material between bioenergy industries and forest product plants is also a concern with regard to the development of bioenergy markets in the South [7]. Research in this area has shown an increased demand for biomass for bioenergy could boost the prices and production of forest biomass for bioenergy and pulpwood, benefiting forest landowners [10] but negatively impacting pulp mill sectors [1]. Other studies suggest the opposite. For example, Henderson et al. [11] determined with the actual use of pulpwood for pulp mills, the remaining wood fiber would be sufficient for establishing 256 additional wood pellet facilities in the Southern US.
In general, these studies have based their projections on historical data regarding production and timber prices. However, the joint consideration for changes in climatic conditions and bioenergy markets on the production of timber and forest biomass for bioenergy in the Southern US is very limited. An exception is the work of Perdue et al. [12], who determined the profitability potential for loblolly pine for biomass production and modeled the impact of future climates on the pine biomass production. They found that some sites along the coast have the highest potential for biomass for bioenergy production in the region. They also found that the highest economic returns for landowners can be found in North Florida, Southern Alabama, Southern Georgia, and Southern South Carolina.
The main goal of our study was to analyze the impacts of climate change on the production of pulpwood and forest biomass for bioenergy and the optimal stand-level management of slash pine (Pinus elliotti Engelm.) forests in the Southeastern (SE) US. Slash pines is a native, fast-growing, and major commercial species in the Southern US, planted on 4.2 million ha in the region, extending from East Texas, and from South Central Florida to Southern North Carolina [13]. We used the process-based model 3-PG (Physiological Processes Predicting Growth [14]) to assess pulpwood and biomass for energy production under two future representative climatic scenarios in eight sites distributed in four states in the SE US: Alabama, Florida, Georgia, and South Carolina. slash pine forest can generate other forest products such as sawtimber and chip-and-saw. However, we limited our analysis to pulpwood production since the critical role that southern pines play in the production of this forest product in the South. For example, softwood pulpwood removals are expected to increase by 36.8 million m3 by 2055 [9]; and pulpwood production and prices are also more likely to be impacted by forest bioenergy markets [10]. In each site, we explored how future temperatures and precipitation, in addition to prices for forest biomass and bioenergy can affect the profitability of slash pine and the harvesting decision.
The remainder of the paper is as follows: In Section 2, we described the stand-level economic model of slash pine for pulpwood and biomass production, the forest growth simulation model 3-PG, and the climatic scenarios. We also described the application of the model, the different silvicultural criteria, and the economic parameters to determine the impacts of climate change on optimal slash pine management. The findings of this study and the discussion of the results are presented in Section 3 and Section 4, respectively. Finally, we offer concluding remarks.
2. Materials and Methods
2.1. Economic Model Specification and Climatic Scenarios
We determined the impact of payments for forest biomass for bioenergy on the optimal pulpwood management of slash pine using the traditional Faustmann model [15]. This model assumes that the net present value of the pulpwood and biomass for bioenergy benefits after one rotation age – and , respectively, can be modeled as follows:
where and represent, respectively, the pulpwood price and the price of biomass for bioenergy; and represent, respectively, the merchantable pulpwood volume and the volume of non-commercial biomass (top, branches, bark) at time ; is the discount rate, and c represents the forest management costs (we have artificially assumed that all forest management costs are associated to pulpwood production, yet certain silvicultural practices such as fertilization can also favor biomass for bioenergy production.). If pulpwood and biomass for bioenergy production are considered in perpetuity, the net economic benefits for a landowner—the total land expectation value —is as follows:
where and represent, respectively, the land expectation value at time associated with the production of pulpwood and biomass for bioenergy, respectively. The time that maximizes the total is the optimal harvest age. We used the process-based model Physiological Processes Predicting Growth (3-PG, [14]) to determine the impacts of future climatic conditions on the total production of pulpwood and biomass for bioenergy. The 3-PG model, widely employed to model the impacts of changes in climate on the productivity of forests, uses mean monthly temperatures, precipitation, and radiation as the main inputs. The 3-PG model uses species-specific physiological features in conjunction with empirical tree and stand-level attributes to quantify gross primary production and the allocation of carbon to different biomass pools such as roots, foliage, and stem using allometric relationships [14]. In the case of slash pine, the 3-PG was parametrized and validated for a range of sites and ages in the Southeastern US [16]. This version of the 3-PG model includes the current/anticipated concentration of carbon dioxide as an input to model current/future forest productivity. It can also estimate the total stem volume of a slash pine stand that can be converted to merchantable volume by employing the growth and yield model developed by Pienaar et al. [17], see Appendix A.
We considered two main climatic scenarios used in the Intergovernmental Panel on Climate Change’s (IPCC) Fifth Assessment Report [18] to model the impacts of future climate conditions on the production of pulpwood and biomass for bioenergy. These representative concentration pathways (RCP) scenarios represent the trajectory of greenhouse gas emission over time: RCP4.5 (low-to-medium greenhouse gas emissions; moderate scenario) and RCP8.5 (high greenhouse gas emissions; extreme scenarios). We employed the second generation CanESM2 (Canadian Earth system) model, downscaled using the Multivariate Adaptive Constructed Analogs (MACA) approach [19], to obtain future projections of temperatures and precipitation for RCP4.5 and RCP8.5 between 2050 and 2100. The future projections of temperatures and precipitations were used as inputs for the 3-PG model. Likewise, we used the historical temperatures and precipitation between 1950 to 2005 to model slash pine growth under current climatic conditions (baseline scenario) (we employed total annual precipitation, and the mean annual maximum and minimum temperatures (average of the 12 mean monthly maximum and minimum temperatures) for the baseline and future climatic scenarios in our analysis since these variables are requested inputs of the 3-PG model for slash pine [14]).
2.2. Model Application
To determine the impacts of climate change on pulpwood production and forest biomass for bioenergy, in addition to their financial implications for forest landowners, we simulated the three climatic scenarios on the growth of slash pine forests in eight sites across four states in the SE US: Alabama (AL), Florida (FL), Georgia (GA), and South Carolina (SC). These sites were chosen as they were used to validate the performance of the 3-PG model for slash pine—the net primary production–covering a wide range of age, productivity, and management [16]. The distribution of the sites in these states is represented in Figure 1. The different levels of temperatures and precipitation for each of the sites and climatic scenarios are delineated in Table 1.
We applied our economic model under the following forest management conditions. For each site, we considered that slash pine is intensively managed for pulpwood and biomass for bioenergy production with an initial planting density of 2250 trees ha−1 under two levels of productivity, i.e., site index (SI) = 20 and 28 m. Pulpwood was defined based on the minimum commercial diameter outside bark, i.e., top diameter = 7.6 cm. Biomass for bioenergy was considered as the sum of the biomass of branches, tops, and foliage biomass.
We determined the impacts of climate change on the production of pulpwood and biomass for bioenergy (foliage, branches, and tops), by running the 3-PG model for each site with the same SI level. Once the estimates of the total volume of a slash pine and the amount of foliage were obtained, the merchantable volume of pulpwood was determined using the model detailed by Pienaar et al. [17]. The biomass of branches and tops was calculated by subtracting the merchantable stand volume from the total stand volume. Thus, we compared the production of pulpwood and biomass for bioenergy under current climatic conditions (baseline) and the production of pulpwood and biomass for bioenergy under future climatic conditions (scenarios RCP4.5 and RCP8.5). Although climate change impacts the forest productivity gradually over time, we simulated a single jump in terms of the implications of changes in climatic conditions concerning the production of pulpwood and biomass of bioenergy, i.e., what the effect of climate change would be on the economics of slash pine if those changes occurred now.
Depending on the location of the site, we used the real average FL, GA, and SC pine pulpwood prices between the years 2010 to 2017, sourced from Timber Mart South [20], for our economic model. We employed the producer price from the logging industry to deflate the nominal prices using the base year 2017 [21]. To model the price of biomass for bioenergy, we used the value of $4.2 green Mg−1 [22]. The silvicultural costs associated with the site preparation, weed control, planting and seeding operations, and fertilization were obtained from Barlow and Levendis [23], see Table 2.
For each site with the same SI level, we determined the under climate change. We compared the with and without payments for forest biomass for bioenergy under current climatic conditions (baseline) with the with and without payments for forest biomass for bioenergy under future climatic conditions (scenarios RCP4.5 and RCP8.5).
3. Results
3.1. Pulpwood and Biomass for Bioenergy Production
Figure 2 shows the production of pulpwood under historical and future climatic scenarios and different forest productivity conditions for all slash pine sites (as previously discussed in the Model Application, see Section 2.2, the time frame for the future climatic scenario is similar to that of the baseline scenario, i.e., we assumed a slash pine stand that is grown for pulpwood and biomass for bioenergy production under current climate/future climate simultaneously to determine the differences in profitability due to changing climatic conditions). In general, the production of pulpwood increased in moderate (scenario RCP4.5) and extreme climatic conditions (scenario RCP8.5). The exception was the Polk site located in the southern natural distribution limits of slash pine. On average, for SI = 20 m and scenario RCP4.5, the greater increases in pulpwood production between ages 1 and 20 years occurred in sites at Covington (16.7 m3 ha−1), Colleton (15.9 m3 ha−1), and Bradley (16.2 m3 ha−1) compared to the pulpwood production under current climatic conditions. For scenario RCP8.5, the greater increase in pulpwood production occurred in Covington (23.5 m3 ha−1), Colleton (21.2 m3 ha−1), and Santa Rosa (21.2 m3 ha−1). With SI = 28 m, and with the exception of the sites Santa Rosa (scenario RCP4.5) and Bradley (scenario RCP8.5), the pulpwood production increased in a lesser proportion with changing climatic conditions, ranging between 3.6 and 11.3 m3 ha−1 for scenario RCP4.5, and 3.5 and 14.5 m3 ha−1 for scenario RCP8.5, for the other sites.
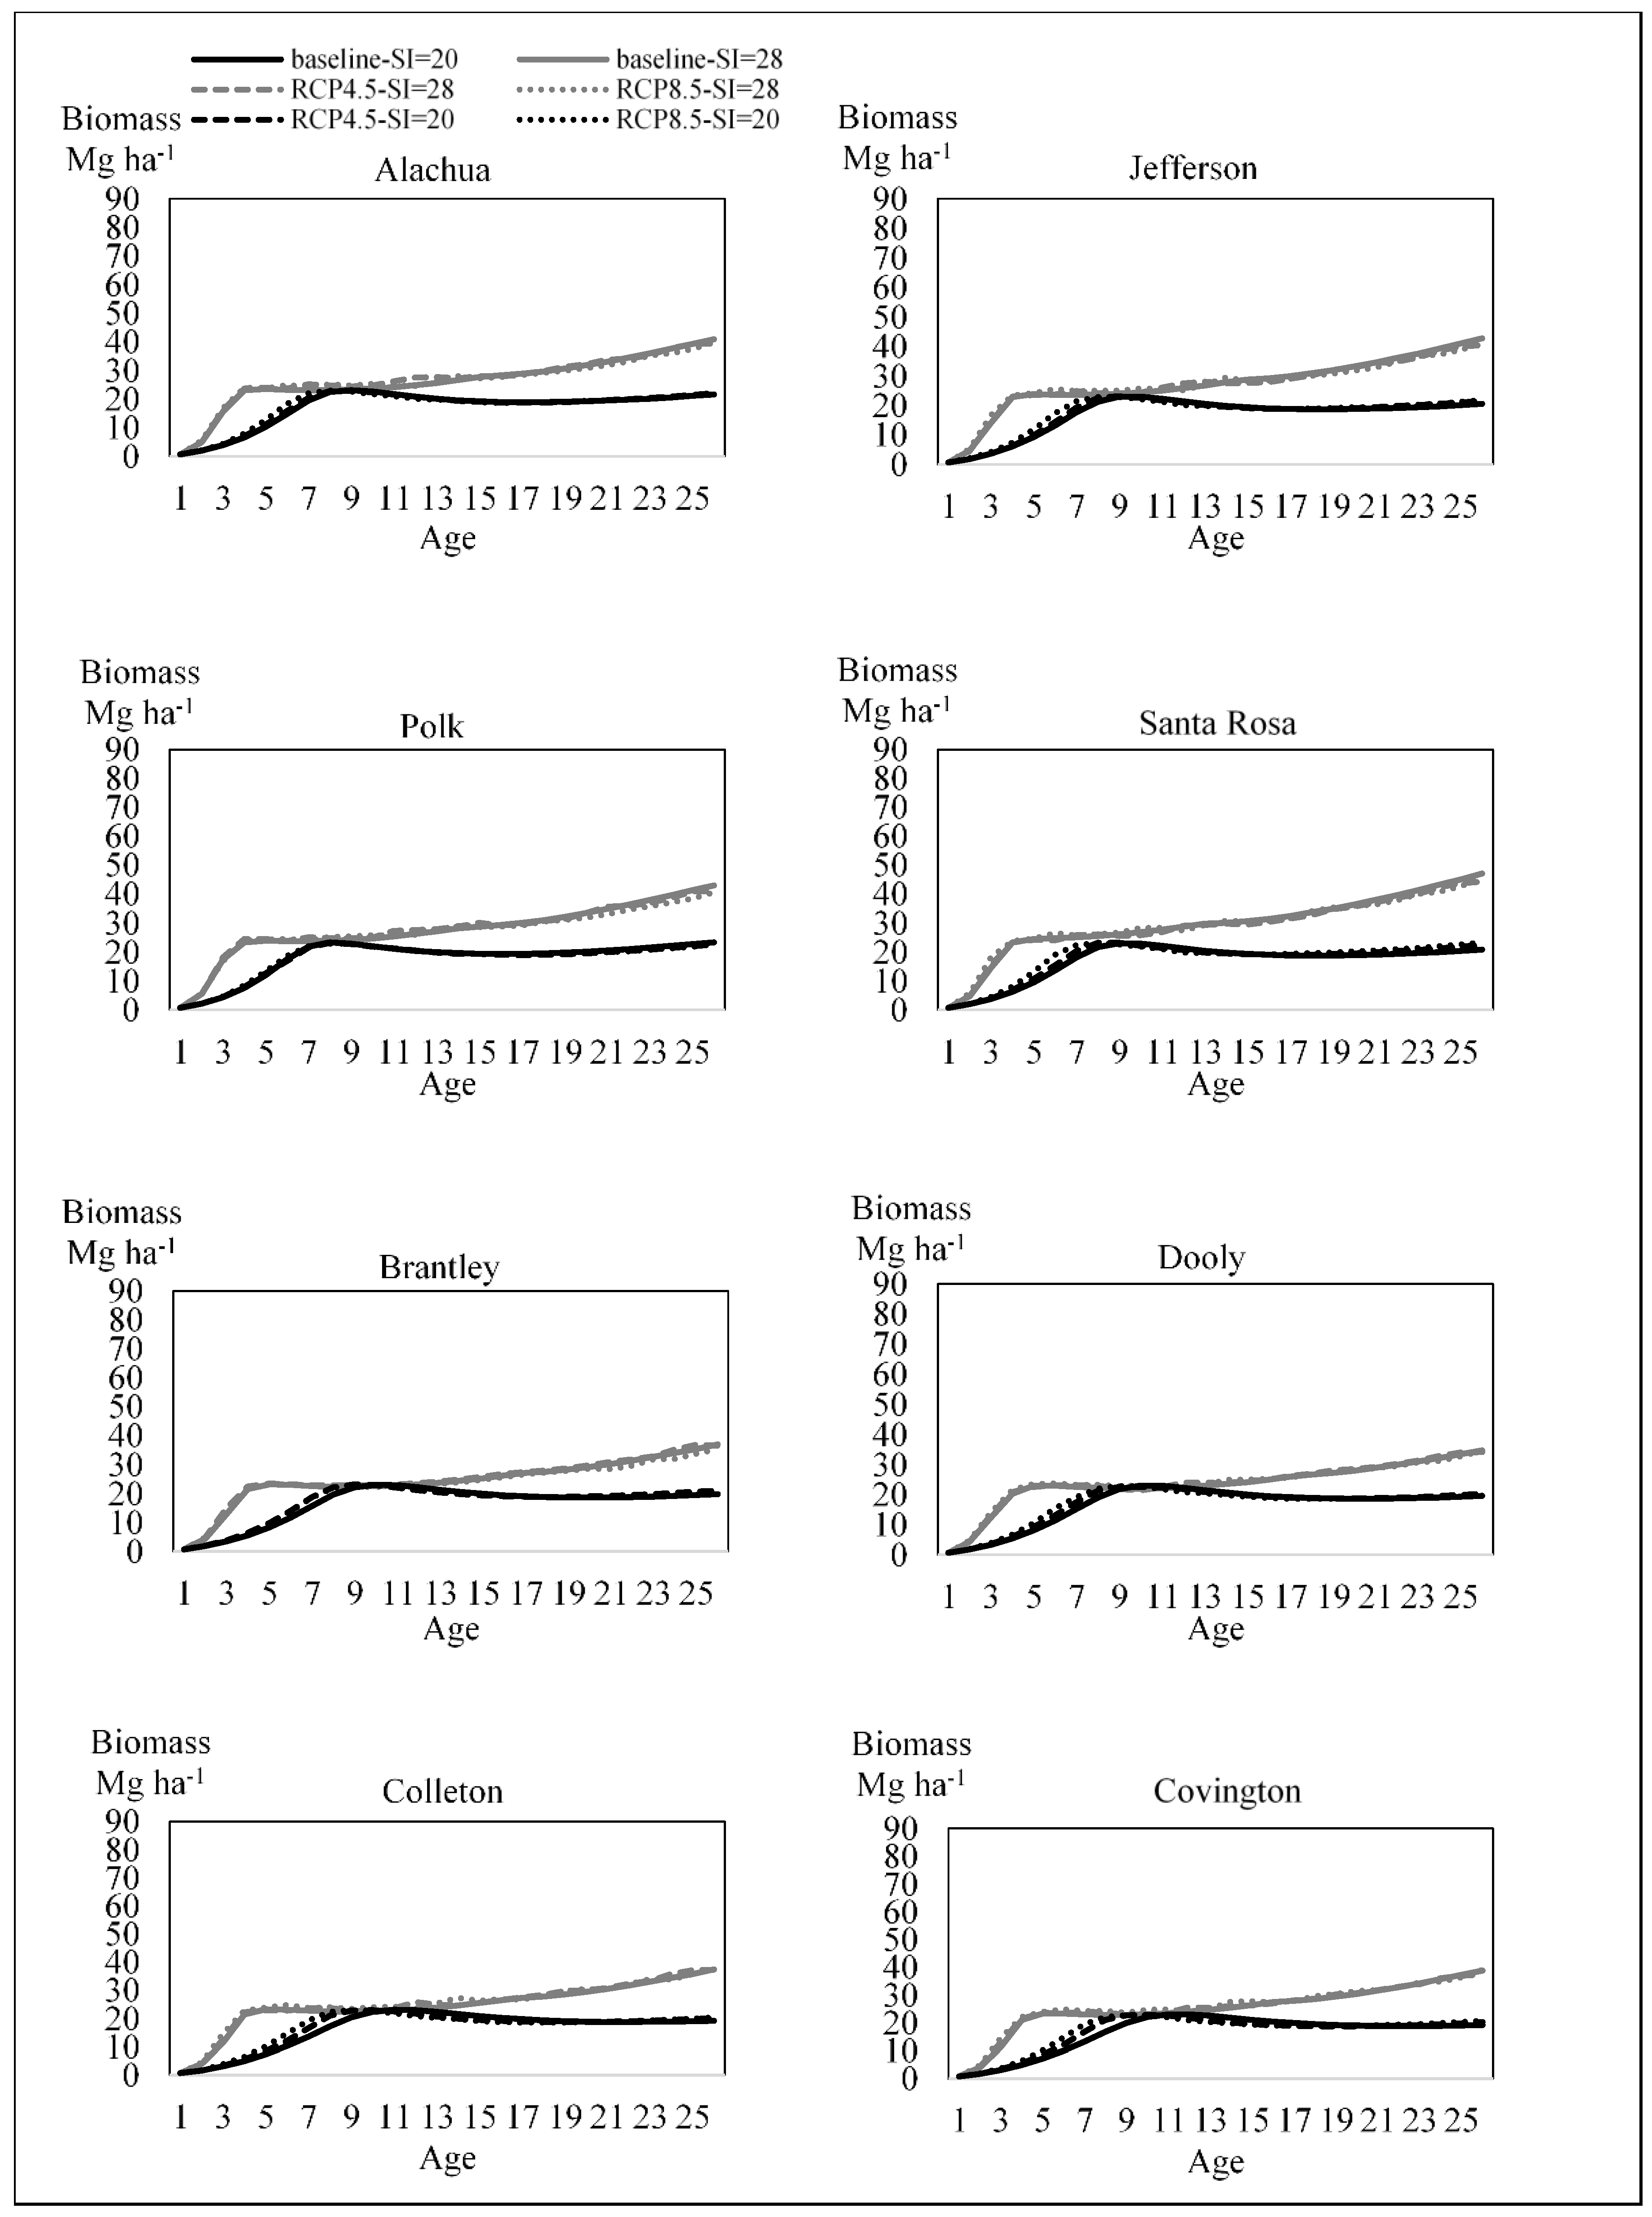
The production of biomass for bioenergy showed a similar trend for all climatic scenarios, see Figure 3. In the case of SI = 20 m and for all sites and climatic scenarios, the biomass production initially increased until around the age of 10 years. After age 10 years, the biomass production decreased for some time due to an increase in the production of pulpwood. Finally, after age 17 years, the production of biomass started to increase as the stand aged. Overall, future climatic conditions increased the production of biomass for bioenergy, see Figure 3. However, this increase in biomass production remained somewhat similar between moderate and extreme climates for both indicators of site productivity. For SI = 20 m and scenarios RCP4.5 and RCP8.5, the increase in biomass ranged between 0.1 and 0.3 Mg ha−1, and 0.4 and 0.8 Mg ha−1, respectively. In the case of SI = 28 m, the variation in biomass production ranged between 0.08 and 0.8 Mg ha−1, and 0.1 and 1 Mg ha−1, respectively.
3.2. Land Expectation Values LEVs
Table 3 presents the land expectation values (LEVs) and the optimal harvest age (t*) considering the production of pulpwood and forest biomass for bioenergy for all sites under current and future climatic scenarios. The land expectation value considering only biomass for bioenergy (LEVb), i.e., the present value of the biomass (branches, foliage, and tops), benefits realized by landowners over infinite rotations is also included in Table 3.
Under current climatic conditions (baseline) and with SI = 20 m, the negative LEVs in sites Bradley, Dooly, Colleton, and Covington indicated that growing trees for pulpwood and biomass production may not be a feasible option for landowners. Lower growth rates coupled with longer harvest ages could not offset the costs of growing slash pine, generating negative LEVs in these sites. With the exception of sites Alachua and Polk, moderate (scenario RCP4.5) and extreme (scenario RCP8.5) changes in climate increased the LEVs compared to the LEVs generated under current climatic conditions. Under the scenario RCP4.5 and with SI = 20 m, the largest increases in LEVs occurred in sites Covington ($341.3 ha−1), Bradley ($304.9 ha−1), and Colleton ($261.6 ha−1). In these sites, for an increase of the maximum and minimum temperatures of 1 °C, the LEV increased by $170.7 ha−1, $138.6 ha−1, and $113.8 ha−1, respectively. Scenario RCP8.5 caused the largest increases in LEVs in sites Santa Rosa ($485.1 ha−1) and Covington ($474.8 ha−1), representing, respectively, average increases of $71.7 ha−1 and $139.8 ha−1 in LEVs with an increase in both temperatures of 1 °C.
Not surprisingly, high productivity conditions (SI = 28 m) generated higher LEVs for all climatic scenarios and sites, see Table 3. With SI = 28 m and under scenario RCP4.5, the largest increases in LEVs occurred in sites Alachua ($399.0 ha−1) and Polk ($224.2 ha−1)–$221.27 ha−1 and $124.5 ha−1 increases in LEV per 1 °C increase in temperature, respectively. Under scenario RCP8.5, the largest increases in LEVs were in sites Colleton ($345.3 ha−1) and Covington ($274.0 ha−1), representing an average increase of $89.7 ha−1 and $80.7 ha−1 per 1 °C increase in temperature.
Although the inclusion of forest biomass for bioenergy increased the LEVs, the economic contributions of biomass (LEVb) to the total economic rents for landowners were generally low, ranging between $62.1 and $140.7 ha−1 for all sites with a baseline scenario for SI = 20 m. Under scenarios RCP4.5 and RCP8.5, the contributions ranged between $60.2 and $164.4 ha−1. Furthermore, in several sites (Alachua, Jefferson, Polk, and Dolly), scenario RCP4.5 led to a decrease in the benefits of biomass for bioenergy. With increased productivity conditions (SI = 28 m), the biomass for bioenergy contribution to the total economic rents ranged between $82.2 and $367.8 ha−1 for the baseline scenario and $86.6 and $441.2 ha−1 for the future climatic scenarios. Furthermore, in most of the sites with the exception of Santa Rosa and Bradley, the economic benefits of forest biomass for bioenergy increased with moderate and extreme climatic conditions.
3.3. The Optimal Harvest Age t*
Moderate climatic conditions did not have a clear impact on the optimal harvest ages for all our slash pine sites compared to those under current climatic conditions and SI = 20 m, see Table 3. However, extreme climatic conditions, with the exception of the site Alachua, decreased the optimal harvest ages for slash pine for all sites. Regardless of the climatic scenarios, the optimal harvest ages tended to be longer in the northern distribution of the slash pine sites. With increased productivity conditions (SI = 28 m), the harvest ages were notably shortened for all climatic scenarios—ranging between 5 and 10 years for all climatic scenarios. Moderate climatic conditions decreased, between 1 and 2 years, the harvest ages for sites Alachua. Jefferson, Santa Rosa, and Covington compared to those obtained under current climatic conditions. For the other sites, the harvest ages remained invariant. With extreme climatic conditions, and with the exception of the site Brantley, the harvest ages were also reduced by 1–2 years in sites Alachua, Dooly, Colleton, and Covington, while for the other sites the harvest ages were not impacted by climate change.
4. Discussion
Our results indicate that the production of pulpwood and biomass for bioenergy modestly increased with changing climatic conditions. The increase in forest growth is reduced when slash pine is grown in high productivity conditions. For example, compared to the baseline scenario and for the initial 20 years of the rotation of slash pine stand, the differences in pulpwood production were, on average, 6.7 m3 ha−1 (SI = 28 m) vs 12.2 m3 ha−1 (SI = 20 m), under scenario RCP8.5. Although the increase in the production of biomass for bioenergy was small, it may be helpful in avoiding commercial timber diversion, for example, pulpwood, for energy production [10]. In general, climate change positively affected the production of both forest products in those sites located in the northern distribution of slash pine. On average, for all sites and both site productivities and climatic scenarios, the average supply of forest biomass for bioenergy was around 19.7 green Mg ha−1 year−1 (≈10 dry Mg ha−1 year−1). If the 4.2 million ha of slash pine plantations were managed to use the non-commercial biomass, they could provide 21 million dry Mg, around 22% of the goal of 97 million dry Mg of woody material needed to displace 30% of the current US petroleum consumption [24].
Our results show that managing slash pine forests for pulpwood and forest biomass for bioenergy production under future climatic conditions can be a plausible economic alternative for forest landowners. Previous research has confirmed that woody bioenergy markets would improve the profitability for landowners in the South [7,10]. This helps in making forestry a sustainable option and potentially reducing the expansion of agricultural lands and urbanization into forests [9].
We did not include the impacts of different supplies of biomass feedstocks (waste and agriculture resources) and changes in land use in our economic analysis. Therefore, the price of forest biomass for bioenergy required to become a financially viable enterprise may be somewhat different. It is suggested that forest bioenergy becomes an economically viable alternative if the price of biomass for bioenergy reaches $10 per dry Mg−1 when considering the interaction of different market forces [24]. Furthermore, in order to be competitive with other sources of bioenergy, e.g., agriculture residues, in the near future, woody biomass prices need to be far higher than the actual biomass price of $4.2 Mg−1 used in this study. It is expected that forest bioenergy would be more competitive than agricultural residues by 2040 when woody biomass prices reach $80 dry Mg−1 [24]. Increased prices of woody biomass due to stronger bioenergy markets—e.g., increased demand for bioenergy, and establishments of bioenergy plants—would not increase the availability of forest biomass feedstocks and but also lead to higher prices of commercial timber improving the economic sustainability of US forestlands [7].
Higher land values were found at sites in the southern distribution (e.g., Florida sites), compared to the land values at sites in the northern distribution of slash pine. However, and similar to previous findings [25], the greatest LEV increases resulted in northern sites with more extreme climatic conditions, reflecting the differential effects of changes in temperatures. Other studies have confirmed these findings. Gonzalez-Benecke et al. [26] found that, in the case of loblolly pine, the sites located in the northern part of the natural distribution of this species showed the largest increases in forest growth with climate change. This suggests that the economic viability of growing southern pines is increasing northward under changing climatic conditions. We found optimal harvest ages are reduced when planting slash pine in moderate productivity sites and under extreme climatic conditions. When slash pines are planted in high productivity sites, the reduction of the harvests ages occurs mainly in northern sites. In general, rotation ages are shortened when forest growth is increased due to improved forest productivity conditions coupled with climate change [25].
Our research can be further expanded by using different climatic models. e.g., the Coupled Model Intercomparison Project CMPI5 models [27] to more accurately determine the impacts of precipitation and temperature in the production of pulpwood and forest biomass for bioenergy. It is claimed that intensive biomass harvesting can accelerate wildlife habitat losses and increase water stress [28]. Therefore, our analysis can be extended considering the tradeoffs between forest biomass harvests and other ecosystem services. The incorporation of the role of natural disturbances due to changes in climate and heavily-stocked forest plantations are also subject of further research.
5. Conclusions
Our study assessed the effects of climate change and bioenergy markets on the profitability and optimal forest management at eight slash pines sites in the Southeastern US. Our results showed that climate change would increase the production of pulpwood and forest biomass for bioenergy in slash pine forests. On average, the production of pulpwood increased for all sites by 8 m3 ha−1 and 12 m3 ha−1 under scenarios RCP4.5 and RCP8.5, respectively, for SI = 20 m, and 4 m3 ha−1 and 6 m3 ha−1 in both climatic scenarios for SI = 28 m. The average increase for all sites, climatic conditions, and productivity sites accounted for 7.5 m3 ha−1. In the case of forest biomass for bioenergy, the average increase accounted for less than 1 Mg ha−1 for both climatic scenarios and productivity sites. Form an economic perspective, and considering a payment for forest biomass for bioenergy of $4.2 Mg−1, the land expectation values LEVs tend to increase, with the exception of sites Santa Rosa and Bradley, with changing climatic conditions. On average, for all sites where climate change had a positive impact on profitability, under scenario RCP8.5, and high productivity conditions, the LEVs increased by $242.1 ha−1. The contribution of forest biomass for bioenergy in the total economic revenues for landowners was small, accounting for $23 ha−1. We also found that the combined effect of increased site productivity and climate change reduced the optimal harvest age of slash pine. Although our results confirmed that emerging forest bioenergy markets coupled with changing climatic conditions can increase the economic returns for landowners, we did not include the impacts of market forces in our analysis. As such, our research can be extended by incorporating the combined effects of policy incentives, development of new technologies, the use of different biomass feedstocks, and changes in land use.
Author Contributions
The paper was written by A.S. with significant contribution by P.L. A.S. identified the research questions, designed the study and performed the economic analyses with contributions from P.L.
Funding
Andres Susaeta received no external funding. Pankaj Lal was supported by the National Science Foundation award 1555123. Any opinion, findings, conclusions, or recommendations expressed in this material are those of the authors and do not necessarily reflect the views of the National Science Foundation.
Conflicts of Interest
The authors declare no conflict of interest.
Appendix A
Growth and yield model for slash pine (Pienaar et al. [17]):
where is total outside bark stem volume (ft3 acre−1), = merchantable volume of trees at age (ft3 acre−1) with a diameter at breast height inches to a merchantable diameter inches outside bark; = number of trees acre−1; = is the dominant height (ft); = basal area (ft2 acre−1); = quadratic mean diameter (inches); variables ,, and are also provided by the 3-PG model. Equations (A1) and (A2) are multiplied by 0.07 to obtain volume in m3 ha−1. The difference between and represents the volume of branches and tops which were multiplied by 2.24 to obtain the biomass of these two components in Mg ha−1.
References
- Susaeta, A.; Lal, P.; Alavalapati, J.; Carter, D. Modeling the impacts of bioenergy markets on the forest industry in the southern United States. Int. J. Sustain. Energy 2013, 32, 544–561. [Google Scholar] [CrossRef]
- Dwivedi, P.; Bailis, R.; Khanna, M. Is use of both pulpwood and loggin resoudes instead of only logging residues for bioenergy development a viable carbon mitigation strategy? Bioenergy Res. 2014, 7, 217–231. [Google Scholar] [CrossRef]
- Oswalt, S.N.; Smith, W.B.; Miles, P.D.; Pugh, S.A. Forest Resources of the United States, 2012: A Technical Document Supporting the Forest Service 2015 Update of the RPA Assessment; General Technical Report GTR-WO-91; U.S. Department of Agriculture Forest Service Washington Office: Washington, DC, USA, 2014.
- Tidwell, T. A Regionwide Vision for Retaining Forests as Forests. In Proceedings of the Southern Forest product Export Conference, Charleston, SC, USA, 17 October 2016. [Google Scholar]
- Prestemon, J.; Wear, D.; Foster, M. The Global Position of the U.S. Forest Products Industry; General Technical Report SRS-204; U.S. Department of Agriculture Forest Service, Southern Research Station: Asheville, NC, USA, 2015; p. 24.
- Wear, D.; Prestemon, J.; Foster, M. US Forest Products in the global economy. J. For. 2015, 114. [Google Scholar] [CrossRef]
- Lal, P.; Alavalapati, J.; Susaeta, A. Impact of bioenergy markets on the future of southern United States Forests. Middle State Geogr. 2014, 47, 26–37. [Google Scholar]
- Dwivedi, P.; Khanna, M.; Sharma, A.; Susaeta, A. Efficacy of carbon and bioenergy markets in mitigating carbon emissions on reforested lands: A case study from southen United States. For. Policy Econ. 2016, 67, 1–9. [Google Scholar] [CrossRef]
- Wear, D.N.; Greis, J. The Southern Forest Futures Project: Summary Report; General Technical Report SRS-168; U.S. Department of Agriculture Forest Service, Southern Research Station: Asheville, NC, USA, 2012; 54p.
- Alavalapati, J.; Lal, P.; Susaeta, A.; Abt, R.; Wear, D. Forest Biomass Based Energy. In The Southern Forest Futures Project: Technical Report; U.S. Department of Agriculture Forest Service, General Technical Report SRS-178; Wear, D.N., Greis, J., Eds.; USDA: Asheville, NC, USA, 2013; pp. 213–260. [Google Scholar]
- Henderson, J.; Joshi, O.; Parajuli, R.; Hubbard, W.G. A regional assessment of wood resource sustainabiulity and potenial economic impact of the wood pellet market in the U.S. South. Biomass Bioenergy 2017, 105, 421–427. [Google Scholar] [CrossRef]
- Perdue, J.; Stanturf, J.; Young, T.; Huang, X.; Dougherty, D.; Pigott, M.; Guo, Z. Profitability potential for Pinus taeda L. (loblolly pine) short-rotation bioenergy plantings in the southern USA. For. Policy Econ. 2017, 83, 146–155. [Google Scholar] [CrossRef]
- Barnett, J.; Sheffield, R. Slash pine: Characteristics, History, Status, and Trends. In Slash pine: Still Growing and Growing! Dickens, E.D., Barnet, J.P., Hubbard, W.G., Jokela, E.L., Eds.; General Technical Report GTR SRS-76; U.S. Department of Agriculture Forest Service: Asheville, NC, USA, 2004; pp. 1–6. [Google Scholar]
- Landsberg, J.; Waring, R.H. A generalized model of forest productivity using simplified concepts of radiation use efficiency, carbon balance and partitioning. For. Ecol. Manag. 1997, 95, 209–228. [Google Scholar] [CrossRef]
- Faustmann, M. Calculation of the value which forest land and immature stands possess for forestry. J. For. Econ. 1995, 1, 7–45. [Google Scholar]
- Gonzalez-Benecke, C.A.; Jokela, E.J.; Cropper, W.P.; Bracho, R.; Leduc, D.J. Parameterization of the 3-PG model for Pinus elliottii stands using alternative methods to estimate fertility rating, biomass partitioning and canopy closure. For. Ecol. Manag. 2014, 327, 55–75. [Google Scholar] [CrossRef]
- Pienaar, L.V.; Shiver, B.D.; Rheney, J.W. Yield Prediction for Mechanically Site-Prepared Slash Pine Plantations in the Southeastern Coastal Plain; PMRC Technical Report 1996-3A; University of Georgia: Athens, GA, USA, 1996. [Google Scholar]
- IPCC. Summary for Policymakers. In Climate Change 2013: The Physical Science Basis. Working Group I Contribution to the Fifth Assessment Report of the Intergovermental Panel on Climate Change; Stocker, T., Qin, D., Plattner, G.-K., Tignor, M., Allen, S., Boschung, J., Eds.; Cambridge University Press: Cambridge, NY, USA, 2013; p. 1535. [Google Scholar]
- University of Idaho Multivariate Adaptive Constructed Analogs (MACA) Statistical Downscaling Method. Available online: http://maca.northwestknowledge.net (accessed on 11 November 2016).
- Timber Mart-South. U.S. South Annual Review: 2010–2017 Timber Prices & Markets; Timber-Mart South: Athens, GA, USA, 2018. [Google Scholar]
- USDL Bureau of Labor Statistics. Producer Price Index Industry Data. Available online: https://www.bls.gov/ (accessed on 12 May 2018).
- Shresta, P.; Stainback, A.; Dwivedi, P. Economic impact of net carbon payments and bioenergy production in fertilized and non-fertilized loblolly pine plantations. Forests 2015, 6, 3045–3059. [Google Scholar] [CrossRef]
- Barlow, R.; Levendis, W. 2014 cost and cost trends for forestry practices in the South. For. Landowner 2015, 74, 23–31. [Google Scholar]
- U.S. Department of Energy. 2016 Billion-Ton Report: Advancing Domestic Resources for a Thriving Bioeconomy, Volume 1: Economic Availability of Feedstocks; ORNL/TM-2016/160; Oak Ridge National Laboratory: Oak Ridge, TN, USA, 2016; p. 448.
- Susaeta, A.; Adams, D.; Gonzalez-Benecke, C. Economic vulnerability of southern US slash pine forests to climate change. J. For. Econ. 2017, 28, 18–32. [Google Scholar]
- Gonzalez-Benecke, C.A.; Teskey, R.O.; Dinon-aldridge, H. Pinus taeda forest growth preditions in the 21st century vary with site mean annual temperatures and site quality. Glob. Chang. Biol. 2017, 23, 4689–4705. [Google Scholar] [CrossRef] [PubMed]
- Sheffield, J.; Camargo, S.; Fu, R.; Hu, Q.; Jiang, X.; Johnson, N.; Karnauskas, K.; Tae Kim, S.; Kinter, J.; Kumar, S.; et al. North American climate in CMIP5 experiments. Part II: Evaluation of historical simulations of intraseasonal to decadal variability. J. Clim. 2013, 26, 9247–9290. [Google Scholar] [CrossRef]
- Evans, A.; Perschel, R.; Kittler, B. Overview of forest biomass harvesting guidelines. J. Sustain. For. 2013, 32, 89–107. [Google Scholar] [CrossRef]
Figure 1.
Location of the sites in the Southeastern United States (SE US).
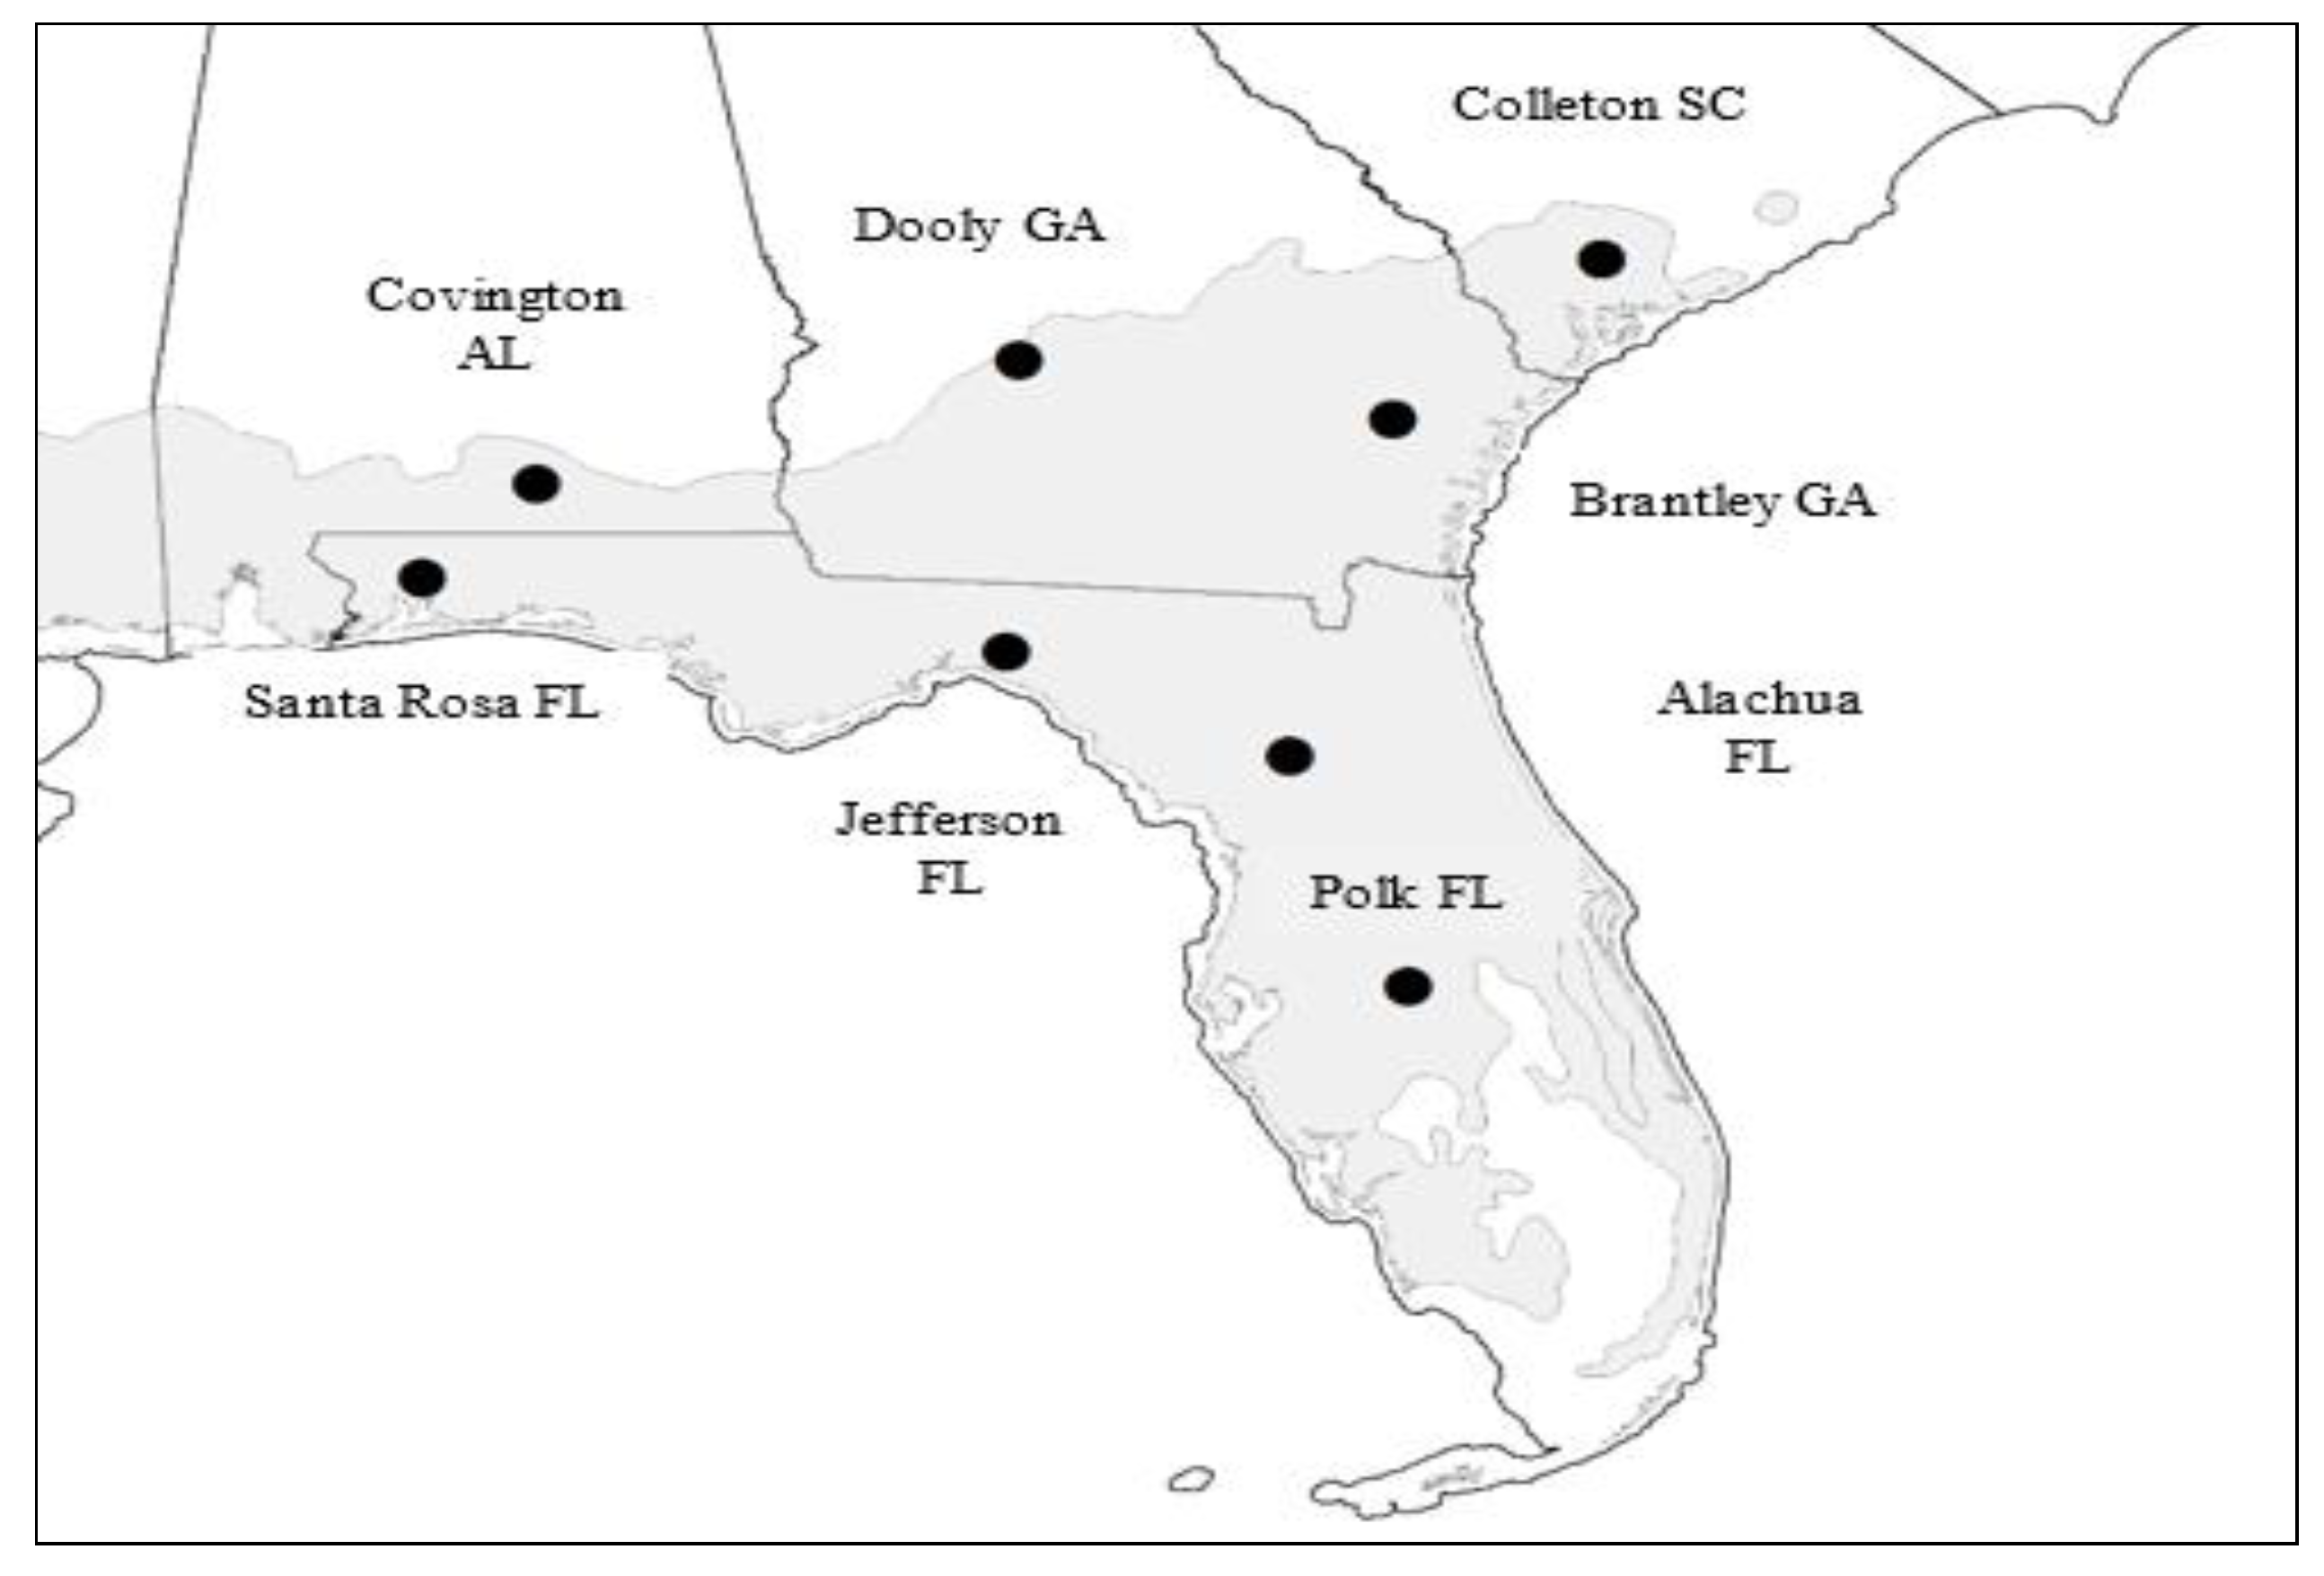
Figure 2.
Pulpwood production for all sites under different climatic scenarios and site indexes.

Figure 3.
Green biomass production for bioenergy for all sites under different climatic scenarios and site indexes.
Figure 3.
Green biomass production for bioenergy for all sites under different climatic scenarios and site indexes.

Table 1.
Average maximum and minimum annual temperatures (tmax, tmin), total annual precipitation (Pp), for each site and baseline (1950–2005) and representative concentration pathways (RCPs) climatic scenarios (2050–2100).
Table 1.
Average maximum and minimum annual temperatures (tmax, tmin), total annual precipitation (Pp), for each site and baseline (1950–2005) and representative concentration pathways (RCPs) climatic scenarios (2050–2100).
| Baseline | RCP4.5 | RCP8.5 | ||||||||
|---|---|---|---|---|---|---|---|---|---|---|
| Pp 1 | tmax 2 | tmin 2 | Pp | tmax | tmin | Pp | tmax | tmin | ||
| State | Sites | mm | °C | mm | °C | mm | °C | |||
| FL | Alachua | 1312.6 | 27.5 | 14.6 | 1342.1 | 29.5 | 16.6 | 1335.7 | 30.3 | 17.3 |
| Jefferson | 1431.3 | 26.7 | 13.5 | 1445.5 | 28.7 | 15.5 | 1444.8 | 29.4 | 16.2 | |
| Polk | 1352.2 | 28.8 | 16.9 | 1395.1 | 30.7 | 18.7 | 1395.3 | 31.5 | 19.4 | |
| Santa Rosa | 1650.0 | 25.7 | 13.4 | 1676.6 | 27.7 | 15.5 | 1647.6 | 28.4 | 16.2 | |
| GA | Brantley | 1193.1 | 25.7 | 12.6 | 1250.7 | 28.5 | 15.5 | 1269.1 | 30.5 | 17.2 |
| Dooly | 1178.3 | 25.3 | 12.2 | 1219.6 | 28.2 | 15.2 | 1243.6 | 30.0 | 16.9 | |
| SC | Colleton | 1251.2 | 25.1 | 11.5 | 1318.3 | 27.2 | 13.6 | 1322.9 | 28.1 | 14.4 |
| AL | Covington | 1491.9 | 25.2 | 10.9 | 1495.6 | 27.2 | 13.2 | 1485.6 | 27.0 | 13.9 |
1 It represents the mean of the historic total annual precipitation between 1950 and 2005 (baseline), and the mean of the projected total annual precipitation between 2050–2100 (RCPs) for a particular site. 2 They represent, for a particular site, the mean of the historic maximum and minimum annual temperatures between 1950 and 2005 (baseline), i.e., the average of the 12 mean monthly maximum and minimum temperatures for 56 years, and the mean of the projected maximum and minimum annual temperatures between 2050 and 2100 (RCPs), i.e., the average of the 12 mean monthly maximum and minimum temperatures for 51 years.
Table 2.
Pulpwood prices and silvicultural costs for slash pine.
| Activities ( = 0) | Regeneration Costs | |||
| Site preparation $ ha−1 | 237 | |||
| Weed control $ ha−1 | 108 | |||
| Planting cost $ seedling−1 | 0.08 | |||
| Seedling cost $ seedling−1 | 0.05 | |||
| Activities ( > 0) | Silvicultural Costs | |||
| Fertilization $ ha−1 (age 3) | 198 | |||
| Weed control $ ha−1 (age 1) | 33 | |||
| Economic Parameters | State | |||
| AL | FL | GA | SC | |
| Price Pulpwood ($ m−3) | 13.1 | 11.8 | 12.4 | 11.9 |
| Price biomass for bioenergy ($ Mg−1) | 4.2 | |||
| Discount rate | 0.04 | |||
Table 3.
Land expectation value (LEV) considering the production of pulpwood and biomass for the bioenergy land expectation value from biomass harvests for bioenergy (LEVb), and optimal harvest age (t*) in all slash pine sites with SI = 20 m and 28 m for all climatic scenarios.
Table 3.
Land expectation value (LEV) considering the production of pulpwood and biomass for the bioenergy land expectation value from biomass harvests for bioenergy (LEVb), and optimal harvest age (t*) in all slash pine sites with SI = 20 m and 28 m for all climatic scenarios.
| SI = 20 m | SI = 28 m | |||||||||||
|---|---|---|---|---|---|---|---|---|---|---|---|---|
| Baseline | RCP4.5 | RCP8.5 | Baseline | RCP4.5 | RCP8.5 | |||||||
| LEV LEVb 1 | t* | LEV LEVb | t* | LEV LEVb | t* | LEV LEVb | t* | LEV LEVb | t* | LEV LEVb | t* | |
| Sites | $ ha−1 | years | $ ha−1 | years | $ ha−1 | years | $ ha−1 | years | $ ha−1 | years | $ ha−1 | years |
| Alachua | 686.3 81.6 | 20 | 682.4 73.9 | 22 | 674.7 82.1 | 20 | 3740.5 82.2 | 15 | 4103.5 90.3 | 13 | 3941.2 86.6 | 14 |
| Jefferson | 438.5 74.7 | 21 | 619.0 72.9 | 22 | 690.6 82.3 | 20 | 3947.9 193.1 | 14 | 4085.6 213.5 | 13 | 4222.6 203.7 | 14 |
| Polk | 969.2 85.3 | 20 | 781.5 78.7 | 21 | 797.4 83.6 | 20 | 3997.5 194.8 | 14 | 4221.7 198.8 | 14 | 4186.3 201.2 | 14 |
| Santa Rosa | 489.0 62.1 | 21 | 762.6 64.9 | 21 | 974.2 70.8 | 20 | 4662.2 187.9 | 13 | 4487.7 184.7 | 13 | 4621.3 185.0 | 13 |
| Brantley | −3 9.565.2 | 23 | 265.5 71.9 | 22 | 222.7 75.6 | 21 | 2437.6 152.3 | 16 | 2530.0 155.3 | 16 | 2314.9 142.7 | 17 |
| Dooly | −83.9 61.4 | 24 | 24.4 60.2 | 25 | 43.4 66.1 | 23 | 2228.9 138.7 | 17 | 2285.3 140.0 | 17 | 2333.8 157.6 | 15 |
| Colleton | −280.1 54.6 | 26 | −18.4 62.8 | 24 | 41.4 66.6 | 23 | 2315.7 153.6 | 16 | 2403.6 154.5 | 16 | 2660.9 189.7 | 14 |
| Covington | −213.0 57.6 | 25 | 128.4 63.0 | 24 | 261.9 71.2 | 22 | 2965.6 159.4 | 16 | 2994.2 180.6 | 14 | 3239.6 175.5 | 15 |
1 LEVb only consider the economic benefits of producing biomass for bioenergy, i.e., LEVb > 0. LEV includes all the costs associated with the management of slash pine stand. Therefore LEV ≥ 0, or LEV ≤ 0, depending on pulpwood and biomass benefits and the level of costs.
© 2018 by the authors. Licensee MDPI, Basel, Switzerland. This article is an open access article distributed under the terms and conditions of the Creative Commons Attribution (CC BY) license (http://creativecommons.org/licenses/by/4.0/).
Share and Cite
MDPI and ACS Style
Susaeta, A.; Lal, P. Impacts of Climate Change and Bioenergy Markets on the Profitability of Slash Pine Pulpwood Production in the Southeastern United States. Forests 2018, 9, 656. https://doi.org/10.3390/f9100656
AMA Style
Susaeta A, Lal P. Impacts of Climate Change and Bioenergy Markets on the Profitability of Slash Pine Pulpwood Production in the Southeastern United States. Forests. 2018; 9(10):656. https://doi.org/10.3390/f9100656
Chicago/Turabian StyleSusaeta, Andres, and Pankaj Lal. 2018. "Impacts of Climate Change and Bioenergy Markets on the Profitability of Slash Pine Pulpwood Production in the Southeastern United States" Forests 9, no. 10: 656. https://doi.org/10.3390/f9100656
Note that from the first issue of 2016, this journal uses article numbers instead of page numbers. See further details here.