Article

Allometry, Growth and Survival of Three Eucalyptus Species (Eucalyptus benthamii Maiden and Cambage, E. dunnii Maiden and E. grandis Hill ex Maiden) in High-Density Plantations in Uruguay

by
Fernando Resquin
1,*,
Rafael M. Navarro-Cerrillo
2,
Cecilia Rachid-Casnati
1,
Andrés Hirigoyen
1,
Leonidas Carrasco-Letelier
3 and
Joaquín Duque-Lazo
2
1
National Research Program of Forest Production, National Agriculture Research Institute, INIA Tacuarembó, Route 5 km 386, 45000 Tacuarembó, Uruguay
2
E.T.S.I.A.M. Department of Forestry, School of Agriculture and Forestry, University of Córdoba, Campus de Rabanales, 14071 Córdoba, Spain
3
National Research Program of Production and Environmental Sustainability, National Agricultural Research Institute, Experimental Station Alberto Boerger, 70000 Colonia, Uruguay
*
Author to whom correspondence should be addressed.
Forests 2018, 9(12), 745; https://doi.org/10.3390/f9120745
Submission received: 18 October 2018 / Revised: 9 November 2018 / Accepted: 13 November 2018 / Published: 29 November 2018
(This article belongs to the Special Issue Forest Bioenergy and Bioproducts)

Abstract

:
This study presents a yield model for aboveground biomass production from three species the Eucalyptus in northern and western regions of Uruguay, based on sampling records from intensive crop plantations. High-density eucalyptus plantations represent a forestry alternative for the production of forest biomass. This work assessed the survival and growth of three eucalyptus species (Eucalyptus benthamii Maiden & Cambage, E. dunnii Maiden and E. grandis Hill ex Maiden) planted at densities of 2220, 3330, 4440 and 6660 trees ha−1, for a period of 57 months in northern (Tacuarembó) and western (Paysandú) regions of Uruguay. Linear and logarithmic equations of individual volume were fitted by site and species. The survival of E. grandis, E. benthamii and E. dunnii was not related to planting density, and the highest mortality values occurred in Tacuarembó. The effects of competition among trees were more evident at the highest planting density for E. grandis. In all species, the reduction in diameter was more marked than that of height, as planting density increased. Tree volume showed the same trend, and this was higher with higher planting densities. At Tacuarembó, the volume was the highest with E. benthamii at 6660 trees ha−1 (416.4 m3 ha−1), and, at Paysandú, the highest production was obtained with E. grandis (370.7 m3 ha−1) and with the densities of 4440 and 6660 trees ha−1 (305.9 and 315.3 m3 ha−1, respectively). With all species and planting densities, there was an increase in the accumulated volume during the 57-month study period; however, growth curves indicate that the maximum production per unit time and, therefore, the optimum harvest time occurred at 48 months. In this work, it has been shown that the use of intensive short-rotation plantations of eucalyptus for the production of biomass in Uruguay is suitable in soils prioritized for forestry.

1. Introduction

In the last decade, the use of renewable energy has been a growing trend, worldwide, to reduce fossil fuel use and greenhouse gas emissions [1]. Within the renewable energies, plant biomass stands out because it could have a neutral balance of carbon and represent an important source of employment [2]. In this framework, Uruguay designed an energy policy to create and promote the use of renewable energy in electric power generation as well as the use of biomass for energy purposes. Additionally, there is a growing impulse for the production of liquid fuels (bioethanol and biodiesel) from national raw materials to mix with the fossil fuels. Degraded, abandoned, and marginal lands are the most important areas for bioenergy production [3]. Eucalyptus species have been shown to respond to high-density plantation with enhanced biomass growth.
There are two numerical approaches to the estimation of forest biomass from inventory data: biomass expansion factors (BEFs) and biomass estimation equations [4]. Biomass expansion factors are coefficients that allow the conversion of the volume of wood (usually expressed in m3) of a tree or forest mass as a whole into dry weight of the tree or mass (usually expressed in tonnes). On the other hand, the biomass estimation equations are relationships between the volume and some measured variable on the tree or representing the site conditions (density and productivity). For the use of the data in studies of ecosystem functioning, nutrient cycles and quantification of carbon pools, a separate study of the different fractions of the tree is usually performed [5]. Due to the degree of precision, the most-used procedure in the quantification of biomass is the destructive one. By relating the growth and characteristics of the plantation (density, productivity, etc.) to the dry weight of the different fractions, equations can be obtained that quantify the dry matter of the tree and then provide the dry weight of the forest mass. Thus, with the biomass equations for each of the fractions, the amount of dry matter present in the trees of a given forest can be estimated [6,7,8,9].
In Uruguay, several models of growth simulation have been developed for E. grandis Hill ex Maiden, E. globulus Labill. and E. dunnii Maiden, for both solid wood and cellulose production [10,11,12,13]. However, in the light of recent research in the field of biomass use for energy provision, there is interest in having models to estimate aboveground biomass production from Eucalyptus spp. energy crops. In this sense, the main objective of this work was to assess the aboveground biomass production of three Eucalyptus species (E. benthamii Maiden & Cambage, E. dunnii Maiden and E. grandis Hill ex Maiden), with different planting densities, in soils prioritized for forests of the northern and coastal zones of Uruguay. The specific objectives were (i) to evaluate the effect of species and planting density on survival, diameter and height throughout the evaluation period, (ii) to fit allometric models for the estimation of volume as a function of easily-measured dasometric variables in the field, (iii) to evaluate the effect of species and planting density on volume during the first crop rotation, and (iv) to determine the optimum time of harvest for each species/planting density combination.

2. Materials and Methods

2.1. Study Area

The experiment was carried out in two different zones: in the north (32°13′30″ S–55°54′40″ W, hereafter Tacuarembó) and west (32°24′05″ S–57°31′02″ W, hereafter Paysandú) (Figure 1). These zones have a temperate subtropical climate, with a mean annual temperature of 18 °C (12 °C in the coldest month, 24 °C in the warmest month). The mean annual rainfall is between 1300 and 1400 mm [14]. According to the National Commission for Agroeconomic Studies of the Land classification (CO.NE.A.T.), soils correspond to group 7.32. Those soils comprise Luvisols and Acrisols: Horizon A with 50–60 cm of depth, sandy-loam texture, very-low fertility, high risk of erosion, moderate slopes (3%–4%), weak structure, low organic matter, imperfect drainage and good rooting capacity. The Paysandú soil is classified in CO.NE.A.T. group 9.3 (Uruguayan system of soil aptitude classification), which corresponds to Planosols districts, with low fertility, horizon A with 40 to 50 cm of depth, sandy texture, weak structure, low level of organic matter, slopes of 2%–3%, medium to low risk of drought, imperfect drainage, moderately-slow to slow permeability and good rooting ability. A description of soil profiles including a characterization of the main chemical and physical properties were undertaken for both sites 49 months after the trial was installed. Parameters measured were: pH, organic carbon, exchangeable bases (calcium, magnesium, potassium, and sodium), exchangeable acidity (aluminium), and available phosphorus (Bray 1-P) (Tables S1 and S2, Supplementary Material). With this information, soils were classified as fine-loamy, siliceous, Mollic Hapludalf [15].

2.2. Experimental Design

The experiment was designed as a split-plot, with completely random blocks having three replicates of every treatment at each of the two locations. There were two factors—species (main plot), with three levels, and planting density (subplots), with four levels and three replicates, forming a total of 12 treatments and 36 plots. The species tested were E. benthamii, E. dunnii and E. grandis. The planting distances were 3 m × 0.5 m, 3 m × 0.75 m, 3 m × 1 m and 3 m × 1.5 m, corresponding to 6660, 4440, 3330 and 2220 trees per hectare. Plantation densities were chosen based on previous studies which showed high mortality rates when more than 6600 stems are planted per hectare [16]. The sources of the seeds were Brazil (APS Pinhao-State of Paraná-Brazil) for E. benthamii, INIA’s (National Institute of Agricultural Research) seed orchard (2nd generation) for E. grandis and Undera (Moleton West Coffs Harbor, Australia) for E. dunnii. Seedlings were planted on 13 October to 15 October 2010 at Tacuarembó and 27 October to 1 November 2010 at Paysandú. The plots used were rectangular, six rows and 25 trees per row. The trees of the four central rows were used for all assessments and the first and the last tree of each row were not measured. The planting area was subsoiled, using a ripper with a single tine, to a depth of more than 60 cm, and soil clods were broken up using a spring harrow and culta-mulcher to provide a more-level surface for planting. Planting and fertilisation were manual. The fertilisation applied 150 kg per hectare of an 18/46/0 (N, P, K) mixture and 180 kg per hectare of a 14/30/12 (N, P, K) mixture plus 6% S, and 0.2% B at Tacuarembó and Paysandú, respectively. This dose was applied at the moment of plantation only. The type and dose of fertilizer were defined by the forestry company where the trials were installed. This responds to expected differences in the chemical properties of both types of soils.

2.3. Sampling and Measurements

The total height (Ht, distance between the root collar and the base of the final bud, m) and diameter at breast height (dbh, 130 cm above the soil, cm) and the dead trees were measured and recorded at the five inventories: (1) July–October 2011, (2) May–August 2012, (3) January 2013, (4) August–December 2014 and (5) January–July 2015 at both Paysandú and Tacuarembó. The survival in each inventory was calculated as the proportion of living trees in relation to the total planted and expressed as a percentage. The dbh was measured with a metric tape, with an accuracy of 0.1 cm, for trees of dbh ≥ 3 cm in the four central rows of the plot (rows 2 to 5). The Ht (m) was measured with a Vertex IV hypsometer (Haglof, Långsele, Västernorrland, Sverige, Sweden), in rows 2 to 4. The slenderness coefficient was calculated as the ratio of Ht and dbh. This resulted in 39,088 diameter/height observations in a five-year growth period. Trees of all ages comprised a single dataset to adjust height-diameter equations, using tree number per hectare, for each site, species and planting density as co-variates. For Tacuarembó and Paysandú, Equations (1) and (2) were used respectively:
Ht = βo + β1 × dbh + β2 × dbh^2 + β3 × Ln(dbh) + β4 × (1/dbh) + β5 × N + β6 × Ln(N/ha)
Ht = exp((a + b × Ln(dbh) + c × Ln(dbh^2) + d × Ln(dbh^3)),
where Ht is the total height, dbh the diameter at breast height, N the number of trees per hectare and βo, β1, β2, β3, β4, β5 and β6 the coefficients of the models (Table S3, Supplementary Material).
In three inventories (2012, 2014 and 2015), a sample of three to five trees per treatment in each plot was selected for the development of allometric equations representing the diametric classes with the highest relative frequency. The Ht was measured and diameter (including bark) was measured at 0.7 m, 1.3 m and then every meter until 1 cm diameter.

2.4. Volume Equation

The individual tree volume (Vi) was calculated based on the diameter measurements at different heights, using Equation (3):
V = π 1 3 × l × ( D 1 2 + D 2 2 ) 2 .
Equation (3) uses the length (l) and the lower (D1) and upper (D2) diameters of each stem section to estimate the volume. Thus, the total volume for each tree was estimated by adding together the volumes of the sections according to Smalian’s formulae. With these values, linear (single and multiple) and nonlinear (logarithmic) volume equations were adjusted for the site and species according to the dbh, total height and number of trees per hectare. For each plot, the volume per hectare was calculated as the product of the average individual tree volume and the number of trees in the plot and expressed as volume with bark per hectare (Vt, m3 ha−1).

2.5. Optimum Time of Harvest

Mean annual increment (MAI, m3 ha−1 year−1) of volume was computed as the average volume per hectare within a period (MAI = volumei/ti). The current annual increment (CAI, m3 ha−1 year−1) of volume is the growth increase during the current year (CAI = volume t0 − volume ti). We estimated the optimum time of harvest when the current annual increment (CAI) equals the mean annual increment (MAI).

2.6. Statistical Analysis

The normality of all variables was checked using Shapiro–Wilk’s test. Variables without a normal distribution were transformed using the Box and Cox procedure in R. Survival analysis was performed using the Kaplan–Meier non-parametric’s test and Log-rank test. The differences in dbh, Ht. slenderness, Vi Vt among the densities and species were compared using a two-way analysis of variance (ANOVA) followed by Tukey’s test. Effects of species, plantation density, and interactions were assessed. The effect of species was compared with the interaction between species and blocks, whereas the effects of plantations density and the interaction were compared to the mean squared error (Table 1). The level of significance was set at p < 0.05. Results in the tables are shown as means with their standard errors for the untransformed variables. Linear (single and multiple) and nonlinear (logarithmic) regressions were carried out to obtain a statistical model to predict the effects of each site and specie on total volume according to the dbh, total height and number of trees per hectare. The variables showing the highest correlation coefficient with the volume were used as predictors for each species and site. The polynomial linear models were compared with the standardised error of the residuals, the coefficient of determination (R2ajd), the root mean square error (RMSE) and the Akaike information criterion (AIC). Relationships between measured and estimated tree volume for each tested species and site were analyzed. Trees with a height less than 130 cm were omitted. All statistical analyses were performed using R version 3.4.0 [17] (R Development Core Team, 2012). The packages lmtest, reshape, ggplot2 and plyr were used for ANOVAs test and regression models.

3. Results

3.1. Survival

The evolution of survival in both sites according to species and planting density during the evaluation period is shown in Figure 2. Survival between the time of planting and 57 months later averaged 53% in Tacuarembó in contrast to 81% in Paysandú. Between 12 and 8 months and the end of the experiment 57 months later, trees suffered 23% and 10% mortality overall for Tacuarembó and Paysandú, respectively. According to the Kaplan–Meier survival curve, significant differences between species and planting densities were observed in both locations (χ2 = 49.6 p < 0.001 and χ2 = 29.1 p < 0.001 respectively in Tacuarembó and Paysandú). At Tacuarembó, final tree survival was higher in high density plantations (6660 tree ha−1) for E. benthamii (73.3%) and E. dunnii (67.3%) compared to E. grandis where the highest survival was found at the lowest planting density (64%). Conversely, in Paysandú, the intermediate densities provided the greatest survival for E. benthamii (88%) and E. dunnii (92%).

3.2. Diameter at Breast Height, Total Height and Slenderness

At both locations, the planting density had a significant effect on all the variables at 57 months (Table 2). (F3,18 = 67.18, F3,18 = 14.78, F3,18 = 19.0, F3,18 = 77.9, F3,18 = 75,65, F3,18 = 8.41 for Tacuarembó and Paysandú, respectively).
At Paysandú, on the other hand, the effect of the interaction (Species × Planting Density) was significant for the H and slenderness (F6,18 = 6.9, p < 0.001, F6,18 = 4.37, p = 0.0068). The values of dbh, Ht, slenderness, MAI, CAI, Vi and Vt for the distinct species and planting densities 57 months after planting are presented in Table 3. At Tacuarembó, all species showed lower dbh and Ht, and higher slenderness with increasing planting density; E. grandis had the greatest dbh at almost all planting densities while E. benthamii and E. dunnii had similar value.
The analysis also highlighted E. grandis as the species with the greatest dbh at Paysandú, at all planting densities. At Tacuarembó, the reduction in individual growth (diameter) between the extreme densities (2220 vs. 6660 trees ha−1) was 38, 31 and 28% for E. dunnii, E. benthamii and E. grandis, respectively. The reduction in height was 15, 19 and 19%, respectively. At Paysandú, these values were somewhat higher, for both diameter (38, 34 and 32%, respectively) and height (16, 32 and 20%, respectively) (Figure 3 and Figure 4).

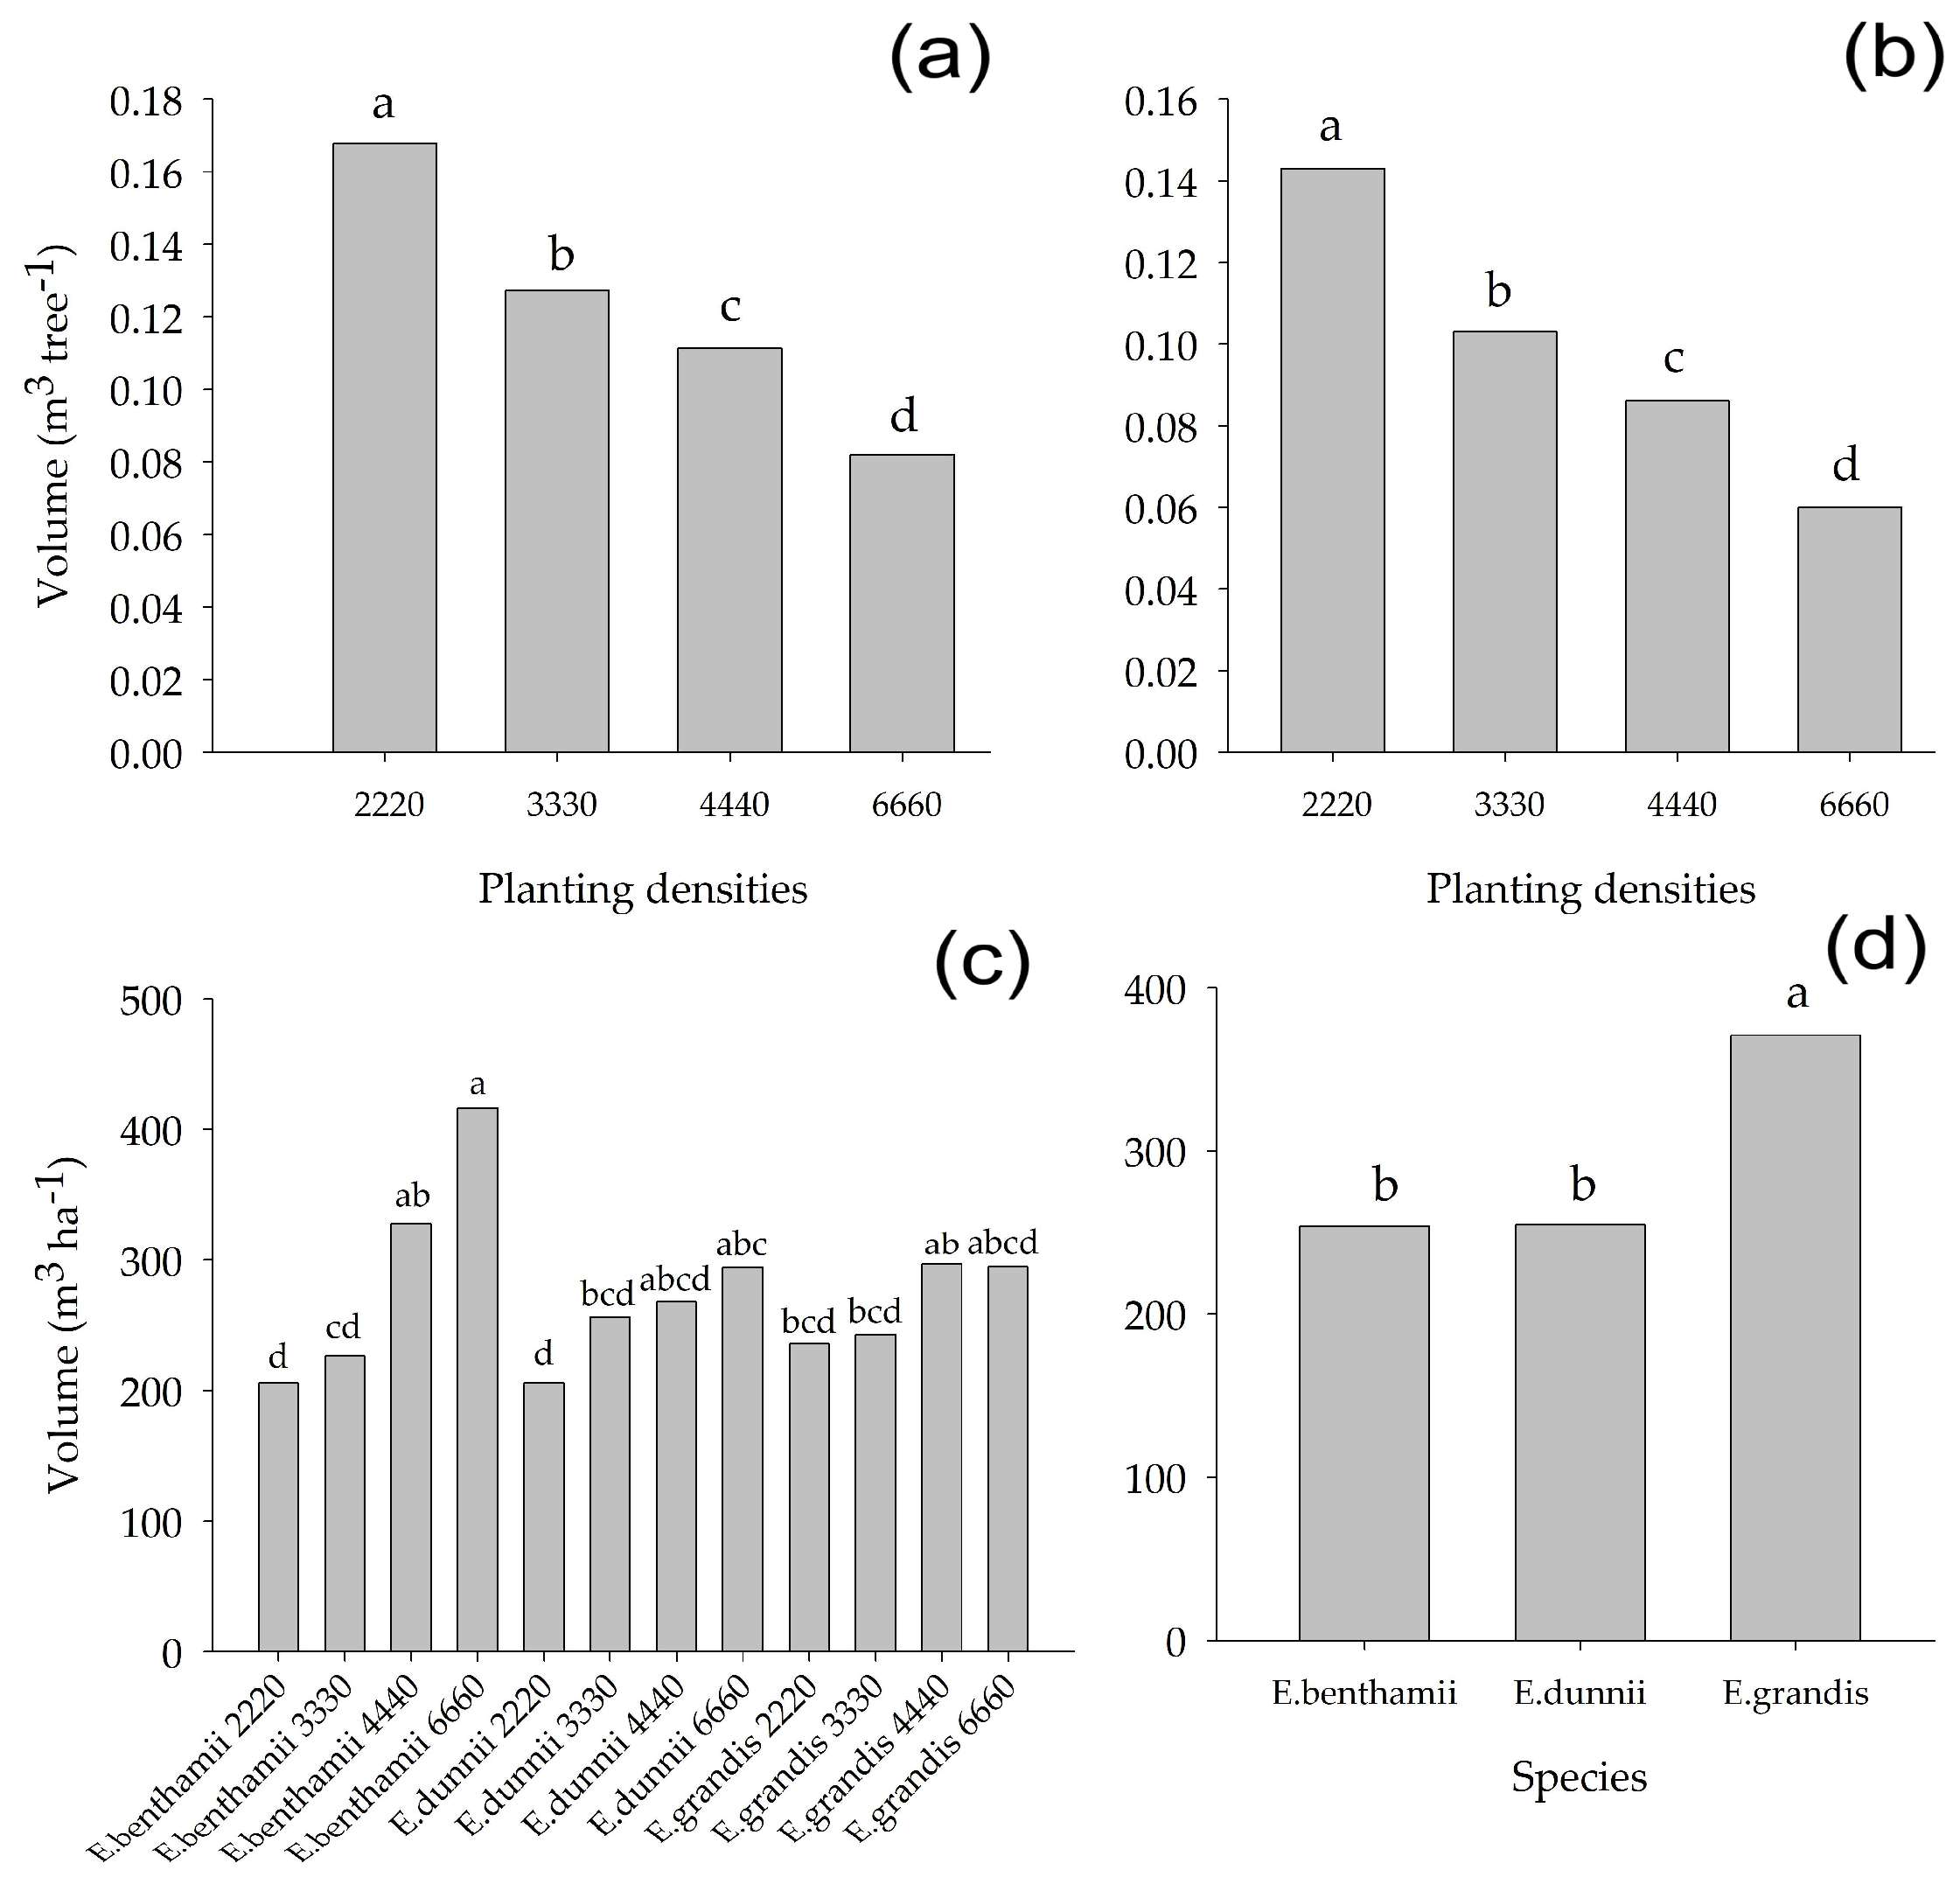
3.3. Alometric Equations and Volume

The tree models of volume are included in Table 4, where the best fits for each species and site are shown. The models indicated in bold are those that were selected based on the R2, RMSE Bias, AIC and measured vs. estimated volume graphs.
The Vi was highly significant at Tacuarembó for the planting density and Paysandú for the species and planting density (Table 2). In Tacuarembó, a significant interaction between the species and planting density was also detected for Vt (F6,18 = 3.65, p = 0.016) and, at Paysandú, a significant effect the species was detected (F2,4 = 9.25, p = 0.031). The maximum values of over bark volume per hectare were obtained with the highest densities (Table 3). At Tacuarembó, E. benthamii showed the highest volume at the highest density (416.4 m3 ha−1) compared to E. grandis, which had the highest volume (427.8 m3 ha−1) at Paysandú. At Tacuarembó, the highest volume values were obtained for E. benthamii at densities of 4440 and 6660 trees per hectare. This, in turn, could have influenced the differences in growth between the two extremes of density (6660 vs. 2220 trees ha−1), as E. benthamii showed an increase of 102% between these two densities. By comparison, E. dunnii and E. grandis exhibited increases in growth of 43 and 25%, respectively. For these two species, growth was greatest at the lowest densities, their values being very similar. At Paysandú, the increase in volume growth at 6660 relative to 2220 trees per hectare was approximately 50% for E. grandis and 16% for E. benthamii, although the latter was not significant; E. dunnii also showed no differences in volume growth between densities, explained by a greater reduction of survival at higher densities.

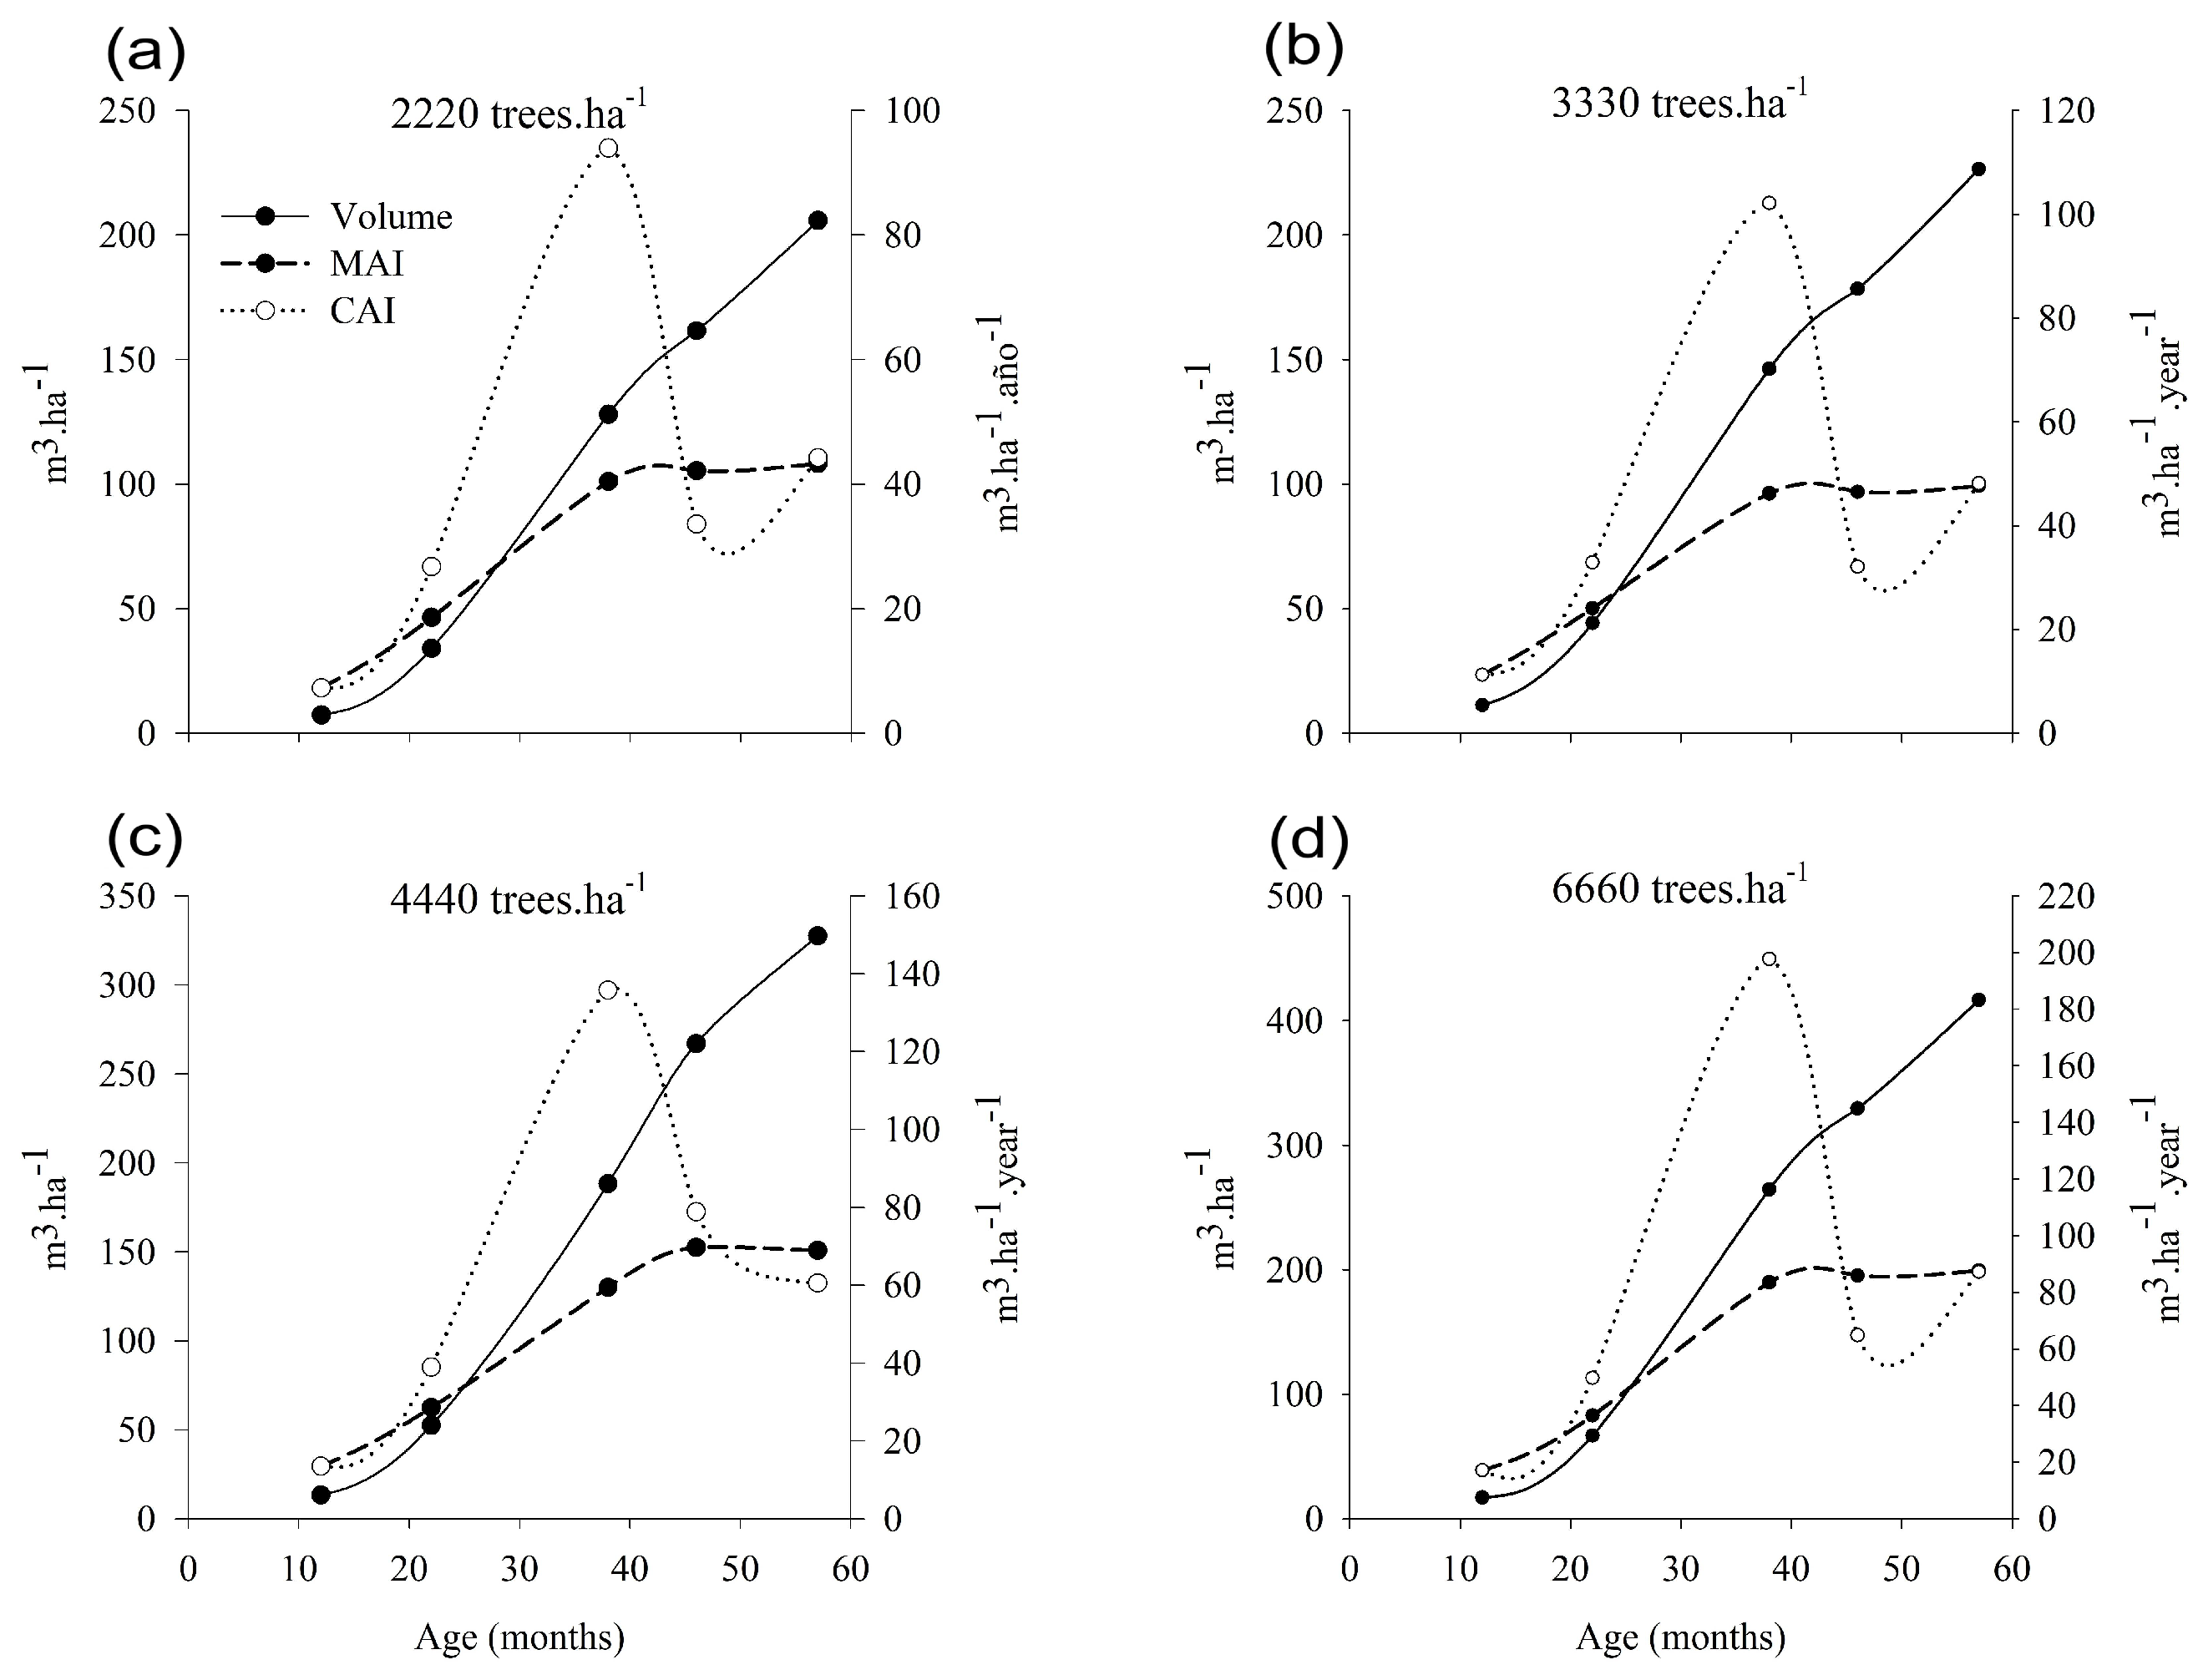
3.4. Optimum Time of Harvest

The higher planting densities resulted in higher MAI and CAI, excepting for E. dunnii in Paysandú, for which values were similar for all plantation densities (Table 3). At Tacuarembó and in all treatments, CAI values increased until the 40th month after which a noticeable reduction in the values of this parameter occurred (Figure 5, Figure 6 and Figure 7), with a change in the volume growth rate with respect to MAI. At Paysandú, the values of both parameters showed a similar tendency in the sense that the major decreases in volume growth occurred around 40 months after planting (Figure 8, Figure 9 and Figure 10). The evolution of MAI was different of that of CAI in the sense that, up to 40 months, the increase continued until the end of the study period (57 months). At Tacuarembó, in most treatments, the CAI was equal to the MAI, and those the optimum time of harvest, in month 46, but, at Paysandú, for all species and planting densities, this point occurred around 49 months after planting.

4. Discussion

4.1. Survival

The results obtained in this work do not confirm the hypothesis that greater competition among trees determines an increase in tree mortality over time [18,19]. There is extensive information on competition in relation to planting density and mortality [20,21]; this indicates that the relationship between these two parameters depends on factors such as age, growth rate and soil quality [22,23] and, in some cases, it is not possible to establish an evident relationship between them [24]. The mortality results of this work indicate that, 57 months after planting, severe competition between individuals was not occurring, even at the highest densities (>6000 trees ha−1). This supports the idea that tree mortality does not depend on planting density [25] and has a random distribution pattern [26] associated with the climate [27]. At each site, the evolution of survival was similar among the three species, but with important differences among the different planting densities. Similar results were obtained when evaluating high planting densities with clones of E. globulus in Chile [28] and when evaluating E. camaldulensis Dehn. at densities up to 2200 trees per hectare [29]. Those authors indicated that the reduction in the number of live trees, at least in the first years of growth, could be explained by reasons other than competition among individuals. Some authors mention soil fertility, the intensity of silviculture and water availability as the main factors that explain the survival of trees in the early stages of growth [30,31]. Soil analysis indicated that soils of both sites are appropriate for growth of all three species studied. Likewise, in both sites, the quality of soil preparation assured good conditions for seedlings´ growth. In this study, a gradual decline in tree survival over the 57 months after planting was observed in all cases, although, at Tacuarembó, there was a noticeable reduction in the number of live trees at 12 months and significant mortality at the end of the evaluation period unlike at Paysandú, where survival was relatively high for most treatments. Higher mortality rate in Tacuarembó could be explained by weed competition in the initial growth stages in this particular site. The precipitation patterns at the two sites do not explain the differences in tree mortality (Figure S1, Supplementary Material). The standardised precipitation index (IPE) of the evaluation period, which measures the excess or deficit of precipitation in relation to the historical average (1980–2010) [32], shows that there were no significant drought events at either site that could have compromised the survival of the trees (Figure S2, Supplementary Material). The average IPE value recorded in the first year at Tacuarembó (−0.6) indicates slightly-dry conditions, but with levels of water availability in the soil that would not be limiting for the growth of these Eucalyptus spp., even in the current situations. In the case of lower planting densities with E. benthamii and E. dunnii, mortality in the last stages of evaluation may be due to the loss of smaller trees [29,33,34]. E. grandis in Tacuarembó, however, was the only species for which lower survival rates was related to competition among trees in higher plantation densities [35,36,37].

4.2. Height, Diameter and Slenderness

For both sites, the Ht and dbh values show that the three species had very similar growth with the exception of E. grandis at Paysandú, with a smaller dbh. The effect of the planting density on growth was consistent with that reported in the literature [30,31,32,33,34,35,36,37,38,39,40]: a reduction of growth as density increased was observed in both sites. The reduction in diameter was greater than for height because of the increased competition among trees; the height largely depends on site quality and is affected little by forestry practices [41,42]. The higher values of dbh recorded for all species at Tacuarembó seem to be related to less competition between individuals, given the lower survival rate recorded at that site. A reduction in dbh and H between the extreme densities (2220 vs. 6660 trees ha−1) was observed for E. dunnii, E. benthamii and E. grandis, respectively. At Paysandú, these differences values were somewhat higher, for both dbh and H. These differences between sites can probably be explained by the higher survival at Paysandú. The effect of the competition also resulted in a smaller tapering, expressed as a lower conicity of the trees, as shown by the ratio between tree height and dbh. For all three species, greater slenderness was obtained when the planting density was increased. This was more evident in Paysandú, probably due to the greater survival rate. Some authors reported increases in the height of eucalyptus species with increased density due to intense competition for light, the trees seeking to maximise the exposed leaf surface area [43,44]. According to several authors, increased competition determines the occurrence of suppressed trees associated to the phenomenon of asymmetric competition (between trees of different size), which determines that smaller trees lose their vigour more quickly than larger trees and become suppressed [35,45]. Some authors consider that this asymmetric competition occurs between both aerial parts and roots [46,47], and that it is more evident at sites with greater availability of resources [48]. This effect is more evident under conditions of more-severe competition (basically for light) associated with more reduced spacing. With wider spacing, there is a high proportion of larger trees, which are more competitive for light and nutrients than trees spaced more closely together [48,49]. The efficiency of the different types of trees is the result of the tissue distribution within the different components of the tree [50], resulting in larger trees with greater growth of wood than of below-ground tissues [51].

4.3. Alometric Equations and Volume

The relationship between the stem volume values and dbh2 and dbh2 × H was assessed using different types of models in agreement with previous studies [52,53,54] (Table 3). Among the independent variables evaluated, the planting density did not make a significant contribution to the fitting of the models. The dbh and dbh × Ht (or their transformations) are frequently used to predict the weight and volume of trees; however, age, density and mean square diameter are variables also used in volume models [5]. These results were expected considering the close relationship between stem volume and dbh and H, although some authors have also obtained models with a high degree of fit using basal area and dominant height as independent variables [5]. The R2 values obtained were high for all the selected models, while REMC and E were very close to zero, which implies that these models have high precision and the results they predict show a very-low deviation from those observed [55]. The E. dunnii and E. grandis selected models were those with the lowest values of AIC in both sites. The graphs analysis of measured vs. estimated volume shows that, except with E. grandis in Paysandú, the point cloud is aligned along the line x = y, with a slope very close to 1, indicating that the errors of the prediction is very low in all cases as shown by the REMC values (Figure S3, Supplementary Material). The E. grandis models for Paysandú underestimate the observed values. With the exception of the E. dunnii model for Paysandú, the models give higher prediction errors as the volume values increase.
The individual volume followed the same trend as Ht and dbh in relation to species and planting density, at both sites (Table 3) [56,57,58]. The evolution of the volume values shows that all species and planting densities had very similar behaviour, with a relatively-sustained increase in volume up to 57 months. According to [36], volume is a better indicator of individual growth with respect to dbh, since, under intense competition, trees may accumulate significant wood volume in the upper portion of the stems. All three species reached similar growth levels, related to greater individual volumes at lower densities. The reduction of volume (6660 trees ha−1 vs. 2220 trees ha−1), as a function of increased competition, was greater than those recorded for dbh and Ht because it added together the responses of these two parameters. This effect was more important at Paysandú, associated with survival differences. On both sites, E. dunnii exhibited the greatest changes in individual growth in relation to tree spacing.
At Tacuarembó, the analysis of variance detected a significant effect of the species planting density interaction, indicating a close relationship between these two factors and the volume per hectare. The values of accumulated volume at both sites confirm the hypothesis that overall productivity is increased by raising the planting density [17]. The highest volume values were obtained for E. benthamii at densities of 4440 and 6660 trees per hectare, explained basically by its greater survival at the final assessment. For all of the species, the growth was lower at the lowest planting densities. This, in turn, could have influenced the differences in growth between the two extremes of density (6660 vs. 2220 trees per hectare), as E. benthamii showed an increase of 102% between these two spacings. By comparison, E. dunnii and E. grandis exhibited increases in growth of 43 and 25%, respectively. For these two species, growth was greatest at the highest densities, their values being very similar. At Paysandú, the evolution of the volume values shows that all species and planting densities had very similar behaviour, with a relatively sustained increase in volume up to 57 months. E. grandis had the greatest volume per hectare, while E. benthamii and E. dunnii reached similarly lower levels. Except for E. dunnii, a direct relationship between volume production and planting density was observed at Paysandú. Several studies have reported the effect of density on volume growth for Eucalyptus species [29,38,56,59]. The increase in volume growth at 6660 relative to 2220 trees per hectare was approximately 50% for E. grandis and 16% for E. benthamii, although the latter was not significant; E. dunnii also showed no differences in volume growth between densities, explained by a greater reduction of survival at higher densities. The volume of E. dunnii increased until 48 months, decreasing thereafter. These results agree with those reported by several other authors, in the sense that the increase in planting density did not translate into the same increment of productivity per unit area [27]. In most cases, individual growth decreased when the density increased; as compensation, the population growth increased [17]. This compensation effect promoted by competition means that increased growth of larger trees exceeds the loss that occurs in smaller trees, resulting in increased productivity per unit area [29].

4.4. Optimum Time of Harvest

At Tacuarembó, the curves of the MAI values showed a similar trend, with two differentiated stages: a first stage with increments, lasting until approximately month 48, and then a second stage with a stabilization of values. The behaviour in this latter stage, according to the reports of some authors, is the result of intense competition producing an increase in the proportions of suppressed trees [17,60]. At Paysandú, the MAI values showed a variable behaviour with a tendency to decrease towards the end of the evaluation period. The highest MAI values were obtained with E. benthamii and E. grandis at Tacuarembó and Paysandú, respectively, as a function of the accumulated volume values.
The intersection of the CAI and MAI curves indicate that the maximum production per unit of time was obtained for trees that were close to 48 months old in most cases, indicating the optimum time of harvest. These results confirm the tendency, cited by several authors, that high densities allow high levels of productivity to be obtained in relatively short times [61,62]. However, the idea that higher planting densities advance the time of harvest was not supported [17], although the results seem to confirm that higher densities give high levels of production in shorter rotations than with lower densities [63,64]. According to some authors, the intense competition at higher densities causes a more proportional use of the environmental resources by the dominant trees, increasing the number of suppressed trees and finally resulting in tree death [65,66]. In these cases, the mortality of suppressed trees probably reduces the effects of competition among trees, allowing larger and dominant trees to maintain their growth rates at relatively high levels [51]. The higher productivity of the Paysandú soil is related to the greater survival and homogeneity of growth, leading to the low presence of small trees, which are inefficient in the use of light [51,67]. Changes in planting densities allow larger trees to maintain high growth rates, which compensate for the low growth of suppressed trees [68]. It is possible, therefore, that, at least up to 57 months of growth, there were no significant limitations on the availability of water for tree growth, taking into account that the soils of the evaluated sites are classified as very suitable for forestry [69] and the high level of precipitation that occurred at both sites [32].

5. Conclusions

The survival of E. grandis, E. benthamii and E. dunnii was not related to planting density, and the highest mortality values occurred, after the first year, in Tacuarembó. At that site, the effects of competition among trees were more evident at the highest planting density for E. grandis. At Paysandú, the survival response of all three species survival to changes in density was very similar. In all species, the reduction in dbh was more marked than that of Ht, as planting density increased. Tree volume showed the same trend as dbh and Ht growth, but with a greater reduction than these at higher densities. At both sites, the total volume values were highest with higher planting densities. Thus, the reduction in individual growth was offset by the increase in the number of trees. At Tacuarembó, the highest production was obtained with E. benthamii at 4440 and 6660 trees per hectare. At Paysandú, E. grandis was the species with the highest levels of productivity per hectare. With all species and planting densities, there was an increase in the accumulated volume during the 57-month study period; however, the growth curves indicate that the maximum production per unit time and, therefore, the optimum harvest time occurred at 48 months. The higher densities did not bring forward the time of harvesting but gave high levels of production in a relatively short time. Results of this study are relevant for foresters or government agents selecting species for biomass production. The information offered could help on planning crop tree plantations at a regional scale, reducing uncertainty of biomass production estimates, and provide a theoretical basis for the sustainable management of intensive Eucalyptus plantations.

Supplementary Materials

The following are available online at https://www.mdpi.com/1999-4907/9/12/745/s1, Figure S1. Rainfall regime evolution along the year in the two studied sites, Figure S2. Standardized rainfall index (SRI) evolution in the two sites throughout the evaluation period (Source: www.meterología.com.uy), Figure S3. Relations between measured and estimated tree volume for each tested specie in Paysandú (a,c,e) and Tacuarembó (b,d,f) sites, Table S1: Main physical and chemical characteristics of Tacuarembó site soil profiletitle, Table S2: Main physical and chemical characteristics of Paysandú site soil profile, Table S3. Coefficients of Height’s models adjusted for each site, specie and planting density.

Author Contributions

F.R., C.R.-C. and L.C.-L. planned and designed the research. F.R. and C.R.-C. conducted fieldwork and performed experiments. R.M.N.-C., A.H. and J.D.-L. contributed to data elaboration and analysis. F.R., R.M.N.-C. and L.C.-L. wrote the manuscript, with contributions by all authors.

Funding

This study was funded by the National Research Institute of Agriculture Research (INIA) and National Agency for Research and Innovation (ANII) through the grant FSE 1 2011 15615 (Evaluación productiva y ambiental de plantaciones forestales para la generación de Bioenergía).

Acknowledgments

The authors thank the INIA, ANII and Forestal Oriental company for its collaboration with the field experiments and plantations.

Conflicts of Interest

The authors declare no conflict of interest.

References

  1. Sixto, H.; Hernández, M.J.; Barrio, M.; Cañellas, J.C.I. Plantaciones del género Populus para la producción de biomasa con fines energéticos: Revisión. Investig. Agrar. Sist. Recur. For. 2007, 16, 277–294. [Google Scholar] [CrossRef]
  2. Estrada, C.A.; Meneses, A.Z. Gasificación de biomasa para producción de combustibles de bajo poder calorífico y su utilización en generación de potencia y calor. Scientia et Technica. 2004, 2. [Google Scholar] [CrossRef]
  3. Gelfand, I.; Sahajpal, R.; Zhang, X.; Izaurralde, R.C.; Gross, K.L.; Robertson, G.P. Sustainable bioenergy production from marginal lands in the US Midwest. Nature 2013, 493, 514–517. [Google Scholar] [CrossRef] [PubMed]
  4. Brown, S. Measuring carbon in forests: Current status and future challenges. Environ. Pollut. 2002, 116, 363–372. [Google Scholar] [CrossRef]
  5. Bravo, F.; Bravo-Oviedo, A.; Diaz-Balteiro, L. Carbon sequestration in Spanish Mediterranean forests under two management alternatives: A modeling approach. Eur. J. For. Res. 2008, 127, 225–234. [Google Scholar] [CrossRef]
  6. González García, M.; Hevia Cabal, M.; Barrio Anta, M. Modelo dinámico de crecimiento y producción de biomasa para cultivos energéticos de Eucalyptus nitens (Maiden) en el noroeste de España. In 6 to Congreso Forestal Español; Sociedad Española de Ciencias Forestales: Vitoria Gateiz, Spain, 2013; pp. 2–8. Available online: http://secforestales.org/publicaciones/index.php/congresos_forestales/article/viewFile/14333/14176 (accessed on 15 June 2017).
  7. Razakamanarivo, R.H.; Razakavololona, A.; Razafindrakoto, M.-A.; Vieilledent, G.; Albrecht, A. Below-ground biomass production and allometric relationships of eucalyptus coppice plantation in the central highlands of Madagascar. Biomass Bioenergy 2012, 45, 1–10. [Google Scholar] [CrossRef]
  8. Winck, R.A.; Fassola, H.E.; Barth, S.R.; Crechi, E.; Keller, A.E.; Videla, D.; Zaderenko, C. Modelos predictivos de biomasa aérea de Eucalyptus grandis para el noreste de Argentina. Ciência Florestal 2015, 25, 595–606. Available online: http://www.scielo.br/scielo.php?script=sci_arttext&pid=S1980-50982015000300595&nrm=iso (accessed on 1 August 2017). [CrossRef]
  9. Ounban, W.; Puangchit, L.; Diloksumpun, S. Development of general biomass allometric equations for Tectona grandis Linn. f. and Eucalyptus camaldulensis Dehnh. plantations in Thailand. Agric. Nat. Resour. 2016, 50, 48–53. [Google Scholar] [CrossRef]
  10. Methol, R. Comparisons of Approaches to Modelling Tree Taper, Stand Structure and Stand Dynamics in Forest Plantations. Ph.D. Thesis, University of Canterbury, Christchurch, New Zealand, 2001. [Google Scholar]
  11. Hirigoyen, A.; Rachid, C.; Varela, F. Actualizaciones de herramientas informáticas para la toma de decisiones forestales. Revista INIA 2013, 35, 58–62. [Google Scholar]
  12. Rachid, C. SAG Eucalyptus: Un nuevo sistema de apoyo a la gestión de plantaciones de Eucalyptus orientadas a la producción de celulosa. Revista INIA 2008, 15, 35–37. [Google Scholar]
  13. Rachid-Casnati, C.; Mason, E.G.; Woollons, R.; Resquin, F. Volume and taper equations for P. taeda (L.) and E. grandis (Hill ex. Maiden). Agrociencia (Montevideo) 2014, 18, 47–60. [Google Scholar]
  14. Castaño, J.P.G.; Ceroni, A.; Furest, M.; Aunchayna, J.; Bidegain, R. Caracterización agroclimática del Uruguay 1980–2009. Ser. Técnica INIA 2011, 193, 33. [Google Scholar]
  15. Bentancor, L. Extracción de Nutrientes por Eucalyptus dunnii Maiden de 4 años con Destino a la Producción de Biomasa para Energía y Celulosa. Master’s Thesis, Universidad de la República, Montevideo, Uruguay, December 2017; p. 99. [Google Scholar]
  16. Rodríguez, A.; Cancino, J.; Acuña, E.; Rubilar, R.; Muñoz, E. Evaluación del crecimiento de plantaciones dendroenergéticas de Eucalyptus globulus, según densidad de plantación y turno de rotacion en suelos contrastantes de la región del Biobío, Chile. Cienc. Investig. For. INFOR Chile 2013, 19, 18. [Google Scholar]
  17. R Core Team. R: A Language and Environment for Statistical Computing; R Foundation for Statistical Computing: Viena, Austria, 2012. [Google Scholar]
  18. Harris, F. The Effect of Competition on Stand, Tree, and Wood Growth and Structure in Subtropical Eucalyptus Grandis Plantations. Ph.D. Thesis, Southern Cross University, Lismore, Australia, January 2007. [Google Scholar]
  19. Schneider, P.R.; Finger, C.A.G.; Schneider, P.S.P.; Fleig, F.D.; da Cunha, T.A. Influência do espaçamento no autodesbaste de povoamento monoclonal de Eucalyptus Saligna Smith. Ciênc. Florest. 2015, 25, 119–126. [Google Scholar] [CrossRef]
  20. Larson, A.J.; Lutz, J.A.; Donato, D.C.; Freund, J.A.; Swanson, M.E.; HilleRisLambers, J.; Sprugel, D.G.; Franklin, J.F. Spatial aspects of tree mortality strongly differ between young and old-growth forests. Ecology 2015, 96, 2855–2861. [Google Scholar] [CrossRef] [PubMed]
  21. Van Gunst, K.J.; Weisberg, P.J.; Yang, J.; Fan, Y. Do denser forests have greater risk of tree mortality: A remote sensing analysis of density-dependent forest mortality. For. Ecol. Manag. 2016, 359, 19–32. [Google Scholar] [CrossRef]
  22. Schönau, A.P.G.; Coetzee, J. Initial spacing, stand density and thinning in eucalypt plantations. For. Ecol. Manag. 1989, 29, 245–266. [Google Scholar] [CrossRef]
  23. Dwyer, J.M.; Fensham, R.J.; Fairfax, R.J.; Buckley, Y.M. Neighbourhood effects influence drought-induced mortality of savanna trees in Australia. J. Veg. Sci. 2010, 21, 573–585. [Google Scholar] [CrossRef]
  24. Lonsdale, W.M. The Self-Thinning Rule: Dead or Alive? Ecology 1990, 71, 1373–1388. [Google Scholar] [CrossRef]
  25. Lintz, H.E.; Gray, A.N.; Yost, A.; Sniezko, R.; Woodall, C.; Reilly, M.; Hutten, K.; Elliott, M. Quantifying density-independentmortality of temperate tree species. Ecol. Indic. 2016, 66, 1–9. [Google Scholar] [CrossRef]
  26. Puettman, K.; Hibbs, D.; Hann, D. The Dynamics of Mixed Stands of Alnus Rubra and Pseudotsuga Menziesii: Extension of Size—Density Analysis to Species Mixture. J. Ecol. 2016, 80, 449–458. [Google Scholar] [CrossRef]
  27. Gendreau-Berthiaume, B.; Macdonald, S.E.; Stadt, J.J. Extended density-dependent mortality in mature conifer forests: Causes and implications for ecosystem management. Ecol. Appl. 2016, 26, 1486–1502. [Google Scholar] [CrossRef] [PubMed]
  28. Schäfer, J.P.R.; Ponce, E.V. Growth and economic analysis of a Eucalyptus globulus clonal spacing trial in Chile. In Proceedings of the Australasian Forest Genetics Conference, Breeding for Wood Quality, Hobart, Australia, 11–14 April 2007. [Google Scholar]
  29. Akhtar, J.; Saqib, Z.A.; Qureshi, R.H.; Haq, M.A.; Iqbal, M.S.; Marcar, N.E. The effect of spacing on the growth of Eucalyptus camaldulensis on salt-affected soils of the Punjab, Pakistan. Can. J. For. Res. 2008, 38, 2434–2444. [Google Scholar] [CrossRef]
  30. Sale, G. A Comparison of Between-Tree Competition Effects in Separate Stands of a Eucalyptus Grandis Seedling and a Single Eucalyptus Grandis x Urophylla Hybrid. Master’s Thesis, University of the Witwatersrand, Johannesburg, South Africa, November 2005. [Google Scholar]
  31. Jacobs, M.R. Growth Habits of the Eucalypts; Forestry and Timber Bureau: Canberra, Australia, 1955; Available online: http://trove.nla.gov.au/version/28637821 (accessed on 25 April 2017).
  32. INUMET. Available online: https://www.inumet.gub.uy/clima/estadisticas-climatologicas (accessed on 4 January 2017).
  33. Bouvet, J.M. Effect of spacing on juvenile growth and variability of eucalyptus clones. Can. J. For. Res. 1997, 27, 174–179. [Google Scholar] [CrossRef]
  34. Newton, P.F.; Jolliffe, P.A. Assessing processes of intraspecific competition within spatially heterogeneous black spruce stands. Can. J. For. Res. 1998, 28, 259–275. [Google Scholar] [CrossRef]
  35. Brand, D.G.; Magnussen, S. Asymmetric, two-sided competition in even-aged monocultures of red pine. Can. J. For. Res. 1988, 18, 901–910. [Google Scholar] [CrossRef]
  36. Von Euler, F.; Baradat, P.; Lemoine, B. Effects of plantation density and spacing on competitive interactions among half-sib families of maritime pine. Can. J. For. Res. 1992, 22, 482–489. [Google Scholar] [CrossRef]
  37. Tomé, M.; Tomé, J.A.; Araújo, M.C.; Pereira, J.S. Intraspecific competition in irrigated and fertilized eucalypt plantations. For. Ecol. Manag. 1994, 69, 211–218. [Google Scholar] [CrossRef]
  38. De Moraes Goncalves, J.L.; Stape, J.L.; Laclau, J.-P.; Smethurst, P.; Gava, J.L. Silvicultural effects on the productivity and wood quality of eucalypt plantations. For. Ecol. Manag. 2004, 193, 45–61. [Google Scholar] [CrossRef]
  39. De Córdova Machado, F.; Guerra, S.P.S.; Ceragioli, N.; Oguri, G.; Denadai, M.S. Influência do espaçamento na produtividade e alocação de biomassa em um plantio de eucalyptus grandis. In Proceedings of the Congresso Internacional de Bioenergia, São Paulo, Brazil, January 2012; pp. 1–6. [Google Scholar]
  40. De Jesus, H.; Junior, E.; Ballarin, A.W. Influência Do Espaçamento Na Densidade Básica Da Madeira Em Sistemas Florestais De Curta Rotação. In Proceedings of the 8th Congresso Internacional de Bioenergia, São Paulo, Brazil, 5–7 November 2013; pp. 5–9. [Google Scholar]
  41. Alcorn, P.J.; Pyttel, P.; Bauhus, J.; Smith, R.G.B.; Thomas, D.; James, R.; Nicotra, A. Effects of initial planting density on branch development in 4-year-old plantation grown Eucalyptus pilularis and Eucalyptus cloeziana trees. For. Ecol. Manag. 2007, 252, 41–51. [Google Scholar] [CrossRef]
  42. De Oliveira Neto, S.N.; dos Reis, G.G.; Reis, M.D.G.F.; Leite, H.G.; Neves, J.C.L. Crescimento e Distribuição Diamétrica de Eucalyptus camaldulensis em Diferentes Espaçamentos e Níveis de Adubação na Região de Cerrado de Minas Gerais. Floresta 2010, 40, 755–762. [Google Scholar] [CrossRef]
  43. Patiño-valera, F.; Kageyama, P.Y. Interaction genotype X spacing in progenies of Eucalyptus saligna Smith. IPEF Int. 1990, 1, 12–22. [Google Scholar]
  44. Assis, R.; Ferreira, M.; de Morais, E.; Fernandes, L. Produção de biomassa de Eucalyptus urophylla s.t. blake sob diferentes espaçamentos na região de cerrado de Minas Gerais. Rev. Arvore 1999, 23, 151–156. [Google Scholar]
  45. Forrester, D.I.; Wiedemann, J.C.; Forrester, R.I.; Baker, T.G. Effects of planting density and site quality on mean tree size and total stand growth of E.ucalyptus globulus plantations. Can. J. For. Res. 2013, 43, 846–851. [Google Scholar] [CrossRef]
  46. Christina, M.; Laclau, J.-P.; Gonçalves, J.L.M.; Jourdan, C.; Nouvellon, Y.; Bouillet, J.-P. Almost symmetrical vertical growth rates above and below ground in one of the world’s most productive forests. Ecosphere 2011, 2, 1–10. [Google Scholar] [CrossRef]
  47. Trouvé, R.; Bontemps, J.D.; Collet, C.; Seynave, I.; Lebourgeois, F. Growth partitioning in forest stands is affected by stand density and summer drought in sessile oak and Douglas-fir. For. Ecol. Manag. 2014, 334, 358–368. [Google Scholar] [CrossRef]
  48. Campoe, O.C.; Stape, J.L.; Nouvellon, Y.; Laclau, J.P.; Bauerle, W.L.; Binkley, D.; Le Maire, G. Stem production, light absorption and light use efficiency between dominant and non-dominant trees of Eucalyptus grandis across a productivity gradient in Brazil. For. Ecol. Manag. 2013, 288, 14–20. [Google Scholar] [CrossRef]
  49. Binkley, D.; Campoe, O.C.; Gspaltl, M.; Forrester, D.I. Light absorption and use efficiency in forests: Why patterns differ for trees and stands. For. Ecol. Manag. 2013, 288, 5–13. [Google Scholar] [CrossRef]
  50. Xue, L.; Pan, L.; Zhang, R.; Xu, P.B. Density effects on the growth of self-thinning Eucalyptus urophylla stands. Trees 2011, 25, 1021–1031. [Google Scholar] [CrossRef]
  51. Binkley, D.; Stape, J.L.; Bauerle, W.L.; Ryan, M.G. Explaining growth of individual trees: Light interception and efficiency of light use by Eucalyptus at four sites in Brazil. For. Ecol. Manag. 2010, 259, 1704–1713. [Google Scholar] [CrossRef]
  52. Rance, S.J.; Mendham, D.S.; Cameron, D.M.; Grove, T.S. An evaluation of the conical approximation as a generic model for estimating stem volume, biomass and nutrient content in young Eucalyptus plantations. New For. 2012, 43, 109–128. [Google Scholar] [CrossRef]
  53. Kuyah, S.; Dietz, J.; Muthuri, C.; van Noordwijk, M.; Neufeldt, H. Allometry and partitioning of above- and below-ground biomass in farmed eucalyptus species dominant in Western Kenyan agricultural landscapes. Biomass Bioenergy 2013, 55, 276–284. [Google Scholar] [CrossRef]
  54. Vega-nieva, D.J. Modeling the above and belowground biomass of planted and coppiced Eucalytpus globulus stands in NW Spain. Ann. For. Sci. 2015, 72, 967–980. [Google Scholar] [CrossRef]
  55. Segura Madrigal, M.A.; Andrade Castañeda, H.J. Cómo construir modelos alométricos de volume. biomasa o carbono de especies leñosas perennes. J. Agroforestería en las Américas 2008, 46, 89–96. [Google Scholar]
  56. Berger, R.; Schneider, P.R.; Finger, C.A.G.; Haselein, C.R. Efeito do espaçamento e da aduabação no crescimento de um clone de Eucalyptus saligna Smith. Ciênc. Florest. 2002, 12, 75–87. [Google Scholar] [CrossRef]
  57. Pinkard, E.A.; Neilsen, W.A. Crown and stand characteristics of Eucalyptus nitens in response to initial spacing: Implications for thinning. For. Ecol. Manag. 2003, 172, 215–227. [Google Scholar] [CrossRef]
  58. Morais, V.de.M. Eucalipto Clonal Sob Diferentes Espaçamentos, Na Região Noroeste Do Estado De Minas Gerais. Available online: http://repositorio.ufla.br/bitstream/1/3766/1/DISSERTA%c3%87%c3%83O_Din%c3%a2mica%20de%20crescimento%20de%20eucalipto%20clonal%20sob%20diferentes%20espa%c3%a7amentos%2c%20na%20regi%c3%a3o%20noroeste%20do%20estado%20de%20Minas%20Gerais.pdf (accessed on 13 November 2018).
  59. Leite, F.P.; de Barros, N.F.; de Novais, R.F.; Sans, L.M.A.; Fabres, A.S. Crescimento de Eucalyptus grandis em diferentes densidades populacionais. Rev. Árvore 1997, 21, 313–321. [Google Scholar]
  60. Balloni, E.A.; Simoes, J.W. O espaçamento de plantio e suas implicações silviculturais. Piracicaba IPEF 1980, 1, 1–16. [Google Scholar]
  61. Goulart, M.; Haselein, C.R.; Hoppe, J.M.; Farias, J.A.; Pauleski, D.T. Massa específica básica e massa seca de madeira de Eucalyptus grandis sob o efeito do espaçamento de plantio e da posição axial no tronco. Ciênc. Florest. 2003, 13, 167–175. [Google Scholar] [CrossRef]
  62. Sochacki, S.J.; Harper, R.J.; Smettem, K.R.J. Estimation of woody biomass production from a short-rotation bio-energy system in semi-arid Australia. Biomass Bioenergy 2007, 31, 608–616. [Google Scholar] [CrossRef]
  63. Chen, S.; Arnold, R.; Li, Z.; Li, T.; Zhou, G.; Wu, Z.; Zhou, Q. Tree and stand growth for clonal E. urophylla × grandis across a range of initial stockings in southern China. New For. 2011, 41, 95–112. [Google Scholar] [CrossRef]
  64. Sartório, I.P. Avaliação e Modelagem do Crescimento de Florestas Energéticas de Eucalipto Plantadas em Diferentes Densidades. Master’s Thesis, Universidade Federal do Paraná, Paraná, Brasil, February 2014. [Google Scholar]
  65. Cunningham, S.C.; Thomson, J.R.; Read, J.; Baker, P.J.; Mac Nally, R. Does stand structure influence susceptibility of eucalypt floodplain forests to dieback? Austral Ecol. 2010, 35, 348–356. [Google Scholar] [CrossRef]
  66. Binkley, D.; Stape, J.L.; Ryan, M.G.; Barnard, H.R.; Fownes, J. Age-related decline in forest ecosystem growth: An individual-tree, stand-structure hypothesis. Ecosystems 2002, 5, 58–67. [Google Scholar] [CrossRef]
  67. Campoe, O.C.; Stape, J.L.; Albaugh, T.J.; Lee Allen, H.; Fox, T.R.; Rubilar, R.; Binkley, D. Fertilization and irrigation effects on tree level aboveground net primary production, light interception and light use efficiency in a loblolly pine plantation. For. Ecol. Manag. 2013, 288, 43–48. [Google Scholar] [CrossRef]
  68. Berger, U.; Hildenbrandt, H.; Grimm, V. Age-related decline in forest productivity: Modelling the role of neighbourhood competition. J. Ecol. 2004, 92, 846–853. [Google Scholar] [CrossRef]
  69. Altamirano, A.; da Silva, H.; Durán, A.; Echeverría, A.; Panario, D.; Puentes, R. Dirección de Suelos y Fertilizantes, Carta de Reconocimiento de Suelos del Uruguay; Tomo III; Descripción de las Unidades de Suelos—Charter Soil Survey of Uruguay. Volume III. Description of Units Soil; Dirección de Suelos y Fertilizantes, Ministerio de Agricultura y Pesca: Montevideo, Uruguay, 1979. [Google Scholar]
Figure 1. Soil classification (a) and regions prioritized for forest plantations including trial locations in Paysandú (yellow triangle) and Tacuarembó (red triangle) (b).
Forests 09 00745 g001
Figure 2. Tree survival for Eucalyptus species and stand density tested in Tacuarembó (a,c,e) and Paysandú (b,d,f) sites (Uruguay).
Forests 09 00745 g002
Figure 3. Results of the Tukey test for means comparison for dbh, Ht and slenderness for Tacuarembó (a,c,e) and Paysandú (b,d,f) at 57 months. Different letters indicate significant differences with a 5% probability level.
Forests 09 00745 g003
Figure 4. Results of the Tukey test for means comparison of Vi and Vt for the Tacuarembó (a,c) and Paysandú (b,d) at 57 months. Different letters indicate significant differences with a 5% probability level.
Forests 09 00745 g004
Figure 5. Cumulative growth, mean annual increment and current annual increment of volume of E. benthamii in Tacuarembó for each stand density. Subfigures (a), (b), (c), (d) corresponding to 2220, 3330, 4440 and 6660 trees ha−1, respectively.
Forests 09 00745 g005
Figure 6. Cumulative growth, mean annual increment and current annual increment of volume of E. dunnii in Tacuarembó for each stand density. Subfigures (a), (b), (c), (d) corresponding to 2220, 3330, 4440 and 6660 trees ha−1, respectively.
Forests 09 00745 g006
Figure 7. Cumulative growth, mean annual increment and current annual increment of volume of E. grandis in Tacuarembó for each stand density. Subfigures (a), (b), (c), (d) corresponding to 2220, 3330, 4440 and 6660 trees ha−1, respectively.
Forests 09 00745 g007
Figure 8. Cumulative growth, mean annual increment and current annual increment of volume of E. benthamii in Paysandú for each stand density. Subfigures (a), (b), (c), (d) corresponding to 2220, 3330, 4440 and 6660 trees ha−1, respectively.
Forests 09 00745 g008
Figure 9. Cumulative growth, mean annual increment and current annual increment of volume of E. dunnii in Paysandú for each stand density. Subfigures (a), (b), (c), (d) corresponding to 2220, 3330, 4440 and 6660 trees ha−1, respectively.
Forests 09 00745 g009
Figure 10. Cumulative growth, mean annual increment and current annual increment of volume of E. grandis in Paysandú for each stand density. Subfigures (a), (b), (c), (d) corresponding to 2220, 3330, 4440 and 6660 trees ha−1, respectively.
Forests 09 00745 g010
Table 1. Split-plot ANOVA effects.
SourceDegrees of Freedom
BlocksB − 1
SpeciesS − 1
Error (Blocks × Species)(B − 1) × (S − 1)
Planting densityPd − 1
Species × Planting density(S − 1) × (Pd − 1)
Error (Blocks × Species × Planting density)(B − 1) × (S − 1) × (Pd − 1)
Total(B × S × Pd) − 1
B, number of blocks; S, number of Species; Pd, number of Planting densities; ANOVA, analysis of variance.
Table 2. p-Values of two-way ANOVA test for total height (Ht), diameter at breast height (dbh), slenderness, tree volume (Vi) and volume per hectare (Vt) in Tacuarembó and Paysandú experiments at 57 months. Bold statistics correspond to significant p-values (p < 0.05).
EffectsVariablesSites
TacuarembóPaysandú
pp
Speciesdbh0.6420.055
Ht0.4010.082
slenderness0.3630.002
Vi0.9130.030
Vt0.3530.031
Planting densitydbh<0.001<0.001
Ht<0.001<0.001
slenderness<0.0010.001
Vi<0.001<0.001
Vt<0.0010.071
Species × Planting densitydbh0.0810.916
Ht0.636<0.001
slenderness0.0930.006
Vi0.0990.170
Vt0.0160.102
Table 3. Average growth values ± S.E. by location, species, and planting density at age 57 months.
SitesSpeciesDensity (trees ha−1)Ht (m)dbh (cm)Slenderness Ht/dbhVolume (m3 tree−1)Volume (m3 ha−1)MAI (m3 ha−1 year−1)CAI (m3 ha−1 year−1)
TacuarembóE. benthamii222017.5(0.2)14.9(0.9)1.18(0.030)0.17(0.016)0.17(0.016)43.3(1.3)44.2(6.2)
333015.6(0.6)11.9(0.1)1.31(0.043)0.11(0.02)0.11(0.02)47.7(5.3)48.1(4.1)
444015.5 (0.8)11.8(1.0)1.31(0.019)0.11(0.02)0.11(0.02)68.9(5.6)60.5(12.4)
666014.1 (0.4)10.3(0.9)1.37(0.053)0.09(0.017)0.09(0.017)87.7(9.5)87.2(22.4)
E. dunnii222016.2(0.1)15.1(0.3)1.07(0.016)0.17(0.008)0.17(0.008)43.3(0.9)43.7(6.0)
333016.5(0.4)14.2(0.6)1.17(0.151)0.14(0.009)0.14(0.009)53.9(1.3)43.0(3.3)
444015.1(0.5)11.9(0.4)1.26(0.124)0.10(0.009)0.10(0.009)56.4(3.1)40.9(0.9)
666013.7(0.7)9.4(0.3)1.45(0.077)0.07(0.006)0.07(0.006)61.9(3.2)51.9(12.7)
E. grandis222016.8(0.5)15.6(0.2)1.08(0.061)0.17(0.009)0.17(0.009)49.6(3.6)54.8(10.2)
333015.3(0.6)13.5(0.7)1.14(0.032)0.13(0.007)0.13(0.007)51.2(3.4)59.0(3.3)
444015.8(1.2)12.7(0.3)1.24(0.018)0.12(0.007)0.12(0.007)62.5(2.4)64.9(9.0)
666013.6(0.6)11.2(0.2)1.21(0.013)0.09(0.004)0.09(0.004)62.0(3.0)47.5(10.3)
PaysandúE. benthamii222017.6(0.3)12.6(0.3)1.40(0.030)0.13(0.005)0.13(0.005)49.4(1.8)8.9(16.8)
333014.4(0.4)10.8(0.1)1.34(0.043)0.08(0.002)0.08(0.002)50.5(3.8)54.2(29.7)
444014.3(0.4)9.9(0.2)1.44(0.019)0.08(0.003)0.08(0.003)56.7(2.7)20.0(18.6)
666011.9(0.1)8.3(0.4)1.44((0.053)0.05(0.005)0.05(0.005)57.4(4.0)49.7(17.0)
E. dunnii222017.4(0.8)12.7(0.3)1.37(0.016)0.14(0.008)0.14(0.008)53.9(3.3)15.7(8.4)
333017.2(0.7)10.4(0.4)1.65(0.151)0.09(0.009)0.09(0.009)56.8(5.1)16.5(7.4)
444015.2(0.5)9.2(0.4)1.65(0.124)0.07(0.007)0.07(0.007)51.7(5.4)14.7(11.9)
666014.7(0.3)7.8(0.2)1.88(0.077)0.05(0.004)0.05(0.004)52.4(2.8)−9.2(8.3.8)
E. grandis222016.4(0.5)13.8(0.9)1.19(0.061)0.16(0.016)0.16(0.016)60.1(5.7)34.4(8.4)
333016.2(0.4)12.1(0.1)1.34(0.032)0.14(0.006)0.14(0.006)77.1(4.7)36.0(18.7)
444015.0(0.6)10.6(0.6)1.41(0.018)0.11(0.014)0.11(0.014)85.8(6.4)71.2(6.0)
666013.2(0.5)9.3(0.1)1.42(0.013)0.08(0.002)0.08(0.002)90.1(3.0)35.2(20.3)
MAI: Mean annual increment, CAI: Current annual increment.
Table 4. Predictive equations and statistics of fit for individual tree volume (Vi) for three species of Eucalyptus planted in each studied site. The selected models are in bold.
SiteSpeciesModelsR2RMSEBiasAICFp-Value
TacuarembóE. benthamiiVi = exp((−9.86876 − 0.29901 × Ln(dbh) + 1.05411 × Ln(dbh2 × Ht))0.990.0090.0001−36215150<0.001
Vi = exp((−9.35966 + 2.75971 × Ln(dbh))0.940.020−0.00101215111<0.001
Vi = −0.02471 + 0.006340 × (dbh) + 0.00003951 × (dbh2 × Ht) × −0.0003778 × (dbh2)0.980.0090.0048−11114197<0.001
E. dunniiVi = −0.005625 + 0.001523 × (dbh) + 0.00003184 × (dbh2Ht)0.980.0020.0050−10196033<0.001
Vi = exp((−8.38487 + 2.38262 × Ln(dbh))0.950.0150.00041045095<0.001
Vi = exp((−9.86876 − 0.29901 × Ln(dbh) + 1.05411 × Ln(dbh2 × Ht))0.960.0130.00792087893<0.001
E. grandisVi = −0.01781 + 0.004755 × (dbh) − 0.0003141 × (dbh2) + 0.00004038 × (dbh2 × Ht)0.990.0070.0042−11598847<0.001
Vi = exp((−9.48276 + 1.38990 × Ln(dbh2))0.960.0170.00011188696<0.001
Vi = exp((−9.79678 + 0.12407 × Ln(dbh) + 0.91076 × Ln(dbh2 × Ht))0.990.0080.000523631360<0.001
PaysandúE. benthamiiVi = exp((−9.711769 + 0.936637 × Ln(dbh2 × Ht))0.990.0050.0002−44144070<0.001
Vi = exp((−8.99697 + 02.65528 × Ln(dbh))0.960.0110.0040−15105885<0.001
Vi = exp((−9.70756 + 0.01996 × Ln(dbh) + 0.92976 × Ln(dbh2 × Ht))0.990.0050.0002−44121910<0.001
E. dunniiVi = 0.02608 − 0.009986 × (dbh) + 0.001309 × (dbh2)0.980.0090.0068−10933177<0.001
Vi = exp((−9.01150 + 2.65731 × Ln(dbh))0.950.0100.00201164011<0.001
Vi = exp((−9.01550 + 1.32866 × Ln(dbh2))0.960.0090.00161164011<0.001
E. grandisVi= −0.006259 + 0.002463 × (dbh) + 0.00004120 × (dbh2 × Ht)0.000226 × (dbh2)0.990.0040.0026−137122980<0.001
Vi = exp((−9.25879 + 2.75792 × Ln(dbh))0.960.0150.00011166477<0.001
Vi = exp((−9.79678 + 0.12407 × Ln(dbh) + 0.91076 × Ln(dbh2 × Ht))0.990.0050.000523328120<0.001

