Methane Emission from Mangrove Wetland Soils Is Marginal but Can Be Stimulated Significantly by Anthropogenic Activities


1
Ministry of Education Key Laboratory for Earth System Modeling, Department of Earth System Science, Tsinghua University, Beijing 100084, China
2
Joint Center for Global Change Studies, Beijing 100875, China
3
Graduate School at Shenzhen, Tsinghua University, Shenzhen 518055, China
4
Department of Botany, University of Wyoming, Laramie, WY 82071, USA
5
Yantai Institute of Coastal Zone Research, Chinese Academy of Science, Yantai 264006, China
6
School of Life Sciences, Sun Yat-sen University, Guangzhou 510275, China
*
Author to whom correspondence should be addressed.
Forests 2018, 9(12), 738; https://doi.org/10.3390/f9120738
Submission received: 21 October 2018
/
Revised: 21 November 2018
/
Accepted: 22 November 2018
/
Published: 27 November 2018
(This article belongs to the Special Issue Disturbance Effects on Soil Carbon and Greenhouse Gas Emissions in Forest Ecosystems)
Abstract
:Mangrove wetland soils have been considered as important sources for atmospheric CH4, but the magnitude of CH4 efflux in mangrove wetlands and its relative contribution to climate warming compared to CO2 efflux remains controversial. In this study, we measured both CH4 and CO2 effluxes from mangrove soils during low or no tide periods at three tidal zones of two mangrove ecosystems in Southeastern China and collected CH4 efflux data from literature for 24 sites of mangrove wetlands worldwide. The CH4 efflux was highly variable among our field sites due to the heterogeneity of mangrove soil environments. On average, undisturbed mangrove sites have very low CH4 efflux rates (ranging from 0.65 to 14.18 μmol m−2 h−1; median 2.57 μmol m−2 h−1), often less than 10% of the global warming potentials (GWP) caused by the soil CO2 efflux from the same sites (ranging from 0.94 to 9.50 mmol m−2 h−1; median 3.67 mmol m−2 h−1), even after considering that CH4 has 28 times more GWP over CO2. Plant species, study site, tidal position, sampling time, and soil characteristics all had no significant effect on mangrove soil CH4 efflux. Combining our field measurement results and literature data, we demonstrated that the CH4 efflux from undisturbed mangrove soils was marginal in comparison with the CO2 efflux in most cases, but nutrient inputs from anthropogenic activities including nutrient run-off and aquaculture activities significantly increased CH4 efflux from mangrove soils. Therefore, CH4 efflux from mangrove wetlands is strongly influenced by anthropogenic activities, and future inventories of CH4 efflux from mangrove wetlands on a regional or global scale should consider this phenomenon.
1. Introduction
Global wetlands are considered as important carbon sinks for sequestering high amounts of carbon dioxide (CO2) from the atmosphere and contain more than 30% of the world’s organic carbon in the soils, despite accounting for only 5%–8% of the global terrestrial surface [1,2,3]. Mangrove wetlands could be key ecosystems in addressing climate regulation through their high productivity and effective carbon (C) sequestration rates [4,5,6,7]. The global carbon sequestration rate in mangrove wetlands is on average 174 g C m−2 year−1, corresponding to about 10%–15% of global coastal ocean carbon storage [8]. Organic-rich soils dominate in mangrove carbon storage, accounting for 49%–98% of carbon stocks in mangrove wetlands [9,10]. However, the buried carbon may releases back into the atmosphere as gaseous products such as CO2 and methane (CH4) [1]. Meanwhile, wetlands are also identified as major CH4 sources for the atmosphere, emitting 177 to 284 Tg CH4 year−1, corresponding to approximately 40% of the total global CH4 emission [11]. CH4 has a global warming potential 28 times greater than that of CO2 on a 100-year timescale and directly contributes to about 20% of recent climate warming, despite the fact its concentration is two orders of magnitude lower than that of CO2 [12]. Thus, proper quantification of CH4 efflux from mangrove wetlands is critical to evaluating its effect on climate warming mitigation. Additional knowledge of mangrove wetlands’ CH4 emission will further provide guidance on mangrove wetlands restoration efforts to mitigate atmospheric CO2 increase.
CH4 efflux from mangrove soils is generally identified to be low but highly variable [13,14,15,16]. The practice of mangrove carbon budget has shown that carbon burial, soil respiration, and soil CH4 emission are 24 Tg C year−1, 36 Tg C year−1, and 2 Tg C year−1, respectively [8], assuming a mangrove extent area of 138,000 km2 [17]. Low CH4 production and emission is mainly due to the presence of high sulfate in mangrove soil, which allows sulfate-reducing bacteria to outcompete CH4-producing bacteria [18,19,20]. Additionally, mangrove ecosystems are inundated by periodic tides and receive nutrient input from anthropogenic activities, which provides an anaerobic environment and high availability of substrate for methanogenesis [21]. Recent studies reported a significant amount of CH4 efflux from mangrove wetland soils [21,22,23] and claimed that the contribution of CH4 efflux to climate warming was non-negligible in the estuarine mangrove wetlands, which could account for 9.3%–32.7% plant CO2 sequestration [24]. Thus, considerable uncertainty still exists regarding the magnitude of mangrove soil CH4 efflux and its contribution to climate warming, which requires further study.
The carbon stocks in mangrove wetlands of China play an essential role in global oceanic carbon cycling and differ among mangrove species in subtropical and tropical regions [25]. Large spatio-temporal variations in CH4 efflux have been observed in mangrove soils [18,23,26]. Previous studies indicated that CH4 efflux varied among different tidal positions, probably due to differences in soil temperature, salinity, and pH [27]. Temporal variation in CH4 efflux could be explained by soil temperature, the position of the water table, and the availability of suitable substrate [23,28,29]. Meanwhile, mangrove wetlands in China are facing greater pollution pressure due to chemical discharge from aquaculture activity and sea-wall construction [30]. However, there are few studies that investigate human perturbations such as nutrient loading from aquaculture ponds on mangrove soil CH4 efflux even though these activities can significantly change these factors [7,26].
In this study, we measured both soil CH4 and CO2 effluxes from mangrove wetland soils during low or no tide periods at three tidal zones of two mangrove ecosystems in Southeastern China and collected available CH4 efflux data from literature for global mangrove wetlands. The aims of this study were to identify the magnitude of CH4 efflux in mangroves wetlands with and without the influence of anthropogenic activities and to evaluate the relative contribution of CH4 efflux over CO2 efflux from mangrove wetland soils to climate warming.
2. Materials and Methods
2.1. Study Site Description
The study was conducted in two mangrove wetlands in Southeastern China, including Zhangjiang Estuary Mangrove National Natural Reserve (23°55′49″ N, 117°24′54″ E, abbreviated as the ZJ (Zhangjiang Estuary) site) and Qinglan Harbour Mangrove Provincial Natural Reserve (19°37′48″ N, 110°46′12″ E, abbreviated as the QL (Qinglan Harbour) site) (Figure 1).
ZJ site is located in an estuary of the Zhangjiang River, Yunxiao County, Fujian Province, China, with a subtropical marine monsoon climate. The monthly mean air temperature ranged from 13.5 °C in January to 28.9 °C in August, and the annual mean air temperature was 21.2 °C. Annual mean rainfall was 1714.5 mm, most of which occurred during the wet season from April to September. Tides were semidiurnal, with an annual mean tidal-level variation of 2.32 m. The salinity of the seawater ranged from 12 to 26 ppt. The vegetation was dominated by Kandelia obovata Sheue, Liu & Yong (red mangrove), Aegiceras corniculatum (L.) Blanco (black mangrove), and Avicennia marina (Forssk.) Vierh. (grey mangrove), mixed with some other less common mangrove species such as Bruguiera gymnorrhiza (L.) Savigny (black mangrove) and Acanthus ilicifolius L. (holy mangrove) [31].
QL site, situated in Wenchang County, Hainan Province, China, experienced a tropical monsoon climate. Annual mean air temperature was 23.9 °C, and the lowest monthly mean temperature was 18.3 °C in January. The annual precipitation was 1974 mm, of which more than 82% occurred during the wet season from May to October. Tides were semi-diurnal, and the tidal-level ranged from 0.01 m to 2.38 m, with the largest tidal-level variation of 2.07 m in one tidal cycle. The dominant mangrove species at QL site, which had the largest number of mangrove species in China, were Bruguiera sexangula (Lour.) Poir. (upriver orange mangrove), Sonneratia caseolaris (L.) Engl. (mangrove apple), Lumnitzera racemosa Willd. (tonga mangrove), Ceriops tagal (Pers.) C.B.Rob. (spurred mangrove), and Rhizophora apiculata Blume (red mangrove) communities [32,33].
2.2. Measurements of Soil CH4 and CO2 Effluxes
Sampling campaigns were undertaken in July 2013 (represented wet season) and February 2014 (represented dry season) at ZJ site, and in August 2016 (represented wet season) and November 2017 (represented dry season) at QL site. For each sampling time, measurements were conducted in three tidal positions: landward zone (LW), middle zone (MZ), and seaward zone (SW), with the exception of SW at ZJ site during the dry season due to heavy rainfall making the site inaccessible. At each sampling position, four chambers were set up, and four replicated samples were collected on the same day at each site for a total of twelve samples. During low or no tide periods in the day time, we measured environmental variables and collected samples for laboratory analyses. The soil inundation and exposure duration were similar among three tidal positions and four replicates samples.
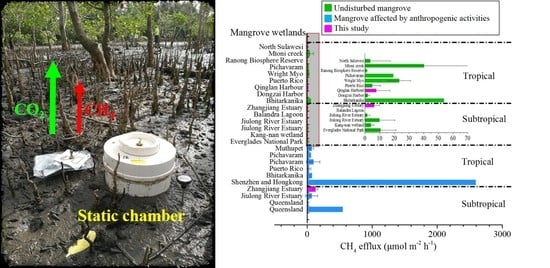
Gas effluxes from the soil were quantified through the standard static (closed) chamber technique [23]. Measurements were taken using PVC chambers (diameter 20 cm, length 15 cm, volume 4.50 L, and enclosing 0.025 m2). The open end of chamber was slightly inserted into the soil to a depth of 2–3 cm to ensure minimal lateral gas leakage. A controllable valve above the chamber was left open for 30 min prior to sampling, which is adequate to remove impacts of root disturbance caused by the chamber insertion, and then the valve was closed during the whole measurements time. Deployment time was set at 2 h, with sampling at 0, 30, 60, 90, and 120 min intervals. Headspace gas was mixed carefully through the vent tube, and 8 ml gas samples were collected using a 50 mL gas-tight syringe equipped with a luer-lock valve (SGE Trajan Scientific and Medical Pty Ltd., Melbourne, Australia). Gas samples were then transferred into pre-evacuated gas sampling bags or vials for storage (Dalian Delin Gas Packing Inc., Dalian, Liaoning, China). The air temperature inside the chamber was measured simultaneously with the gas sampling.
All samples were transported to laboratory and analyzed within 24 h using an Agilent 7890A gas chromatograph (Agilent Technologies Inc., Wilmington, DE, USA) equipped with a flame ionization detector (FID) and a Poropak-Q column. The column and detector temperatures were set at 60 °C and 130 °C, respectively, with nitrogen as the carrier gas at a flow rate of 1200 mL s−1. Standard curves were gained by injecting a series volume of pure CH4 (99.992%) and CO2 (99.999%) in high purity N2 (99.999%, HKO Co Ltd., Hong Kong, China). The CH4 and CO2 concentrations were quantified by calculating the peak areas of samples against standards of similar concentration ranges. During the gas measurement, standard gas (40 mL L−1 CH4 and 2000 mL L−1 CO2) was analyzed every 10 samples to ensure data quality. Gas effluxes were calculated based on a linear least squares fit of the time series of gas concentrations. Data were accepted if the slope of the linear fit had a R2 > 0.80.
2.3. Measurements of Environmental Factors
For each chamber measurement, soil cores (0–10 cm surface soil) were collected using a hand-held PVC tube after gas sampling. The soil samples were divided into two subsamples: fresh soil and air-dried soil. Soil moisture content was determined by oven-drying of 7 g fresh soil at 105 °C to a constant weight. Soil inorganic N (NH4+-N and NO3--N) contents were extracted with 2 M KCl from fresh soil samples and then analyzed using a UV-2501PC UV–VIS spectrophotometer (Shimadzu Inc., Japan) [23]. While both NH4+-N and NO3--N extraction methods require fresh soil samples, the samples from ZJ-SW during the wet season and ZJ-LW and ZJ-MZ during the dry season were dried before we could take any measurements. Air-dried soil was sieved through a 2 mm sieve. The pH and salinity were measured at a w (soil): v (water) of 1:5 and 1:2.5 soil slurry using an electrochemistry benchtop meter, Orion™ Versa Star Pro™ (Thermo Fisher Scientific Inc., Beverly, MA, USA). Soil total carbon content (TC), total nitrogen content (TN), and C:N ratio of air-dried soil were measured using the an elementar analyzer (Vario EL III, Elementar Analysensysteme GmbH Inc., Hanau, Germany). Analysis of soil characteristics all followed the standard methods described by Page et al. (1982), and data were expressed in term of 105 °C oven-dried weight.
2.4. Conversion to CO2—Equivalent Efflux
The global warming potential for CH4 was converted to CO2 equivalents using a multiplier of 28 for 100-year timescale [34] to compare their global warming effects.
2.5. Collecting CH4 Efflux Data from Literature
A total of 24 studies of CH4 efflux from mangrove soil were reviewed (Table S2). These studies were selected because the same static chamber method was used as our study, which made the results comparable. We divided the mangrove wetlands into undisturbed and anthropogenic sites according to the eutrophic status of the chosen study sites (Table S3). Undisturbed sites are defined as not affected by nutrient input from anthropogenic activities involving agricultural, domestic, aquaculture, or other run-off from treatment plants as indicated by the reference’s study site descriptions. Anthropogenic sites are those known to be influenced by activities described above.
2.6. Statistical Analysis
Two-way analysis of variance (ANOVA) was used to determine significance of differences between means of soil characteristics and effluxes of CH4 and CO2 among tidal positions and sampling time. If the difference was significant at p < 0.05, a Post-hoc Turkey test was used to determine where the difference lay. All data were expressed as means ± standard error (SE) with four replicates. Paired t-test was used to compare the differences in soil characteristics and effluxes of CH4 and CO2 among tropical and subtropical mangrove wetlands. Pearson correlation coefficient values (r) were calculated to determine the relationship between soil characteristics and CH4 and CO2 effluxes. All analysis processes were performed using SPSS 21.0 for Windows (SPSS Inc., Chicago, IL, USA).
3. Results
3.1. Soil CH4 and CO2 Effluxes
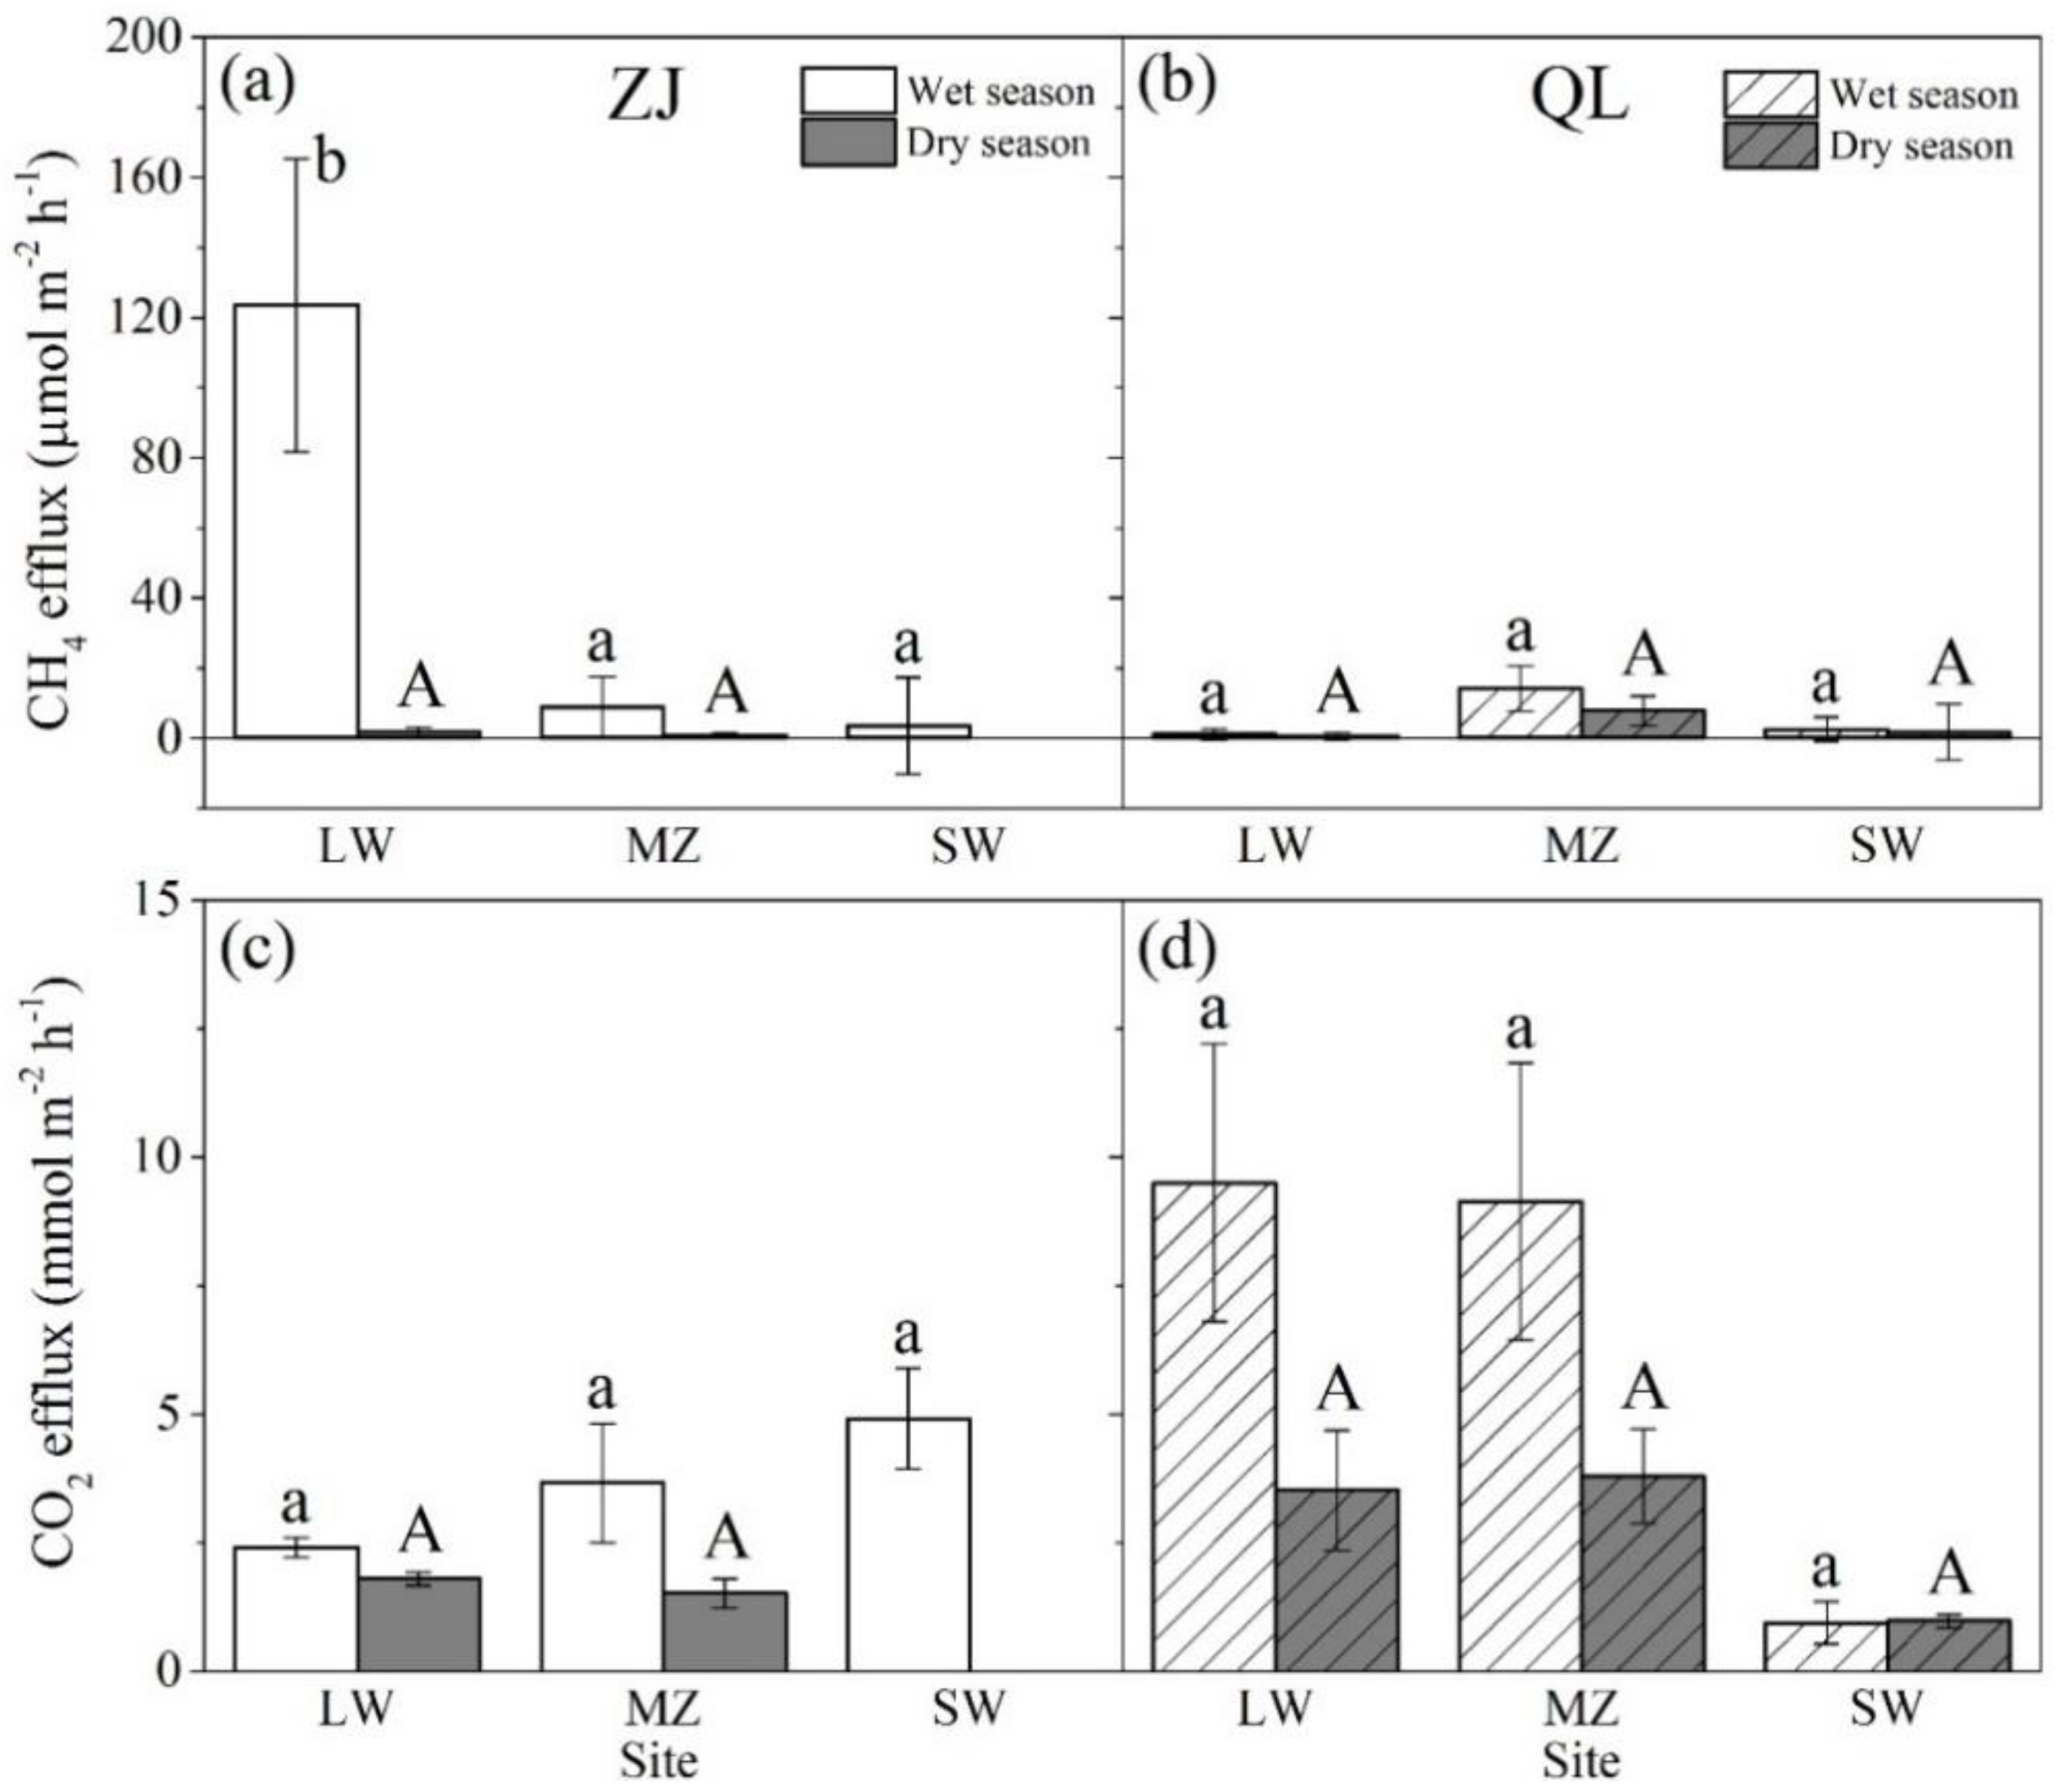
CH4 efflux was highly variable among the sampling sites, for most sampling sites; CH4 efflux was small and almost negligible, ranging from 0.65 ± 0.91 to 14.18 ± 6.35 μmol m−2 h−1, while at the landward zone in Zhangjiang Estuary site (abbreviated as ZJLW) during the wet season, CH4 efflux was about 10 times higher than the highest value found at other sites (123.59 ± 41.79 μmol m−2 h−1) (Figure 2a,b and Table S1). CO2 efflux ranged from 0.94 ± 0.41 to 9.50 ± 2.70 mmol m−2 h−1, and the highest and lowest values were recorded at landward and seaward zones in Qinglan Harbour mangrove wetland during wet season (Figure 2c, Figure 2d and Table S1). No significant difference was found in soil CH4 and CO2 effluxes between ZJ and QL sites (p = 0.173 and p = 0.111).
At ZJ site, CH4 efflux ranged from 0.73 ± 0.73 to 123.59 ± 41.79 μmol m−2 h−1 (Figure 2a), and significant differences in CH4 efflux among tidal positions and sampling time were found (p = 0.006 and p = 0.002, respectively). The highest and lowest CH4 values were recorded at landward zone during wet season and middle zone during dry season, respectively. Soil CH4 efflux was higher in wet season than that in the dry season at all sites. The CO2 efflux ranged from 1.52 ± 0.29 to 4.91 ± 0.98 mmol m−2 h−1 and did not differ significantly with tidal positions and seasons (p = 0.160 and p = 0.108) (Figure 2c).
At QL site, the value of soil CH4 efflux ranged from 0.65 ± 0.91 to 14.18 ± 6.35 μmol m−2 h−1 and showed no significant differences among different tidal positions and sampling time (p > 0.05) (Figure 2b). CH4 efflux at the middle zone was the highest, followed by the CH4 efflux at seaward zone. The CO2 efflux ranged from 0.94 ± 0.41 to 9.50 ± 2.70 mmol m−2 h−1 (Figure 2d) and changed with tidal position and sampling time significantly (p = 0.045 and p = 0.042, respectively). The lowest value of CO2 efflux was measured at seaward zone, and highest CO2 efflux was observed during wet season rather than dry season.
3.2. Soil Characteristics
Soil characteristics measured during wet and dry season at ZJ and QL sites are shown in Table 1. There were significant differences in soil temperature, pH, TC content, TN content, and C:N ratio among subtropical (ZJ site) and tropical (QL site) mangrove wetlands (p < 0.05). The mangrove soils had higher pH values (ranging from 6.62 ± 0.16 to 7.43 ± 0.14) at QL site than that at ZJ site (ranging from 5.46 ± 0.31 to 7.11 ± 0.03). Higher soil temperature, TC content, TN content, and C:N ratio were detected at QL site than at ZJ site (p < 0.05). Salinity and soil moisture content were not significantly different between QL site and ZJ site and were not significantly influenced by tidal positions and sampling time (p > 0.05).
At ZJ site, significantly higher soil temperatures were observed in the wet season rather than dry season (p = 0.015). Tidal position had significant effect on pH, TN content, and C:N ratio (p < 0.05). Lowest pH but highest TC content, TN content, and C:N ratio were observed in the middle zone (p < 0.05).
At QL site, both soil temperature and C:N ratio were significantly different between wet and dry season. Higher soil temperature and a lower C:N ratio were observed in wet season (p < 0.05). The pH value, NH4+-N content, NO3--N content, TN content, TC content, and C:N ratio were significantly affected by tidal position (p < 0.05). With an increase in tidal positions, salinity, pH value, and C:N ratio gradually increased, while the NH4+-N content, NO3--N content, TN content, and TC content gradually decreased.
3.3. The Relationship between Gas Effluxes and Soil Characteristics
Among soil characteristics measured in current study, soil temperature and pH were correlated with CO2 efflux. The soil temperature had positive effect on CO2 efflux (p = 0.011, r = 0.342), while pH had negative effect on it (p < 0.001, r = −0.506). No significant relationship among CH4 efflux and any soil characteristics was recorded in this study.
4. Discussions
4.1. Magnitude of CH4 Efflux from Mangrove Wetland Soils
Combining our data and literature data, we found CH4 efflux from undisturbed mangrove wetlands was negligible but can be stimulated significantly by anthropogenic activities (Figure 3). The results from our direct field measurements indicated that low CH4 efflux was recorded in undisturbed mangrove soils of Southeastern China, ranging from 0.65 ± 0.91 to 14.18 ± 6.35 μmol m−2 h−1, which was consistent with the results found by others in nearby undisturbed mangrove areas [35,36,37]. The highest CH4 efflux (123.59 ± 41.79 μmol m−2 h−1) was observed at landward zone in ZJ mangrove wetland, probably due to large and frequent discharge of freshwater as indicated by very low salinity at this site (as low as 2 ppt) (Table 1). This result was similar to the CH4 efflux in the Jiulong River mangrove, which was also heavily influenced by human activities and positively correlated with NH4+-N, organic carbon, and total Kjeldahl nitrogen [24]. Mangrove ecosystems are rich in carbon but nutrient-poor; in particular, they are limited by nitrogen and phosphorus [38]. Anthropogenic nutrient input improves microbial metabolic process, enhancing more emission of CH4 efflux from soils into the atmosphere [39].
In addition, the CH4 efflux data from literature for 24 sites of mangrove wetlands worldwide showed that mangroves affected by anthropogenic activities (ranging from 0.19 to 5168.62 μmol m−2 h−1 with the median values of 52.80 μmol m−2 h−1) had emission rates 14 times higher than those from undisturbed mangroves (ranging from −6.05 to 79.00 μmol m−2 h−1 with the median of 3.57 μmol m−2 h−1). These CH4 efflux data revealed that the mangroves affected by anthropogenic activities made a greater contribution to climate warming rather than those undisturbed or not heavily disturbed mangrove forests. Anthropogenic activities cause significant increases in CH4 emission, and if anthropogenic activities continue at the current pace without protective measures, these ecosystems could become potential major sources of CH4 emission and decrease their ability to store carbon in the future [40]. The current study divided the mangrove wetlands into undisturbed and affected by anthropogenic activities based on whether the chosen study sites have involved agricultural, domestic, aquaculture, or other run-off from treatment plants in the references. Further research is needed to quantify the stimulation effect of nutrient input from anthropogenic activities on CH4 emissions, combined with controlled experiments and microbial community analysis to model the extent of change.
4.2. Contribution of CH4 Efflux from Mangrove Wetlands to Climate Warming
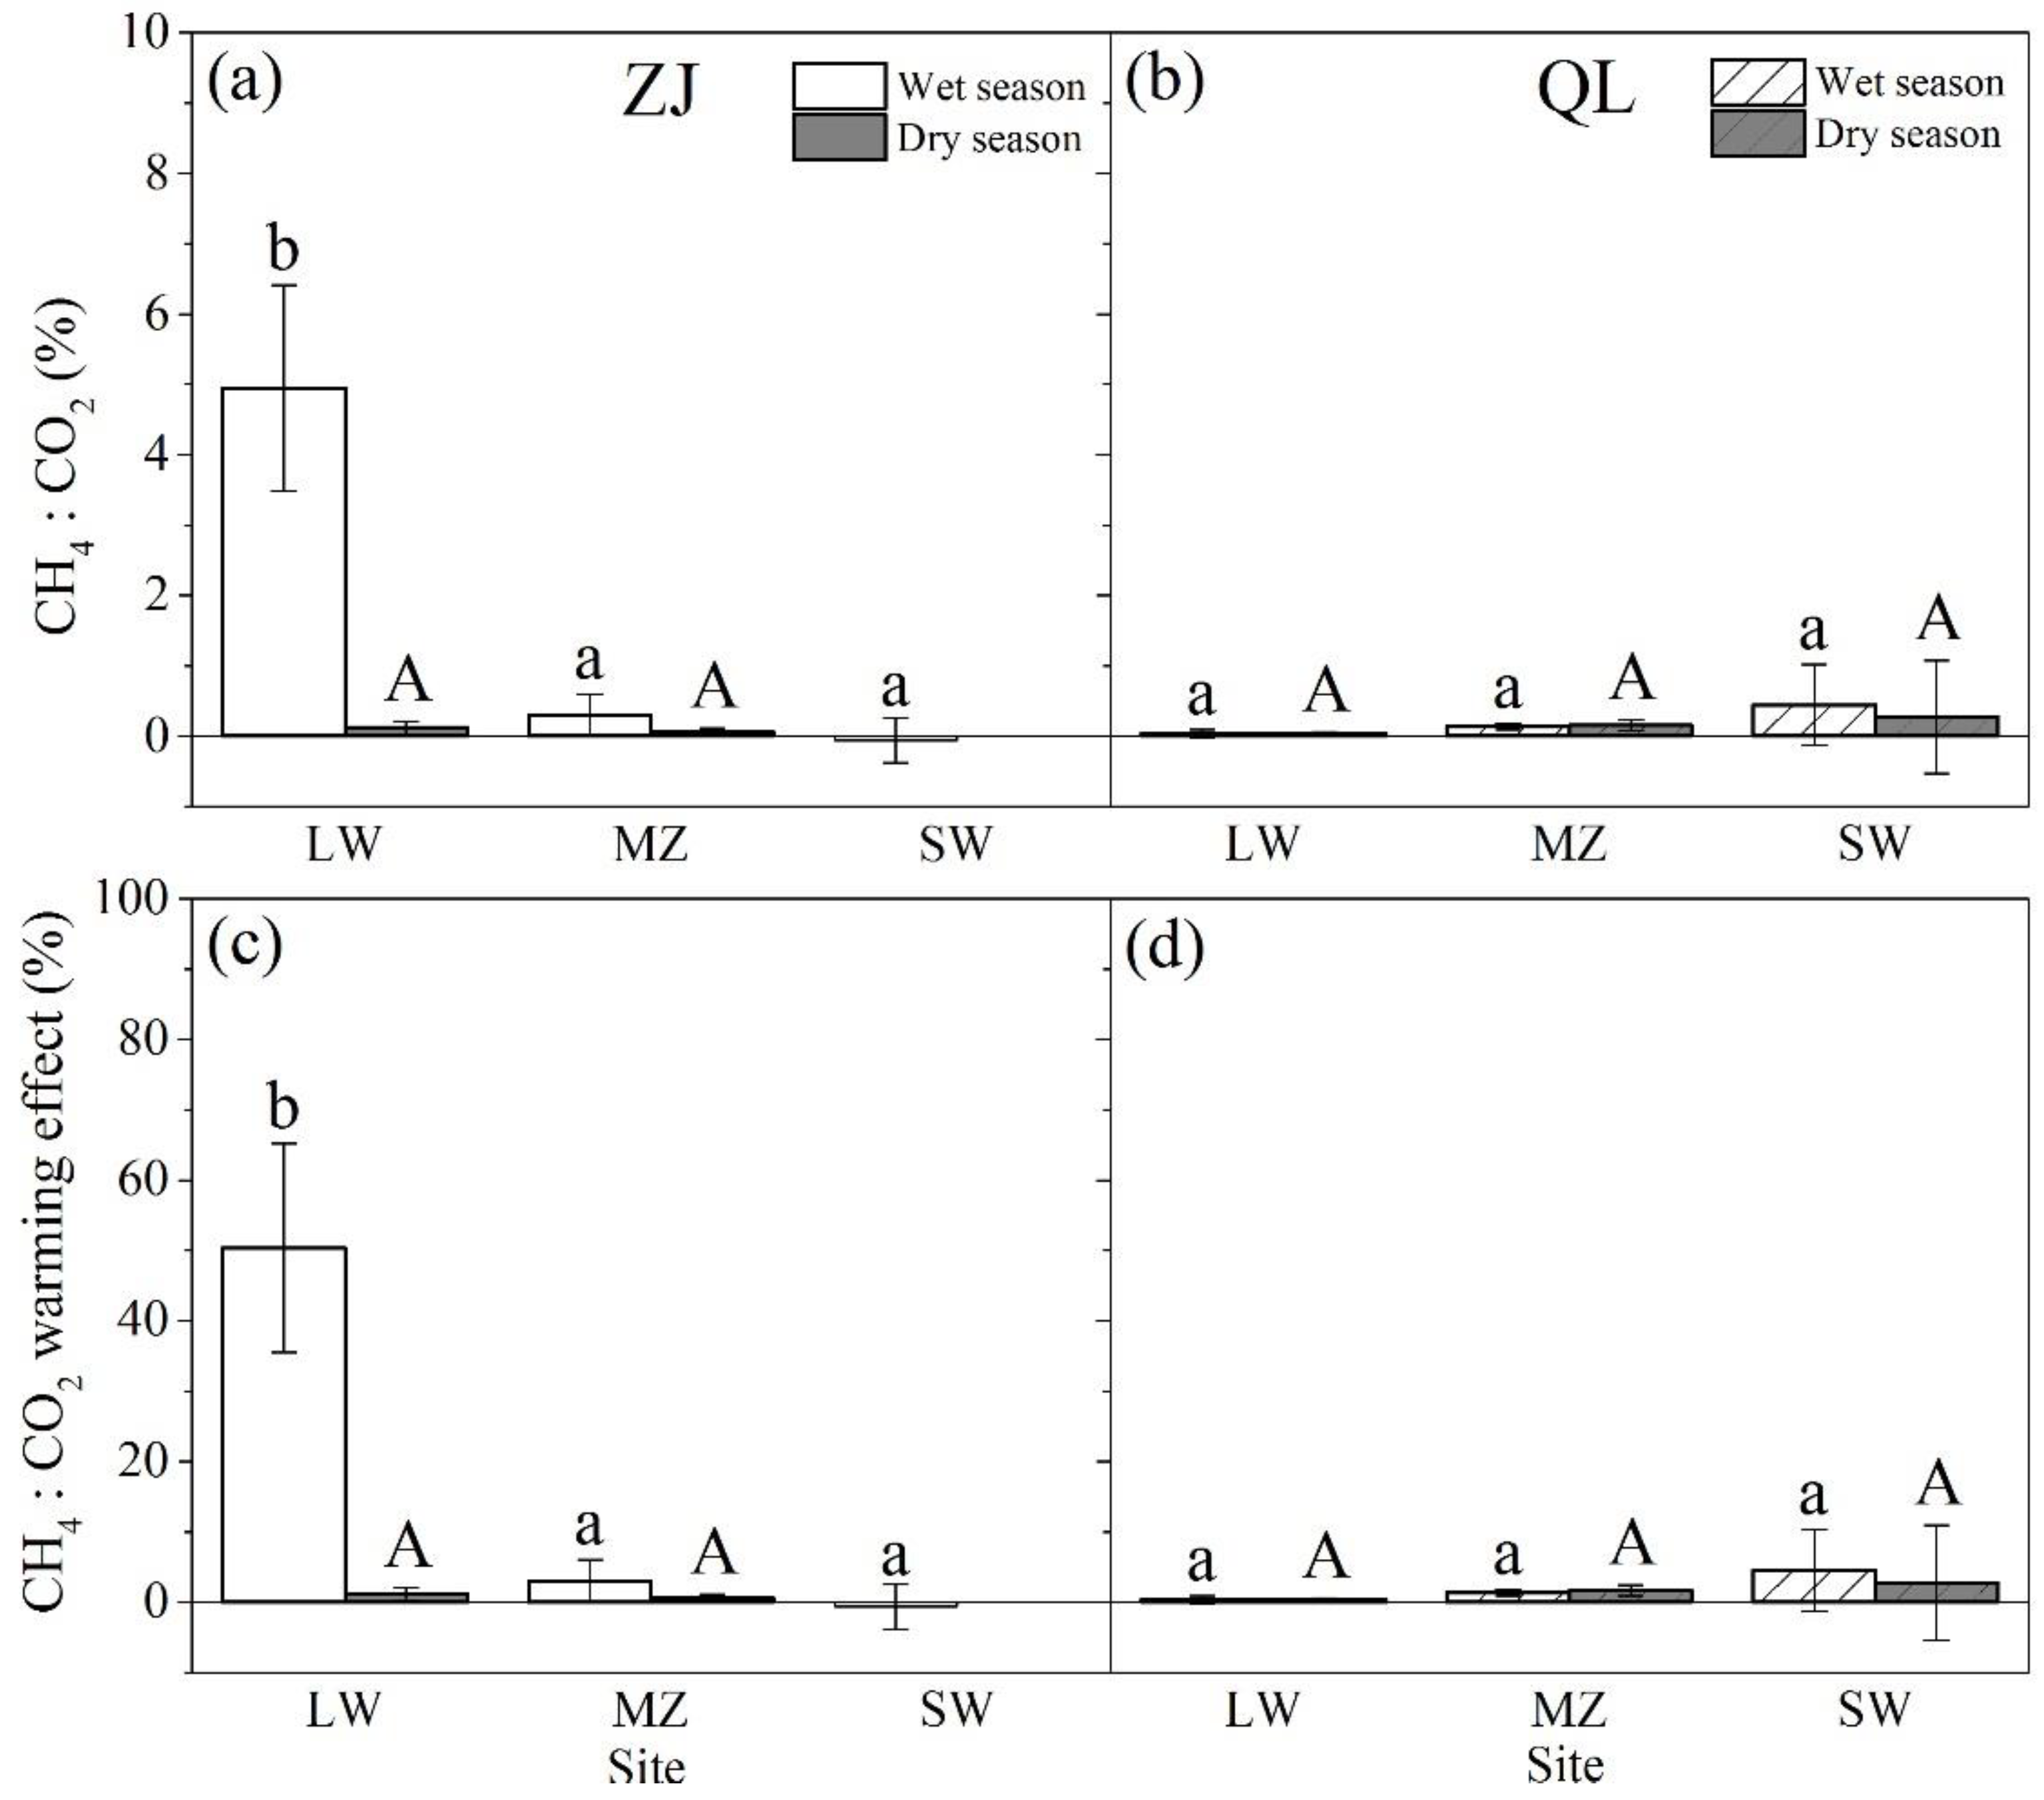
We calculated CH4:CO2 efflux ratio and CH4:CO2 warming effect ratio to evaluate the relative role of CH4 efflux for warming potentials (Figure 4) among different tidal zones in two mangrove wetlands. The CH4:CO2 efflux ratio ranged from −0.06% ± 0.32% to 0.45% ± 0.57% in most sampling sites except for the disturbed ZJLW site (4.95% ± 1.46%). Considering CH4 global warming potential in 100-year term, CH4 accounted for −0.63% ± 3.21% to 4.54% ± 5.79% of the warming effect, a relatively minor contributor to CO2 equivalents, except at the ZJLW site, which was 50.37% ± 14.85%, making it a highly significant contributor. A higher CH4:CO2 warming effect ratio had been reported in the Jiulong River mangrove (10.30% to 48.35%) [24] and Futian mangrove (18.36% to 255.96%) [21] in South China, which received significant amounts of anthropogenic nutrient inputs. This reveals that the magnitude and contribution of CH4 efflux from undisturbed mangrove soils to climate warming was marginal in comparison with CO2 efflux, but could be a potential major contributor to warming effect under the influence of anthropogenic activities.
In addition, the global median CH4 efflux in mangrove wetlands (3.57 and 52.80 μmol m−2 h−1 for undisturbed mangroves and mangroves affected by anthropogenic activities, respectively) was negligible in contrast to other wetlands, such as freshwater wetlands (69.44 to 6944.44 μmol m−2 h−1) (Chmura et al., 2003), peatlands (31.39 to 59.93 μmol m−2 h−1) [41], and rice paddies (709.38 μmol m−2 h−1) [42]. This indicates that mangrove wetlands were not significant contributors to global wetland CH4 budget compared with other wetlands. Recent studies have also found that mangrove soils acted as a net carbon sink after subtracting the effects of CH4 emission from carbon sequestration [43]. Overall, mangrove wetlands should be restored and protected to mitigate climate warming without great concern for warming effect caused by CH4 emission.
5. Conclusions
The current study suggests that undisturbed mangrove soils were minor contributors to climate warming, but the CH4 efflux from mangrove wetlands was significantly increased by nutrient inputs from anthropogenic activities including nutrient run-off and aquaculture activities. This phenomenon should be considered in order to better quantify the emission of CH4 from regional or global mangrove wetlands and to evaluate the potential roles of constructed or restored mangrove wetlands for mitigating climate warming.
Supplementary Materials
The following are available online at https://www.mdpi.com/1999-4907/9/12/738/s1, Table S1: CH4 and CO2 effluxes from ZJ and QL mangrove wetlands; Table S2: summary of CH4 efflux data as reported by authors or calculated from literature in other mangrove wetlands; and Table S3: nutrient concentrations and assignment of eutrophic status.
Author Contributions
G.L. conceived and designed the experiment. X.Z., J.G., W.S. and J.F conducted the experiment and collected data. X.Z. and G.L. analyzed the data and wrote the initial draft of the manuscript. All authors contributed to the editing and revising of the final version of the manuscript. The authors approved the final version for publication and agree to be held accountable for the content therein.
Funding
This research described in this paper was supported financially by National Basic Research Program of China (973 Program); Ministry of Science and Technology, China (2013CB956601); Shenzhen Basic Research Discipline Layout Project, Shenzhen Science and Technology Innovation Committee, China (JCYJ20150529164918736); and the Ocean Open Public Fund Project, State Oceanic Administration, China (201305021).
Acknowledgments
We thank Jianzhang Chen for assistance in the elemental and Gas Chromatograph analyses, and Guangqiang Zheng, Jie Liang, Ziyao Yang and Jiacheng Lv for their assistances in field sampling and measurements. We thank Chris Feng for improving the English of this manuscript.
Conflicts of Interest
The authors declare no conflict of interest.
References
- Mitsch, W.J.; Bernal, B.; Nahlik, A.M.; Mander, Ü.; Zhang, L.; Anderson, C.J.; Jørgensen, S.E.; Brix, H. Wetlands, carbon, and climate change. Landsc. Ecol. 2012, 28, 583–597. [Google Scholar] [CrossRef]
- Sun, L.; Song, C.; Lafleur, P.M.; Miao, Y.; Wang, X.; Gong, C.; Qiao, T.; Yu, X.; Tan, W. Wetland-atmosphere methane exchange in Northeast China: A comparison of permafrost peatland and freshwater wetlands. Agric. For. Meteorol. 2017, 249, 239–249. [Google Scholar] [CrossRef]
- Mitra, S.; Wassmann, R.; Vlek, P.L.G. An appraisal of global wetland area and its organic carbon stock. Curr. Sci. 2005, 88, 25–35. [Google Scholar]
- McLeod, E.; Chmura, G.L.; Bouillon, S.; Salm, R.; Björk, M.; Duarte, C.M.; Lovelock, C.E.; Schlesinger, W.H.; Silliman, B.R. A blueprint for blue carbon: Toward an improved understanding of the role of vegetated coastal habitats in sequestering CO2. Front. Ecol. Environ. 2011, 9, 552–560. [Google Scholar] [CrossRef] [Green Version]
- Sitoe, A.; Mandlate, L.; Guedes, B. Biomass and Carbon Stocks of Sofala Bay Mangrove Forests. Forests 2014, 5, 1967–1981. [Google Scholar] [CrossRef] [Green Version]
- Cui, X.; Liang, J.; Lu, W.; Chen, H.; Liu, F.; Lin, G.; Xu, F.; Luo, Y.; Lin, G. Stronger ecosystem carbon sequestration potential of mangrove wetlands with respect to terrestrial forests in subtropical China. Agric. For. Meteorol. 2018, 249, 71–80. [Google Scholar] [CrossRef]
- Lu, W.; Xiao, J.; Liu, F.; Zhang, Y.; Liu, C.; Lin, G. Contrasting ecosystem CO2 fluxes of inland and coastal wetlands: A meta-analysis of eddy covariance data. Glob. Chang. Biol. 2017, 23, 1180–1198. [Google Scholar] [CrossRef] [PubMed]
- Alongi, D.M. Carbon cycling and storage in mangrove forests. Ann. Rev. Mar. Sci. 2014, 6, 195–219. [Google Scholar] [CrossRef] [PubMed]
- Benson, L.; Glass, L.; Jones, T.; Ravaoarinorotsihoarana, L.; Rakotomahazo, C. Mangrove Carbon Stocks and Ecosystem Cover Dynamics in Southwest Madagascar and the Implications for Local Management. Forests 2017, 8, 190. [Google Scholar] [CrossRef]
- Donato, D.C.; Kauffman, J.B.; Murdiyarso, D.; Kurnianto, S.; Stidham, M.; Kanninen, M. Mangroves among the most carbon-rich forests in the tropics. Nat. Geosci. 2011, 4, 293–297. [Google Scholar] [CrossRef]
- Ciais, P.; Sabine, C.; Manyothers, I.; Patra, P.; Ciais, P.; Sabine, C.; Manyothers, I.; Patra, P. Chapter 6: Carbon and Other Biogeochemical Cycles; Cambridge University Press: Cambridge, UK, 2014. [Google Scholar]
- Stocker, T.F.; Qin, D.; Plattner, G.-K.; Tignor, M.; Allen, S.K.; Boschung, J.; Nauels, A.; Xia, Y.; Bex, V.; Midgley, P.M. Climate Change 2013: The Physical Science Basis. Contribution of Working Group I to the Fifth Assessment Report of the Intergovernmental Panel on Climate Change; Cambridge University Press: Cambridge, UK; New York, NY, USA, 2013; pp. 465–570. [Google Scholar]
- Harriss, R.C.; Sebacher, D.I.; Bartlett, K.B.; Bartlett, D.S.; Crill, P.M. Sources of atmospheric methane in the south Florida environment. Glob. Biogeochem. Cycle 1988, 2, 231–243. [Google Scholar] [CrossRef]
- Sotomayor, D.; Corredor, J.E.; Morell, J.M. Methane flux from mangrove sediments along the southwestern coast of Puerto Rico. Estuaries 1994, 17, 140–147. [Google Scholar] [CrossRef]
- Kristensen, E. Carbon Balance in Mangrove Sediments: The Driving Processes and Their Controls; Gendai Tosho: Kanagawa, Japan, 2007; pp. 61–78. [Google Scholar]
- Chen, G.C.; Ulumuddin, Y.I.; Pramudji, S.; Chen, S.Y.; Chen, B.; Ye, Y.; Ou, D.Y.; Ma, Z.Y.; Huang, H.; Wang, J.K. Rich soil carbon and nitrogen but low atmospheric greenhouse gas fluxes from North Sulawesi mangrove swamps in Indonesia. Sci. Total Environ. 2014, 487, 91–96. [Google Scholar] [CrossRef] [PubMed]
- Giri, C.; Ochieng, E.; Tieszen, L.L.; Zhu, Z.; Singh, A.; Loveland, T.; Masek, J.; Duke, N. Status and distribution of mangrove forests of the world using earth observation satellite data. Glob. Ecol. Biogeogr. 2011, 20, 154–159. [Google Scholar] [CrossRef]
- Biswas, H.; Mukhopadhyay, S.K.; Sen, S.; Jana, T.K. Spatial and temporal patterns of methane dynamics in the tropical mangrove dominated estuary, NE coast of Bay of Bengal, India. J. Mar. Syst. 2007, 68, 55–64. [Google Scholar] [CrossRef]
- Segarra, K.E.A.; Comerford, C.; Slaughter, J.; Joye, S.B. Impact of electron acceptor availability on the anaerobic oxidation of methane in coastal freshwater and brackish wetland sediments. Geochim. Cosmochim. Acta 2013, 115, 15–30. [Google Scholar] [CrossRef]
- Nobrega, G.N.; Ferreira, T.O.; Neto, M.S.; Queiroz, H.M.; Artur, A.G.; Mendonca, E.D.; Silva, E.D.; Otero, X.L. Edaphic factors controlling summer (rainy season) greenhouse gas emissions (CO2 and CH4) from semiarid mangrove soils (NE-Brazil). Sci. Total Environ. 2016, 542, 685–693. [Google Scholar] [CrossRef] [PubMed]
- Chen, G.C.; Tam, N.F.Y.; Ye, Y. Summer fluxes of atmospheric greenhouse gases N2O, CH4 and CO2 from mangrove soil in South China. Sci. Total Environ. 2010, 408, 2761–2767. [Google Scholar] [CrossRef] [PubMed]
- Mukhopadhyay, S.; Biswas, H.; De, T.; Sen, B.; Sen, S.; Jana, T. Impact of Sundarban mangrove biosphere on the carbon dioxide and methane mixing ratios at the NE Coast of Bay of Bengal, India. Atmos. Environ. 2002, 36, 629–638. [Google Scholar] [CrossRef]
- Allen, D.E.; Dalal, R.C.; Rennenberg, H.; Meyer, R.L.; Reeves, S.; Schmidt, S. Spatial and temporal variation of nitrous oxide and methane flux between subtropical mangrove sediments and the atmosphere. Soil Biol. Biochem. 2007, 39, 622–631. [Google Scholar] [CrossRef]
- Chen, G.; Chen, B.; Yu, D.; Tam, N.F.Y.; Ye, Y.; Chen, S. Soil greenhouse gas emissions reduce the contribution of mangrove plants to the atmospheric cooling effect. Environ. Res. Lett. 2016, 11, 124019. [Google Scholar] [CrossRef] [Green Version]
- Liu, H.; Ren, H.; Hui, D.; Wang, W.; Liao, B.; Cao, Q. Carbon stocks and potential carbon storage in the mangrove forests of China. J. Environ. Manag. 2014, 133, 86–93. [Google Scholar] [CrossRef] [PubMed]
- Wang, H.T.; Liao, G.S.; D’Souza, M.; Yu, X.Q.; Yang, J.; Yang, X.R.; Zheng, T.L. Temporal and spatial variations of greenhouse gas fluxes from a tidal mangrove wetland in Southeast China. Environ. Sci. Pollut. Res. 2016, 23, 1873–1885. [Google Scholar] [CrossRef] [PubMed]
- Chauhan, R.; Datta, A.; Ramanathan, A.L.; Adhya, T.K. Factors influencing spatio-temporal variation of methane and nitrous oxide emission from a tropical mangrove of eastern coast of India. Atmos. Environ. 2015, 107, 95–106. [Google Scholar] [CrossRef]
- Walter, B.P.; Heimann, M. A process-based, climate-sensitive model to derive methane emissions from natural wetlands: Application to five wetland sites, sensitivity to model parameters, and climate. Glob. Biogeochem. Cycle 2000, 14, 745–765. [Google Scholar] [CrossRef] [Green Version]
- Inubushi, K.; Furukawa, Y.; Hadi, A.; Purnomo, E.; Tsuruta, H. Seasonal changes of CO2, CH4 and N2O fluxes in relation to land-use change in tropical peatlands located in coastal area of South Kalimantan. Chemosphere 2003, 52, 603–608. [Google Scholar] [CrossRef]
- Zai-Wang, Z.; Xiang-Rong, X.; Yu-Xin, S.; Shen, Y.; Yong-Shan, C.; Jia-Xi, P. Heavy metal and organic contaminants in mangrove ecosystems of China: A review. Environ. Sci. Pollut. Res. Int. 2014, 21, 11938–11950. [Google Scholar]
- Lin, P. The Comprehensive Report of Science Investigation on the Natural Reserve of Mangrove Wetland of Zhangjiang Estuary in Fujian; Xiamen University Press: Xiamen, China, 2001. [Google Scholar]
- Ding, H.; Yao, S.; Chen, J. Authigenic pyrite formation and re-oxidation as an indicator of an unsteady-state redox sedimentary environment: Evidence from the intertidal mangrove sediments of Hainan Island, China. Cont. Shelf Res. 2014, 78, 85–99. [Google Scholar] [CrossRef]
- Guo, Z.Z.; Guo, Y.; Wen, W.; Cao, M.; Guo, J.; Li, Z. Soil carbon sequestration and its relationship with soil pH in Qinglangang mangrvoe wetlands in Hainan island (in Chinese). Sci. Silvae Sin. 2014, 50, 8–15. [Google Scholar]
- Myhre, G.; Shindell, D.; Bréon, F.-M.; Collins, W.; Fuglestvedt, J.; Huang, J.; Koch, D.; Lamarque, J.-F.; Lee, D.; Mendoza, B. Anthropogenic and natural radiative forcing. Clim. Chang. 2013, 423, 658–740. [Google Scholar]
- Lu, C.Y.; Wong, Y.S.; Tam, N.F.; Ye, Y.; Lin, P. Methane flux and production from sediments of a mangrove wetland on Hainan Island, China. Mangroves Salt Marshes 1999, 3, 41–49. [Google Scholar] [CrossRef]
- Alongi, D.M.; Pfitzner, J.; Trott, L.A.; Tirendi, F.; Dixon, P.; Klumpp, D.W. Rapid sediment accumulation and microbial mineralization in forests of the mangrove Kandelia candel in the Jiulongjiang Estuary, China. Estuar. Coast. Shelf Sci. 2005, 63, 605–618. [Google Scholar] [CrossRef]
- Chen, Y.P.; Chen, G.C.; Ye, Y. Coastal vegetation invasion increases greenhouse gas emission from wetland soils but also increases soil carbon accumulation. Sci. Total Environ. 2015, 526, 19–28. [Google Scholar] [CrossRef] [PubMed]
- Alongi, D. Impact of Global Change on Nutrient Dynamics in Mangrove Forests. Forests 2018, 9, 596. [Google Scholar] [CrossRef]
- Kreuzwieser, J.; Buchholz, J.; Rennenberg, H. Emission of Methane and Nitrous Oxide by Australian Mangrove Ecosystems. Plant Biol. 2003, 5, 423–431. [Google Scholar] [CrossRef]
- Purvaja, R.; Ramesh, R. Natural and Anthropogenic Methane Emission from Coastal Wetlands of South India. Environ. Manag. 2001, 27, 547–557. [Google Scholar] [CrossRef]
- Abdalla, M.; Hastings, A.; Truu, J.; Espenberg, M.; Mander, Ü.; Smith, P. Emissions of methane from northern peatlands: A review of management impacts and implications for future management options. Ecol. Evolut. 2016, 6, 7080–7102. [Google Scholar] [CrossRef] [PubMed]
- Chen, H.; Zhu, Q.A.; Peng, C.H.; Wu, N.; Wang, Y.F.; Fang, X.Q.; Jiang, H.; Xiang, W.H.; Chang, J.; Deng, X.W.; et al. Methane emissions from rice paddies natural wetlands, lakes in China: Synthesis new estimate. Glob. Chang. Biol. 2013, 19, 19–32. [Google Scholar] [CrossRef] [PubMed]
- Cabezas, A.; Mitsch, W.J.; MacDonnell, C.; Zhang, L.; Bydałek, F.; Lasso, A. Methane emissions from mangrove soils in hydrologically disturbed and reference mangrove tidal creeks in southwest Florida. Ecol. Eng. 2018, 114, 57–65. [Google Scholar] [CrossRef]
Figure 1.
Map of sampling location and climatic conditions. (a) Geographical location of Zhangjiang Estuary (ZJ) and Qinglan Harbour (QL) mangrove wetlands. (b,c) Sampling sites and a typical scene from ZJ mangrove forest. (d,e) Sampling sites and a typical scene from QL mangrove forest. (f) Monthly precipitation (P, mm) and monthly air temperature (T, °C) from ZJ and QL mangrove wetlands. LW: landward zone, MZ: middle zone, and SW: seaward zone.
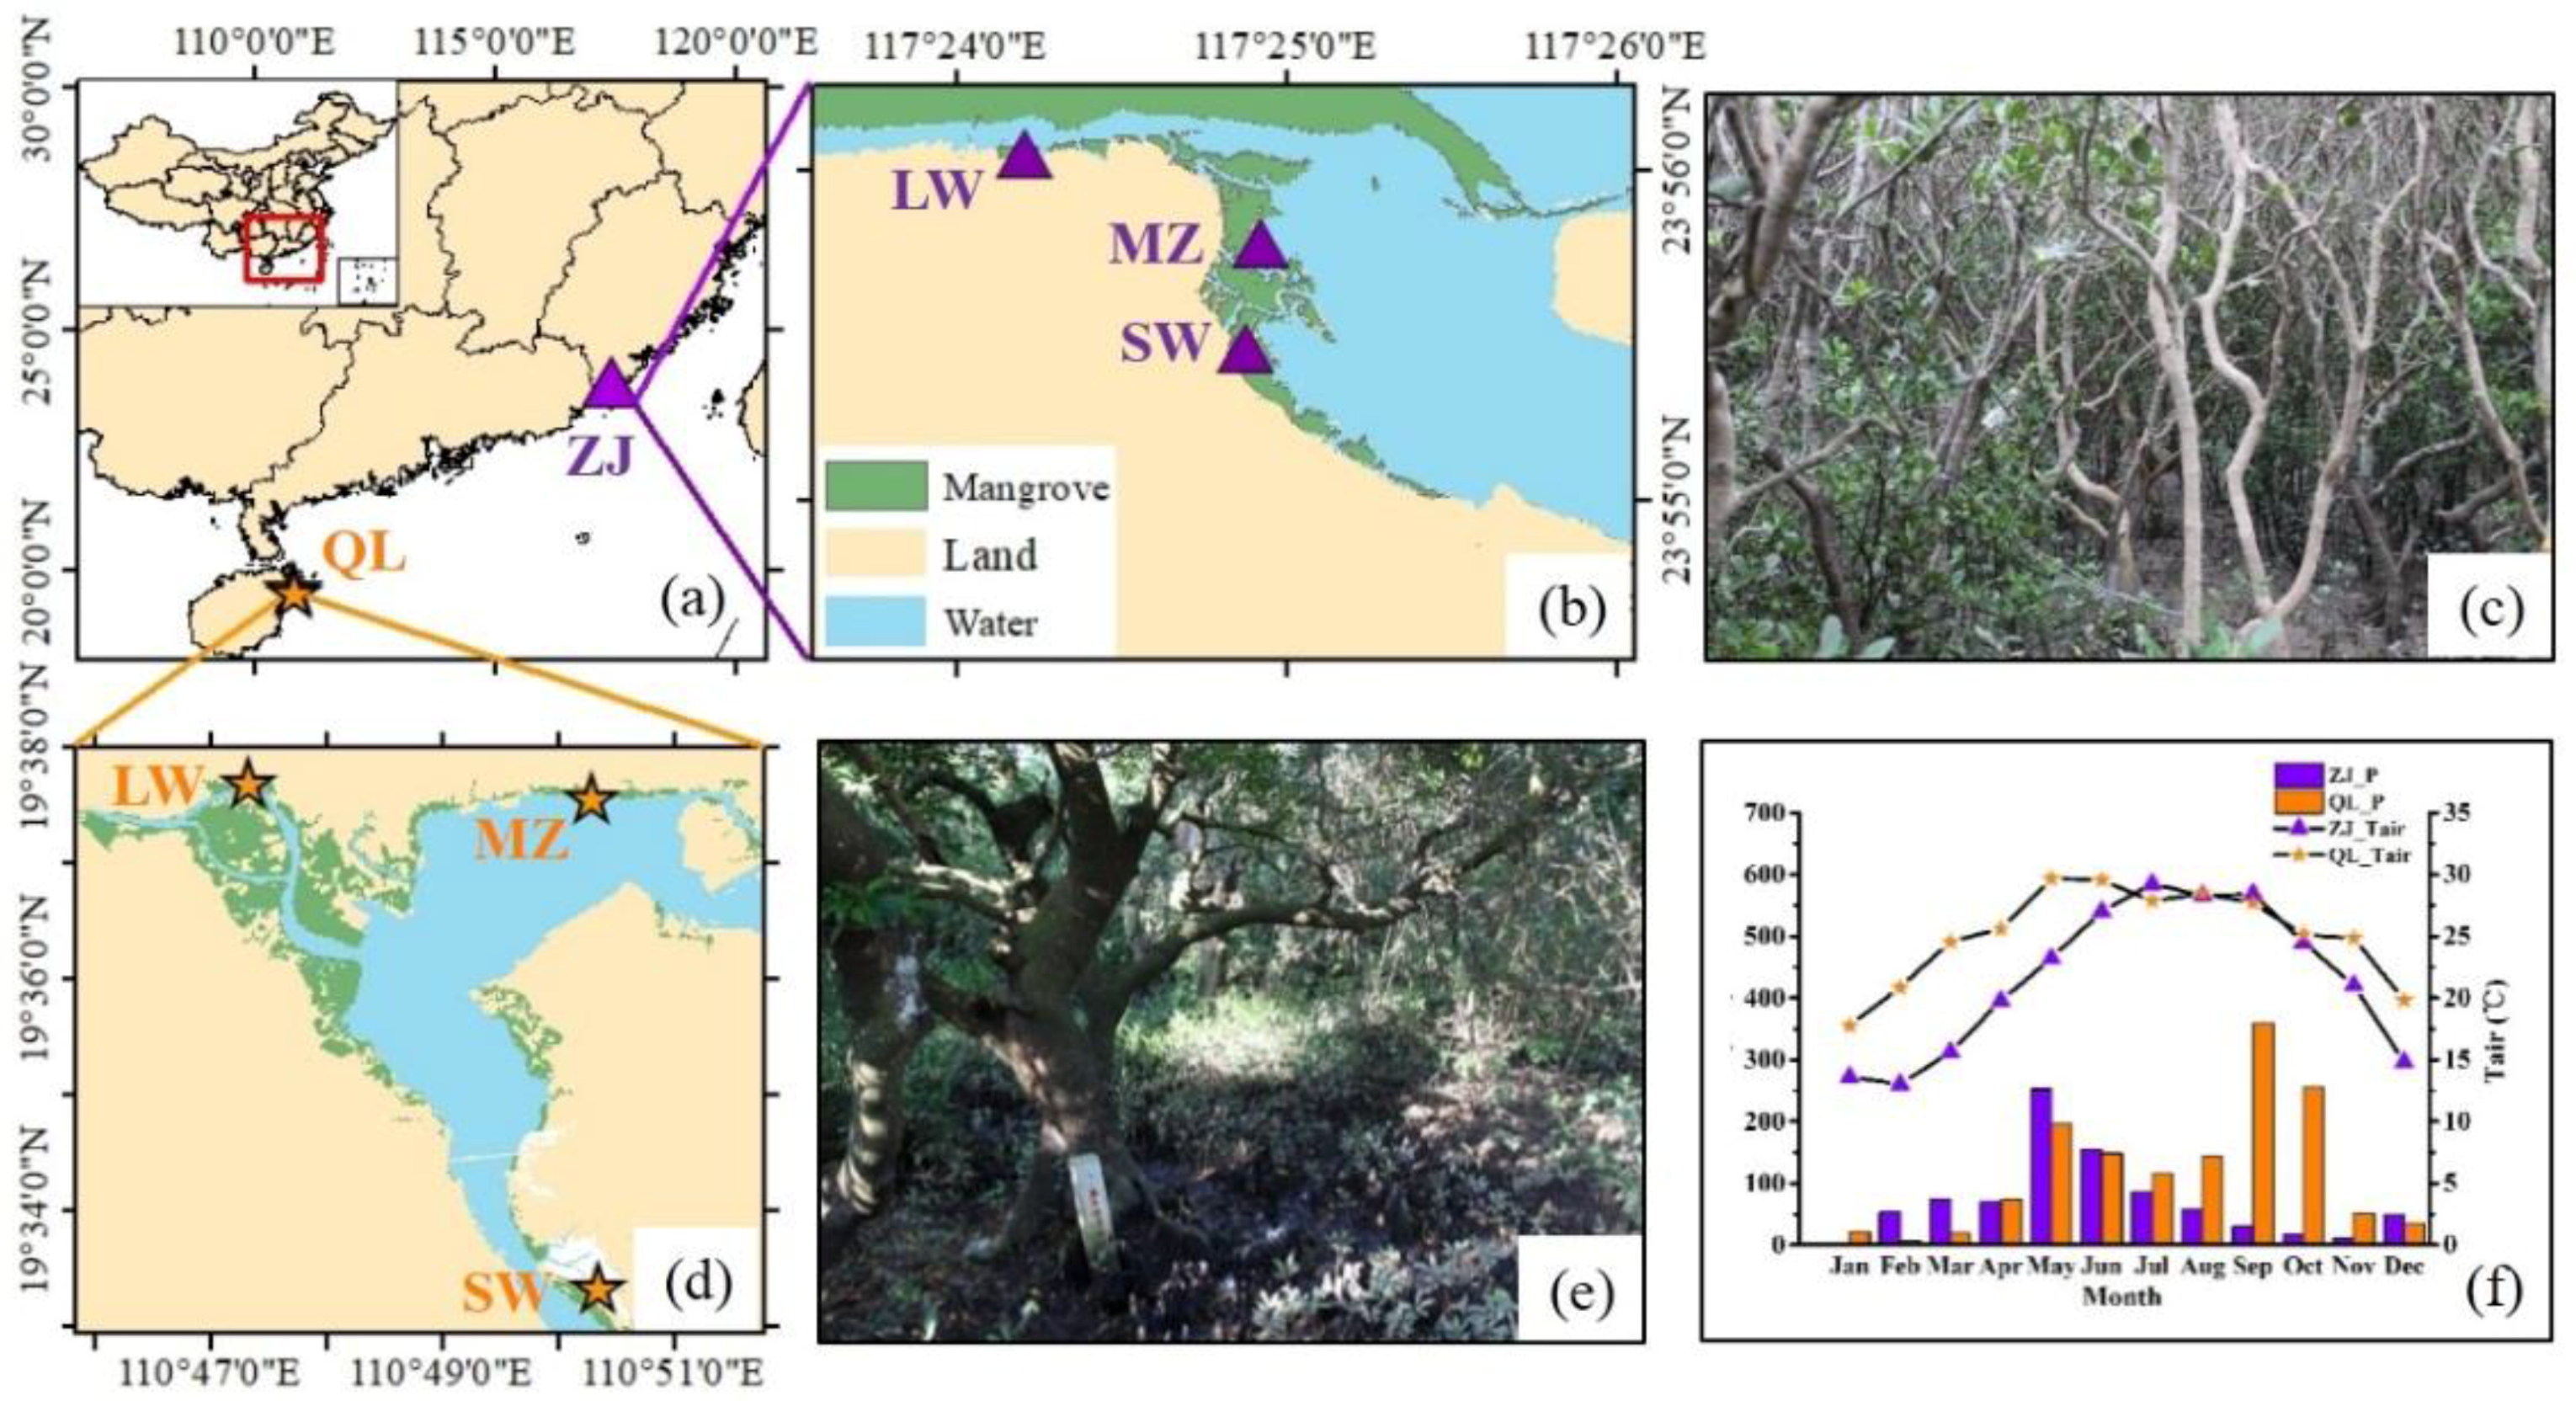
Figure 2.
CH4 and CO2 effluxes from ZJ and QL mangrove soils. (a,b) Comparison of the mean soil CH4 efflux among three tidal positions during wet and dry seasons at ZJ and QL site. (c,d) Comparison of the mean soil CO2 efflux among three tidal positions during wet and dry seasons at ZJ and QL site. Error bars represent the standard error (SE) of the means (n = 4). Different letters indicate significant differences among tidal positions for each period (wet and dry seasons) according to analysis of variance (ANOVA) test (Turkey HSD test, p < 0.05). Site abbreviations were the same as Figure 1.
Figure 3.
Comparison of CH4 efflux from undisturbed mangrove wetlands and mangroves wetlands affected by anthropogenic activities. Detailed information on the literature sources of CH4 efflux data is provided in Table S2. Nutrient concentrations and assignment of eutrophic status from mangrove wetlands are shown in Table S3.
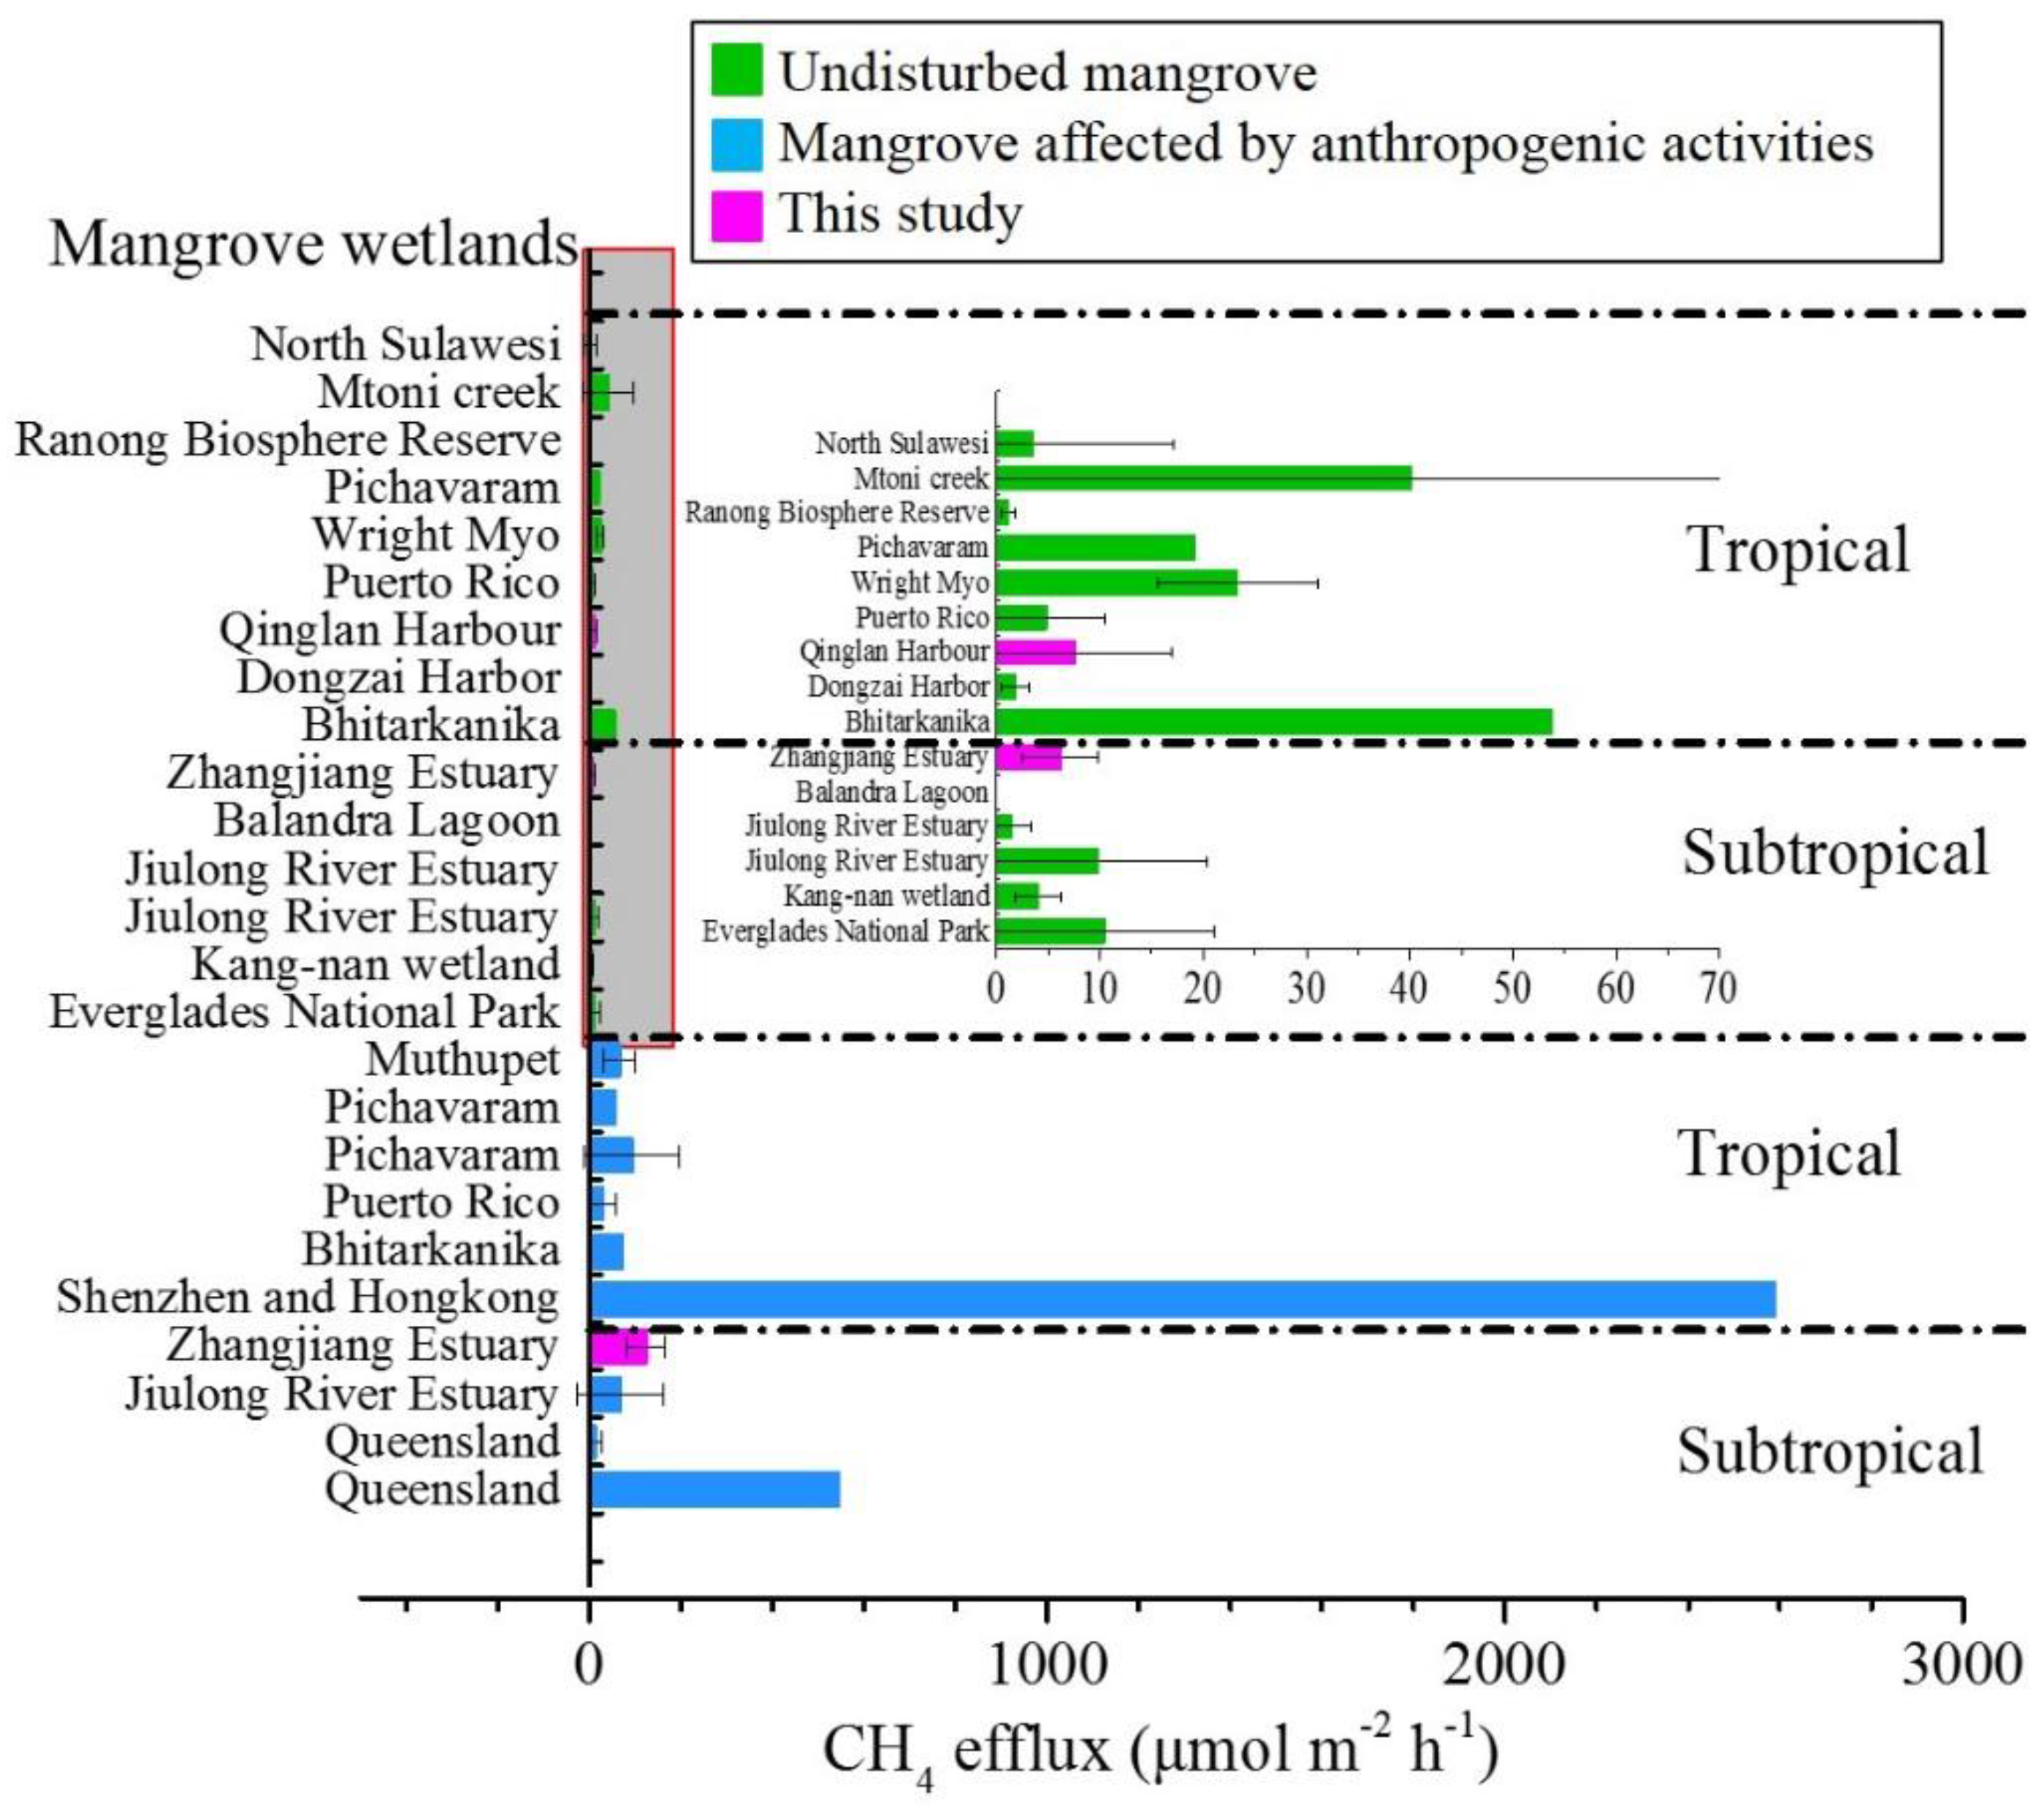
Figure 4.
CH4:CO2 effluxes ratio and CH4:CO2 warming effect ratio from ZJ and QL mangrove wetlands. (a–b) Comparison of CH4:CO2 effluxes ratio among three tidal positions during wet and dry seasons at ZJ and QL sites. (c–d) Comparison of CH4:CO2 warming effect ratio among three tidal positions during wet and dry seasons at ZJ and QL site. Site abbreviations were the same as Figure 1.


Table 1.
Key characteristics for mangrove soils at various study sites measured during wet and dry seasons.
Table 1.
Key characteristics for mangrove soils at various study sites measured during wet and dry seasons.
| Mangrove Wetland | Season | Study Site | Species | Tsoil | Salinity (ppt) | pH | Soil Moisture Content | NH4+-N (ug g−1) | NO3--N (ug g−1) | TN (%) | TC (%) | C:N Ratio |
|---|---|---|---|---|---|---|---|---|---|---|---|---|
| ZJ | Wet season | LW | KO | 27.19 ± 0.19c | 2.07 ± 0.25a | 5.46 ± 0.31a | 0.85 ± 0.15a | 9.50 ± 0.92 | 0.14 ± 0.04 | 0.15 ± 0.03a | 1.82 ± 0.18a | 12.50 ± 1.07b |
| MZ | KO | 27.74 ± 0.05c | 5.70 ± 0.66ab | 7.11 ± 0.03c | 0.89 ± 0.23a | 9.09 ± 0.88 | 0.15 ± 0.05 | 0.15 ± 0.01a | 1.36 ± 0.01a | 9.25 ± 0.35a | ||
| SW | KO | 27.42 ± 0.09c | 7.70 ± 1.45ab | 6.82 ± 0.03ab | 1.04 ± 0.45a | 0.17 ± 0.01a | 1.96 ± 0.18a | 11.44 ± 0.65ab | ||||
| Dry season | LW | KO | 17.35 ± 0.19a | 9.00 ± 1.27b | 6.23 ± 0.10b | 0.75 ± 0.07a | 0.16 ± 0.02a | 1.98 ± 0.16a | 12.29 ± 0.47b | |||
| MZ | KO | 18.47 ± 0.09b | 15.55 ± 2.56c | 7.01 ± 0.14c | 0.81 ± 0.50a | 0.14 ± 0.01a | 1.49 ± 0.09a | 10.90 ± 0.31ab | ||||
| SW | KO | |||||||||||
| QL | Wet season | LW | BS, HL | 29.00D | 12.09 ± 1.37A | 6.81 ± 0.05AB | 1.85 ± 0.25B | 8.02 ± 0.90B | 4.31 ± 0.45B | 0.73 ± 0.10B | 11.48 ± 2.00AB | 15.44 ± 0.93A |
| MZ | BS, RA | 28.90D | 17.84 ± 5.91AB | 6.62 ± 0.16A | 0.56 ± 0.12A | 3.11 ± 0.55A | 1.28 ± 0.13A | 0.24 ± 0.05A | 4.01 ± 0.66AB | 17.03 ± 0.61A | ||
| SW | Mixed | 30.50E | 25.91 ± 4.22B | 6.85 ± 0.02AB | 0.51 ± 0.01A | 3.17 ± 0.13A | 1.63 ± 0.05A | 0.08 ± 0.01A | 4.48 ± 0.12AB | 57.81 ± 7.33B | ||
| Dry season | LW | KO | 25.18 ± 0.07B | 11.12 ± 1.21A | 7.30 ± 0.11BC | 2.08 ± 0.39B | 8.14 ± 1.10B | 3.55 ± 0.35B | 0.79 ± 0.11B | 12.41 ± 2.58B | 15.10 ± 0.89A | |
| MZ | KO | 23.34 ± 0.03A | 15.60 ± 0.67AB | 6.76 ± 0.16A | 0.60 ± 0.14A | 2.26 ± 0.75A | 1.42 ± 0.30A | 0.19 ± 0.05A | 3.52 ± 0.88A | 19.47 ± 0.74B | ||
| SW | KO | 25.45 ± 0.01C | 19.90 ± 0.30AB | 7.43 ± 0.14C | 0.44 ± 0.06A | 2.26 ± 0.33A | 1.31 ± 0.01A | 0.07 ± 0.01A | 4.75 ± 0.16AB | 74.26 ± 7.84C |
ZJ: Zhangjiang Estuary Mangrove National Natural Reserve; QL: Qinglan Harbour Mangrove Provincial Natural Reserve; LW: Landward zone; MZ: Middle zone; SW: Seaward zone; KO: Kandelia obovata Sheue, Liu & Yong (red mangrove) community; BS: Bruguiera sexangula (Lour.) Poir. (upriver orange mangrove) community; HL: Heritiera littoralis Aiton (looking-glass mangrove) community; RA: Rhizophora apiculata Blume (red mangrove) community; Mixed: Mixed species community. Mean and standard error (SE) of four replicates are shown (n = 4). Different letters indicated significant differences among different sampling sites according to analysis of variance (ANOVA) test (p < 0.05).
© 2018 by the authors. Licensee MDPI, Basel, Switzerland. This article is an open access article distributed under the terms and conditions of the Creative Commons Attribution (CC BY) license (http://creativecommons.org/licenses/by/4.0/).
Share and Cite
MDPI and ACS Style
Zheng, X.; Guo, J.; Song, W.; Feng, J.; Lin, G. Methane Emission from Mangrove Wetland Soils Is Marginal but Can Be Stimulated Significantly by Anthropogenic Activities. Forests 2018, 9, 738. https://doi.org/10.3390/f9120738
AMA Style
Zheng X, Guo J, Song W, Feng J, Lin G. Methane Emission from Mangrove Wetland Soils Is Marginal but Can Be Stimulated Significantly by Anthropogenic Activities. Forests. 2018; 9(12):738. https://doi.org/10.3390/f9120738
Chicago/Turabian StyleZheng, Xiawan, Jiemin Guo, Weimin Song, Jianxiang Feng, and Guanghui Lin. 2018. "Methane Emission from Mangrove Wetland Soils Is Marginal but Can Be Stimulated Significantly by Anthropogenic Activities" Forests 9, no. 12: 738. https://doi.org/10.3390/f9120738
Note that from the first issue of 2016, this journal uses article numbers instead of page numbers. See further details here.